Details of Host Protein-DME Interaction (HOSPPI)
| General Information of Drug-Metabolizing Enzyme (DME ID: DME0011) | |||||
|---|---|---|---|---|---|
| DME Name | Glutathione S-transferase alpha-1 (GSTA1), Homo sapiens | DME Info | |||
| UniProt ID | |||||
| EC Number | EC: 2.5.1.18 (Click to Show/Hide the Complete EC Tree) | ||||
| Lineage | Species: Homo sapiens (Click to Show/Hide the Complete Species Lineage) | ||||
| Interactome | |||||
| Disease Specific Interactions between Host Protein and DME (HOSPPI) | |||||
|---|---|---|---|---|---|
| ICD Disease Classification Healthy | |||||
| ICD-11: Healthy | Click to Show/Hide the Full List of HOSPPI: 1 HOSPPI | ||||
| Transcription-factor regulation | |||||
| NFE2-related factor 2 (NFE2L2) | Health | Activation | |||
| Uniprot ID | |||||
| Interaction Name | NFE2L2-GSTA1 interaction | [1] | |||
| Studied Cell Lines | HEK 293T cell line | ||||
| Ensembl ID | |||||
| Description | NFE2-related factor 2 (NFE2L2) is reported to activate the transcription of GSTA1 gene, which leads to an increased expression of the drug-metabolizing enzyme Glutathione S-transferase alpha-1. As a result, the interaction between NFE2L2 and GSTA1 can activate the drug-metabolizing process of Glutathione S-transferase alpha-1. | ||||
| ICD Disease Classification 02 Neoplasms | |||||
| ICD-11: 2A00 Brain cancer | Click to Show/Hide the Full List of HOSPPI: 11 HOSPPI | ||||
| DNA methylation | |||||
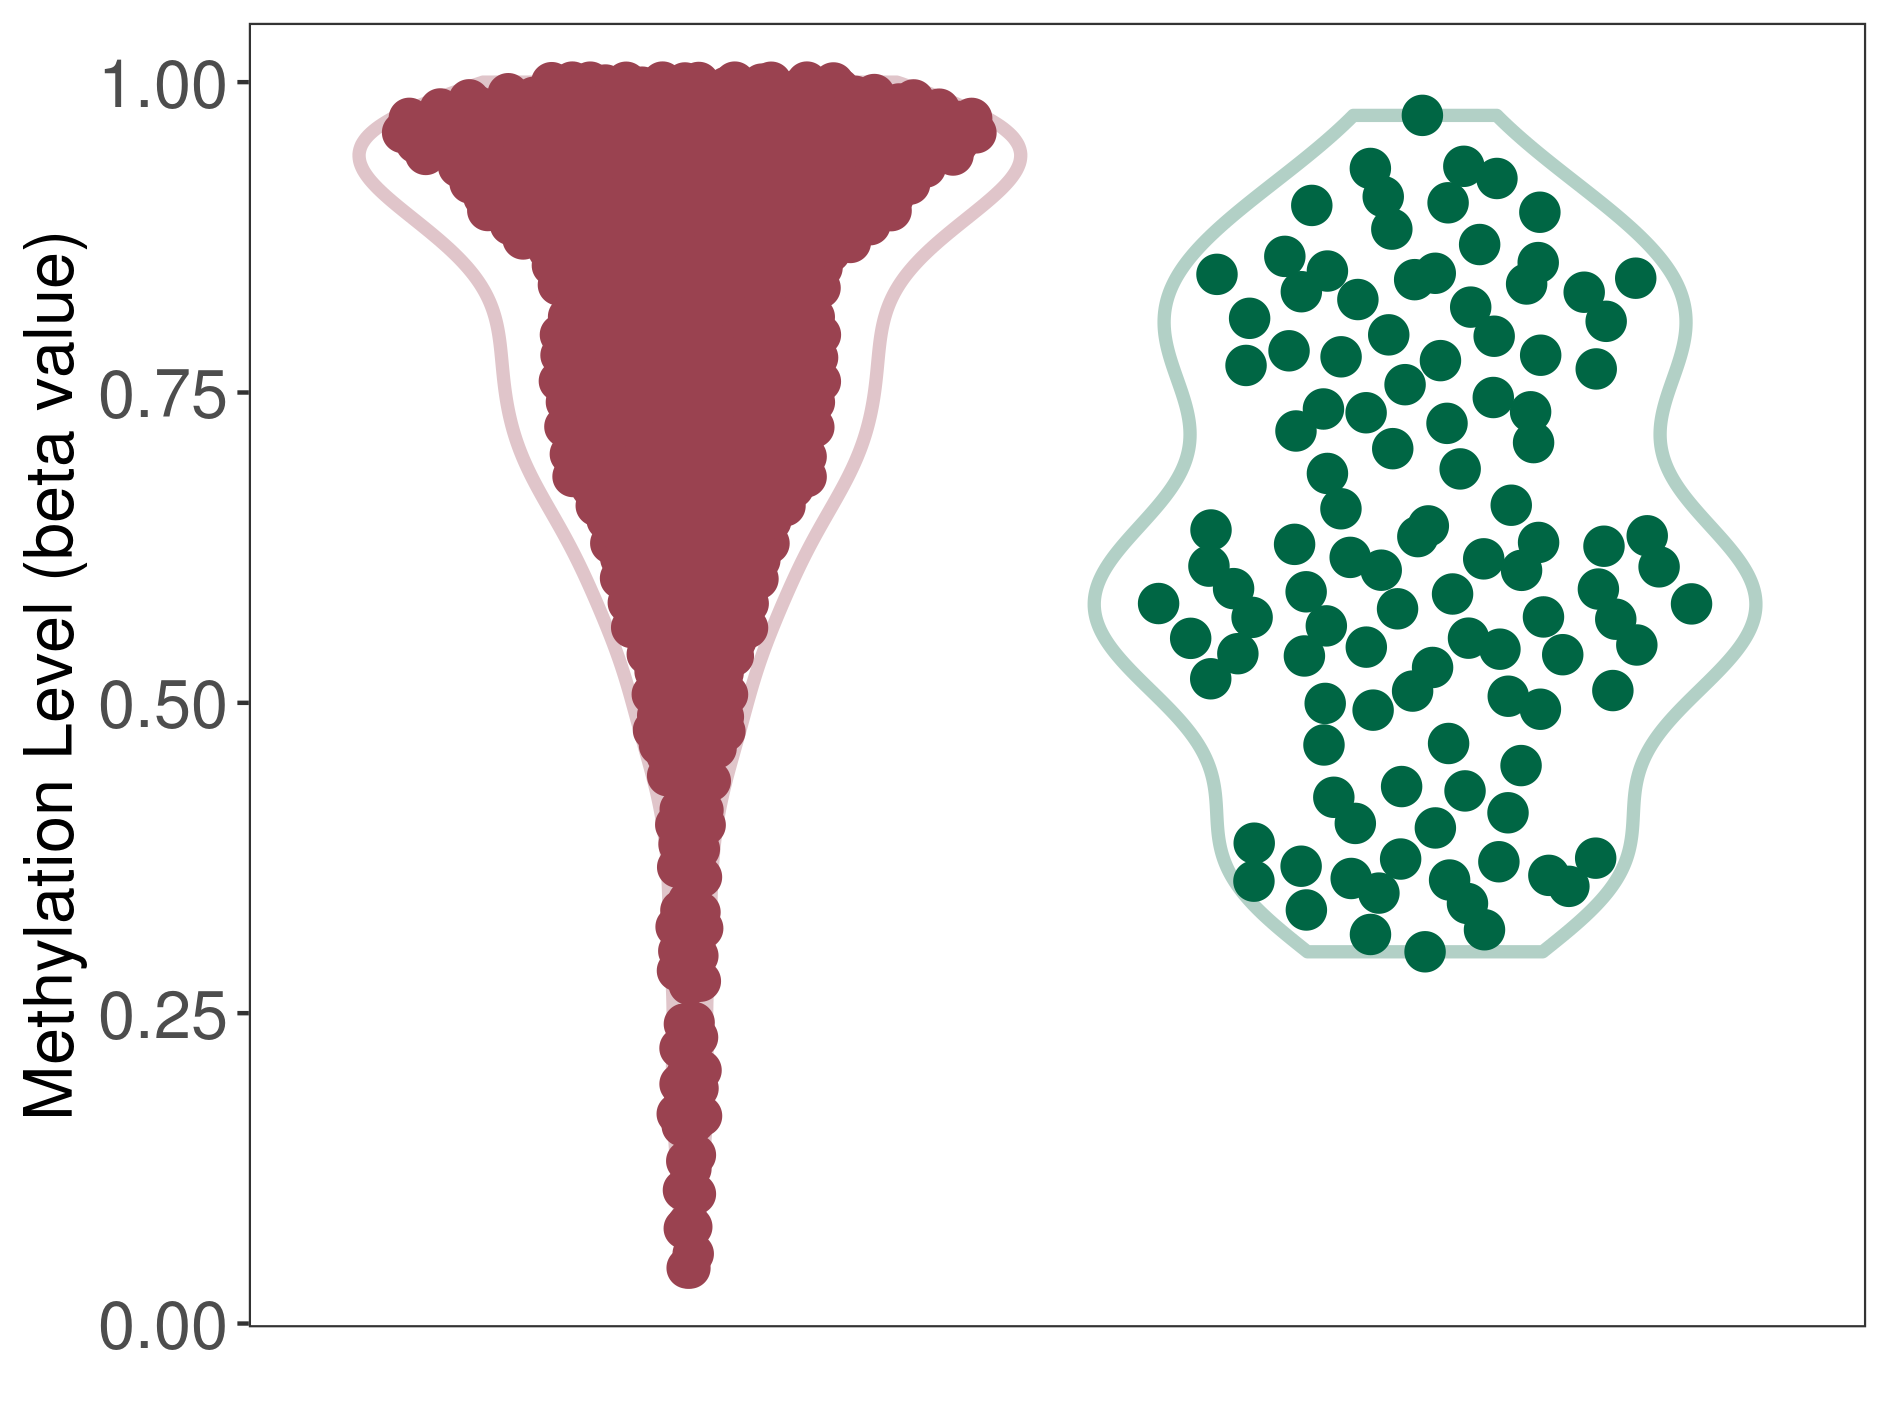
| DNA methyltransferase (DNMT) | Medulloblastoma | Moderate hypermethylation | |||
| Interaction Name | DNMT-GSTA1 interaction | ||||
| The Methylation Level of Disease Section Compare with the Healthy Individual Tissue | Moderate hypermethylation p-value: 3.22E-14; delta-beta: 2.20E-01 | ||||
| Description | DNA methyltransferase (DNMT) is reported to moderatly hyper-methylate the GSTA1 gene, which leads to a moderatly decreased expression of the drug-metabolizing enzyme Glutathione S-transferase alpha-1. As a result, the interaction between DNMT and GSTA1 can moderatly affect the drug-metabolizing process of Glutathione S-transferase alpha-1. | ||||
|
DME methylation in the diseased tissue of patients
DME methylation in the normal tissue of healthy individuals
|
|||||
| Violin Diagram of DME Disease-specific Methylation Level |
|
Click to View the Clearer Original Diagram | |||
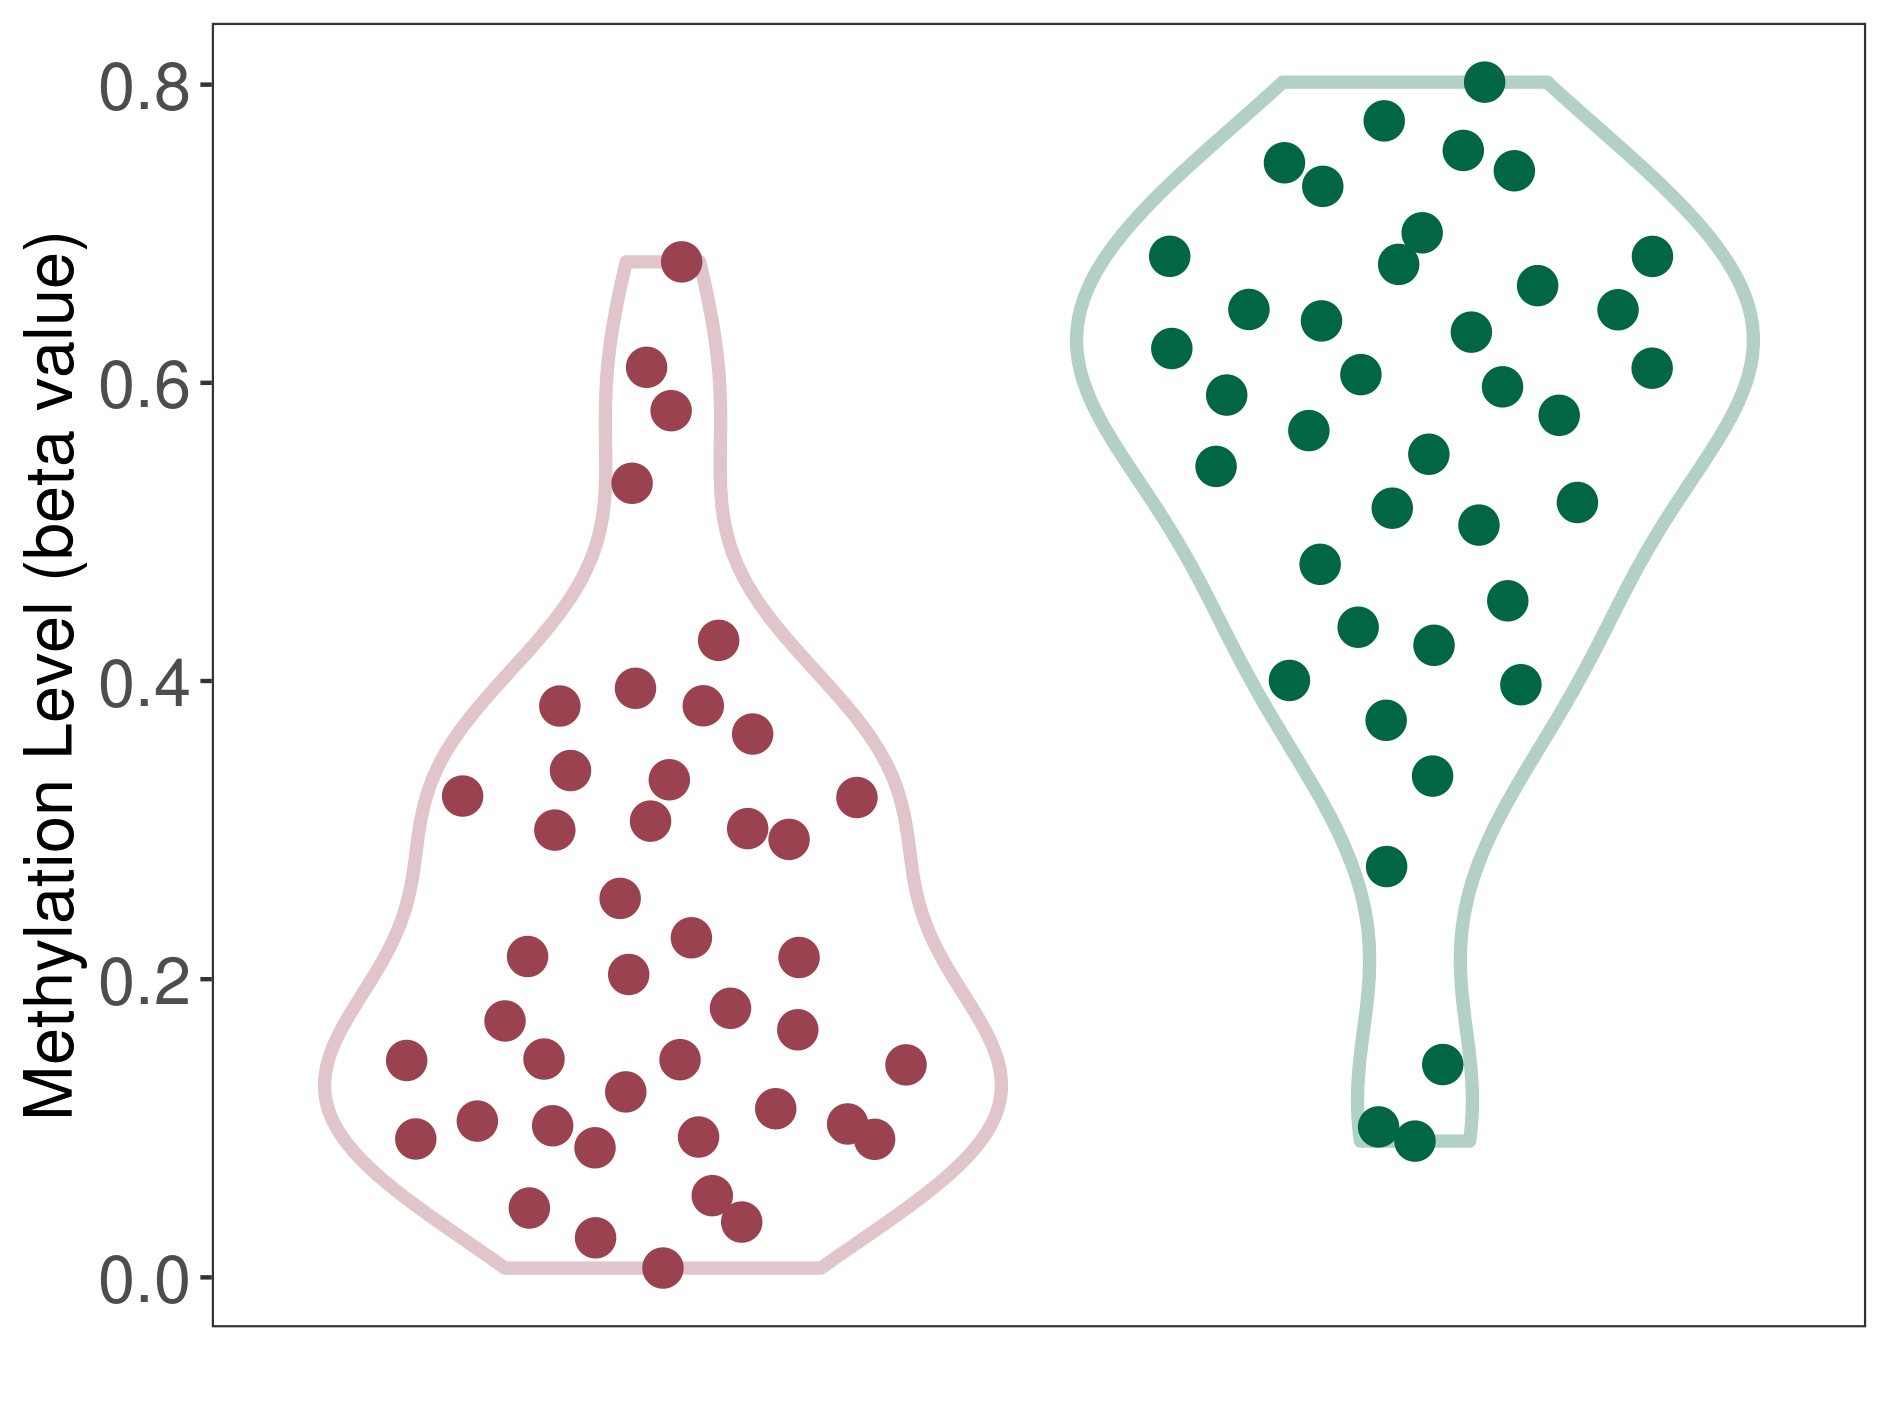
| DNA methyltransferase (DNMT) | Brain neuroblastoma | Significant hypomethylation | |||
| Interaction Name | DNMT-GSTA1 interaction | ||||
| The Methylation Level of Disease Section Compare with the Healthy Individual Tissue | Significant hypomethylation p-value: 6.96E-12; delta-beta: -3.89E-01 | ||||
| Description | DNA methyltransferase (DNMT) is reported to significantly hypo-methylate the GSTA1 gene, which leads to a significantly increased expression of the drug-metabolizing enzyme Glutathione S-transferase alpha-1. As a result, the interaction between DNMT and GSTA1 can significantly affect the drug-metabolizing process of Glutathione S-transferase alpha-1. | ||||
|
DME methylation in the diseased tissue of patients
DME methylation in the normal tissue of healthy individuals
|
|||||
| Violin Diagram of DME Disease-specific Methylation Level |
|
Click to View the Clearer Original Diagram | |||
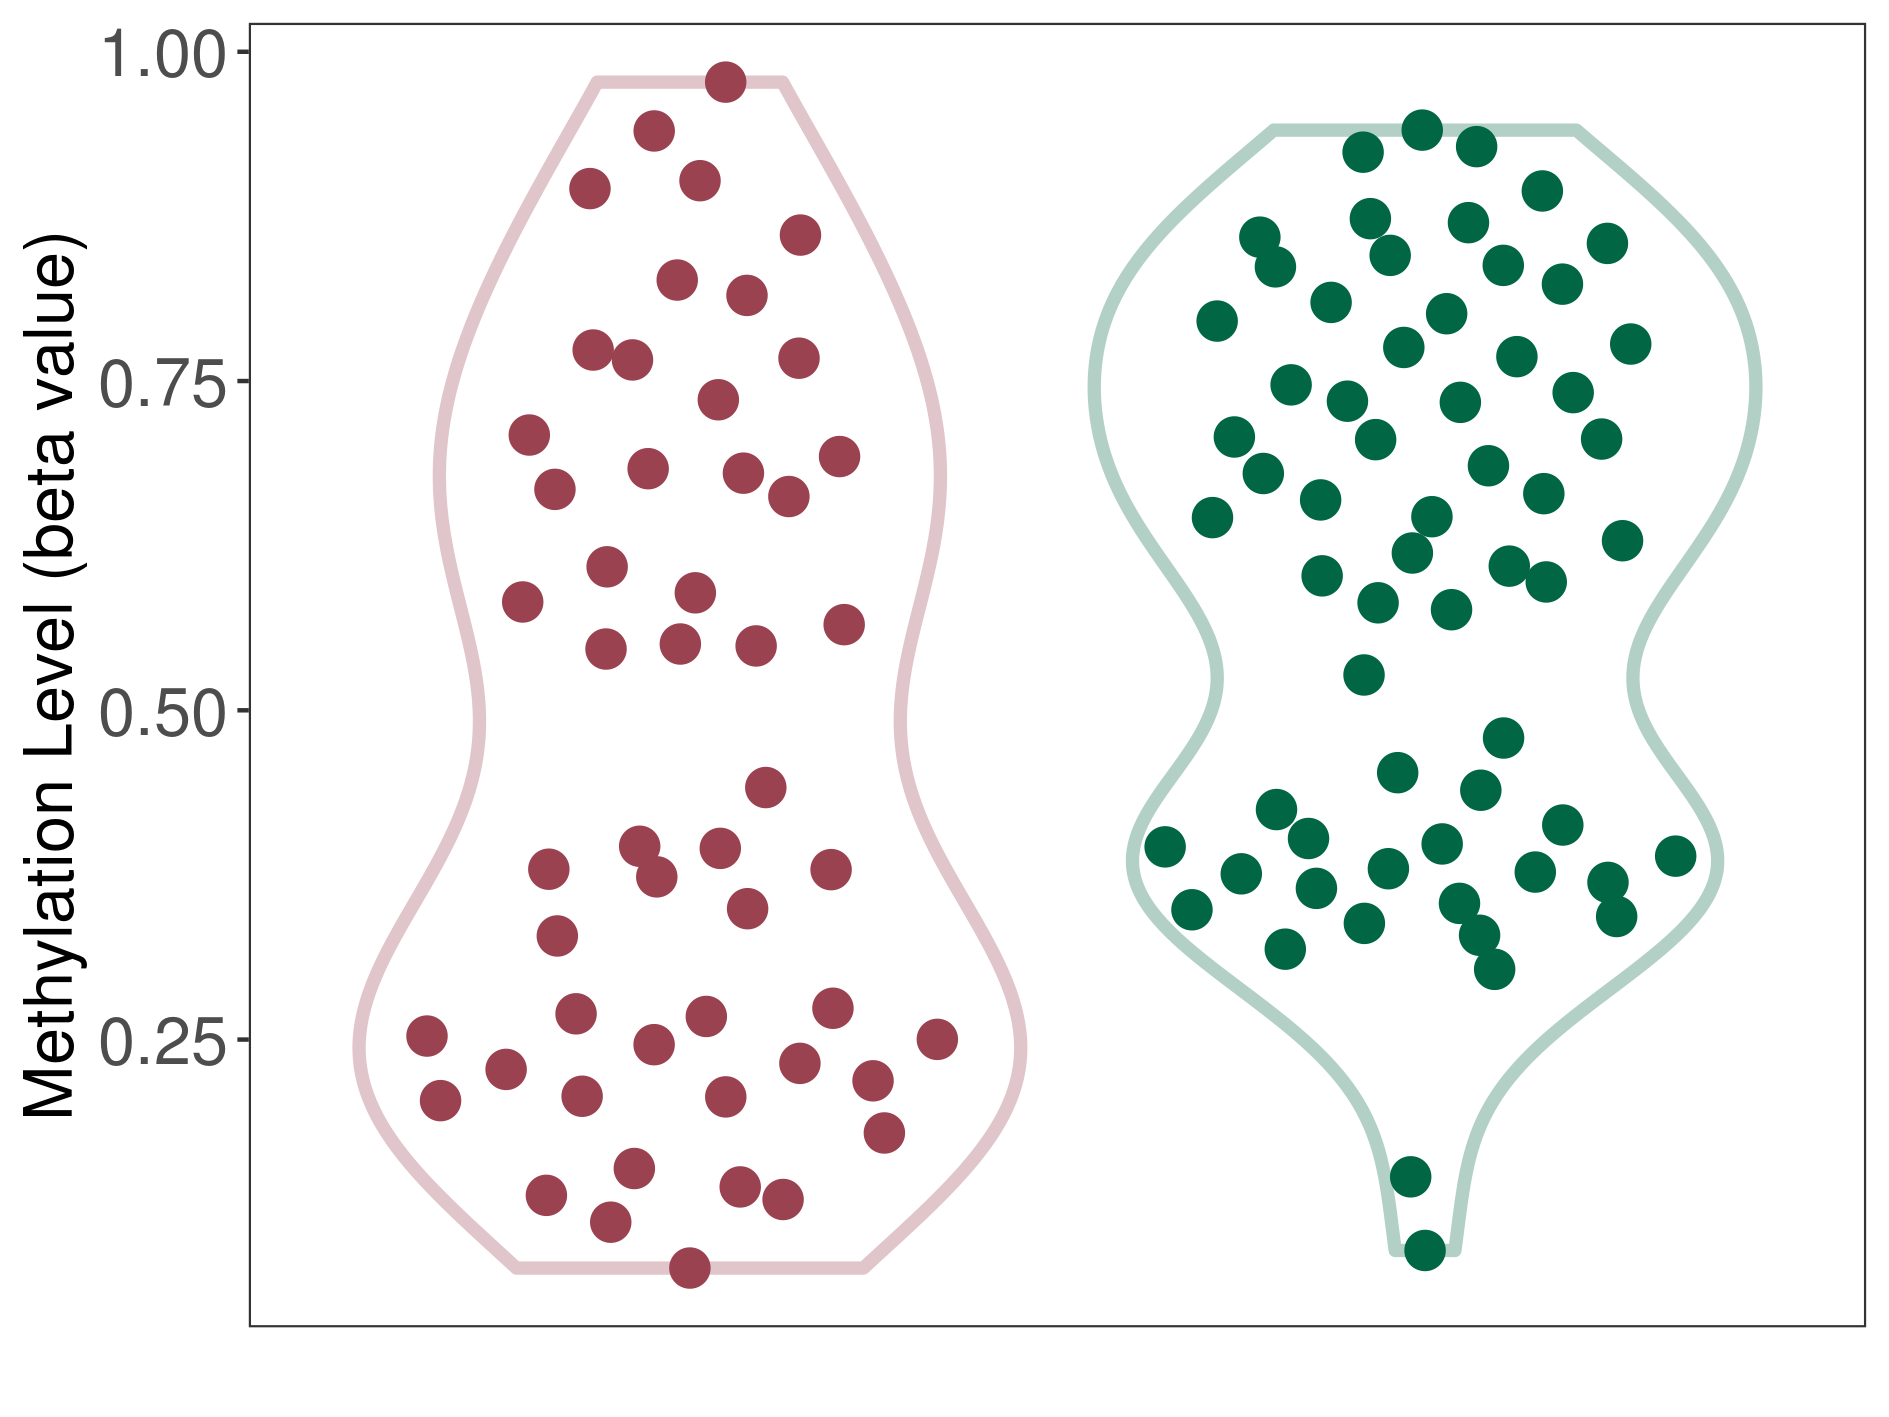
| DNA methyltransferase (DNMT) | Brain neuroepithelial tumour | Moderate hypomethylation | |||
| Interaction Name | DNMT-GSTA1 interaction | ||||
| The Methylation Level of Disease Section Compare with the Healthy Individual Tissue | Moderate hypomethylation p-value: 6.66E-03; delta-beta: -2.41E-01 | ||||
| Description | DNA methyltransferase (DNMT) is reported to moderatly hypo-methylate the GSTA1 gene, which leads to a moderatly increased expression of the drug-metabolizing enzyme Glutathione S-transferase alpha-1. As a result, the interaction between DNMT and GSTA1 can moderatly affect the drug-metabolizing process of Glutathione S-transferase alpha-1. | ||||
|
DME methylation in the diseased tissue of patients
DME methylation in the normal tissue of healthy individuals
|
|||||
| Violin Diagram of DME Disease-specific Methylation Level |
|
Click to View the Clearer Original Diagram | |||
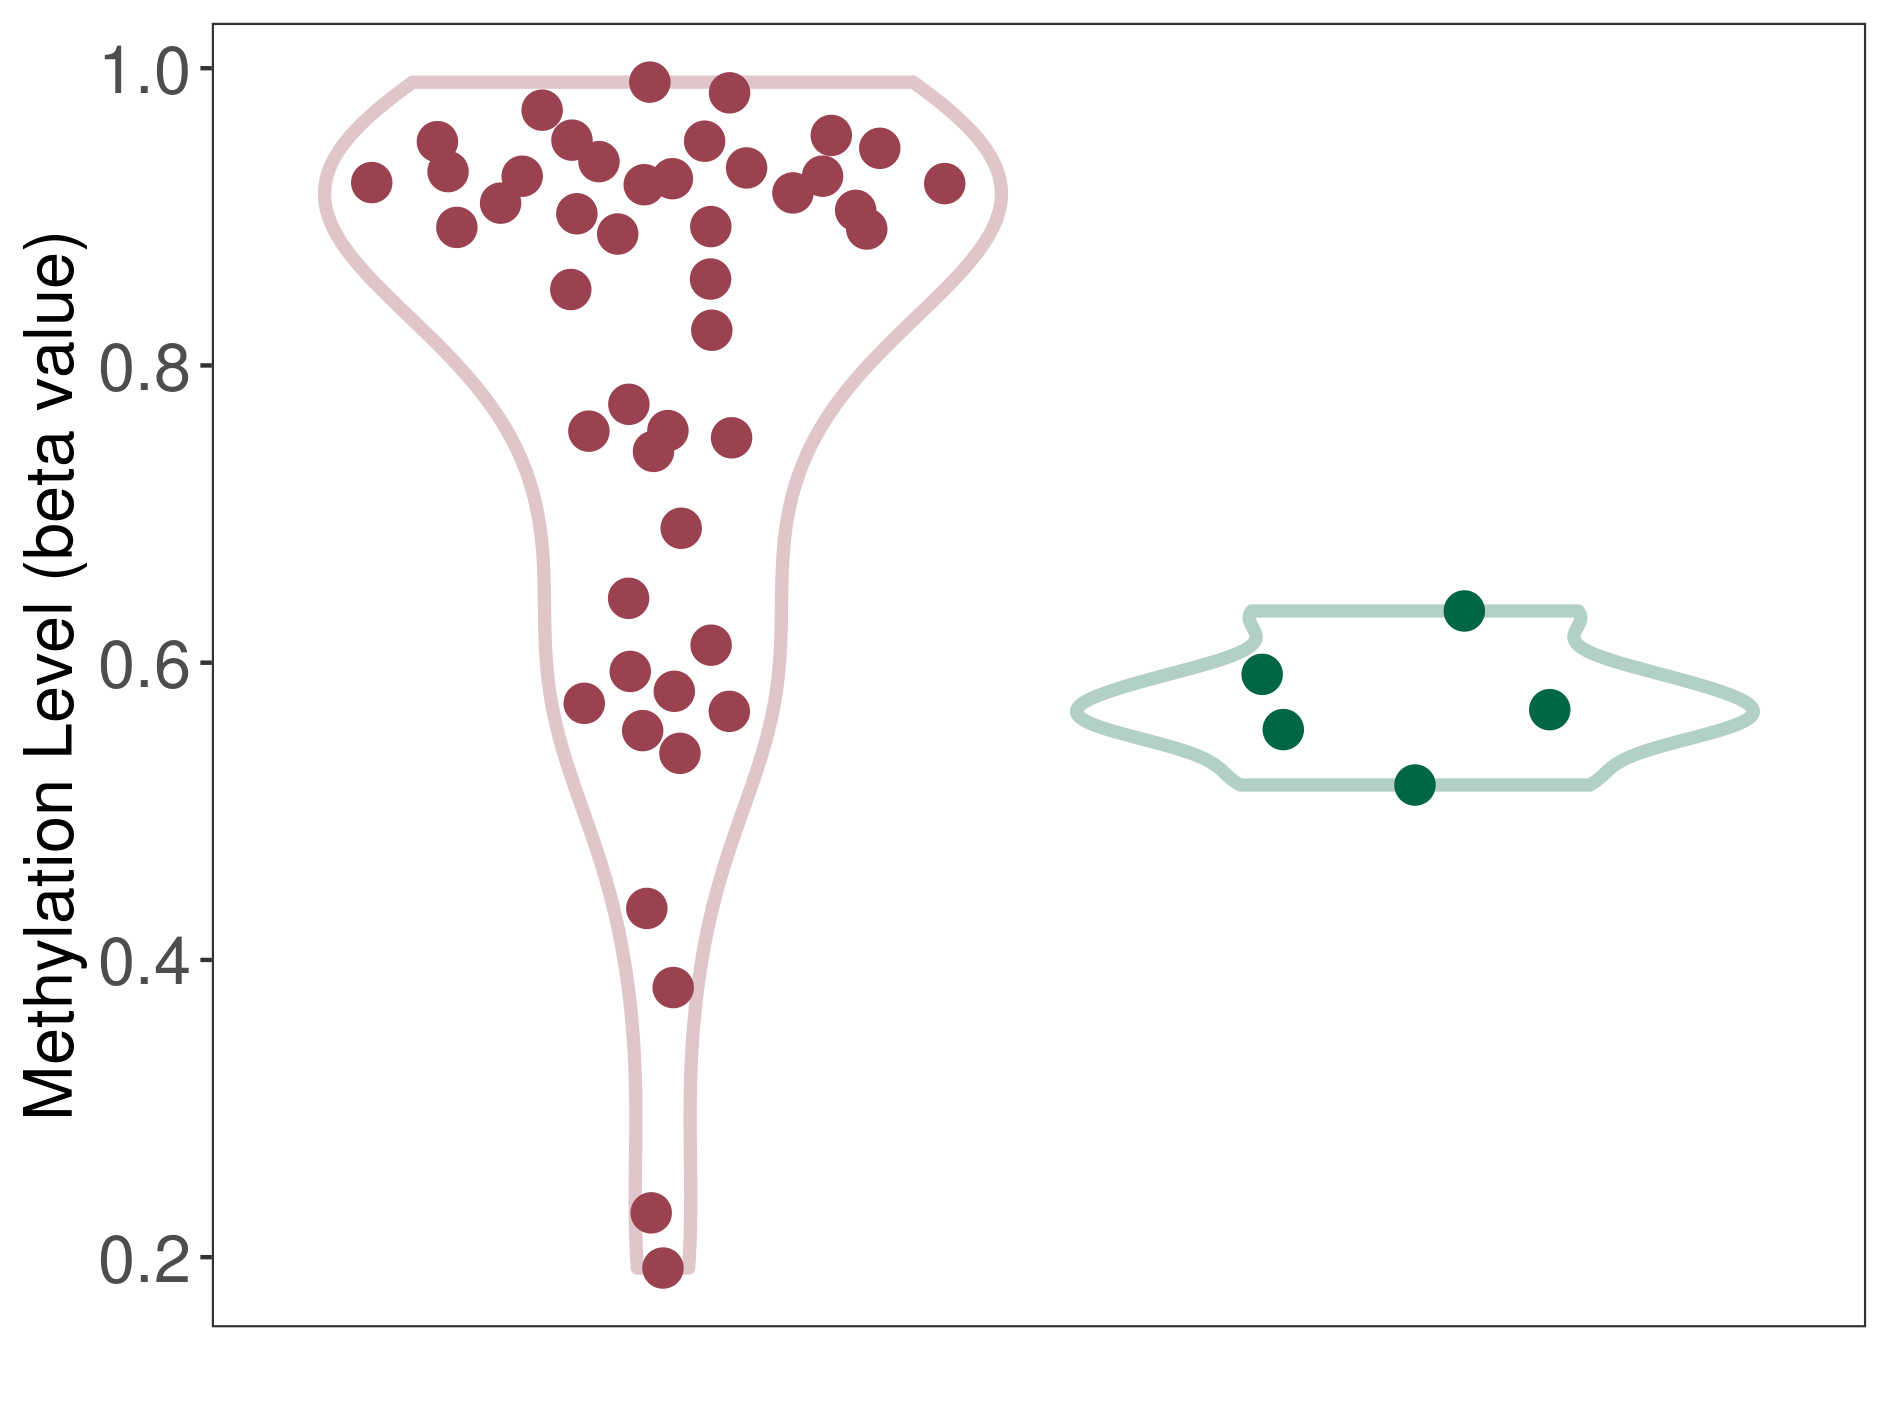
| DNA methyltransferase (DNMT) | Oligodendroglial tumour | Significant hypermethylation | |||
| Interaction Name | DNMT-GSTA1 interaction | ||||
| The Methylation Level of Disease Section Compare with the Healthy Individual Tissue | Significant hypermethylation p-value: 1.57E-06; delta-beta: 3.24E-01 | ||||
| Description | DNA methyltransferase (DNMT) is reported to significantly hyper-methylate the GSTA1 gene, which leads to a significantly decreased expression of the drug-metabolizing enzyme Glutathione S-transferase alpha-1. As a result, the interaction between DNMT and GSTA1 can significantly affect the drug-metabolizing process of Glutathione S-transferase alpha-1. | ||||
|
DME methylation in the diseased tissue of patients
DME methylation in the normal tissue of healthy individuals
|
|||||
| Violin Diagram of DME Disease-specific Methylation Level |
|
Click to View the Clearer Original Diagram | |||
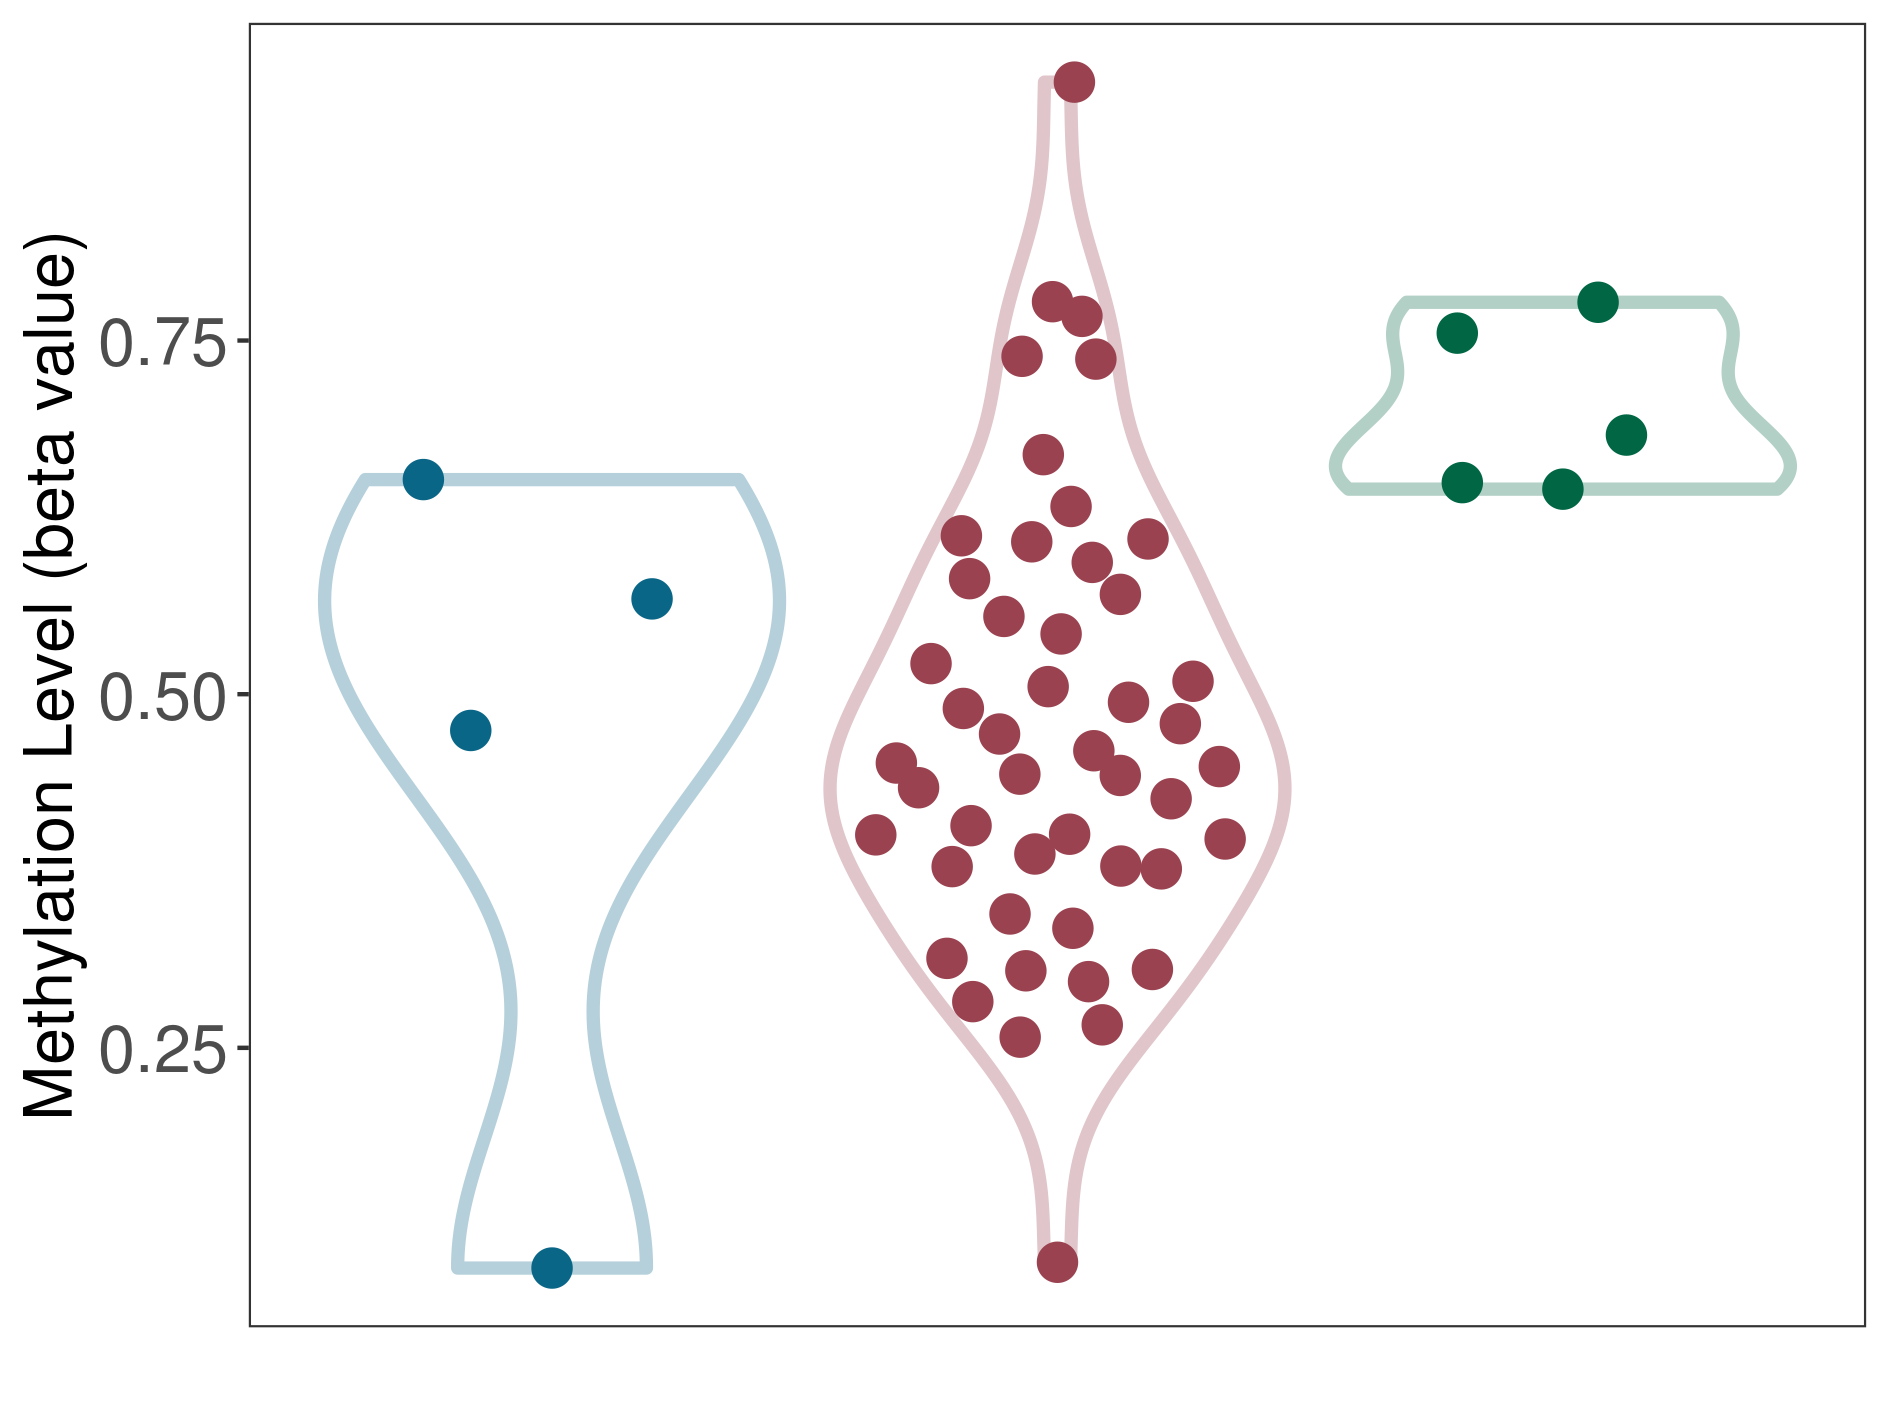
| DNA methyltransferase (DNMT) | Vestibular melanotic schwannoma | Moderate hypomethylation | |||
| Interaction Name | DNMT-GSTA1 interaction | ||||
| The Methylation Level of Disease Section Compare with the Healthy Individual Tissue | Moderate hypomethylation p-value: 5.03E-05; delta-beta: -2.32E-01 | ||||
| Description | DNA methyltransferase (DNMT) is reported to moderatly hypo-methylate the GSTA1 gene, which leads to a moderatly increased expression of the drug-metabolizing enzyme Glutathione S-transferase alpha-1. As a result, the interaction between DNMT and GSTA1 can moderatly affect the drug-metabolizing process of Glutathione S-transferase alpha-1. | ||||
|
DME methylation in the diseased tissue of patients
DME methylation in the normal tissue adjacent to the diseased tissue of patients
DME methylation in the normal tissue of healthy individuals
|
|||||
| Violin Diagram of DME Disease-specific Methylation Level |
|
Click to View the Clearer Original Diagram | |||
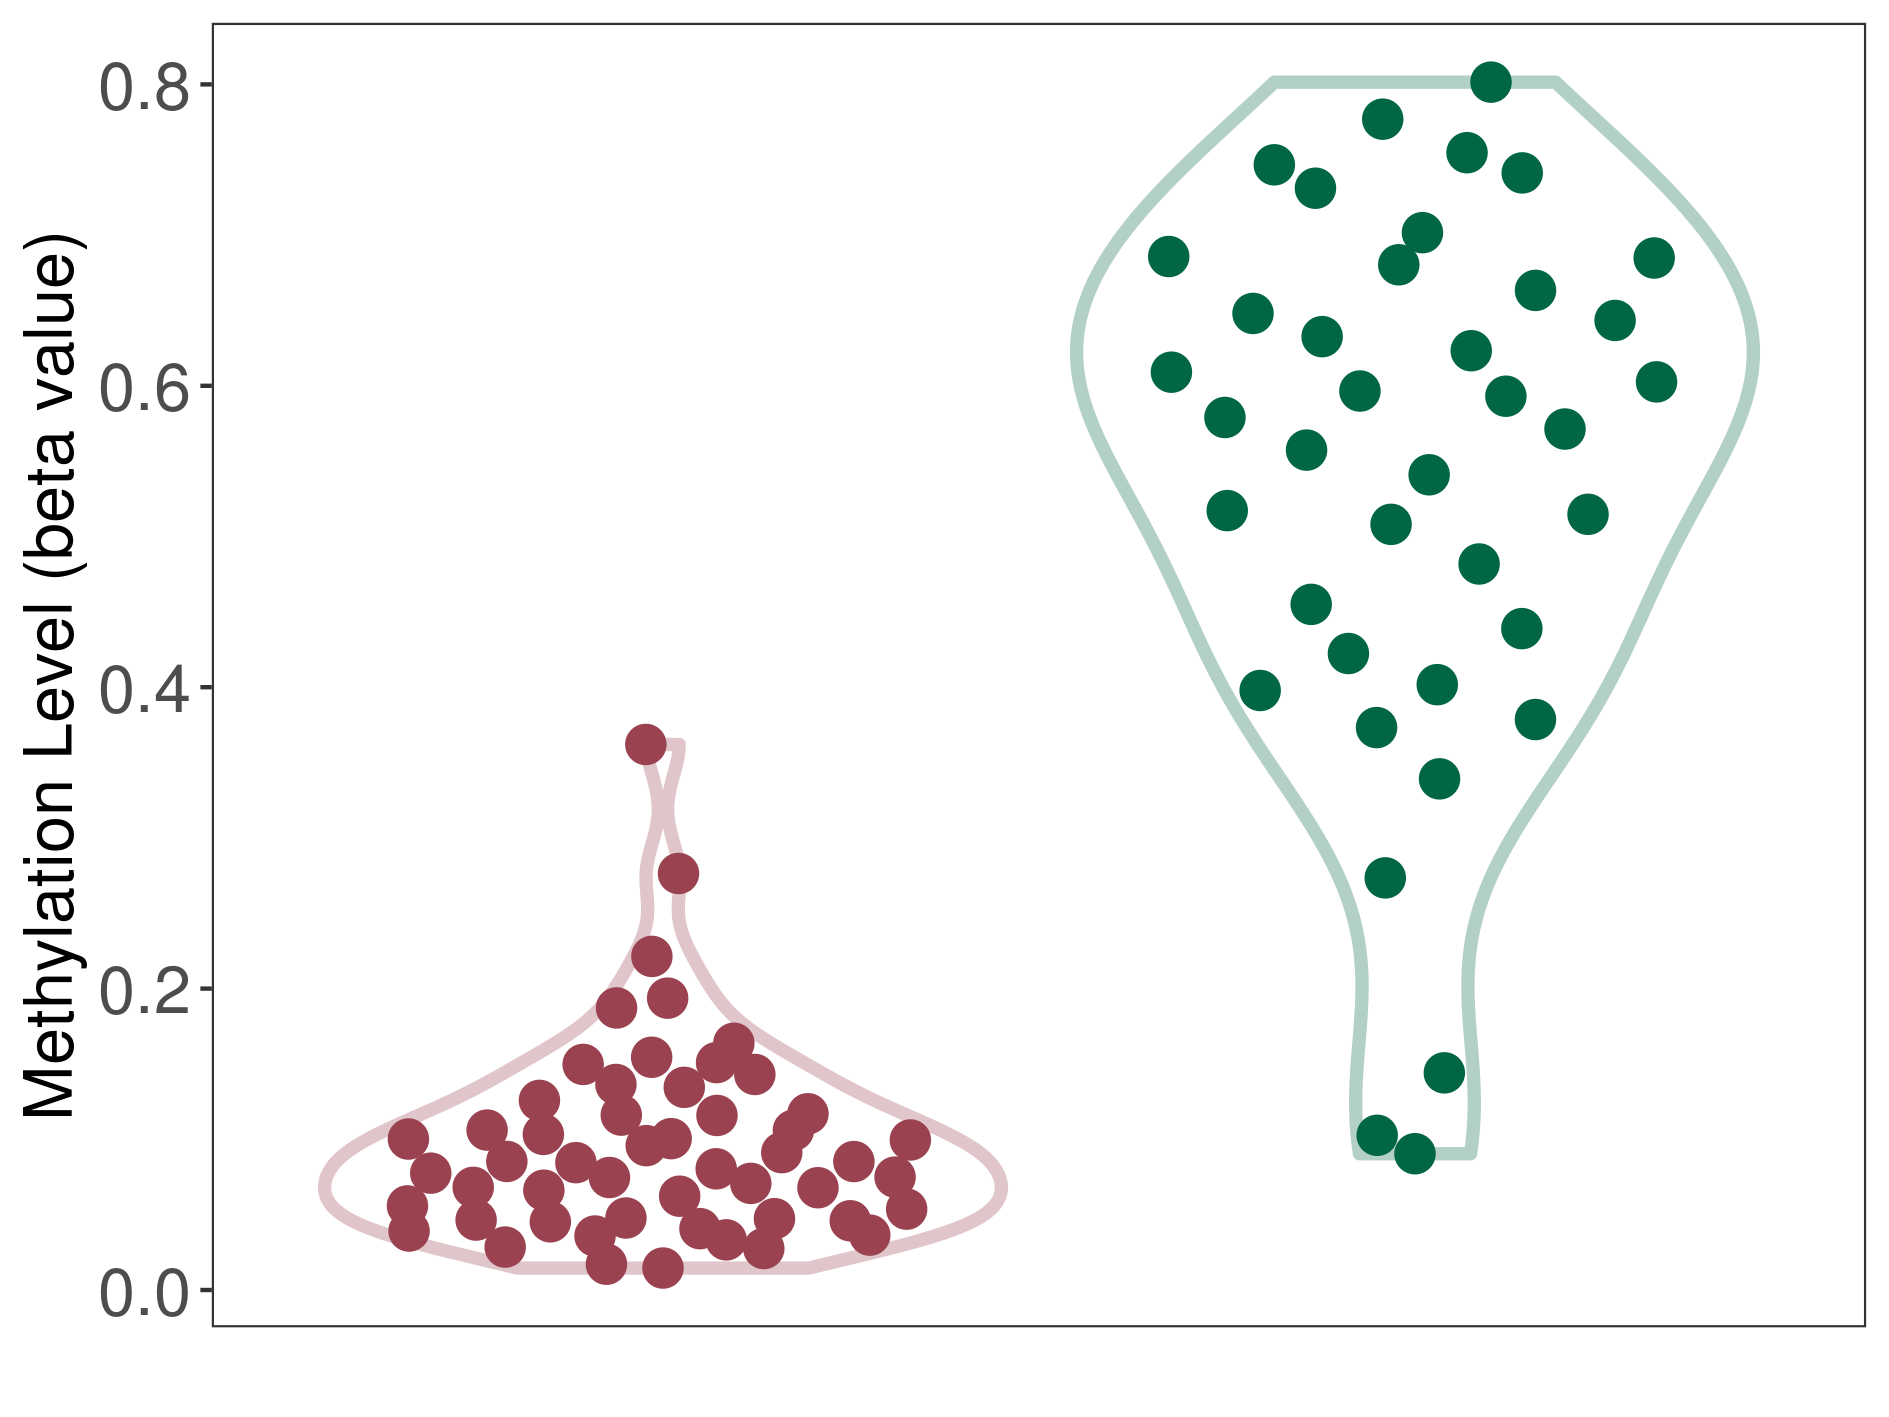
| DNA methyltransferase (DNMT) | Multilayered rosettes embryonal tumour | Significant hypomethylation | |||
| Interaction Name | DNMT-GSTA1 interaction | ||||
| The Methylation Level of Disease Section Compare with the Healthy Individual Tissue | Significant hypomethylation p-value: 9.73E-19; delta-beta: -4.94E-01 | ||||
| Description | DNA methyltransferase (DNMT) is reported to significantly hypo-methylate the GSTA1 gene, which leads to a significantly increased expression of the drug-metabolizing enzyme Glutathione S-transferase alpha-1. As a result, the interaction between DNMT and GSTA1 can significantly affect the drug-metabolizing process of Glutathione S-transferase alpha-1. | ||||
|
DME methylation in the diseased tissue of patients
DME methylation in the normal tissue of healthy individuals
|
|||||
| Violin Diagram of DME Disease-specific Methylation Level |
|
Click to View the Clearer Original Diagram | |||
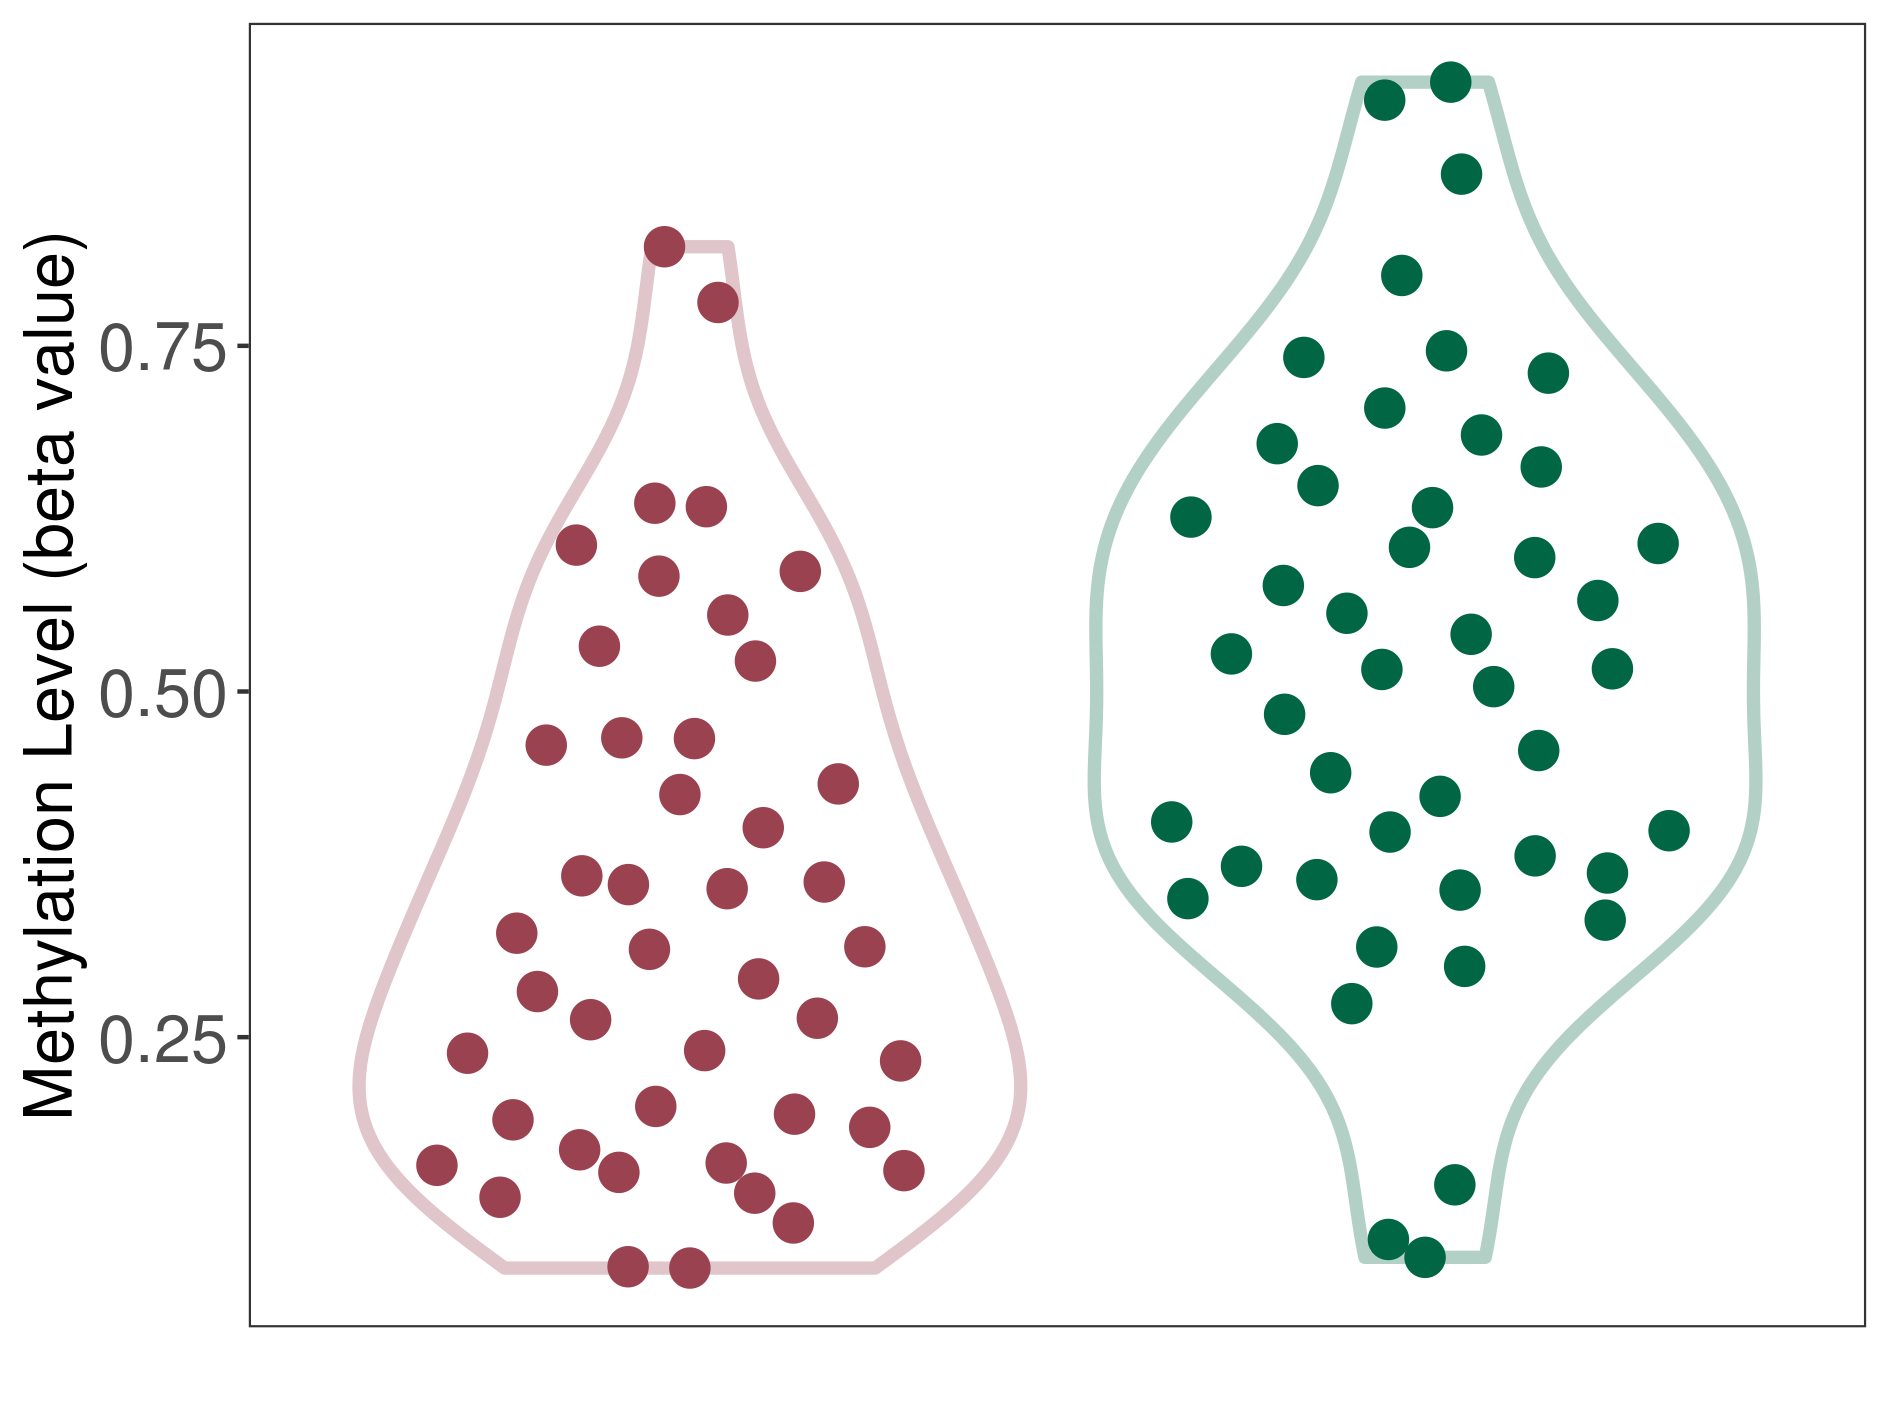
| DNA methyltransferase (DNMT) | Myxopapillary ependymoma | Moderate hypomethylation | |||
| Interaction Name | DNMT-GSTA1 interaction | ||||
| The Methylation Level of Disease Section Compare with the Healthy Individual Tissue | Moderate hypomethylation p-value: 7.97E-05; delta-beta: -2.02E-01 | ||||
| Description | DNA methyltransferase (DNMT) is reported to moderatly hypo-methylate the GSTA1 gene, which leads to a moderatly increased expression of the drug-metabolizing enzyme Glutathione S-transferase alpha-1. As a result, the interaction between DNMT and GSTA1 can moderatly affect the drug-metabolizing process of Glutathione S-transferase alpha-1. | ||||
|
DME methylation in the diseased tissue of patients
DME methylation in the normal tissue of healthy individuals
|
|||||
| Violin Diagram of DME Disease-specific Methylation Level |
|
Click to View the Clearer Original Diagram | |||
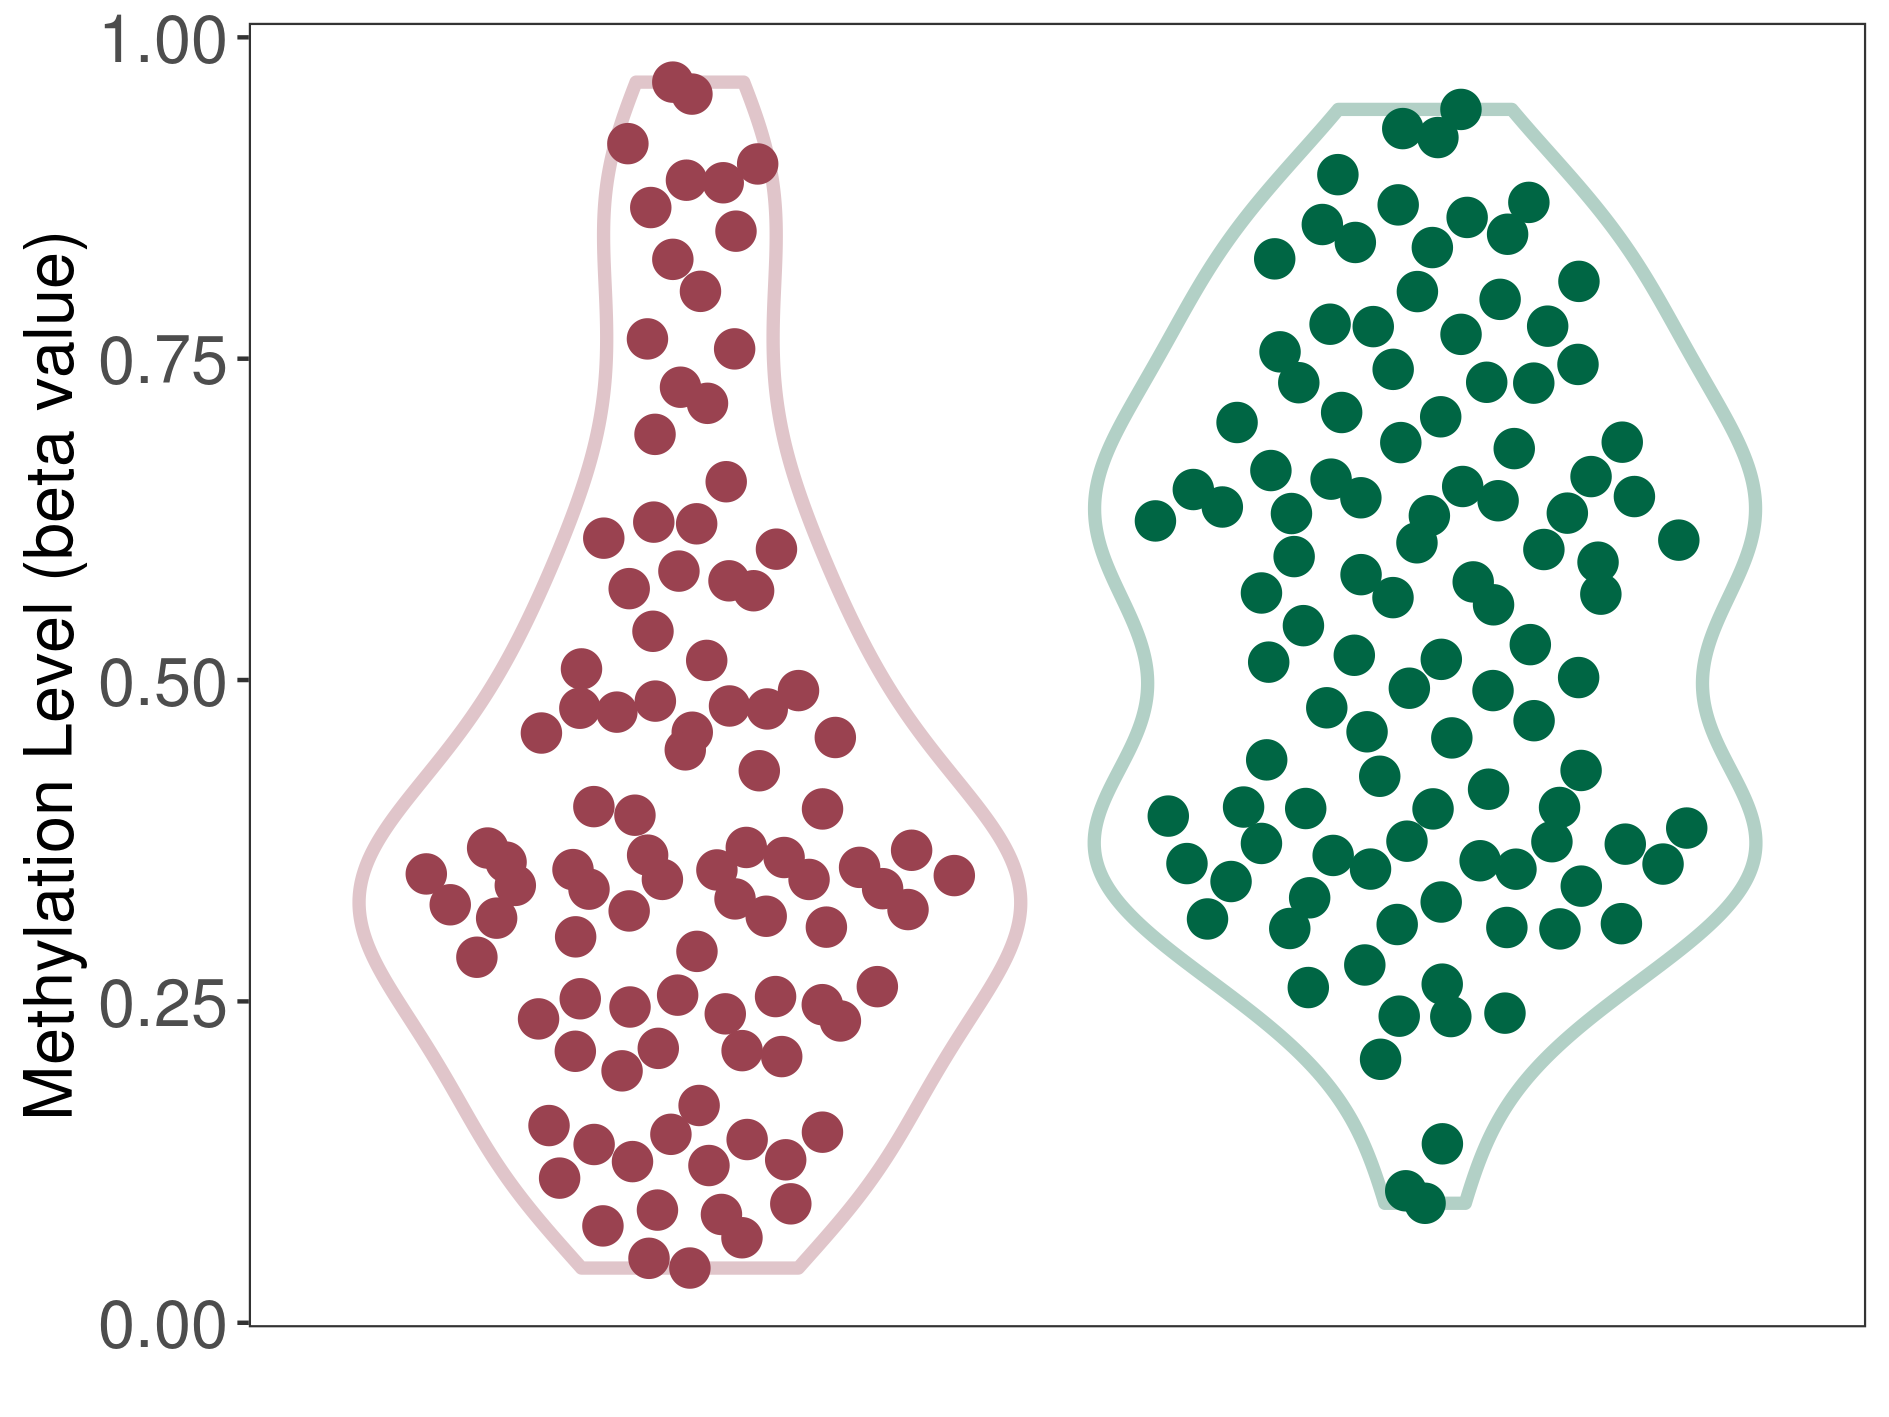
| DNA methyltransferase (DNMT) | RELA YAP fusion ependymoma | Moderate hypomethylation | |||
| Interaction Name | DNMT-GSTA1 interaction | ||||
| The Methylation Level of Disease Section Compare with the Healthy Individual Tissue | Moderate hypomethylation p-value: 1.16E-05; delta-beta: -2.12E-01 | ||||
| Description | DNA methyltransferase (DNMT) is reported to moderatly hypo-methylate the GSTA1 gene, which leads to a moderatly increased expression of the drug-metabolizing enzyme Glutathione S-transferase alpha-1. As a result, the interaction between DNMT and GSTA1 can moderatly affect the drug-metabolizing process of Glutathione S-transferase alpha-1. | ||||
|
DME methylation in the diseased tissue of patients
DME methylation in the normal tissue of healthy individuals
|
|||||
| Violin Diagram of DME Disease-specific Methylation Level |
|
Click to View the Clearer Original Diagram | |||
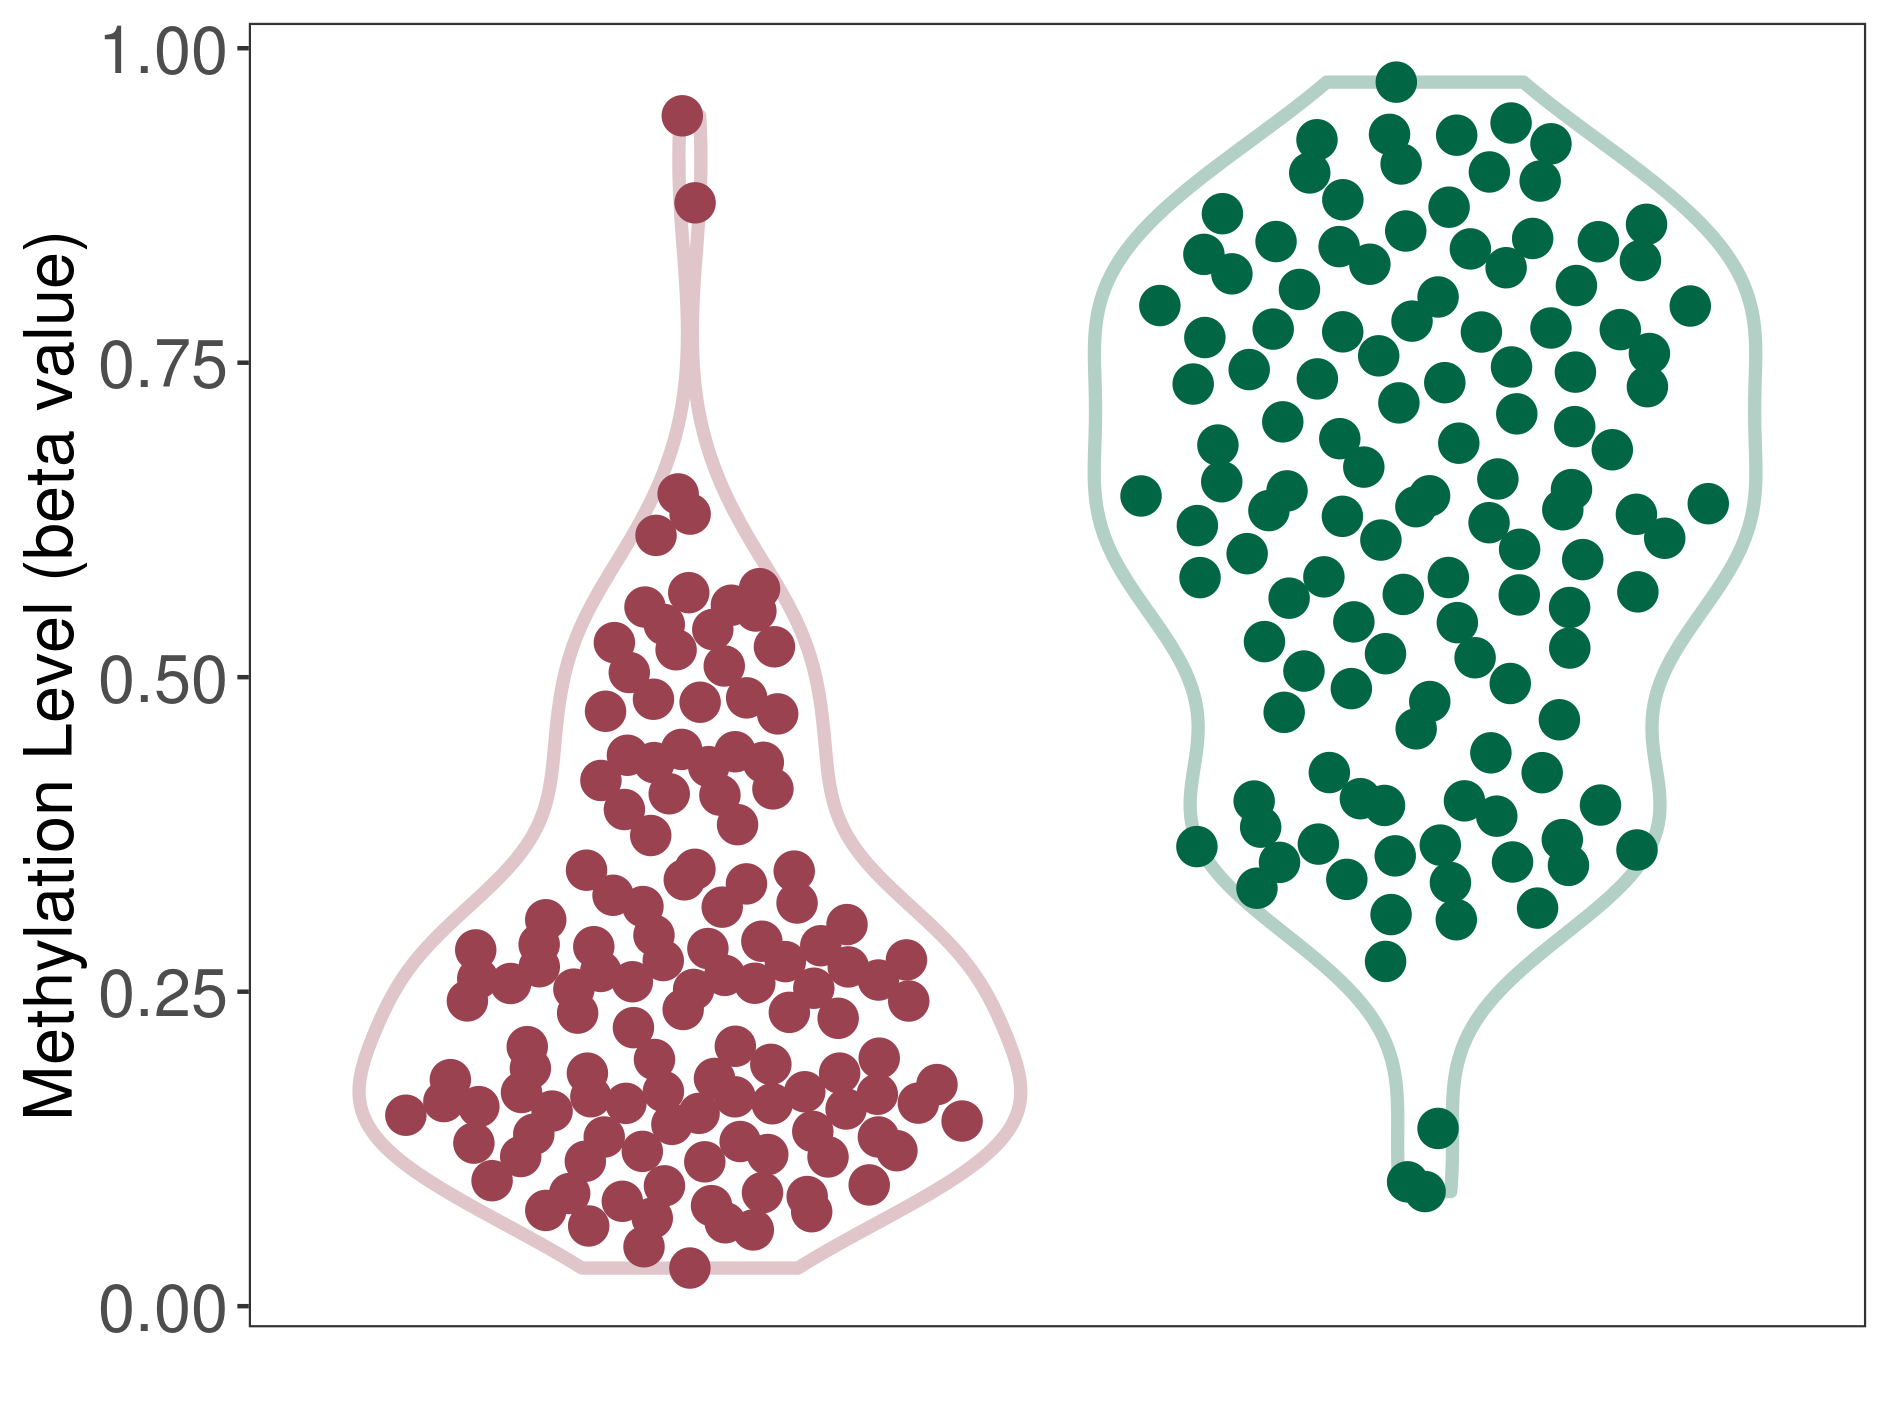
| DNA methyltransferase (DNMT) | Diffuse midline glioma | Significant hypomethylation | |||
| Interaction Name | DNMT-GSTA1 interaction | ||||
| The Methylation Level of Disease Section Compare with the Healthy Individual Tissue | Significant hypomethylation p-value: 1.50E-35; delta-beta: -3.84E-01 | ||||
| Description | DNA methyltransferase (DNMT) is reported to significantly hypo-methylate the GSTA1 gene, which leads to a significantly increased expression of the drug-metabolizing enzyme Glutathione S-transferase alpha-1. As a result, the interaction between DNMT and GSTA1 can significantly affect the drug-metabolizing process of Glutathione S-transferase alpha-1. | ||||
|
DME methylation in the diseased tissue of patients
DME methylation in the normal tissue of healthy individuals
|
|||||
| Violin Diagram of DME Disease-specific Methylation Level |
|
Click to View the Clearer Original Diagram | |||
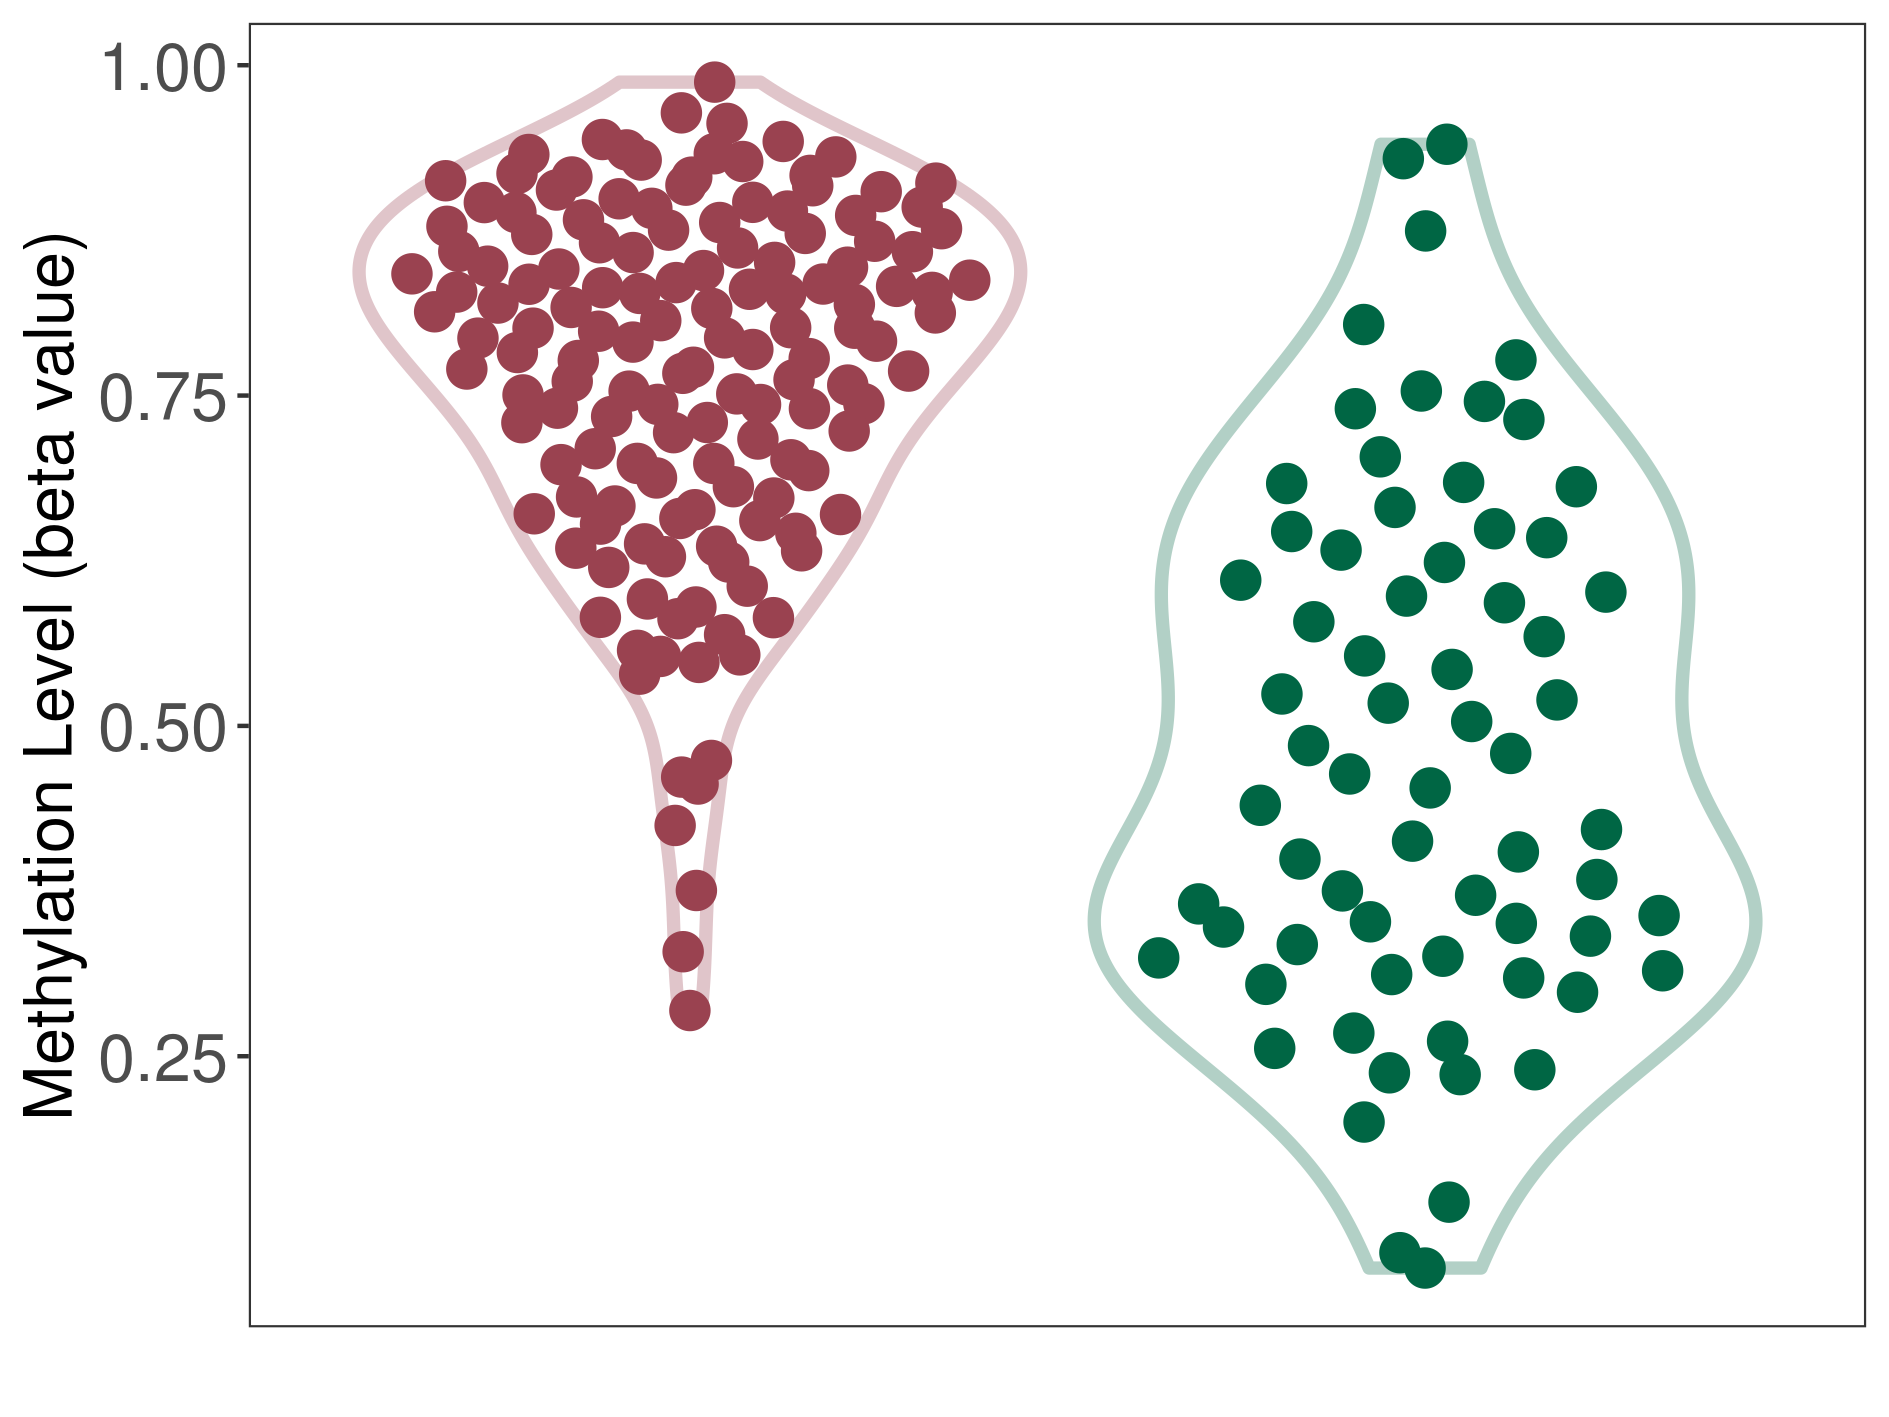
| DNA methyltransferase (DNMT) | Oligodendroglioma | Significant hypermethylation | |||
| Interaction Name | DNMT-GSTA1 interaction | ||||
| The Methylation Level of Disease Section Compare with the Healthy Individual Tissue | Significant hypermethylation p-value: 1.94E-17; delta-beta: 3.30E-01 | ||||
| Description | DNA methyltransferase (DNMT) is reported to significantly hyper-methylate the GSTA1 gene, which leads to a significantly decreased expression of the drug-metabolizing enzyme Glutathione S-transferase alpha-1. As a result, the interaction between DNMT and GSTA1 can significantly affect the drug-metabolizing process of Glutathione S-transferase alpha-1. | ||||
|
DME methylation in the diseased tissue of patients
DME methylation in the normal tissue of healthy individuals
|
|||||
| Violin Diagram of DME Disease-specific Methylation Level |
|
Click to View the Clearer Original Diagram | |||
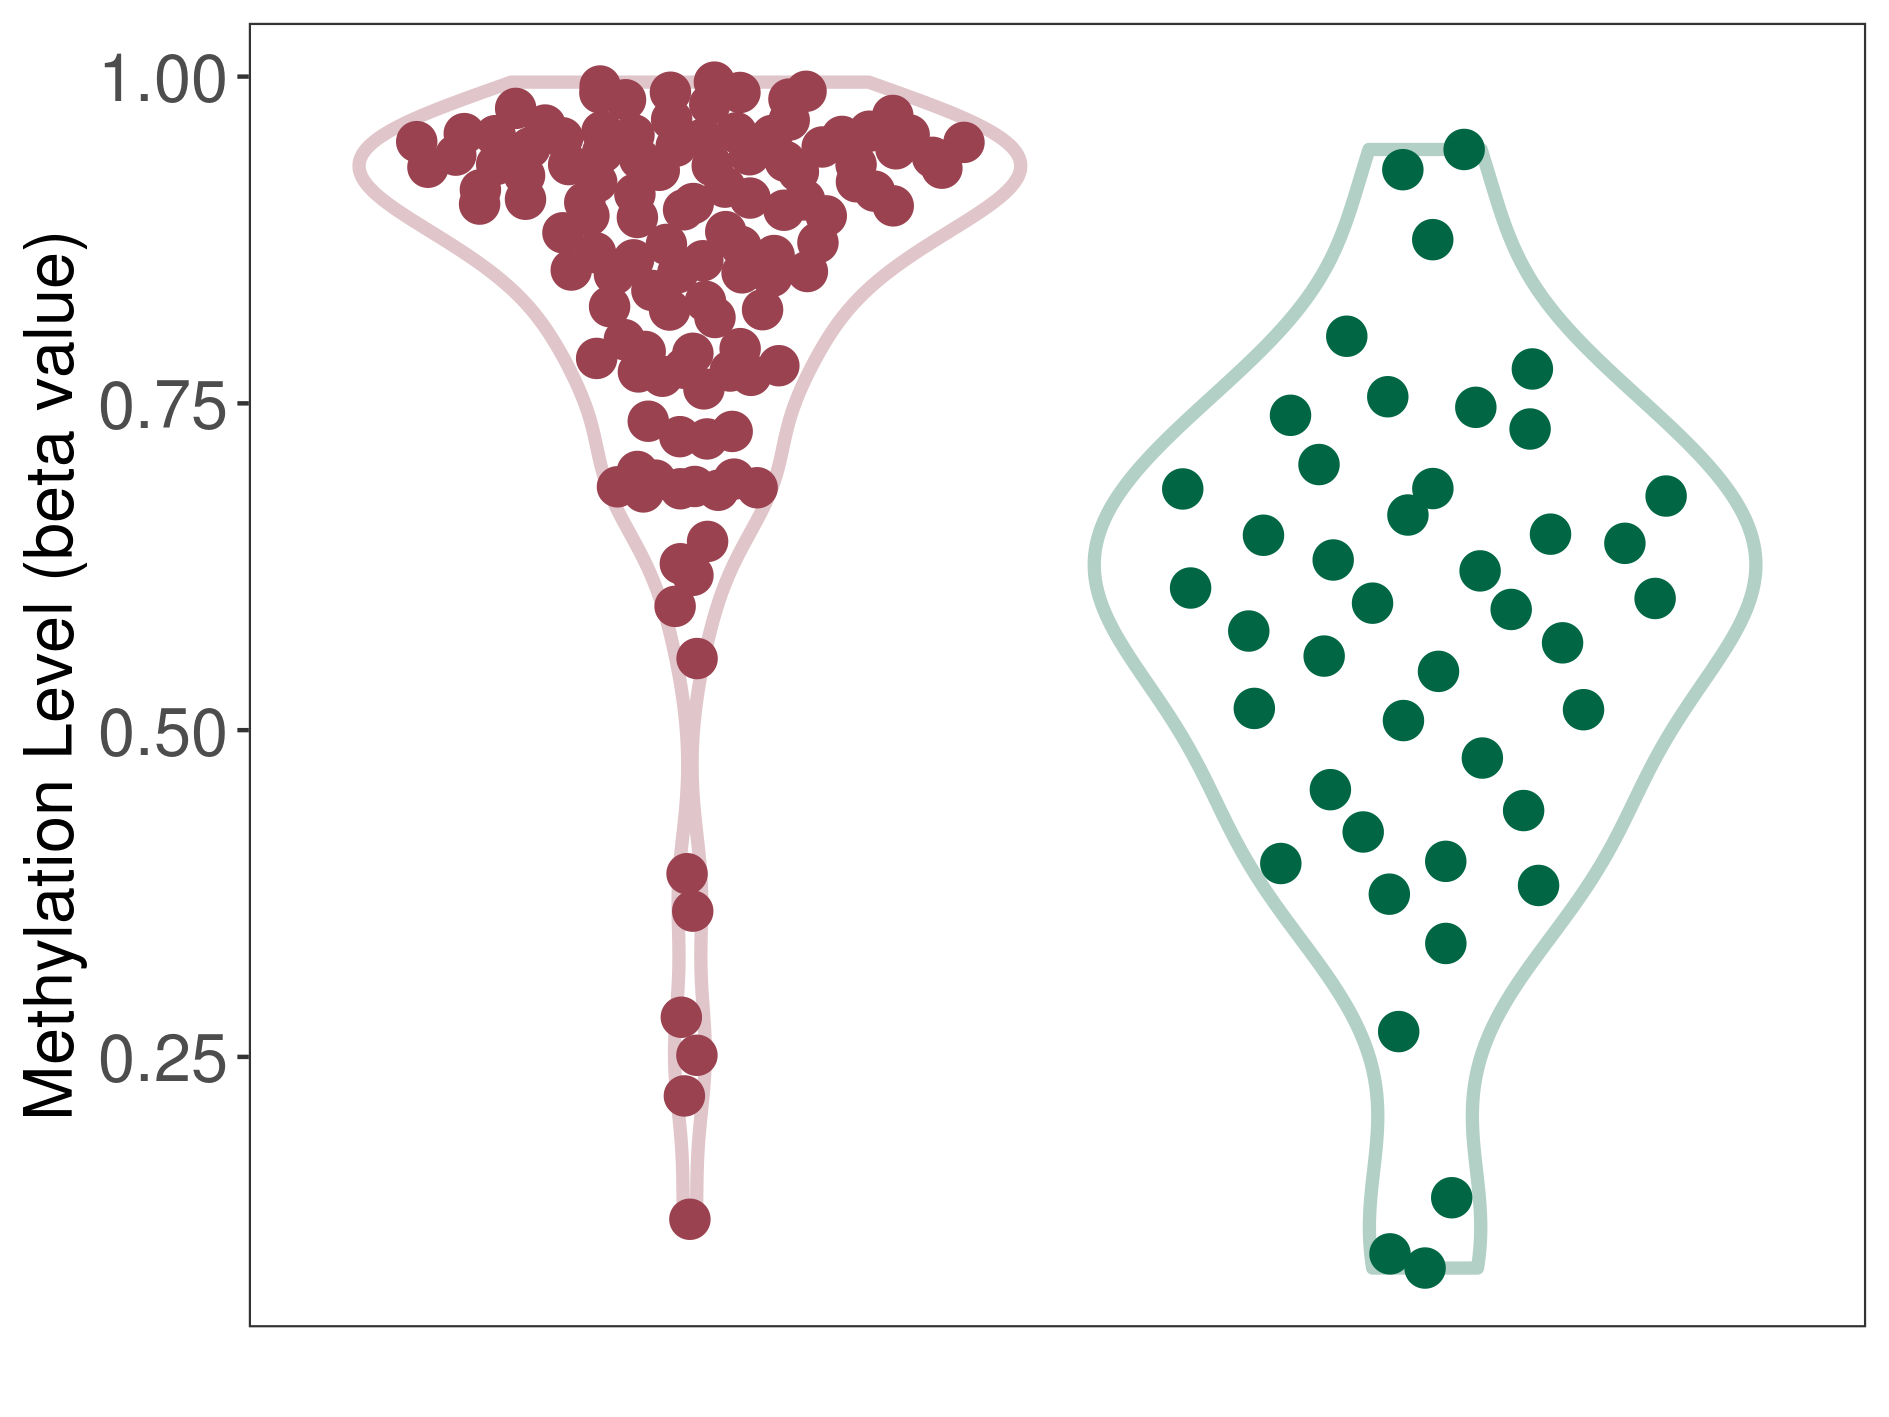
| DNA methyltransferase (DNMT) | Atypical teratoid/rhabdoid tumour | Significant hypermethylation | |||
| Interaction Name | DNMT-GSTA1 interaction | ||||
| The Methylation Level of Disease Section Compare with the Healthy Individual Tissue | Significant hypermethylation p-value: 3.59E-11; delta-beta: 3.01E-01 | ||||
| Description | DNA methyltransferase (DNMT) is reported to significantly hyper-methylate the GSTA1 gene, which leads to a significantly decreased expression of the drug-metabolizing enzyme Glutathione S-transferase alpha-1. As a result, the interaction between DNMT and GSTA1 can significantly affect the drug-metabolizing process of Glutathione S-transferase alpha-1. | ||||
|
DME methylation in the diseased tissue of patients
DME methylation in the normal tissue of healthy individuals
|
|||||
| Violin Diagram of DME Disease-specific Methylation Level |
|
Click to View the Clearer Original Diagram | |||
| ICD-11: 2A01 Meningeal tumour | Click to Show/Hide the Full List of HOSPPI: 1 HOSPPI | ||||
| DNA methylation | |||||
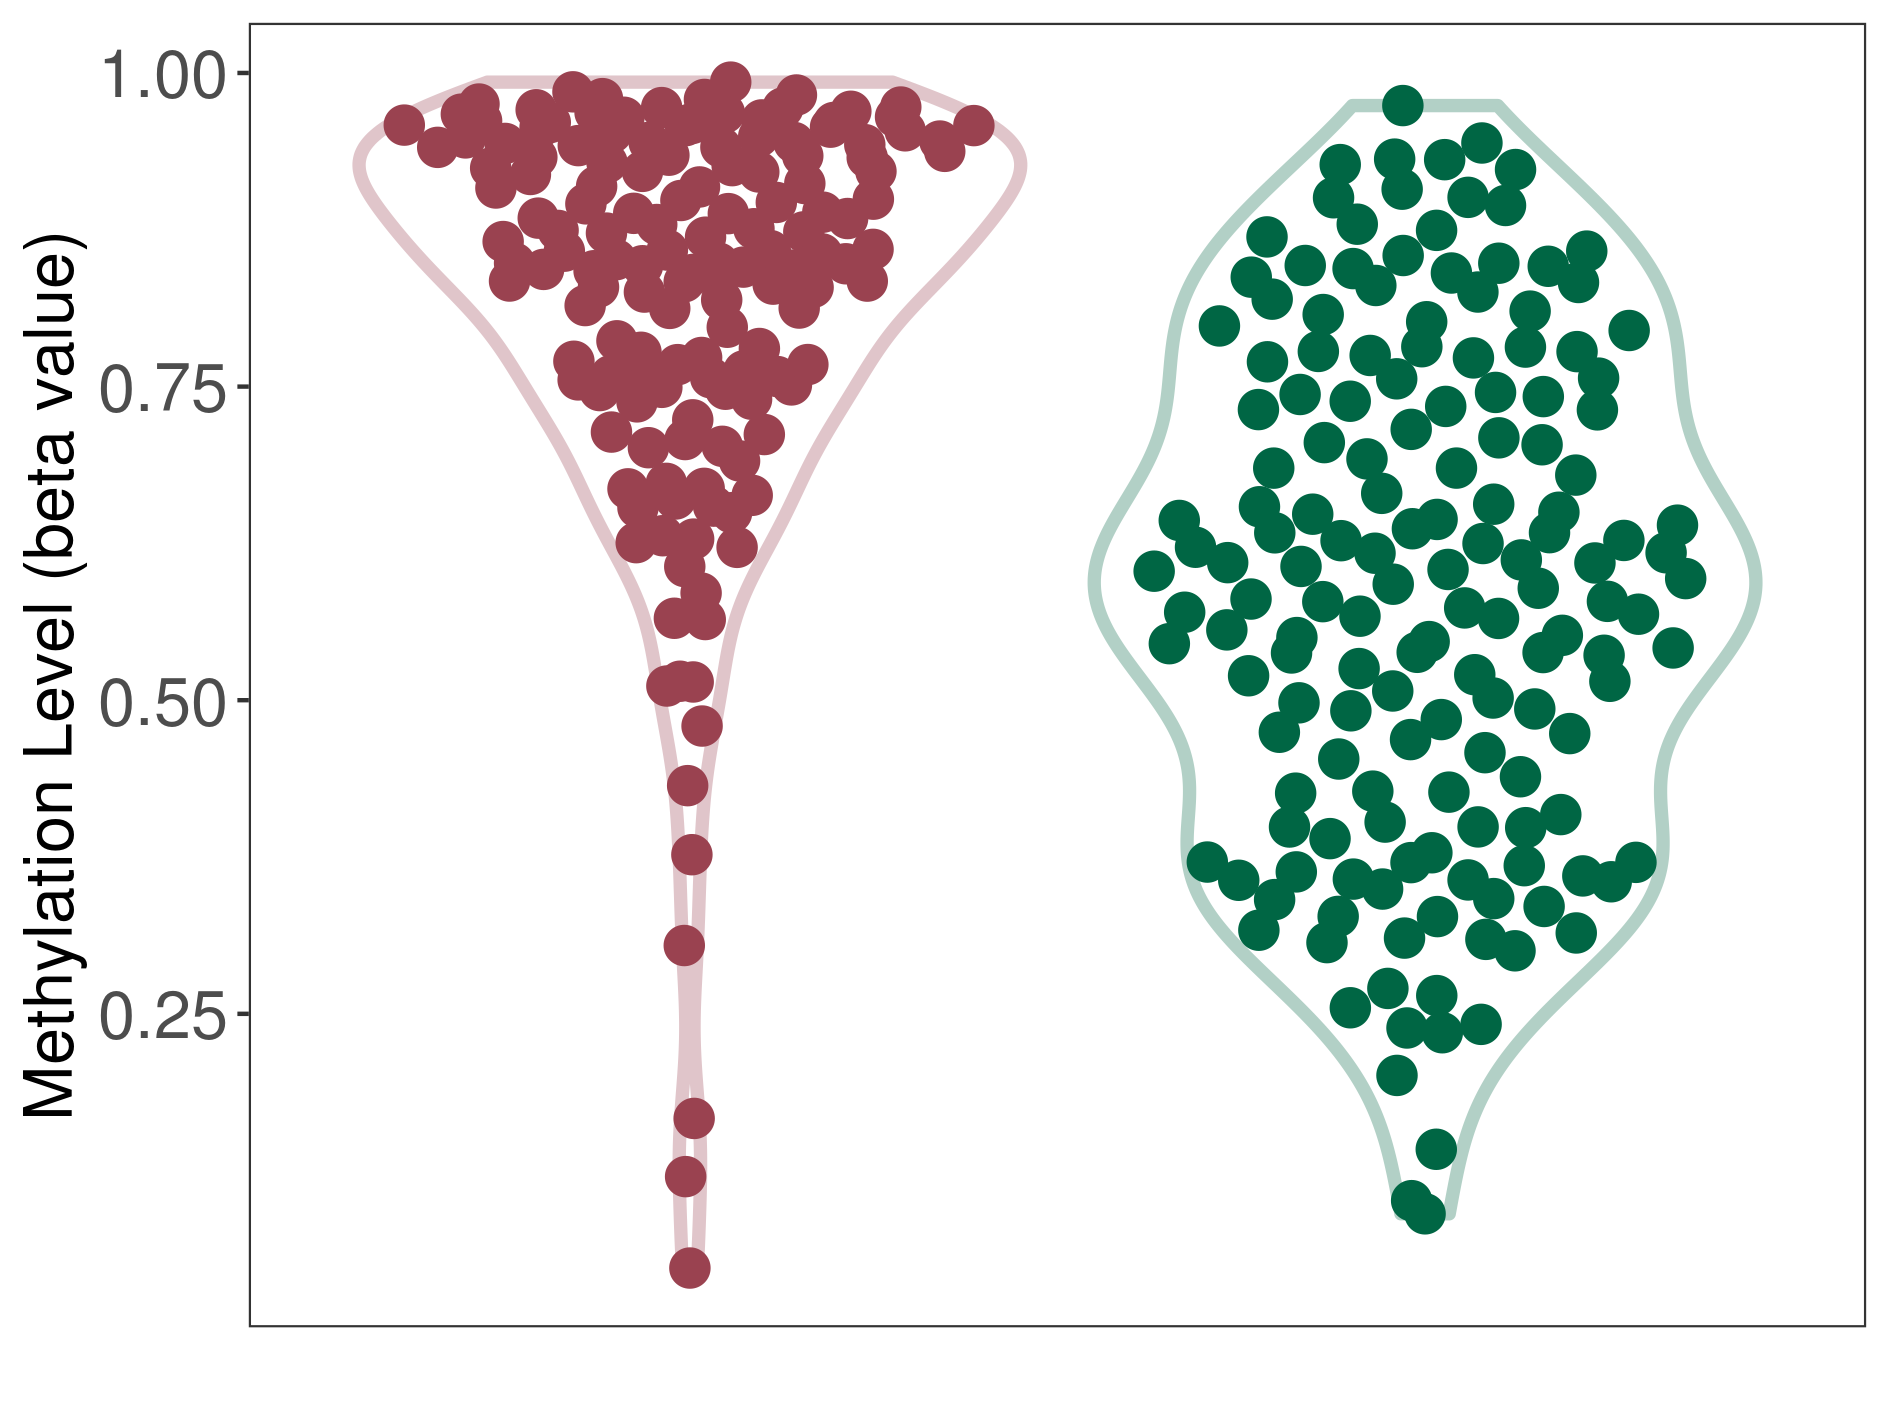
| DNA methyltransferase (DNMT) | Meningioma | Moderate hypermethylation | |||
| Interaction Name | DNMT-GSTA1 interaction | ||||
| The Methylation Level of Disease Section Compare with the Healthy Individual Tissue | Moderate hypermethylation p-value: 1.73E-22; delta-beta: 2.61E-01 | ||||
| Description | DNA methyltransferase (DNMT) is reported to moderatly hyper-methylate the GSTA1 gene, which leads to a moderatly decreased expression of the drug-metabolizing enzyme Glutathione S-transferase alpha-1. As a result, the interaction between DNMT and GSTA1 can moderatly affect the drug-metabolizing process of Glutathione S-transferase alpha-1. | ||||
|
DME methylation in the diseased tissue of patients
DME methylation in the normal tissue of healthy individuals
|
|||||
| Violin Diagram of DME Disease-specific Methylation Level |
|
Click to View the Clearer Original Diagram | |||
| ICD-11: 2B30 Lymphoma | Click to Show/Hide the Full List of HOSPPI: 1 HOSPPI | ||||
| DNA methylation | |||||
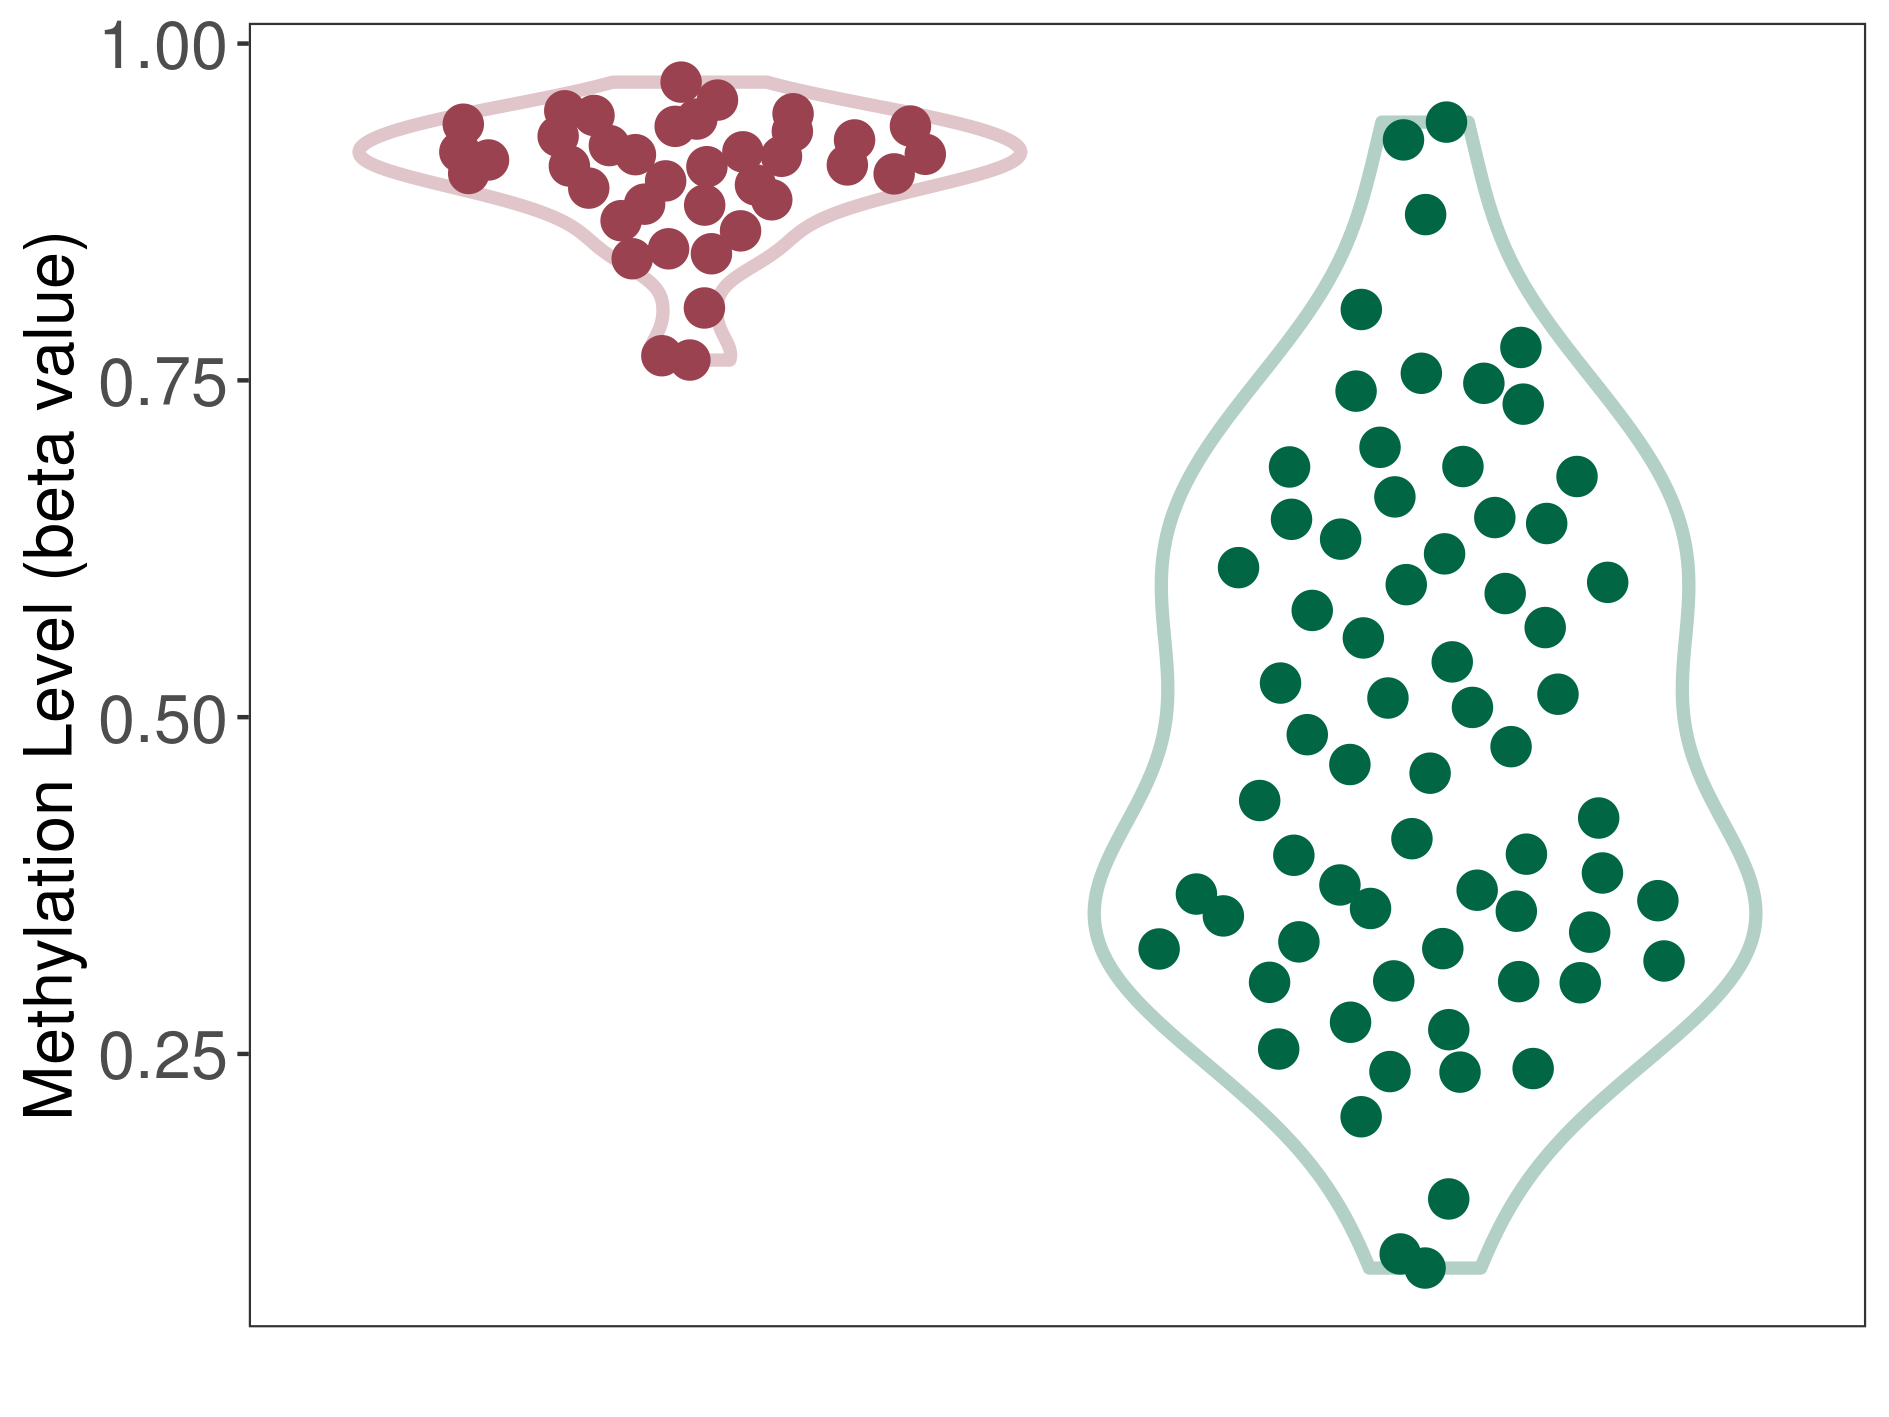
| DNA methyltransferase (DNMT) | Lymphoma | Significant hypermethylation | |||
| Interaction Name | DNMT-GSTA1 interaction | ||||
| The Methylation Level of Disease Section Compare with the Healthy Individual Tissue | Significant hypermethylation p-value: 6.27E-27; delta-beta: 4.47E-01 | ||||
| Description | DNA methyltransferase (DNMT) is reported to significantly hyper-methylate the GSTA1 gene, which leads to a significantly decreased expression of the drug-metabolizing enzyme Glutathione S-transferase alpha-1. As a result, the interaction between DNMT and GSTA1 can significantly affect the drug-metabolizing process of Glutathione S-transferase alpha-1. | ||||
|
DME methylation in the diseased tissue of patients
DME methylation in the normal tissue of healthy individuals
|
|||||
| Violin Diagram of DME Disease-specific Methylation Level |
|
Click to View the Clearer Original Diagram | |||
| ICD-11: 2B90 Colorectal cancer | Click to Show/Hide the Full List of HOSPPI: 1 HOSPPI | ||||
| DNA methylation | |||||
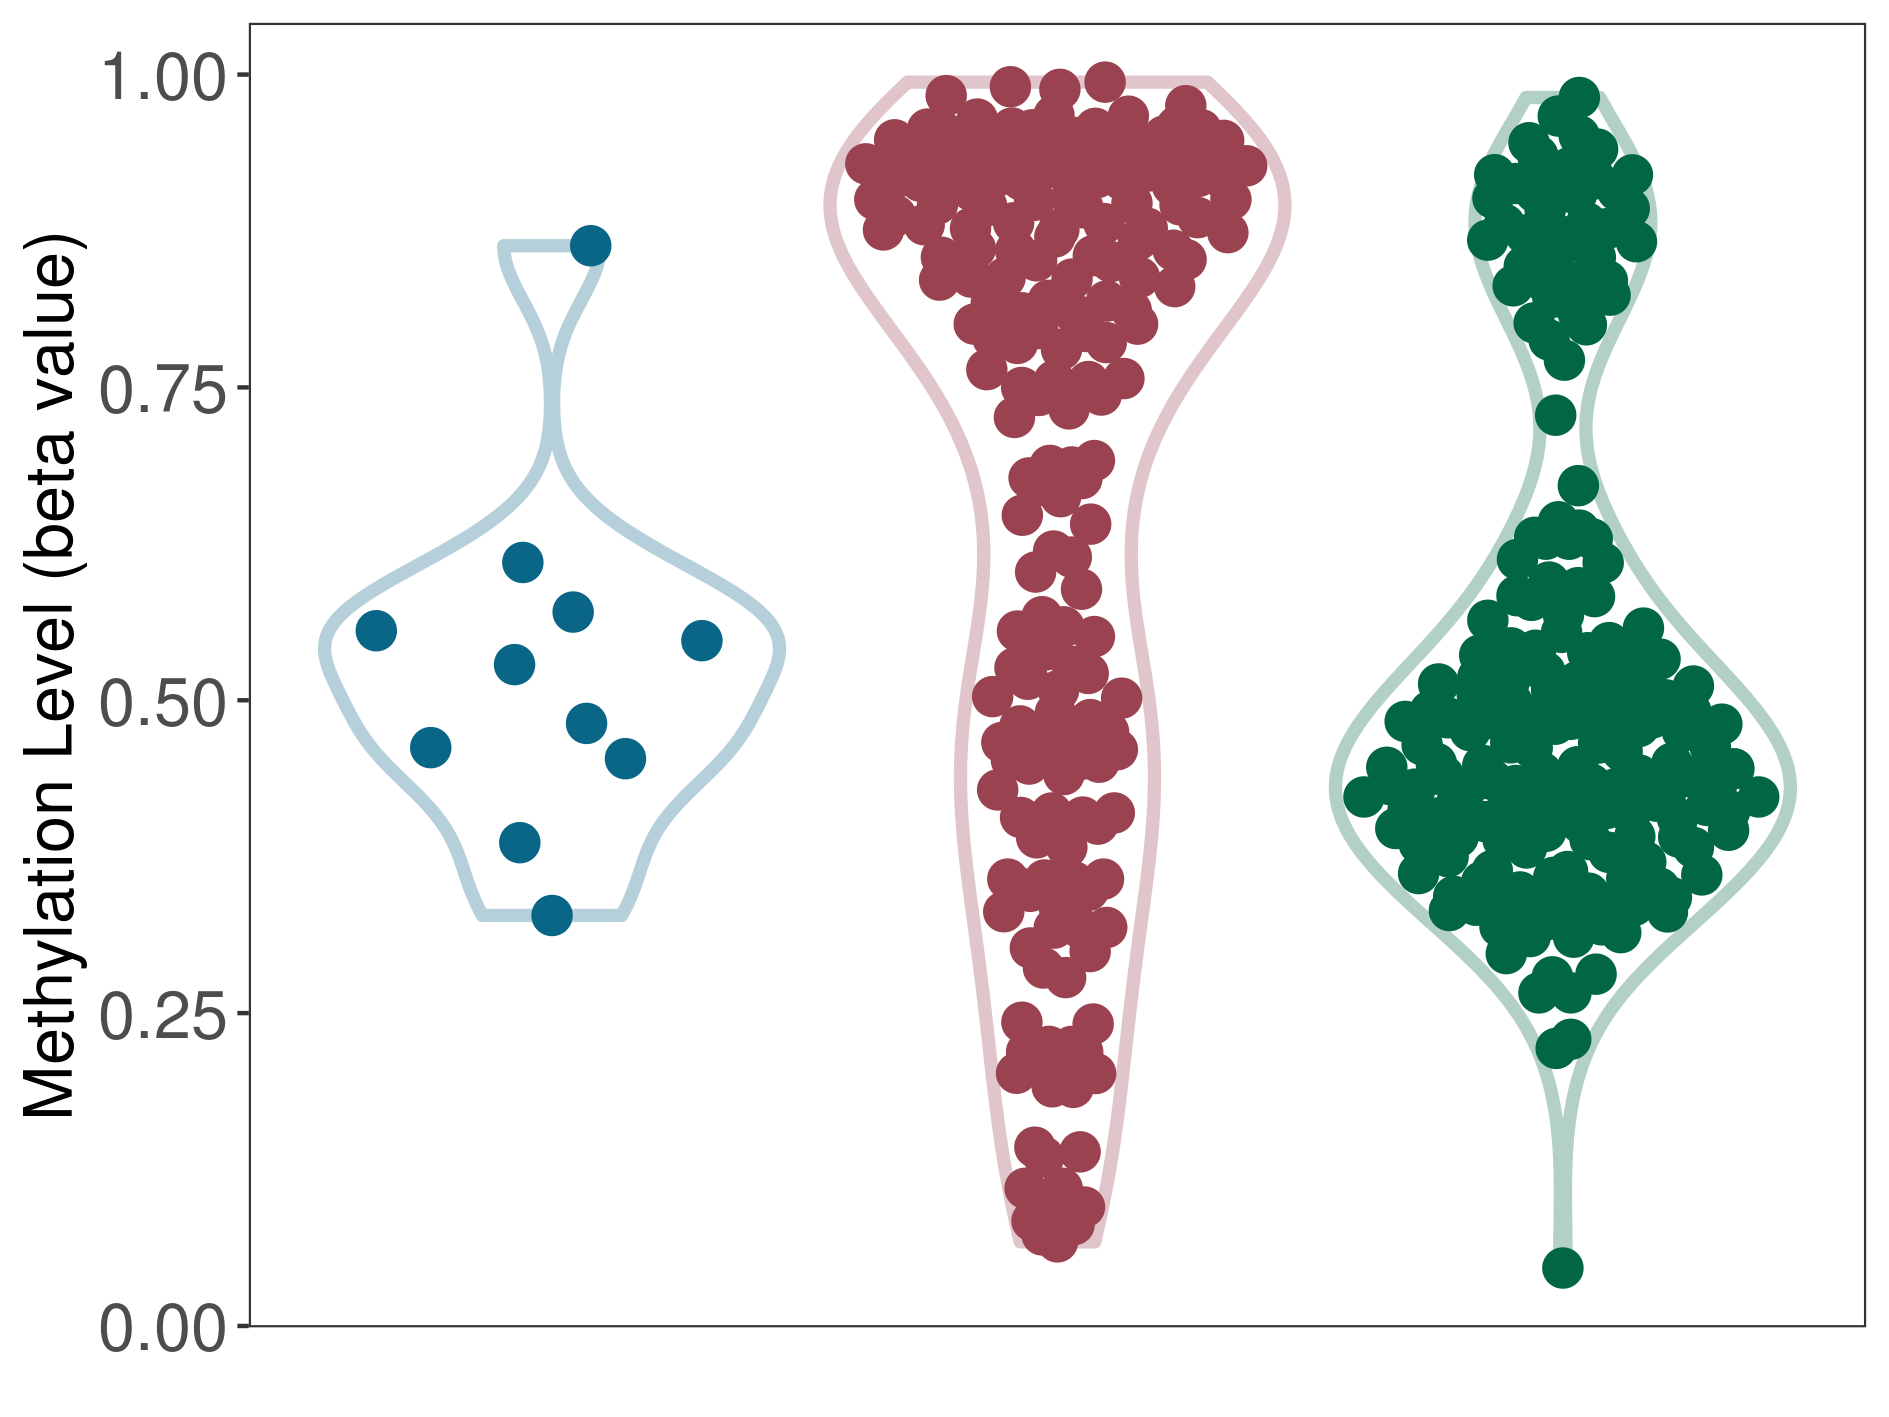
| DNA methyltransferase (DNMT) | Colorectal cancer | Significant hypermethylation | |||
| Interaction Name | DNMT-GSTA1 interaction | ||||
| The Methylation Level of Disease Section Compare with the Healthy Individual Tissue | Significant hypermethylation p-value: 4.79E-07; delta-beta: 3.09E-01 | ||||
| Description | DNA methyltransferase (DNMT) is reported to significantly hyper-methylate the GSTA1 gene, which leads to a significantly decreased expression of the drug-metabolizing enzyme Glutathione S-transferase alpha-1. As a result, the interaction between DNMT and GSTA1 can significantly affect the drug-metabolizing process of Glutathione S-transferase alpha-1. | ||||
| The Methylation Level of Disease Section Compare with the Adjacent Tissue | Moderate hypermethylation p-value: 1.02E-02; delta-beta: 2.57E-01 | ||||
| Description | DNA methyltransferase (DNMT) is reported to moderatly hyper-methylate the GSTA1 gene, which leads to a moderatly decreased expression of the drug-metabolizing enzyme Glutathione S-transferase alpha-1. As a result, the interaction between DNMT and GSTA1 can moderatly affect the drug-metabolizing process of Glutathione S-transferase alpha-1. | ||||
|
DME methylation in the diseased tissue of patients
DME methylation in the normal tissue adjacent to the diseased tissue of patients
DME methylation in the normal tissue of healthy individuals
|
|||||
| Violin Diagram of DME Disease-specific Methylation Level |
|
Click to View the Clearer Original Diagram | |||
| ICD-11: 2C12 Liver cancer | Click to Show/Hide the Full List of HOSPPI: 2 HOSPPI | ||||
| Transcription-factor regulation | |||||
| NFE2-related factor 2 (NFE2L2) | Liver cancer | Repression | |||
| Uniprot ID | |||||
| Interaction Name | NFE2L2-GSTA1 interaction | [2] | |||
| Studied Cell Lines | HepG2 cell line | ||||
| Ensembl ID | |||||
| Description | NFE2-related factor 2 (NFE2L2) is reported to repress the transcription of GSTA1 gene, which leads to a decreased expression of the drug-metabolizing enzyme Glutathione S-transferase alpha-1. As a result, the interaction between NFE2L2 and GSTA1 can repress the drug-metabolizing process of Glutathione S-transferase alpha-1. | ||||
| DNA methylation | |||||
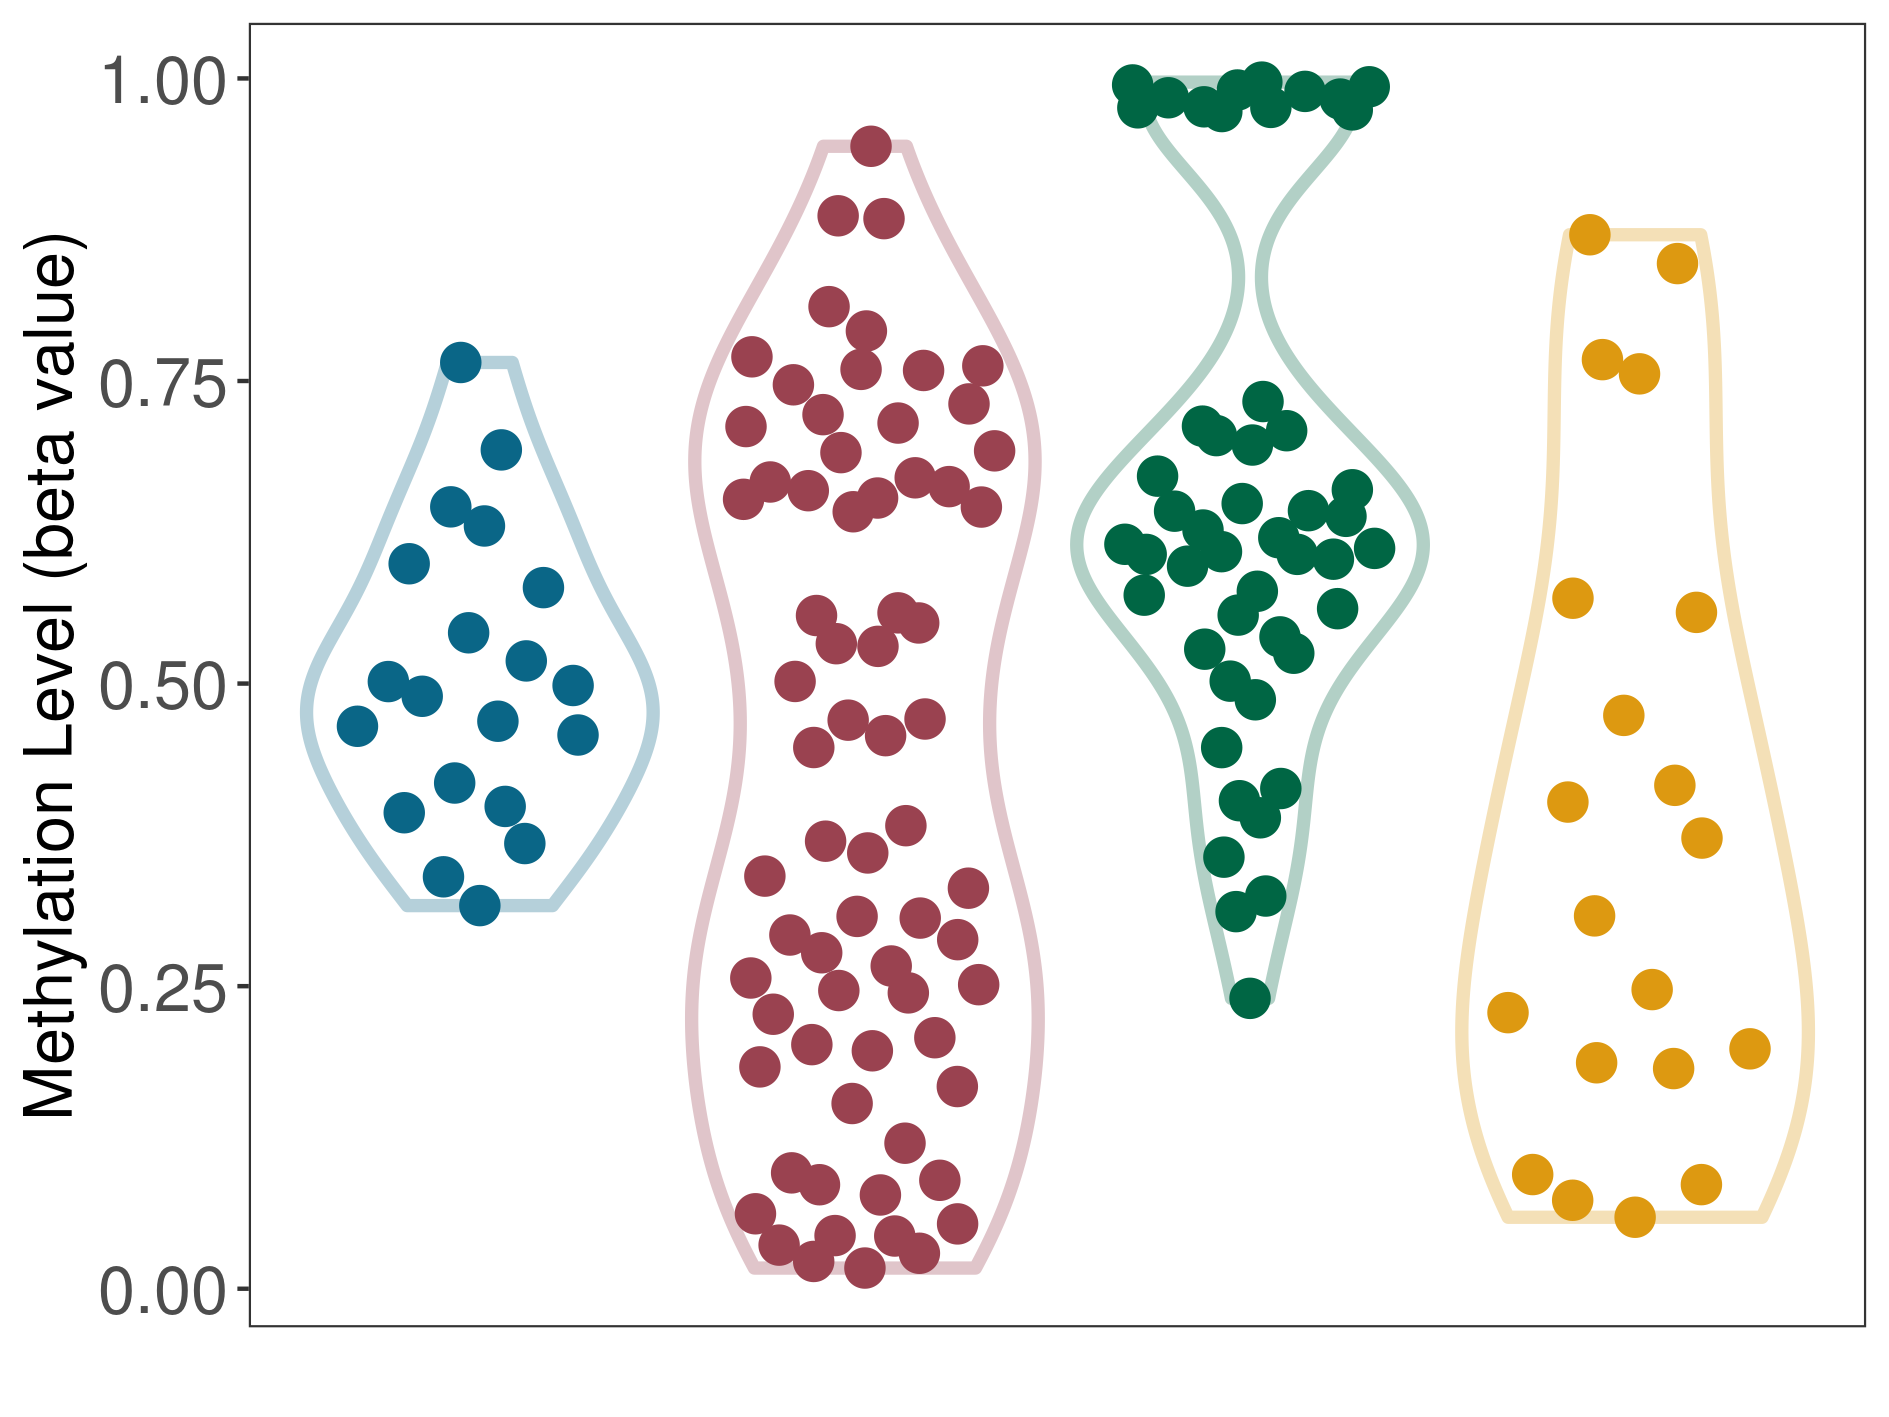
| DNA methyltransferase (DNMT) | Liver cancer | Moderate hypomethylation | |||
| Interaction Name | DNMT-GSTA1 interaction | ||||
| The Methylation Level of Disease Section Compare with the Healthy Individual Tissue | Moderate hypomethylation p-value: 4.62E-07; delta-beta: -2.38E-01 | ||||
| Description | DNA methyltransferase (DNMT) is reported to moderatly hypo-methylate the GSTA1 gene, which leads to a moderatly increased expression of the drug-metabolizing enzyme Glutathione S-transferase alpha-1. As a result, the interaction between DNMT and GSTA1 can moderatly affect the drug-metabolizing process of Glutathione S-transferase alpha-1. | ||||
|
DME methylation in the diseased tissue of patients
DME methylation in the normal tissue adjacent to the diseased tissue of patients
DME methylation in the normal tissue of healthy individuals
DME methylation in tissue other than the diseased tissue of patients
|
|||||
| Violin Diagram of DME Disease-specific Methylation Level |
|
Click to View the Clearer Original Diagram | |||
| ICD-11: 2C25 Lung cancer | Click to Show/Hide the Full List of HOSPPI: 1 HOSPPI | ||||
| DNA methylation | |||||
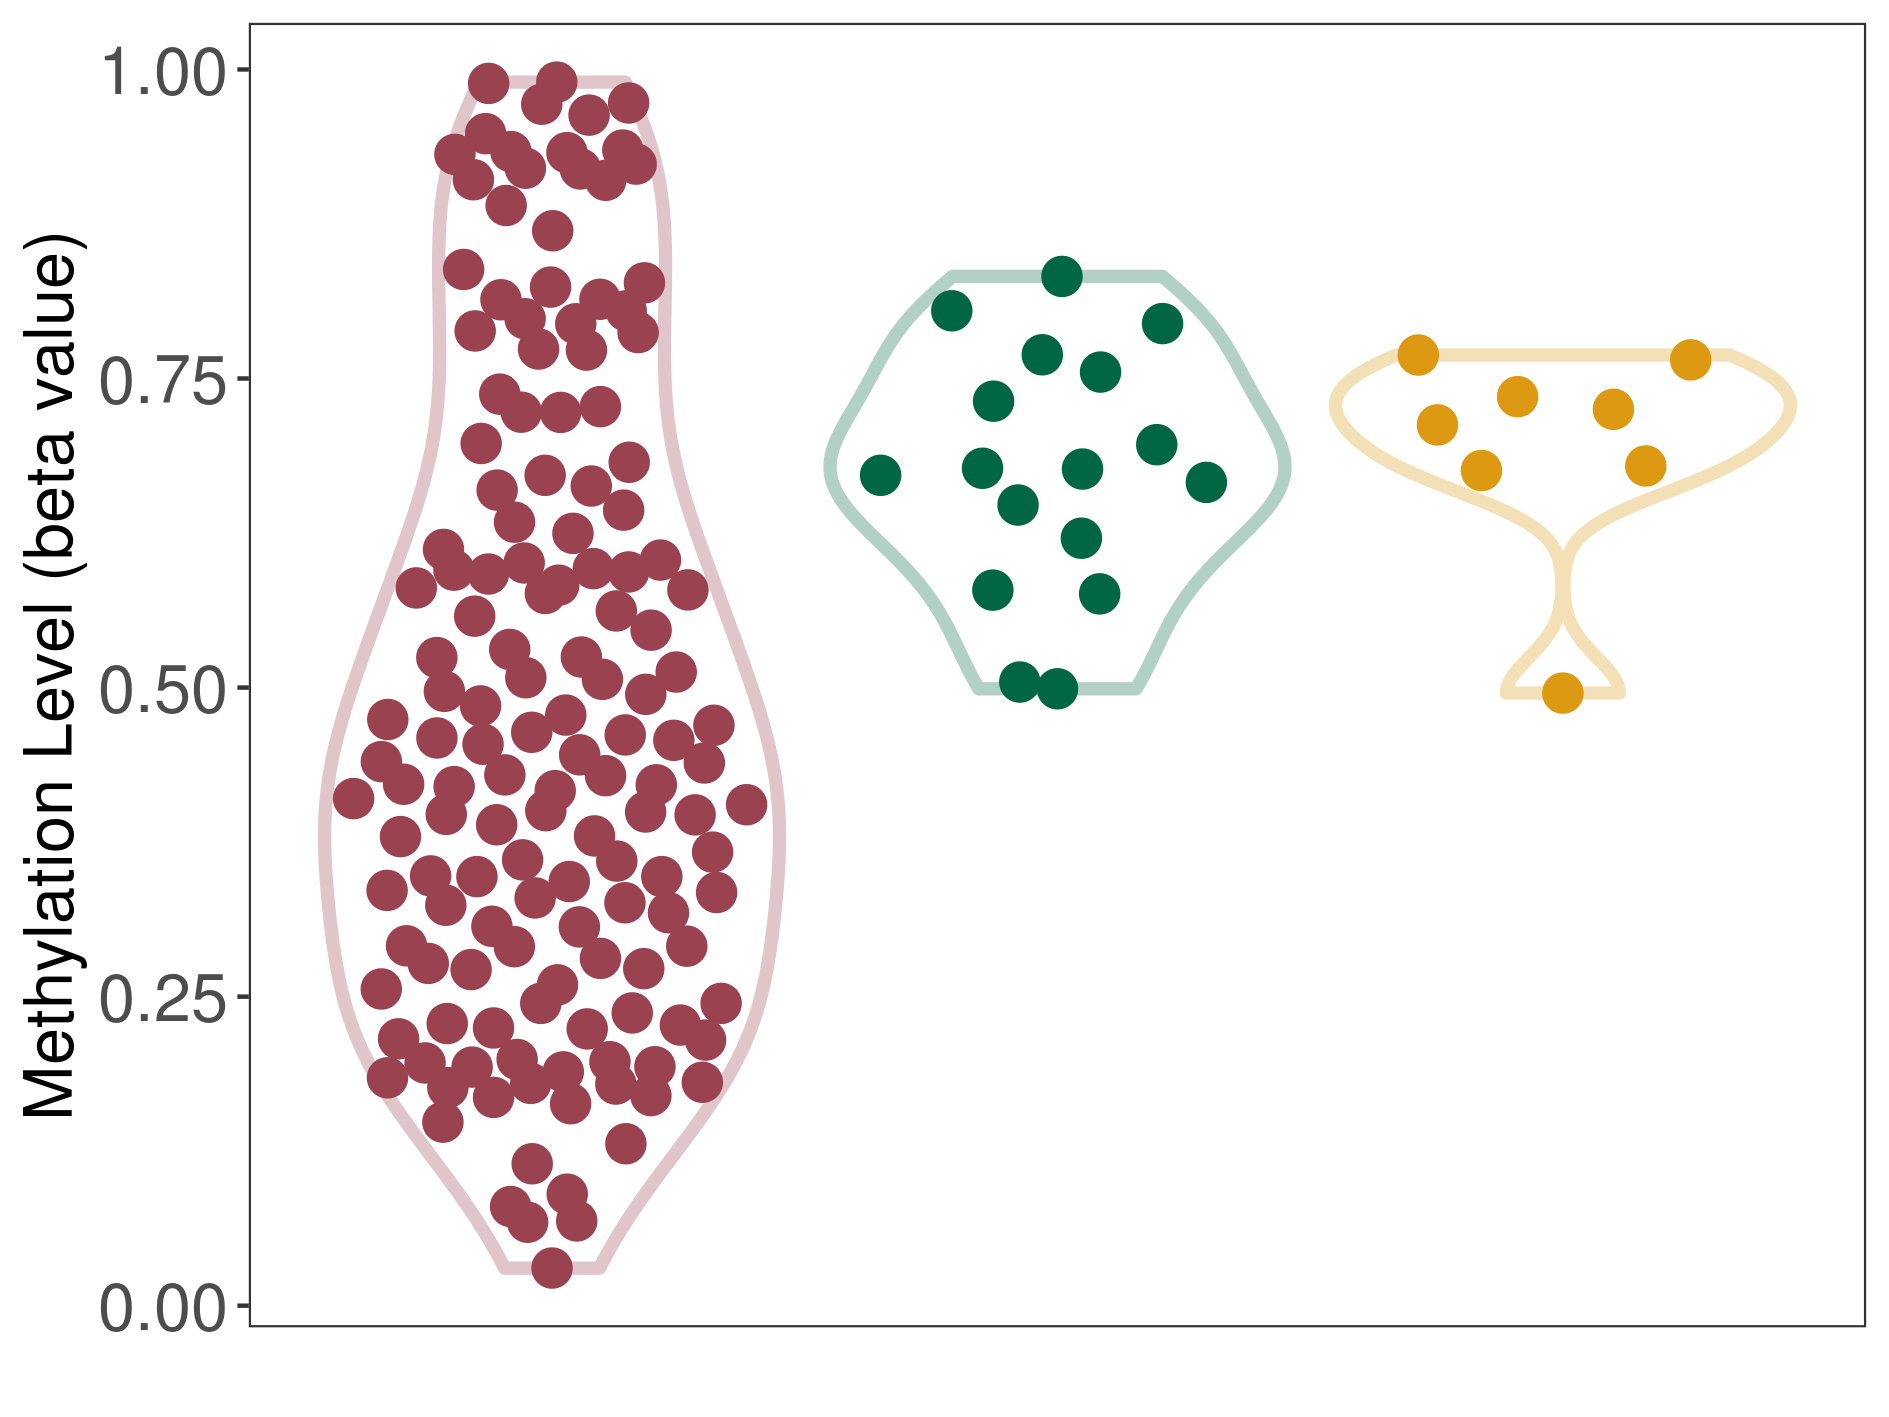
| DNA methyltransferase (DNMT) | Lung cancer | Moderate hypomethylation | |||
| Interaction Name | DNMT-GSTA1 interaction | ||||
| The Methylation Level of Disease Section Compare with the Healthy Individual Tissue | Moderate hypomethylation p-value: 3.34E-07; delta-beta: -2.31E-01 | ||||
| Description | DNA methyltransferase (DNMT) is reported to moderatly hypo-methylate the GSTA1 gene, which leads to a moderatly increased expression of the drug-metabolizing enzyme Glutathione S-transferase alpha-1. As a result, the interaction between DNMT and GSTA1 can moderatly affect the drug-metabolizing process of Glutathione S-transferase alpha-1. | ||||
| The Methylation Level of Disease Section Compare with the Other Disease Section | Moderate hypomethylation p-value: 5.67E-05; delta-beta: -2.73E-01 | ||||
| Description | DNA methyltransferase (DNMT) is reported to moderatly hypo-methylate the GSTA1 gene, which leads to a moderatly increased expression of the drug-metabolizing enzyme Glutathione S-transferase alpha-1. As a result, the interaction between DNMT and GSTA1 can moderatly affect the drug-metabolizing process of Glutathione S-transferase alpha-1. | ||||
|
DME methylation in the diseased tissue of patients
DME methylation in the normal tissue of healthy individuals
DME methylation in tissue other than the diseased tissue of patients
|
|||||
| Violin Diagram of DME Disease-specific Methylation Level |
|
Click to View the Clearer Original Diagram | |||
| ICD-11: 2D50 Brain cancer metastasis | Click to Show/Hide the Full List of HOSPPI: 1 HOSPPI | ||||
| DNA methylation | |||||
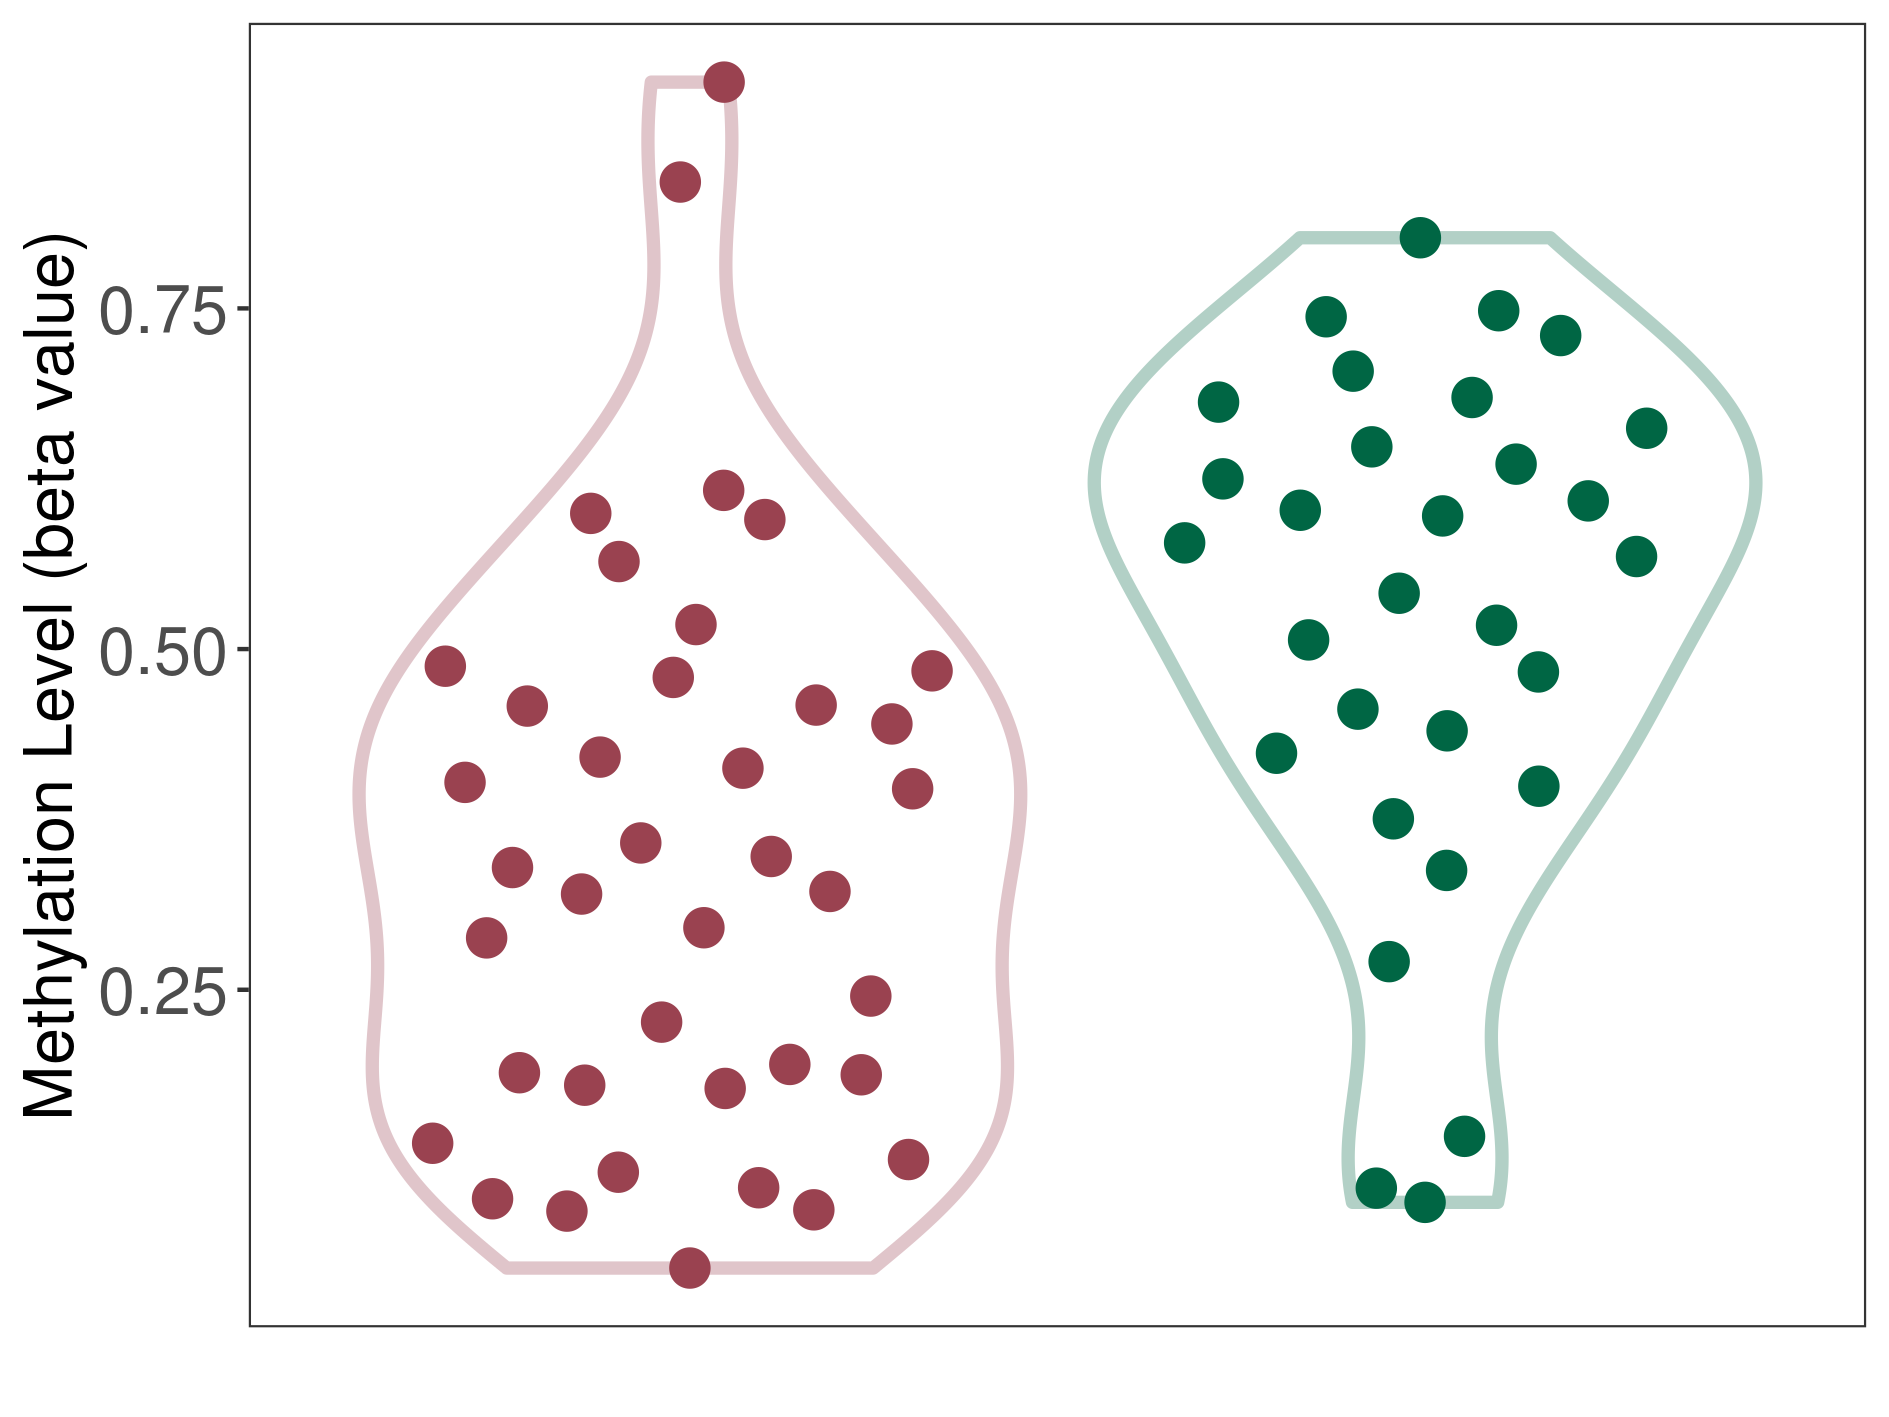
| DNA methyltransferase (DNMT) | Esthesioneuroblastoma | Moderate hypomethylation | |||
| Interaction Name | DNMT-GSTA1 interaction | ||||
| The Methylation Level of Disease Section Compare with the Healthy Individual Tissue | Moderate hypomethylation p-value: 4.89E-04; delta-beta: -2.33E-01 | ||||
| Description | DNA methyltransferase (DNMT) is reported to moderatly hypo-methylate the GSTA1 gene, which leads to a moderatly increased expression of the drug-metabolizing enzyme Glutathione S-transferase alpha-1. As a result, the interaction between DNMT and GSTA1 can moderatly affect the drug-metabolizing process of Glutathione S-transferase alpha-1. | ||||
|
DME methylation in the diseased tissue of patients
DME methylation in the normal tissue of healthy individuals
|
|||||
| Violin Diagram of DME Disease-specific Methylation Level |
|
Click to View the Clearer Original Diagram | |||
| ICD-11: 2F37 Endocrine gland cancer | Click to Show/Hide the Full List of HOSPPI: 1 HOSPPI | ||||
| DNA methylation | |||||
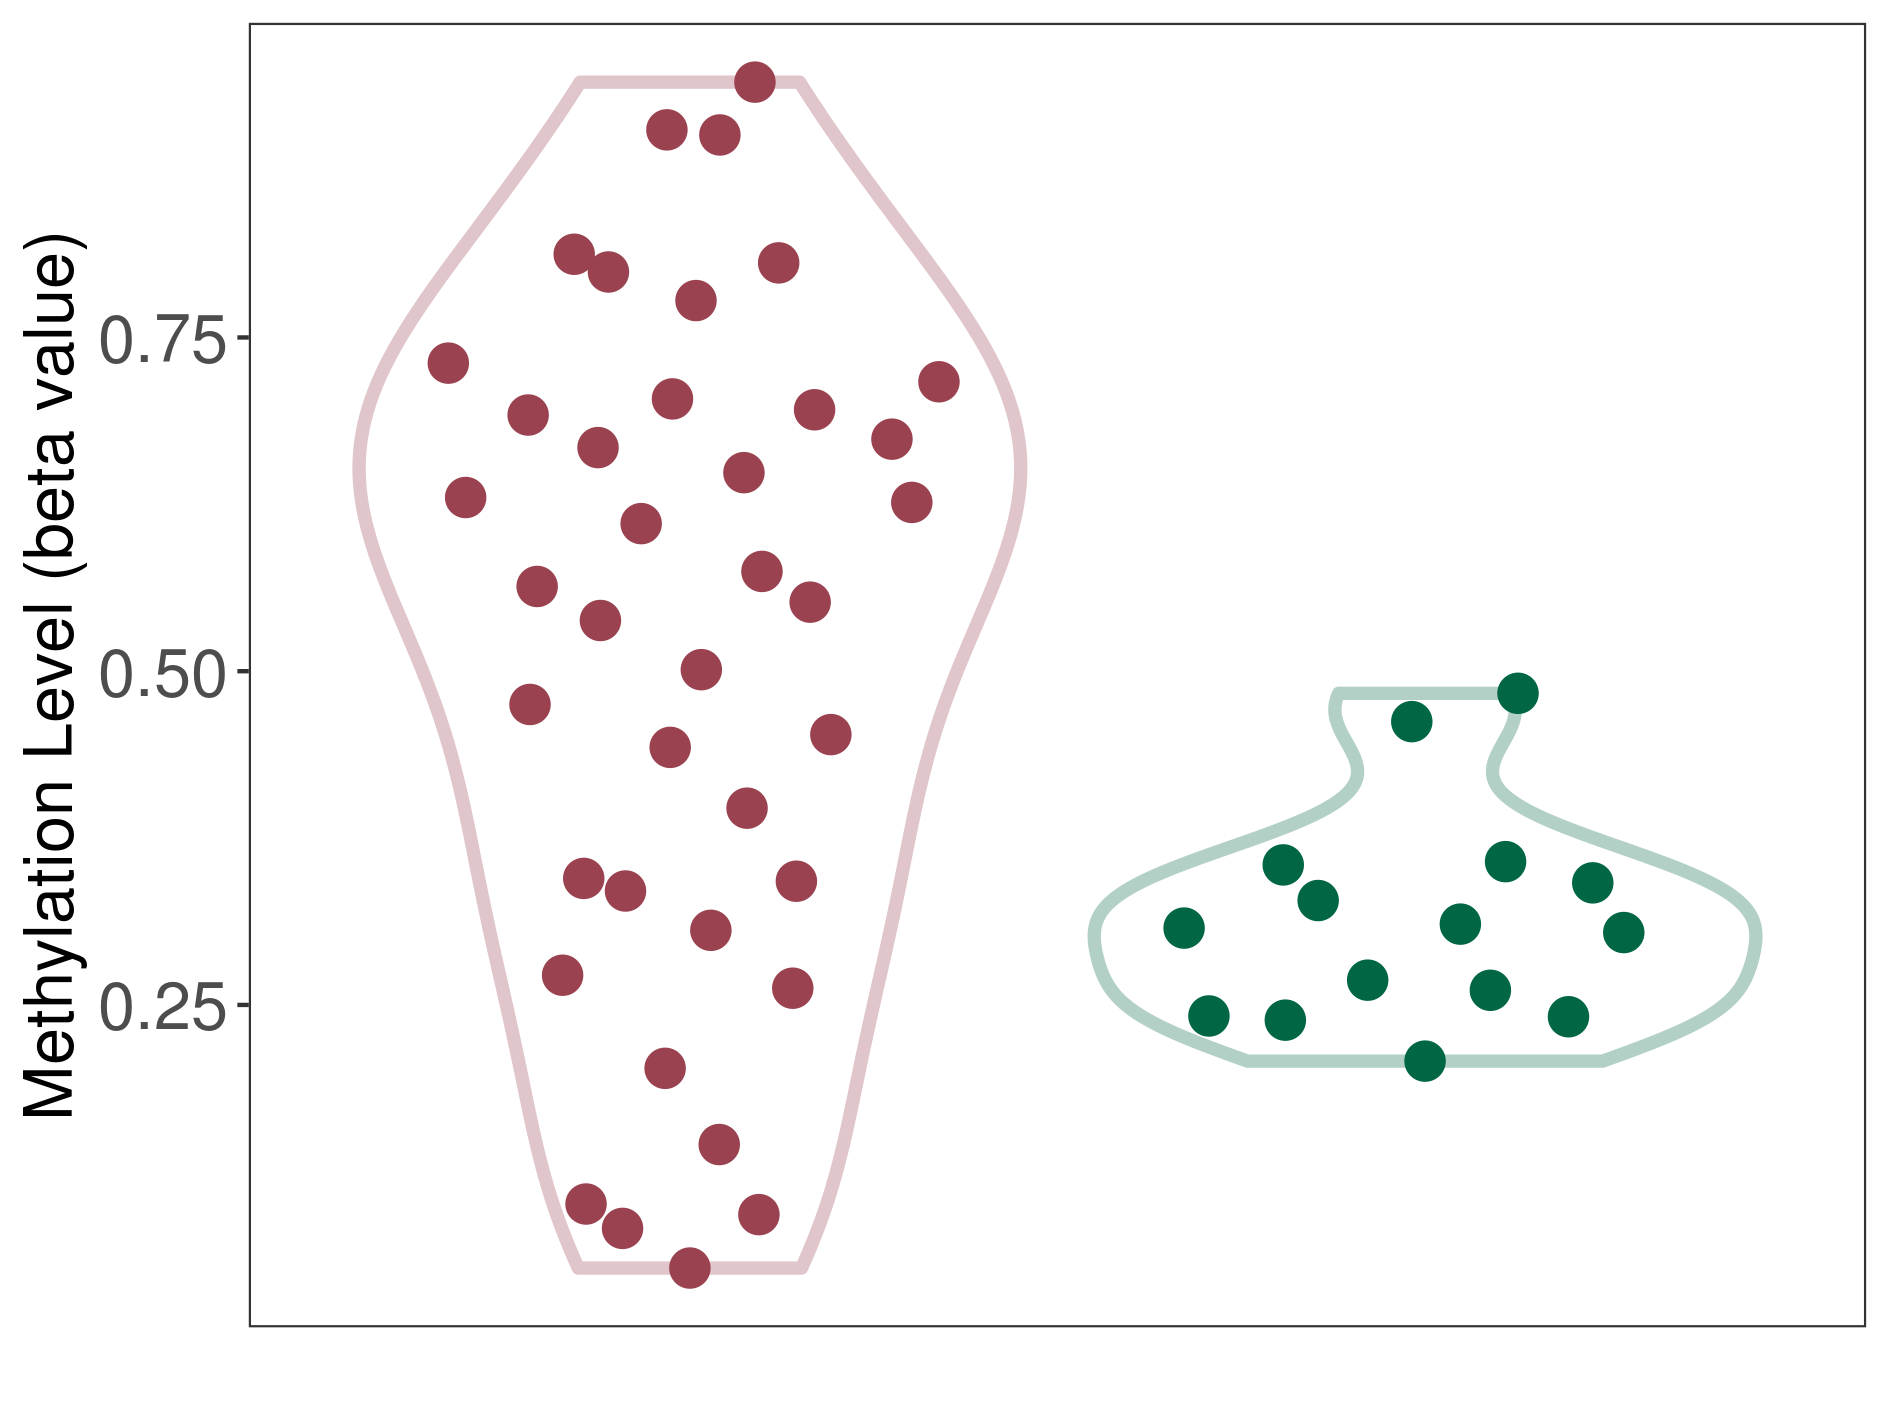
| DNA methyltransferase (DNMT) | Pituitary adenoma | Moderate hypermethylation | |||
| Interaction Name | DNMT-GSTA1 interaction | ||||
| The Methylation Level of Disease Section Compare with the Healthy Individual Tissue | Moderate hypermethylation p-value: 2.41E-05; delta-beta: 2.56E-01 | ||||
| Description | DNA methyltransferase (DNMT) is reported to moderatly hyper-methylate the GSTA1 gene, which leads to a moderatly decreased expression of the drug-metabolizing enzyme Glutathione S-transferase alpha-1. As a result, the interaction between DNMT and GSTA1 can moderatly affect the drug-metabolizing process of Glutathione S-transferase alpha-1. | ||||
|
DME methylation in the diseased tissue of patients
DME methylation in the normal tissue of healthy individuals
|
|||||
| Violin Diagram of DME Disease-specific Methylation Level |
|
Click to View the Clearer Original Diagram | |||
| ICD Disease Classification 05 Endocrine/nutritional/metabolic diseases | |||||
| ICD-11: 5A61 Pituitary gland hypofunction | Click to Show/Hide the Full List of HOSPPI: 1 HOSPPI | ||||
| DNA methylation | |||||
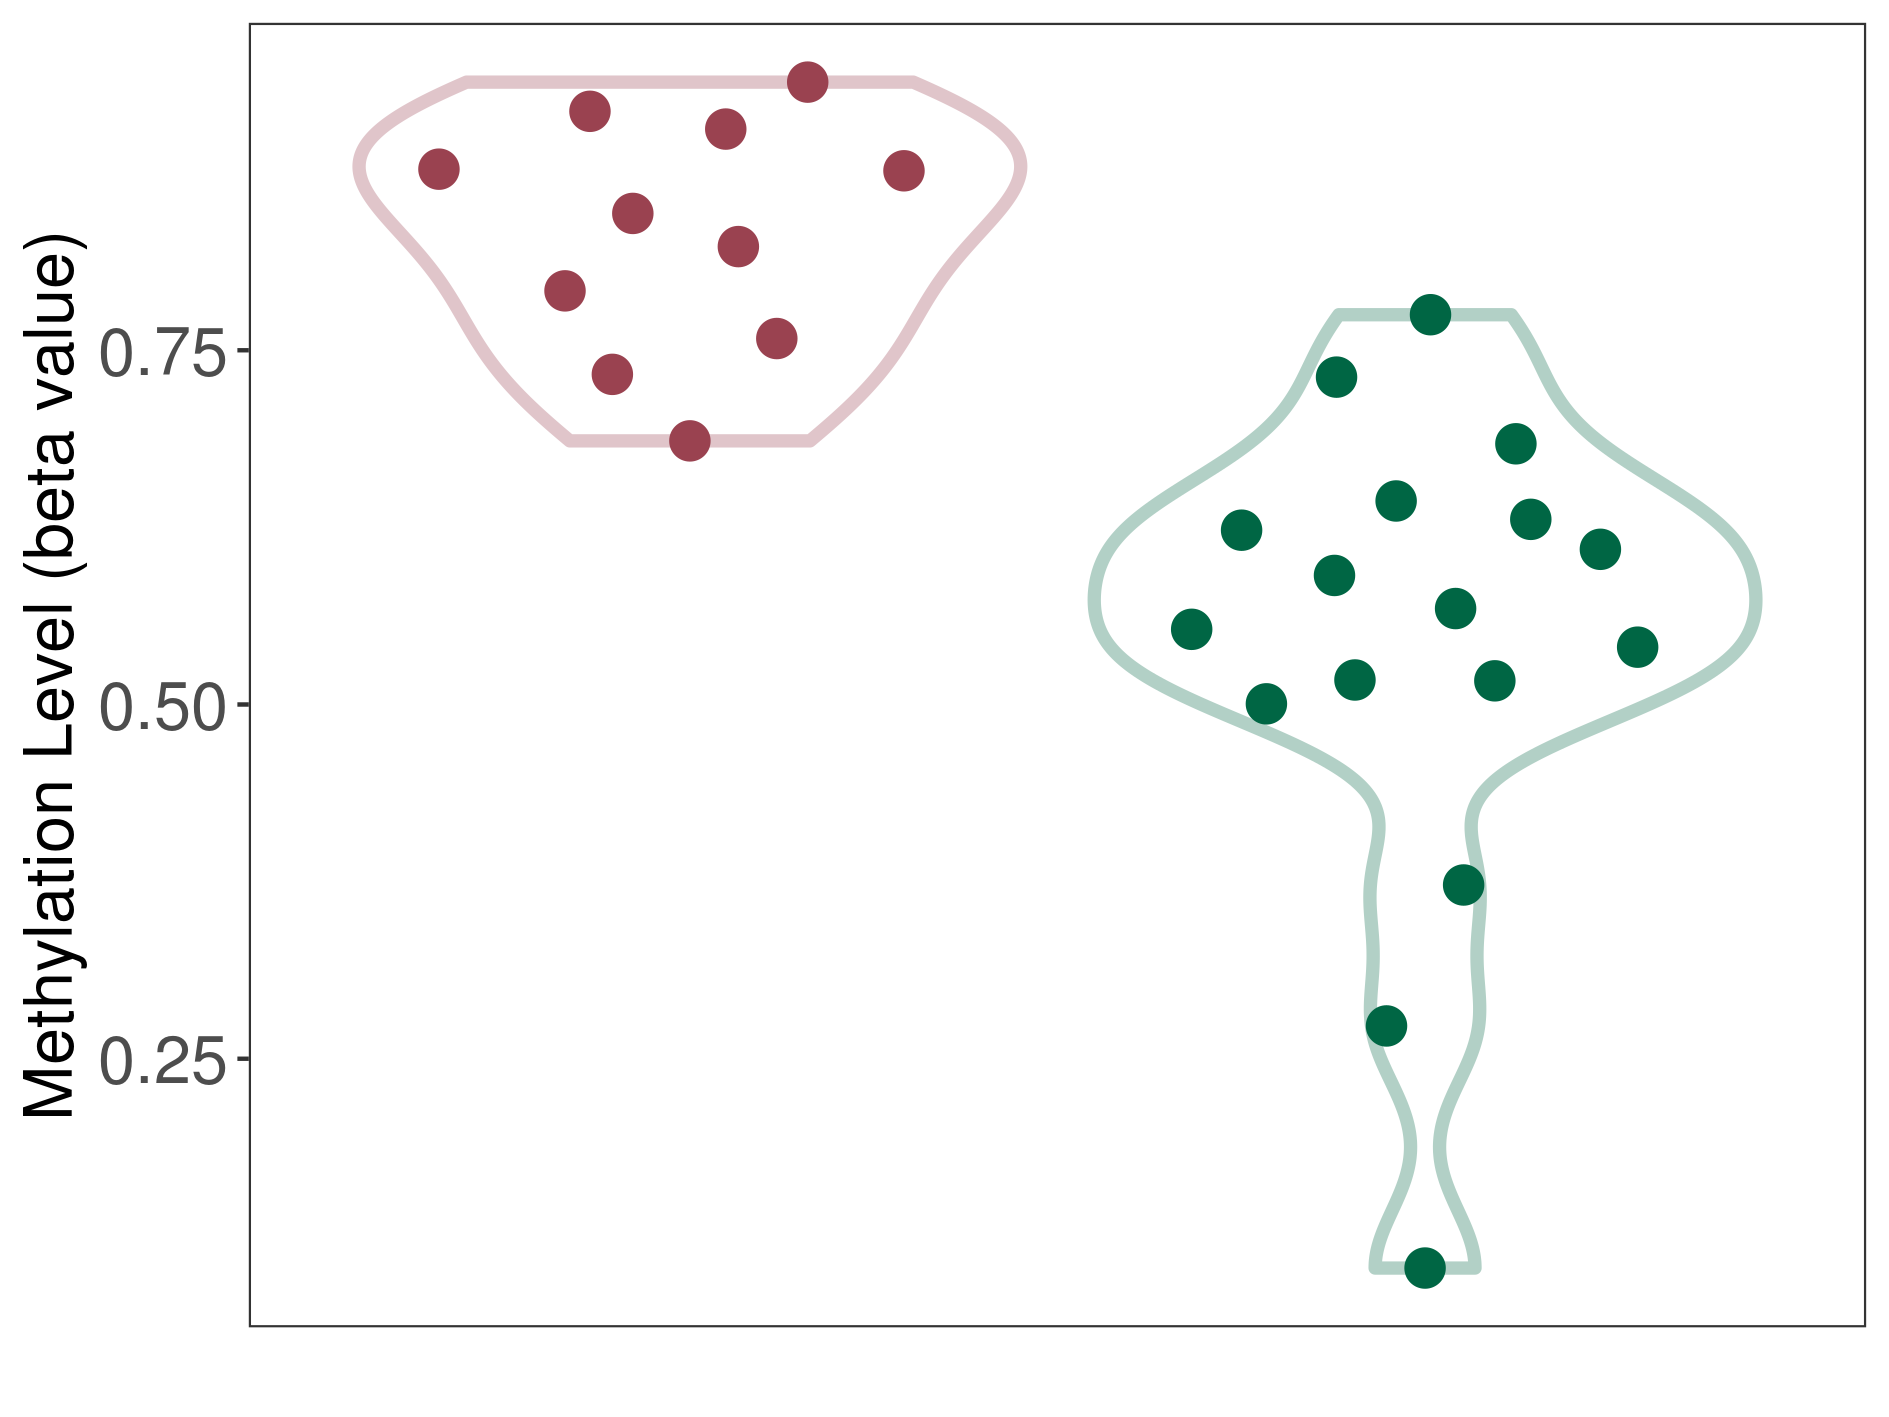
| DNA methyltransferase (DNMT) | Chordoma | Moderate hypermethylation | |||
| Interaction Name | DNMT-GSTA1 interaction | ||||
| The Methylation Level of Disease Section Compare with the Healthy Individual Tissue | Moderate hypermethylation p-value: 2.17E-06; delta-beta: 2.79E-01 | ||||
| Description | DNA methyltransferase (DNMT) is reported to moderatly hyper-methylate the GSTA1 gene, which leads to a moderatly decreased expression of the drug-metabolizing enzyme Glutathione S-transferase alpha-1. As a result, the interaction between DNMT and GSTA1 can moderatly affect the drug-metabolizing process of Glutathione S-transferase alpha-1. | ||||
|
DME methylation in the diseased tissue of patients
DME methylation in the normal tissue of healthy individuals
|
|||||
| Violin Diagram of DME Disease-specific Methylation Level |
|
Click to View the Clearer Original Diagram | |||
| ICD Disease Classification 11 Circulatory system diseases | |||||
| ICD-11: BD51 Arterial aneurysm | Click to Show/Hide the Full List of HOSPPI: 1 HOSPPI | ||||
| DNA methylation | |||||
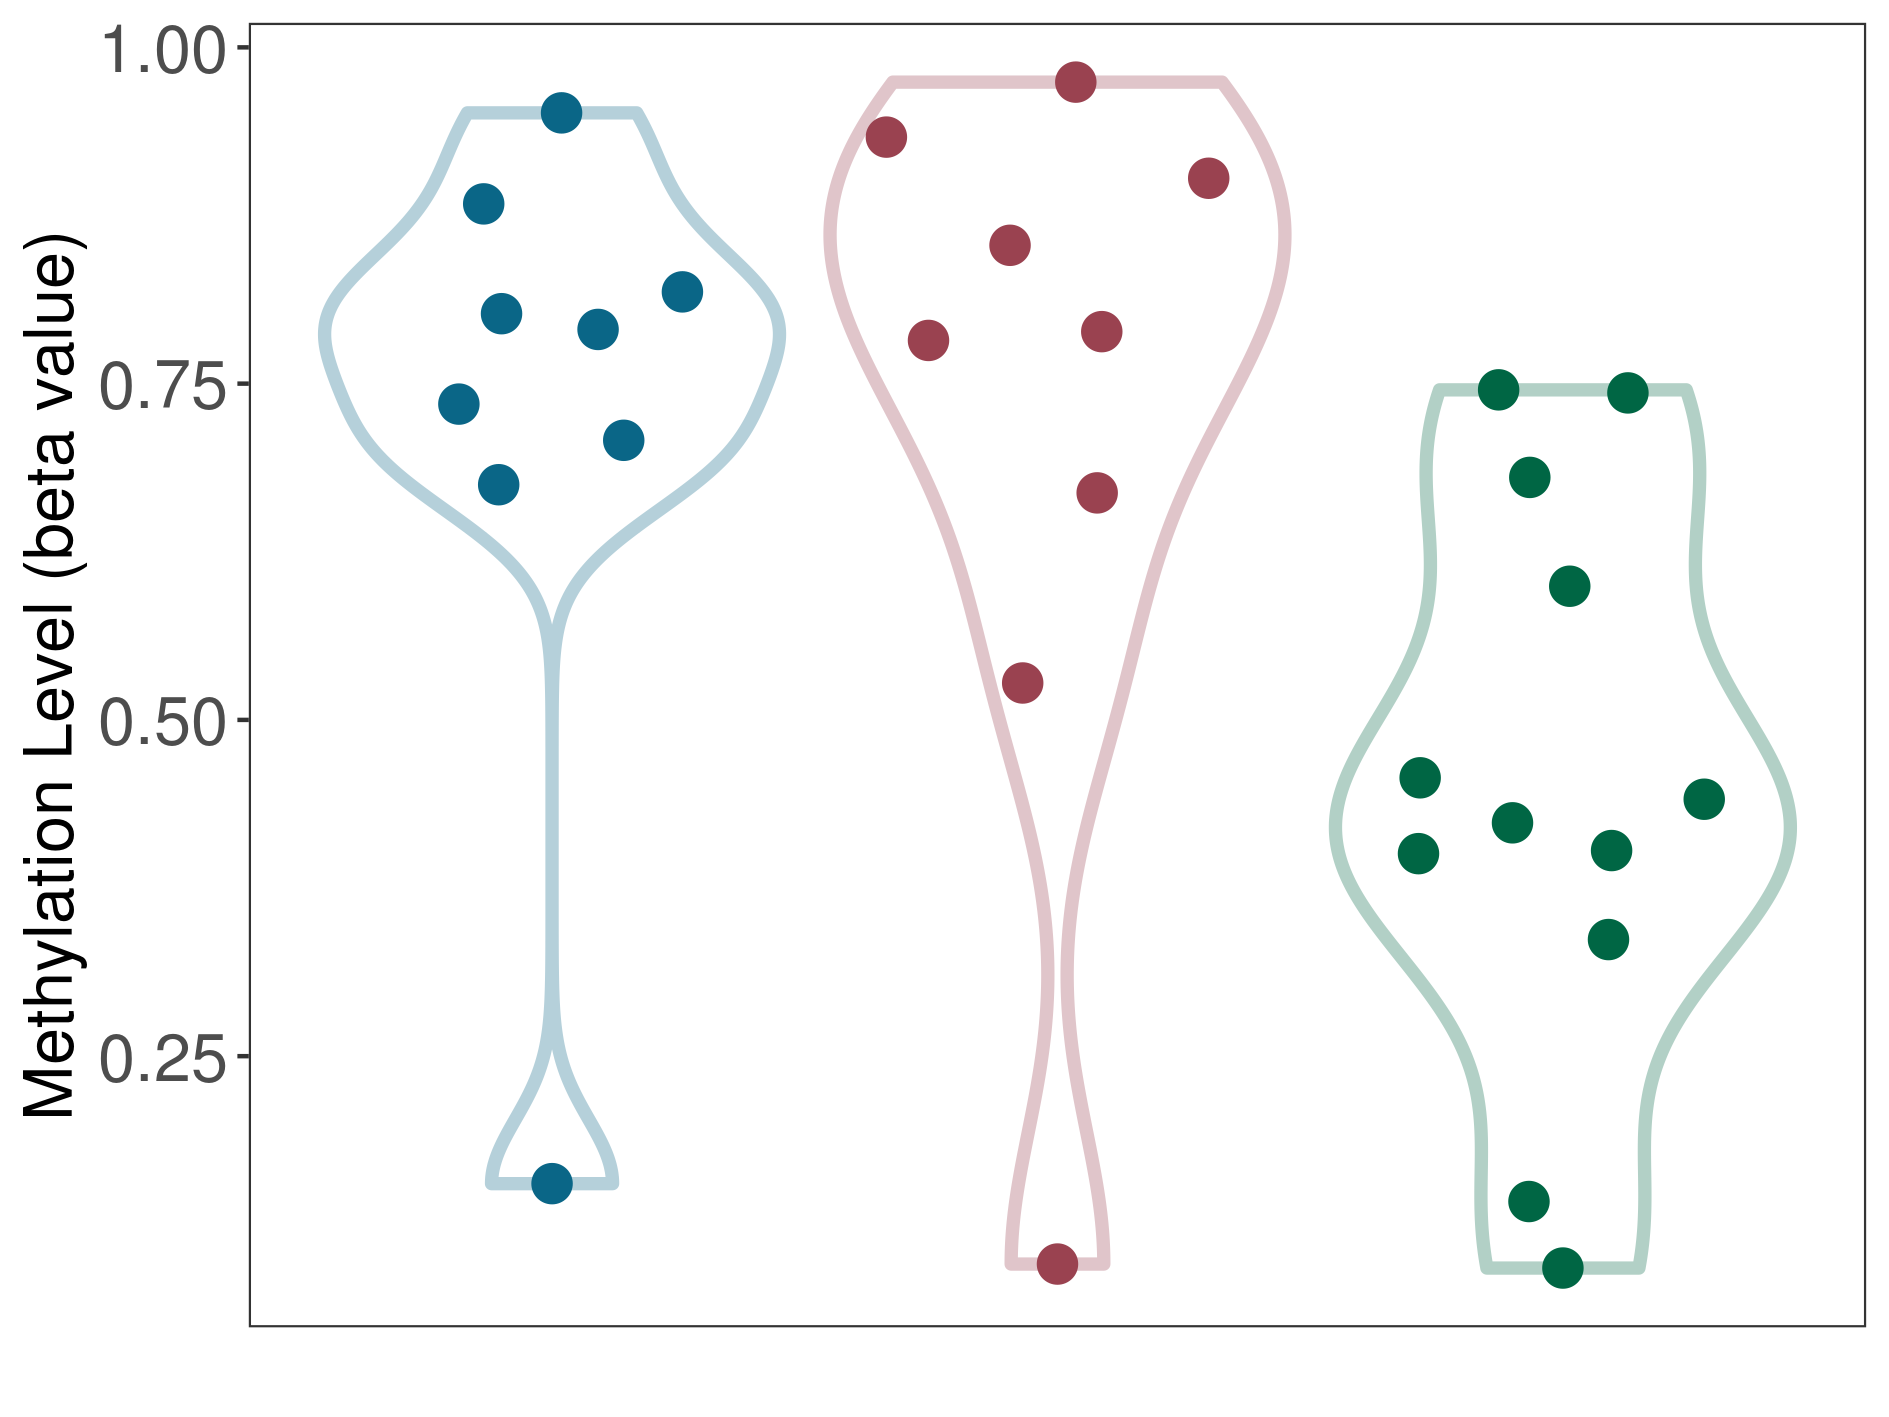
| DNA methyltransferase (DNMT) | Arterial aneurysm | Significant hypermethylation | |||
| Interaction Name | DNMT-GSTA1 interaction | ||||
| The Methylation Level of Disease Section Compare with the Healthy Individual Tissue | Significant hypermethylation p-value: 2.69E-02; delta-beta: 3.56E-01 | ||||
| Description | DNA methyltransferase (DNMT) is reported to significantly hyper-methylate the GSTA1 gene, which leads to a significantly decreased expression of the drug-metabolizing enzyme Glutathione S-transferase alpha-1. As a result, the interaction between DNMT and GSTA1 can significantly affect the drug-metabolizing process of Glutathione S-transferase alpha-1. | ||||
|
DME methylation in the diseased tissue of patients
DME methylation in the normal tissue adjacent to the diseased tissue of patients
DME methylation in the normal tissue of healthy individuals
|
|||||
| Violin Diagram of DME Disease-specific Methylation Level |
|
Click to View the Clearer Original Diagram | |||
If you find any error in data or bug in web service, please kindly report it to Dr. Yin and Dr. Li.

