

Details of Host Protein-DME Interaction (HOSPPI)
| General Information of Drug-Metabolizing Enzyme (DME ID: DME0052) | |||||
|---|---|---|---|---|---|
| DME Name | Aldehyde oxidase (AOX1), Homo sapiens | DME Info | |||
| UniProt ID | |||||
| EC Number | EC: 1.2.3.1 (Click to Show/Hide the Complete EC Tree) | ||||
| Lineage | Species: Homo sapiens (Click to Show/Hide the Complete Species Lineage) | ||||
| Interactome | |||||
| Disease Specific Interactions between Host Protein and DME (HOSPPI) | |||||
|---|---|---|---|---|---|
| ICD Disease Classification 02 Neoplasms | |||||
| ICD-11: 2A00 Brain cancer | Click to Show/Hide the Full List of HOSPPI: 3 HOSPPI | ||||
| DNA methylation | |||||
| DNA methyltransferase (DNMT) | Oligodendroglial tumour | Moderate hypermethylation | |||
| Interaction Name | DNMT-AOX1 interaction | ||||
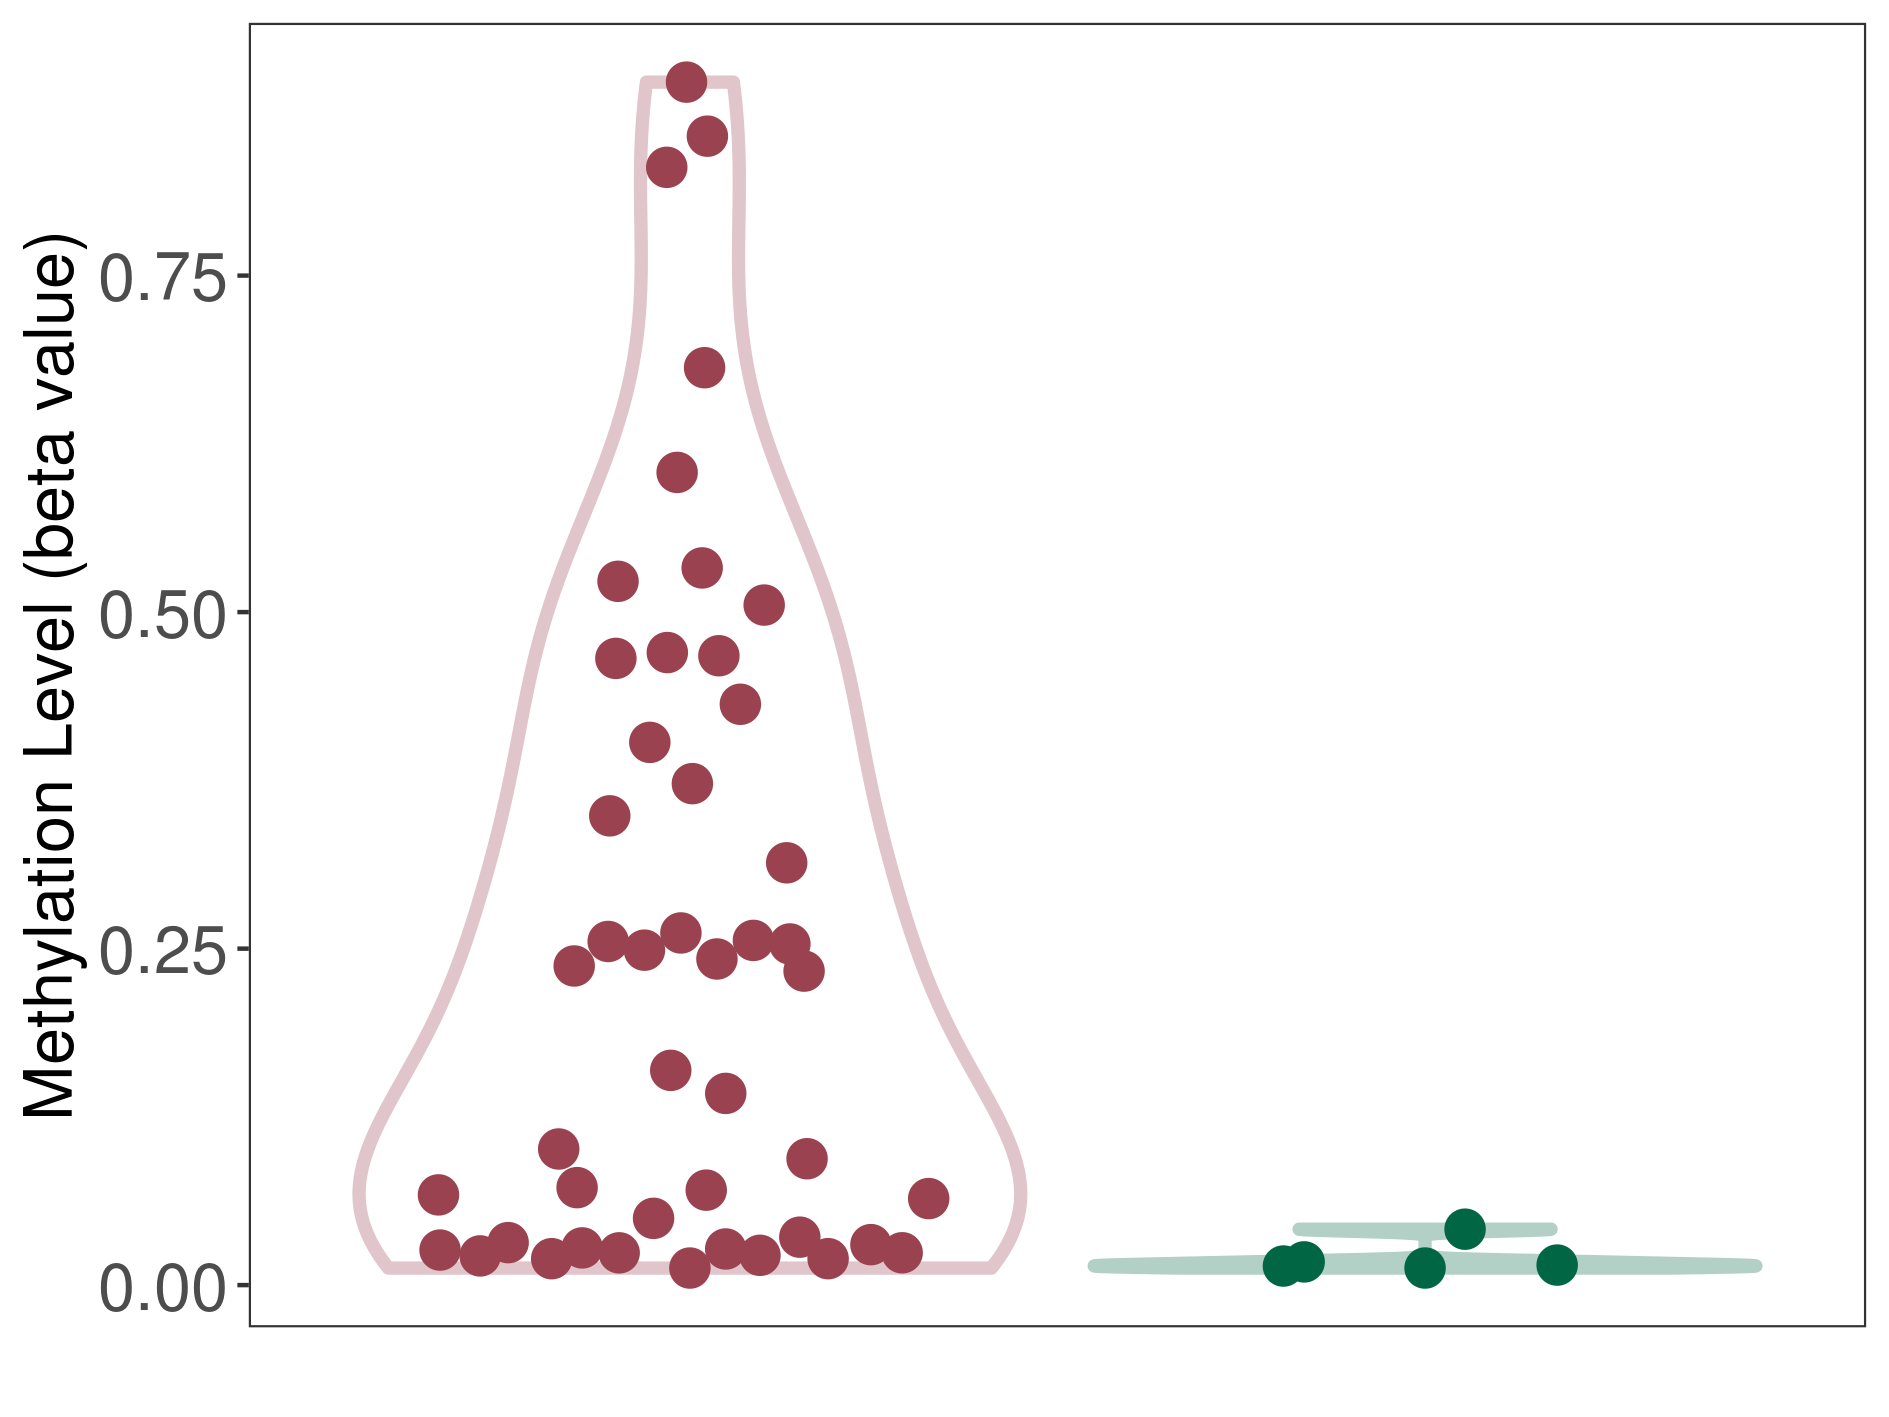
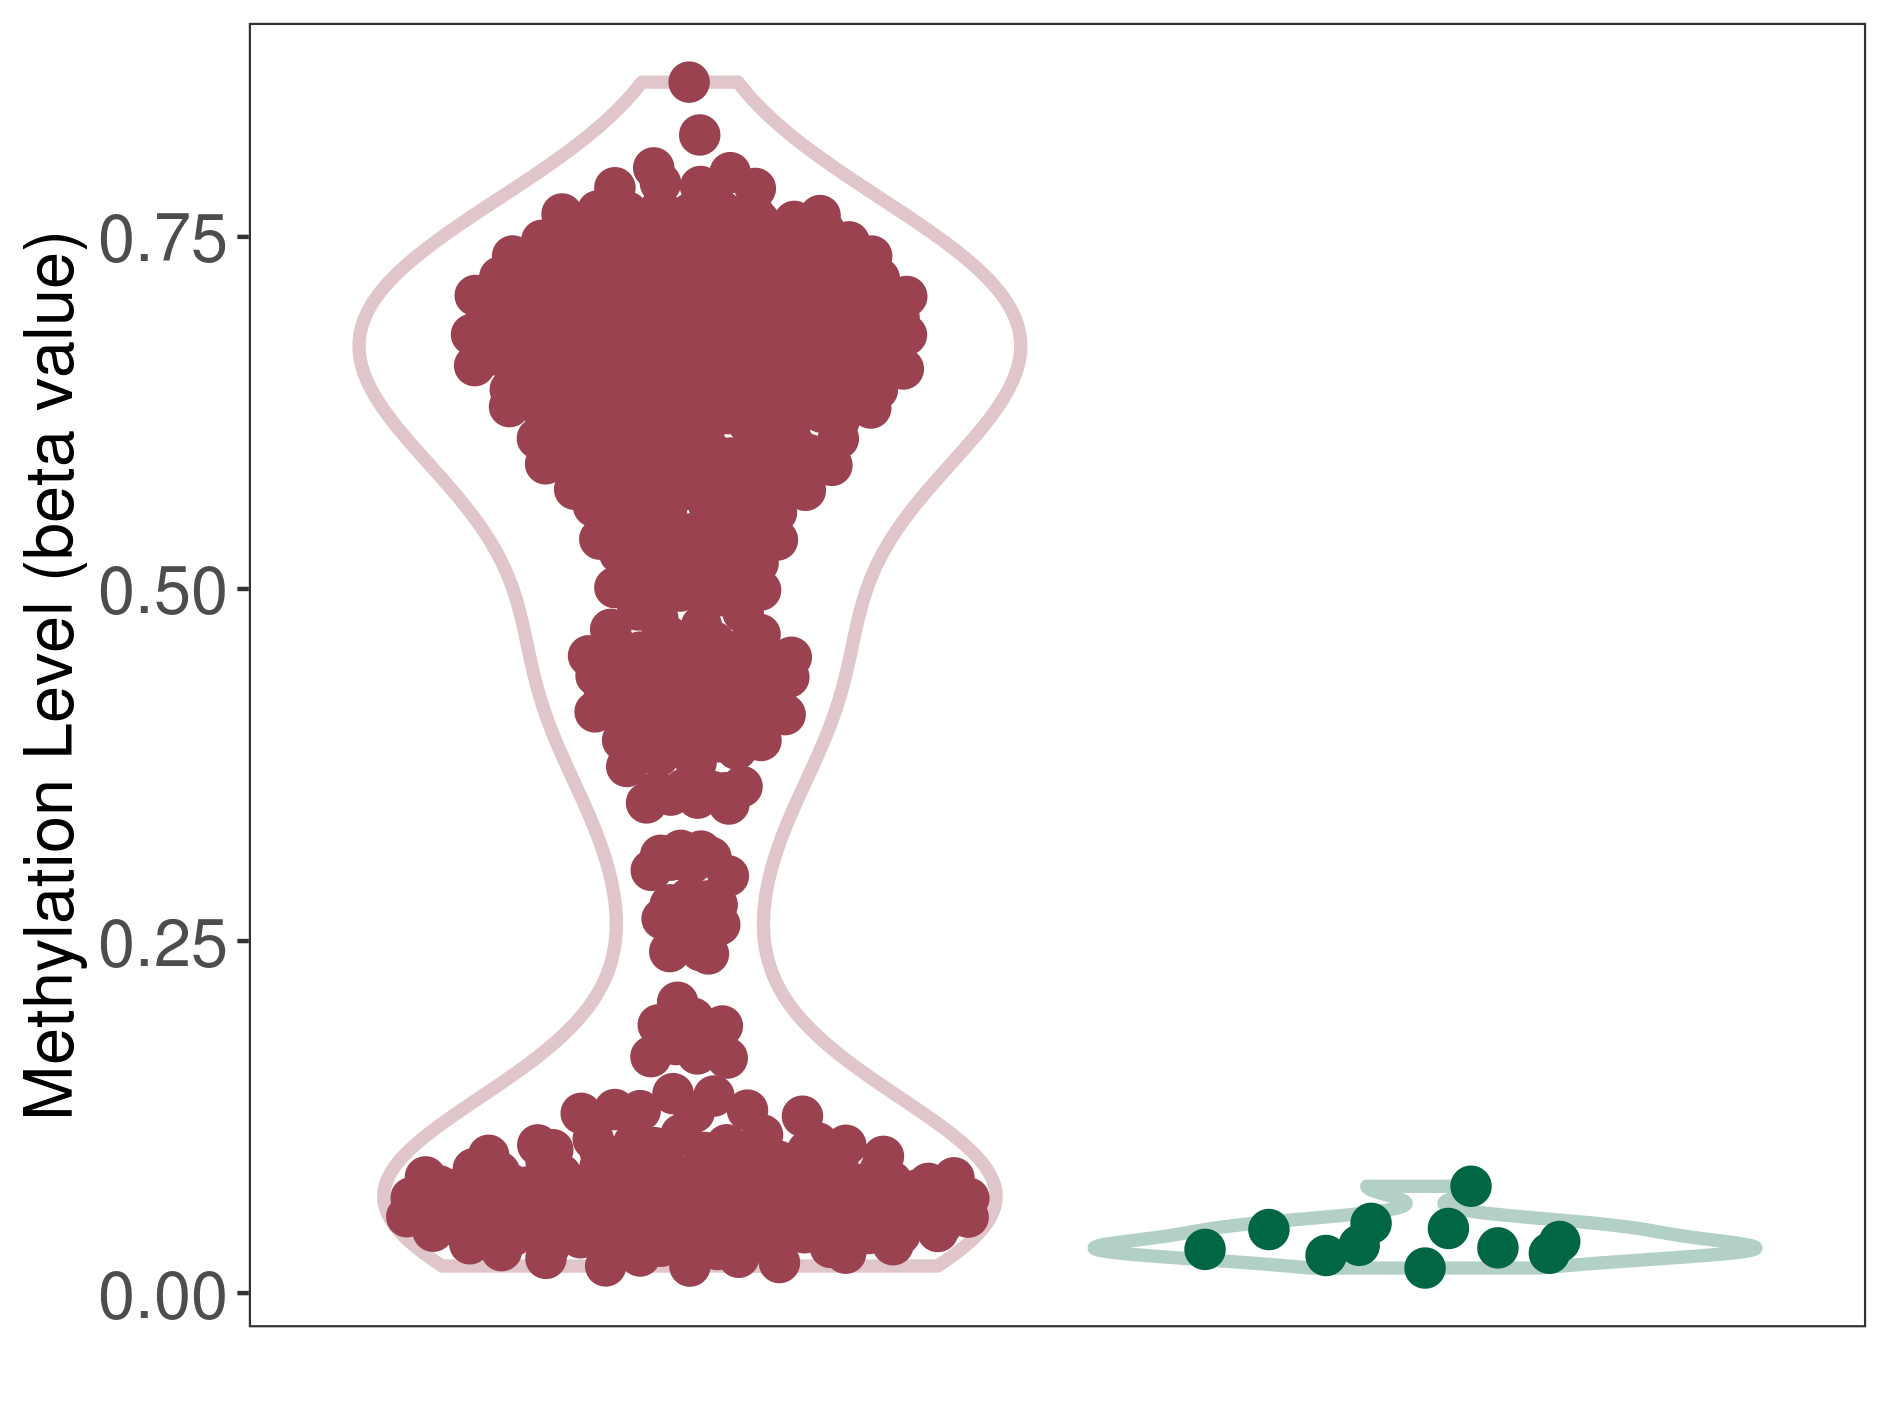
| The Methylation Level of Disease Section Compare with the Healthy Individual Tissue | Moderate hypermethylation p-value: 6.62E-08; delta-beta: 2.20E-01 | ||||
| Description | DNA methyltransferase (DNMT) is reported to moderatly hyper-methylate the AOX1 gene, which leads to a moderatly decreased expression of the drug-metabolizing enzyme Aldehyde oxidase. As a result, the interaction between DNMT and AOX1 can moderatly affect the drug-metabolizing process of Aldehyde oxidase. | ||||
|
DME methylation in the diseased tissue of patients
DME methylation in the normal tissue of healthy individuals
|
|||||
| Violin Diagram of DME Disease-specific Methylation Level |
|
Click to View the Clearer Original Diagram | |||
| DNA methyltransferase (DNMT) | Multilayered rosettes embryonal tumour | Significant hypermethylation | |||
| Interaction Name | DNMT-AOX1 interaction | ||||
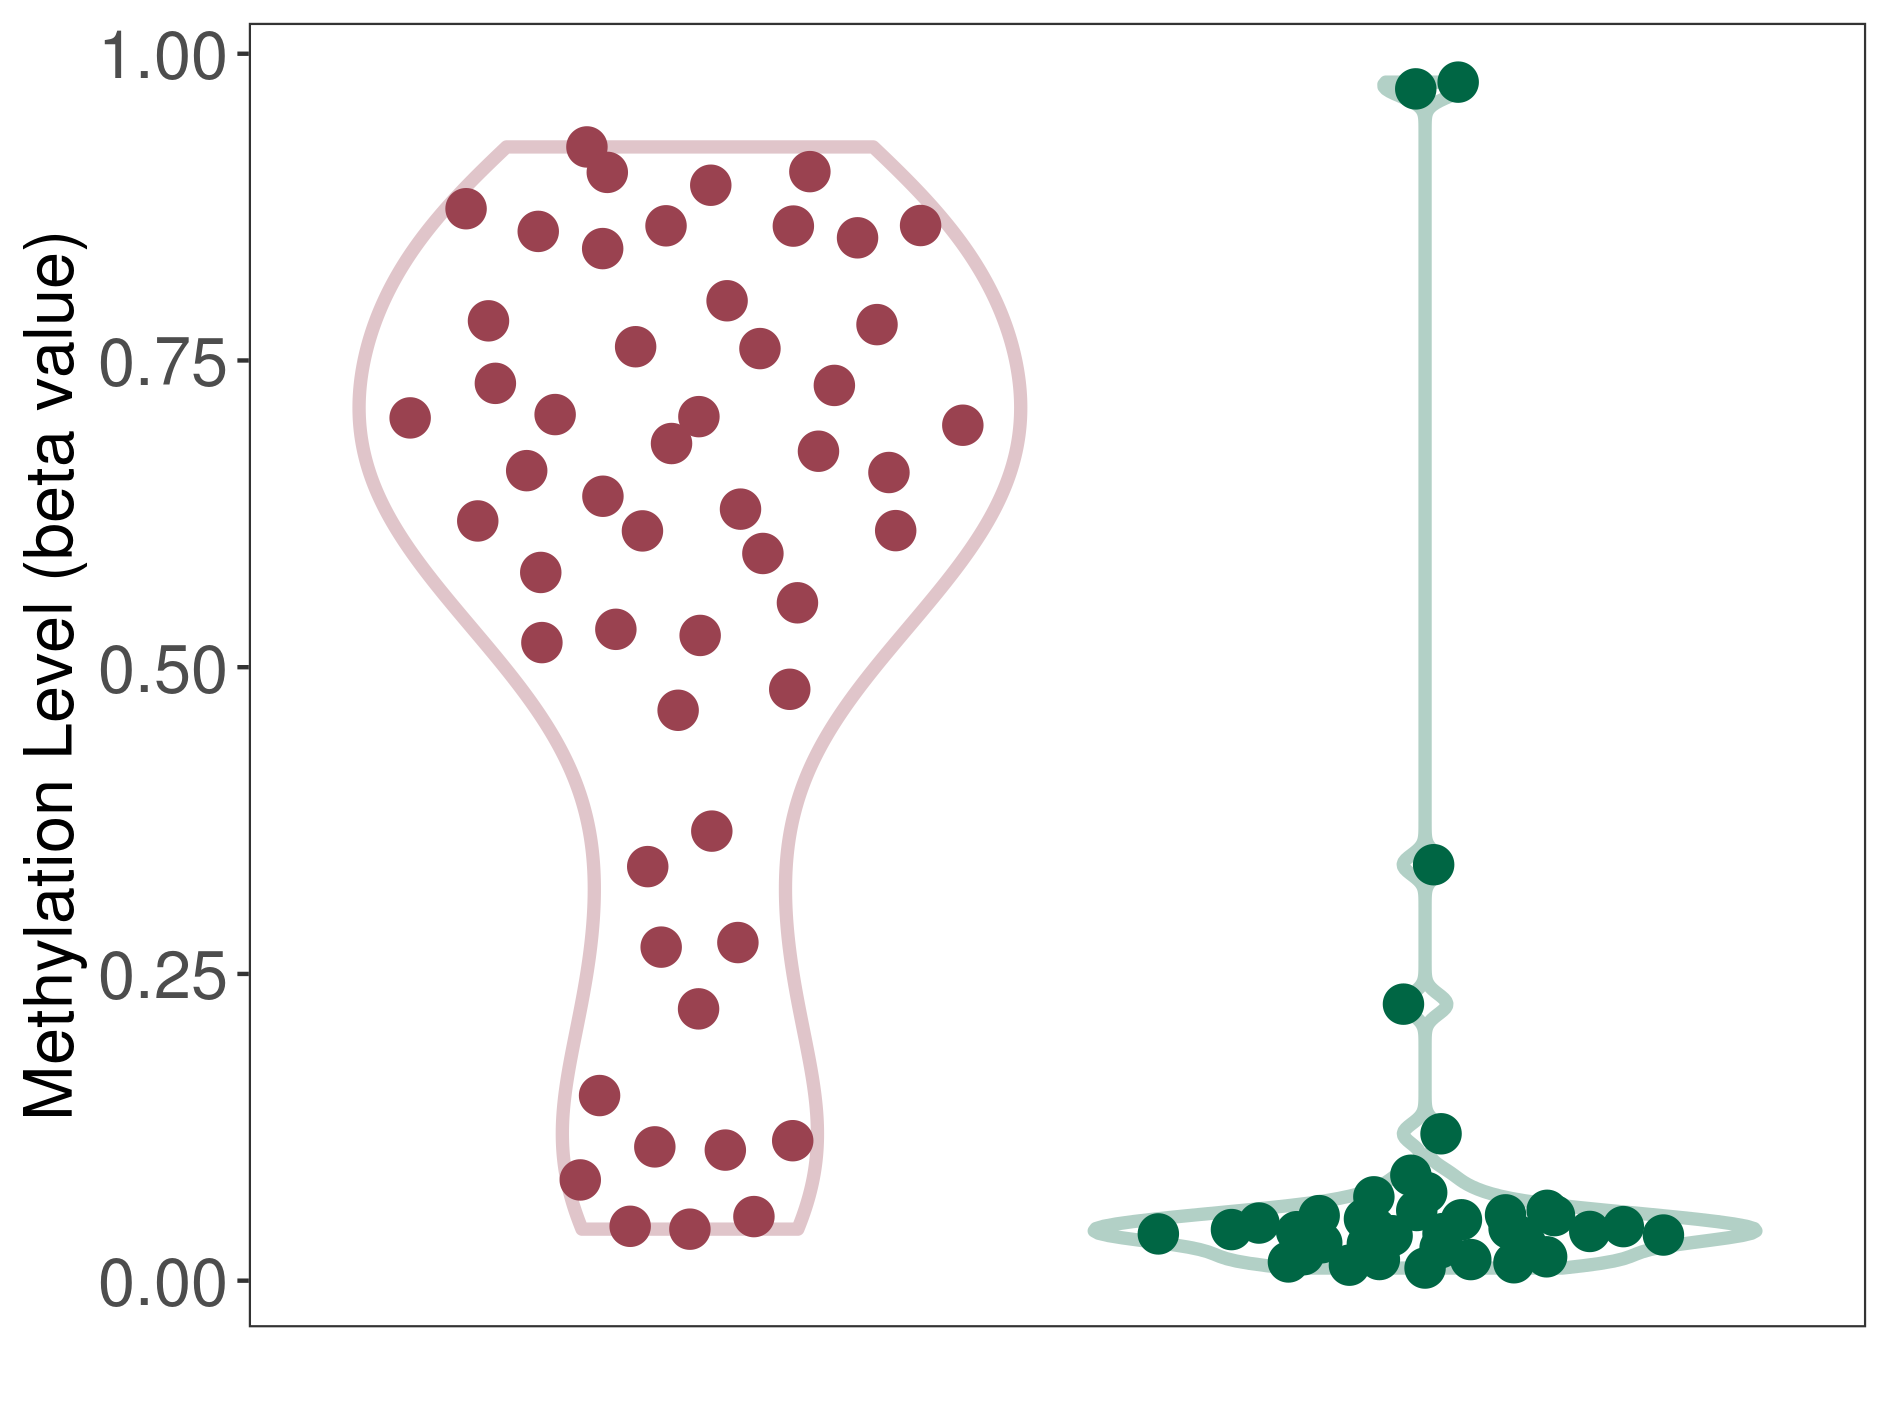
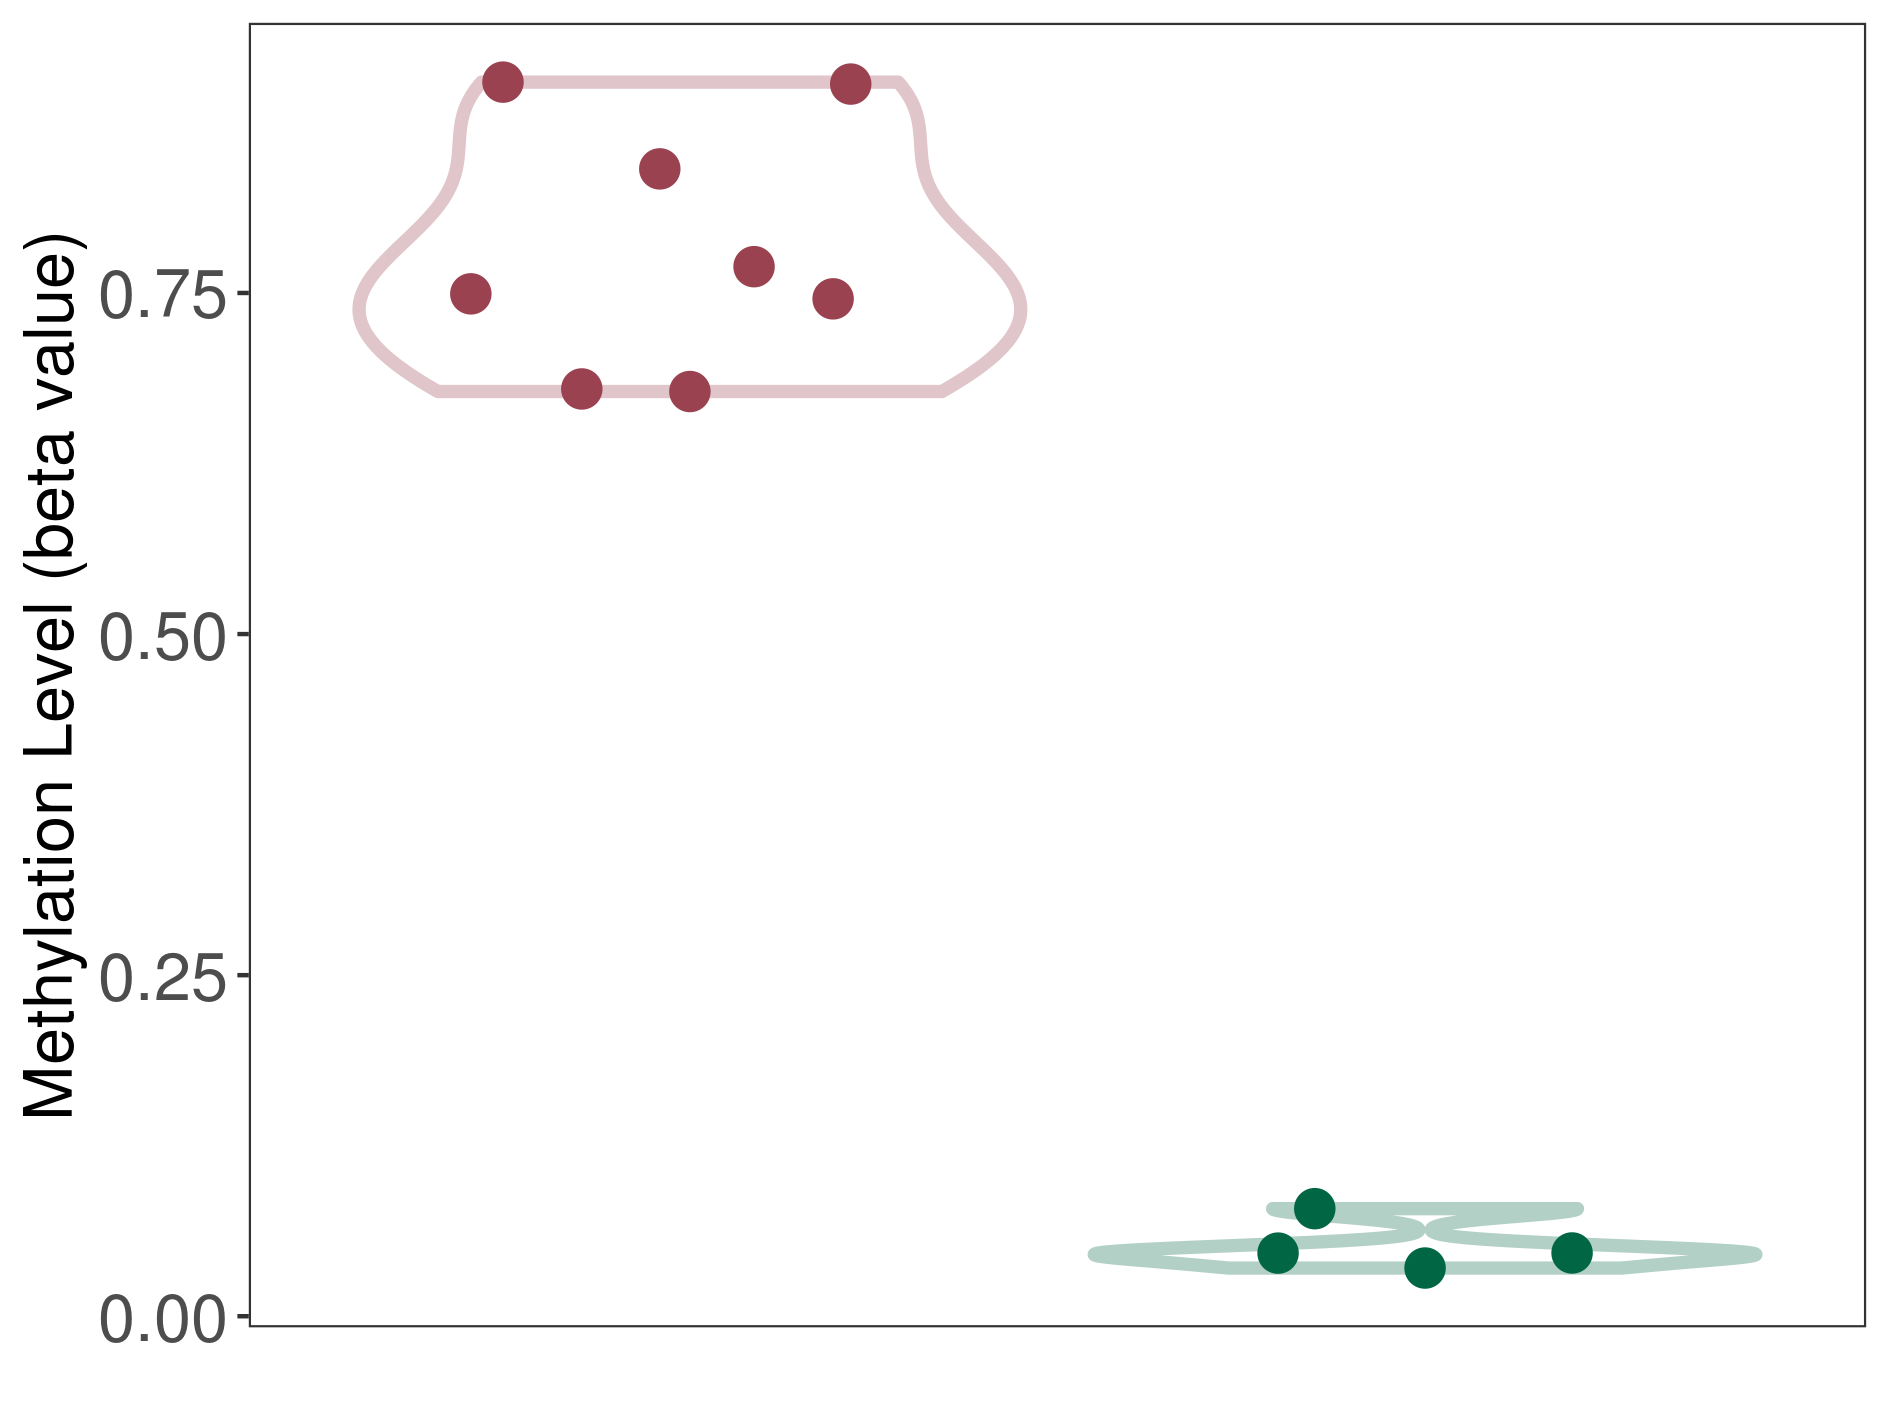
| The Methylation Level of Disease Section Compare with the Healthy Individual Tissue | Significant hypermethylation p-value: 6.68E-15; delta-beta: 6.07E-01 | ||||
| Description | DNA methyltransferase (DNMT) is reported to significantly hyper-methylate the AOX1 gene, which leads to a significantly decreased expression of the drug-metabolizing enzyme Aldehyde oxidase. As a result, the interaction between DNMT and AOX1 can significantly affect the drug-metabolizing process of Aldehyde oxidase. | ||||
|
DME methylation in the diseased tissue of patients
DME methylation in the normal tissue of healthy individuals
|
|||||
| Violin Diagram of DME Disease-specific Methylation Level |
|
Click to View the Clearer Original Diagram | |||
| DNA methyltransferase (DNMT) | Oligodendroglioma | Moderate hypermethylation | |||
| Interaction Name | DNMT-AOX1 interaction | ||||
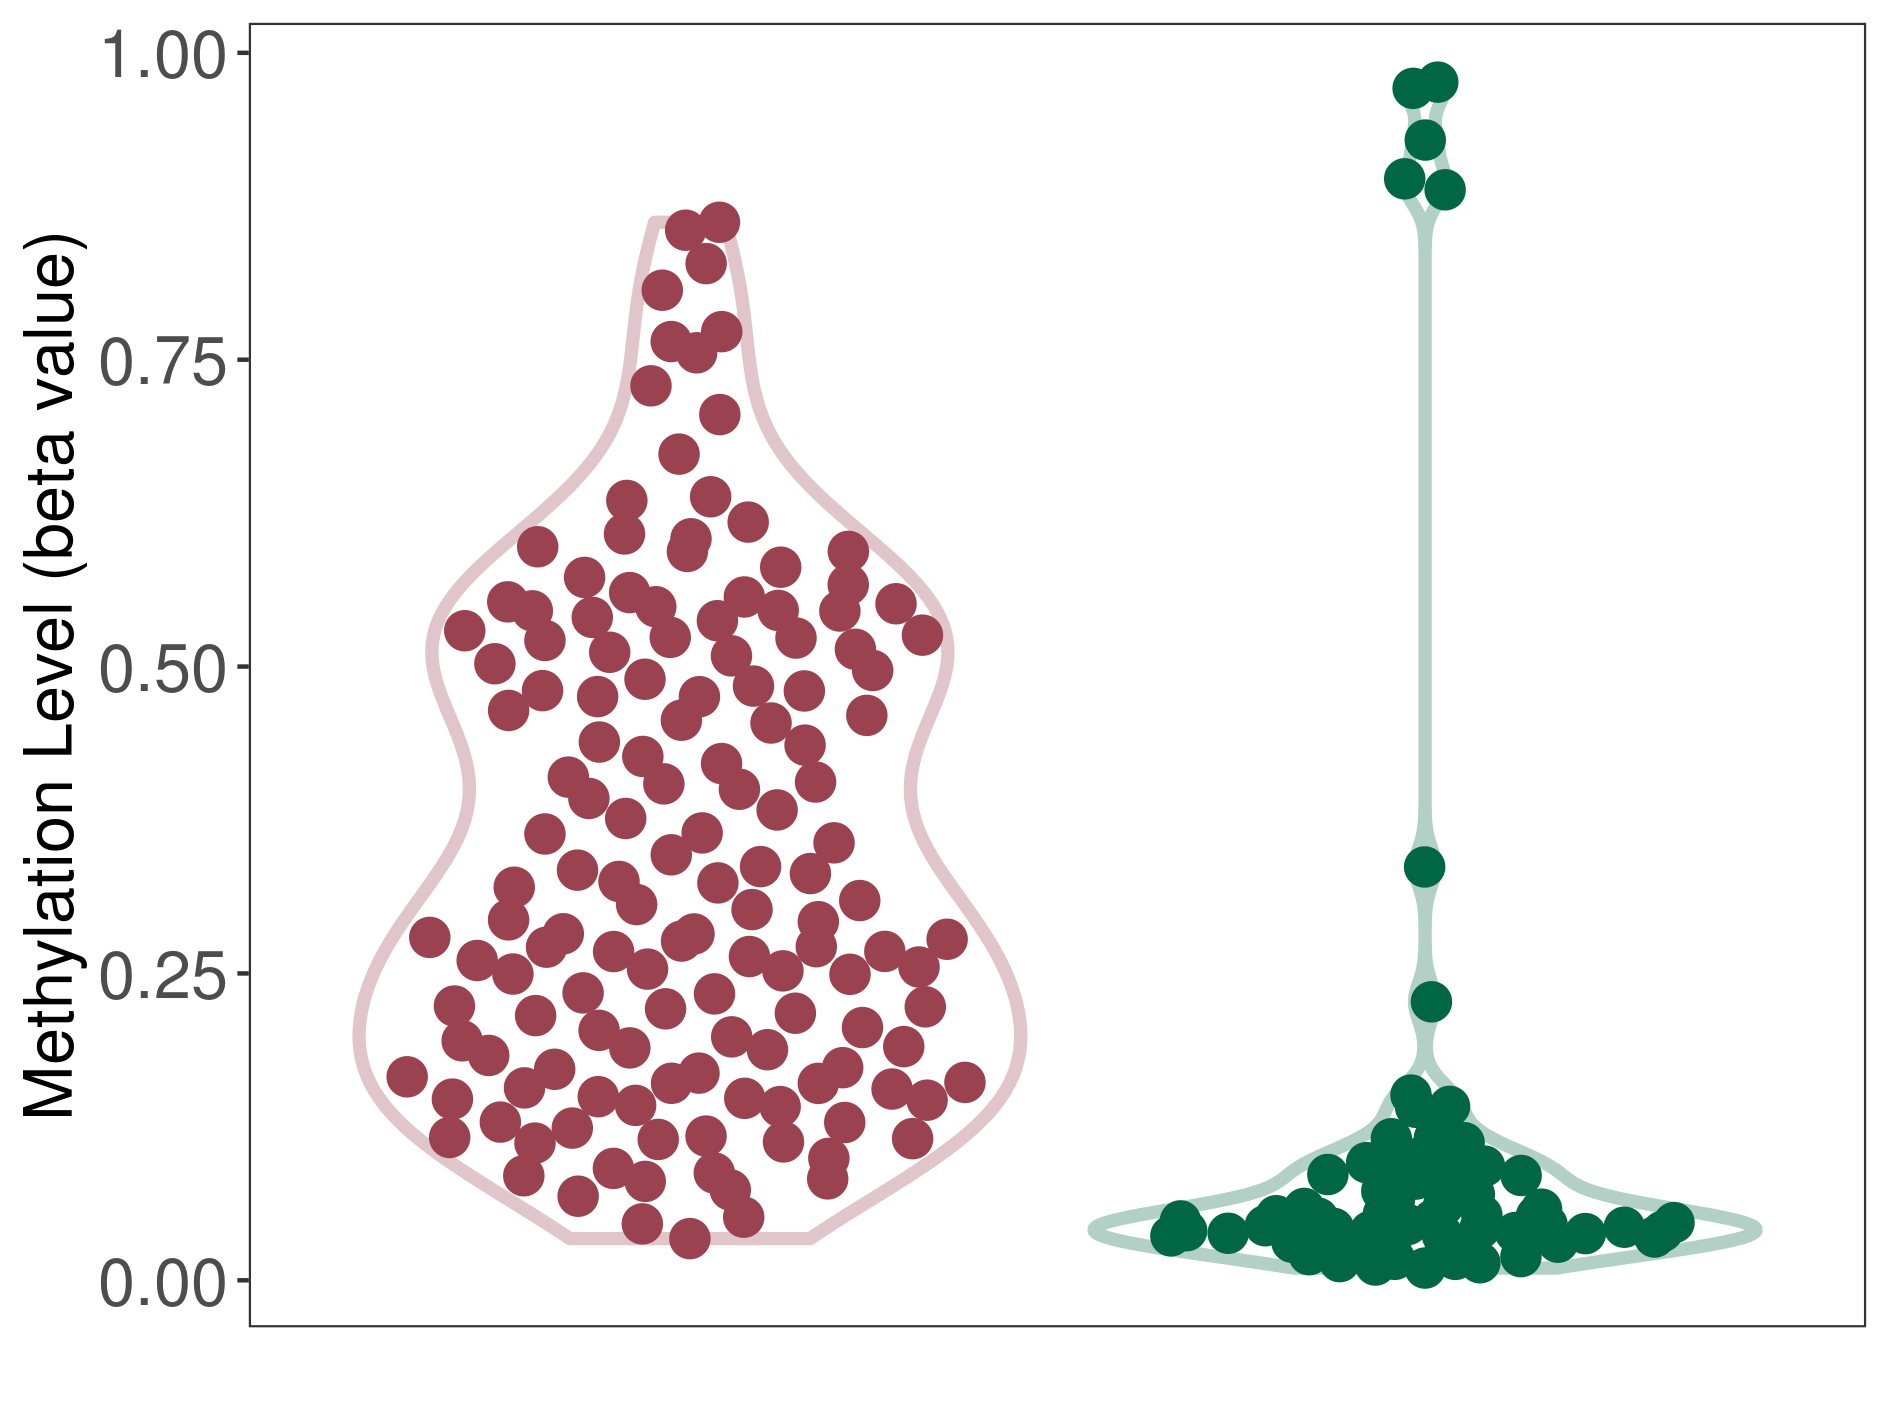
| The Methylation Level of Disease Section Compare with the Healthy Individual Tissue | Moderate hypermethylation p-value: 6.13E-10; delta-beta: 2.70E-01 | ||||
| Description | DNA methyltransferase (DNMT) is reported to moderatly hyper-methylate the AOX1 gene, which leads to a moderatly decreased expression of the drug-metabolizing enzyme Aldehyde oxidase. As a result, the interaction between DNMT and AOX1 can moderatly affect the drug-metabolizing process of Aldehyde oxidase. | ||||
|
DME methylation in the diseased tissue of patients
DME methylation in the normal tissue of healthy individuals
|
|||||
| Violin Diagram of DME Disease-specific Methylation Level |
|
Click to View the Clearer Original Diagram | |||
| ICD-11: 2B30 Lymphoma | Click to Show/Hide the Full List of HOSPPI: 1 HOSPPI | ||||
| DNA methylation | |||||
| DNA methyltransferase (DNMT) | Lymphoma | Significant hypermethylation | |||
| Interaction Name | DNMT-AOX1 interaction | ||||
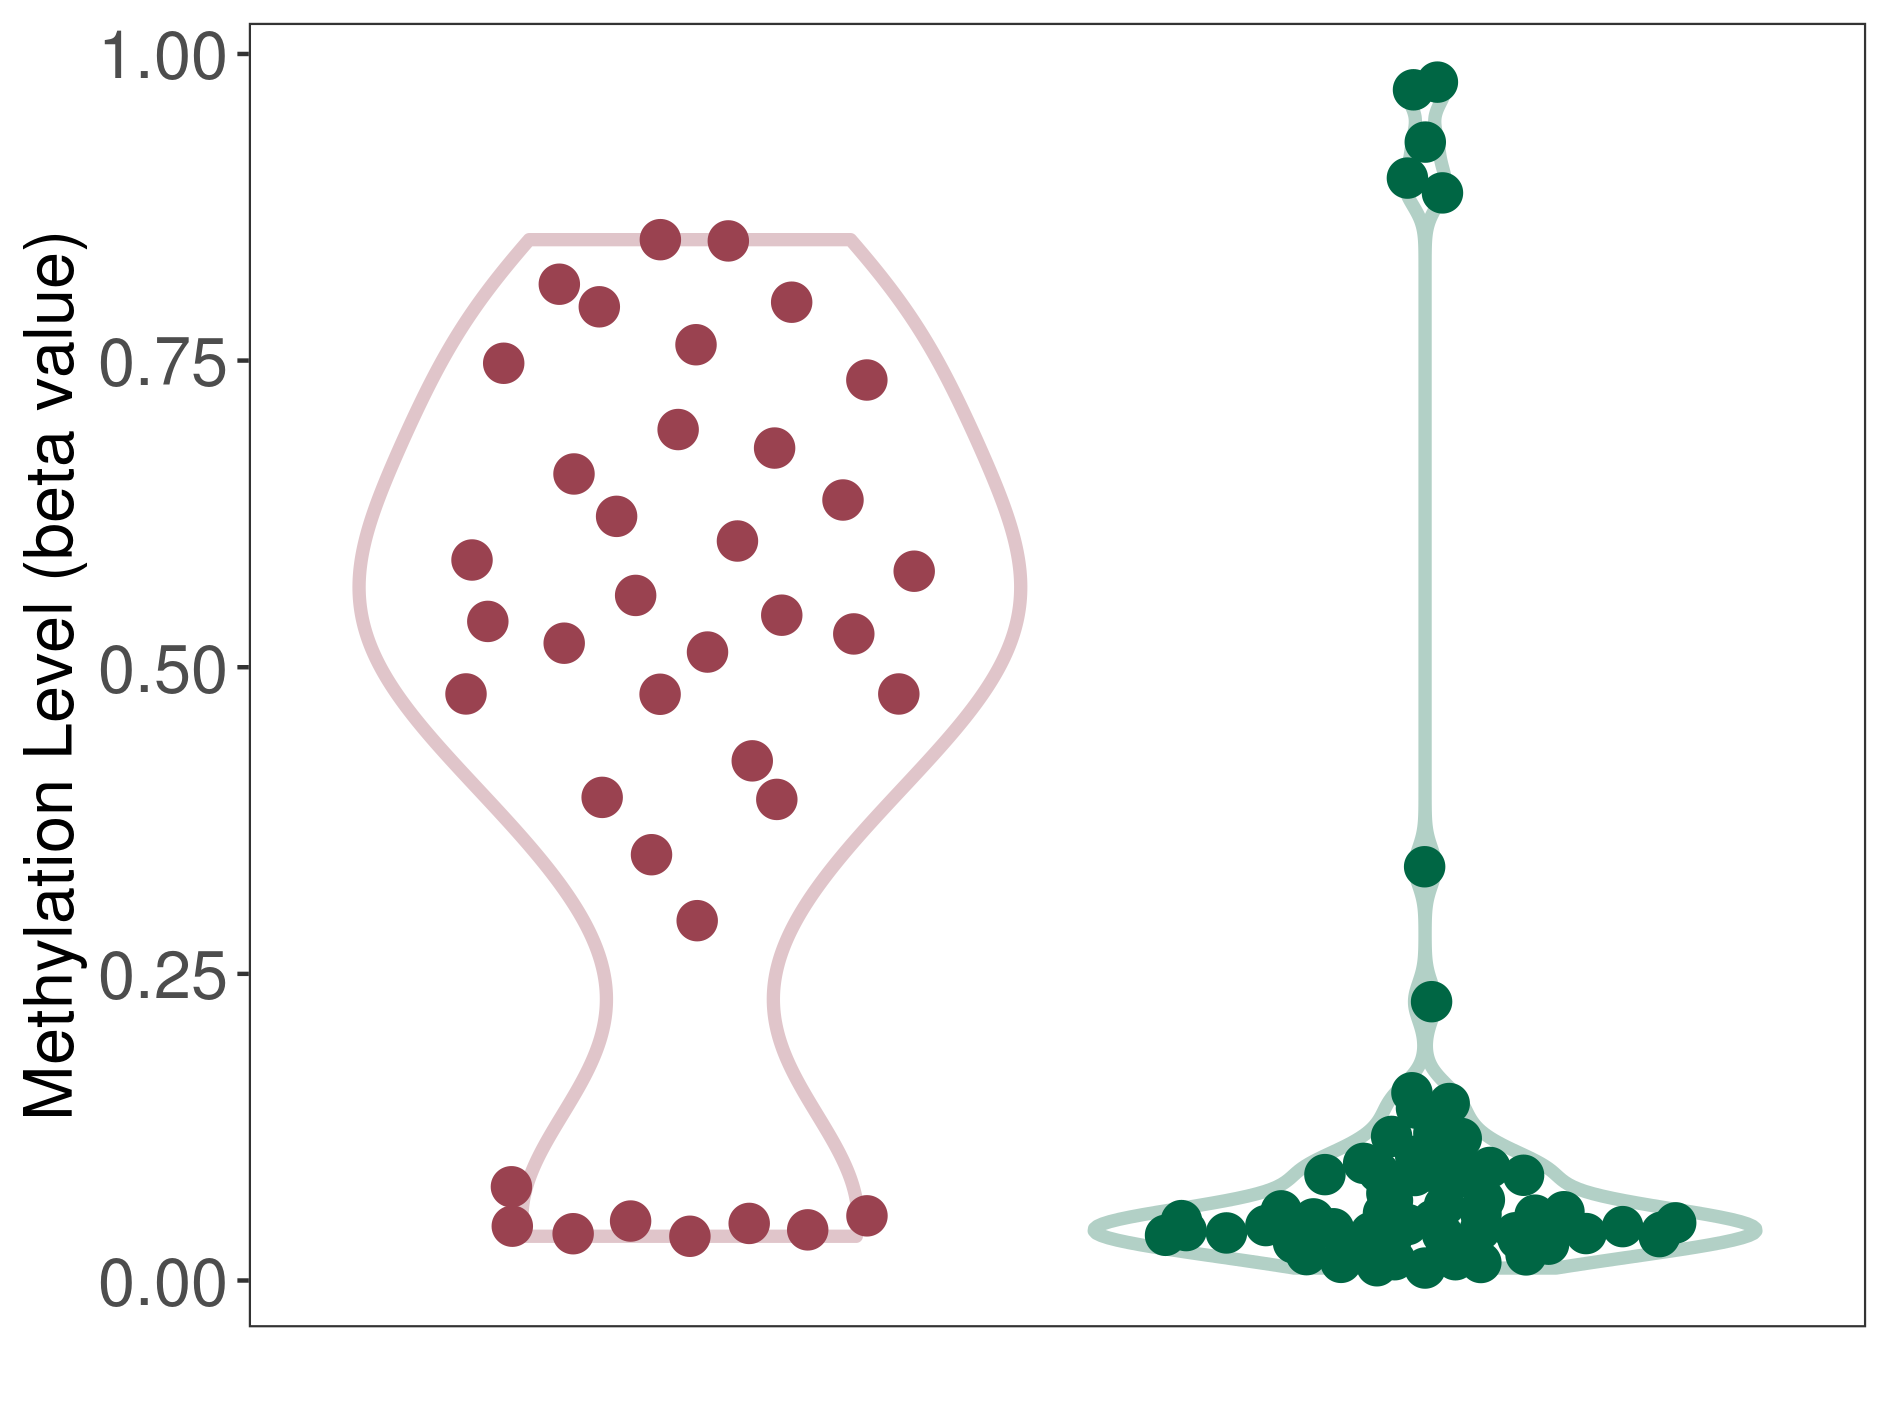
| The Methylation Level of Disease Section Compare with the Healthy Individual Tissue | Significant hypermethylation p-value: 2.77E-09; delta-beta: 4.82E-01 | ||||
| Description | DNA methyltransferase (DNMT) is reported to significantly hyper-methylate the AOX1 gene, which leads to a significantly decreased expression of the drug-metabolizing enzyme Aldehyde oxidase. As a result, the interaction between DNMT and AOX1 can significantly affect the drug-metabolizing process of Aldehyde oxidase. | ||||
|
DME methylation in the diseased tissue of patients
DME methylation in the normal tissue of healthy individuals
|
|||||
| Violin Diagram of DME Disease-specific Methylation Level |
|
Click to View the Clearer Original Diagram | |||
| ICD-11: 2C82 Prostate cancer | Click to Show/Hide the Full List of HOSPPI: 1 HOSPPI | ||||
| DNA methylation | |||||
| DNA methyltransferase (DNMT) | Prostate cancer | Significant hypermethylation | |||
| Interaction Name | DNMT-AOX1 interaction | ||||
| The Methylation Level of Disease Section Compare with the Healthy Individual Tissue | Significant hypermethylation p-value: 2.98E-92; delta-beta: 4.36E-01 | ||||
| Description | DNA methyltransferase (DNMT) is reported to significantly hyper-methylate the AOX1 gene, which leads to a significantly decreased expression of the drug-metabolizing enzyme Aldehyde oxidase. As a result, the interaction between DNMT and AOX1 can significantly affect the drug-metabolizing process of Aldehyde oxidase. | ||||
|
DME methylation in the diseased tissue of patients
DME methylation in the normal tissue of healthy individuals
|
|||||
| Violin Diagram of DME Disease-specific Methylation Level |
|
Click to View the Clearer Original Diagram | |||
| ICD-11: 2E06 Prostate cancer metastasis | Click to Show/Hide the Full List of HOSPPI: 1 HOSPPI | ||||
| DNA methylation | |||||
| DNA methyltransferase (DNMT) | Prostate cancer metastasis | Significant hypermethylation | |||
| Interaction Name | DNMT-AOX1 interaction | ||||
| The Methylation Level of Disease Section Compare with the Healthy Individual Tissue | Significant hypermethylation p-value: 1.56E-08; delta-beta: 7.13E-01 | ||||
| Description | DNA methyltransferase (DNMT) is reported to significantly hyper-methylate the AOX1 gene, which leads to a significantly decreased expression of the drug-metabolizing enzyme Aldehyde oxidase. As a result, the interaction between DNMT and AOX1 can significantly affect the drug-metabolizing process of Aldehyde oxidase. | ||||
|
DME methylation in the diseased tissue of patients
DME methylation in the normal tissue of healthy individuals
|
|||||
| Violin Diagram of DME Disease-specific Methylation Level |
|
Click to View the Clearer Original Diagram | |||
If you find any error in data or bug in web service, please kindly report it to Dr. Yin and Dr. Li.