Details of Host Protein-DME Interaction (HOSPPI)
| General Information of Drug-Metabolizing Enzyme (DME ID: DME0097) | |||||
|---|---|---|---|---|---|
| DME Name | Quinone reductase 1 (NQO1), Homo sapiens | DME Info | |||
| UniProt ID | |||||
| EC Number | EC: 1.6.5.2 (Click to Show/Hide the Complete EC Tree) | ||||
| Lineage | Species: Homo sapiens (Click to Show/Hide the Complete Species Lineage) | ||||
| Interactome | |||||
| Disease Specific Interactions between Host Protein and DME (HOSPPI) | |||||
|---|---|---|---|---|---|
| ICD Disease Classification Healthy | |||||
| ICD-11: Healthy | Click to Show/Hide the Full List of HOSPPI: 1 HOSPPI | ||||
| Histone modification | |||||
| Histone deacetylases (HDACs) | Health | Repression | |||
| Uniprot ID | |||||
| Interaction Name | HDACs-NQO1 interaction | [1] | |||
| Studied Cell Lines | Retinal tissues | ||||
| Description | Histone deacetylases (HDACs) are reported to deacetylate the NQO1 gene and thereby repress the transcriptional activity of the drug-metabolizing enzyme Quinone reductase 1. As a result, the interaction between HDACs and NQO1 can inhibit the drug-metabolizing process of Quinone reductase 1. | ||||
| ICD Disease Classification 02 Neoplasms | |||||
| ICD-11: 2A00 Brain cancer | Click to Show/Hide the Full List of HOSPPI: 4 HOSPPI | ||||
| DNA methylation | |||||
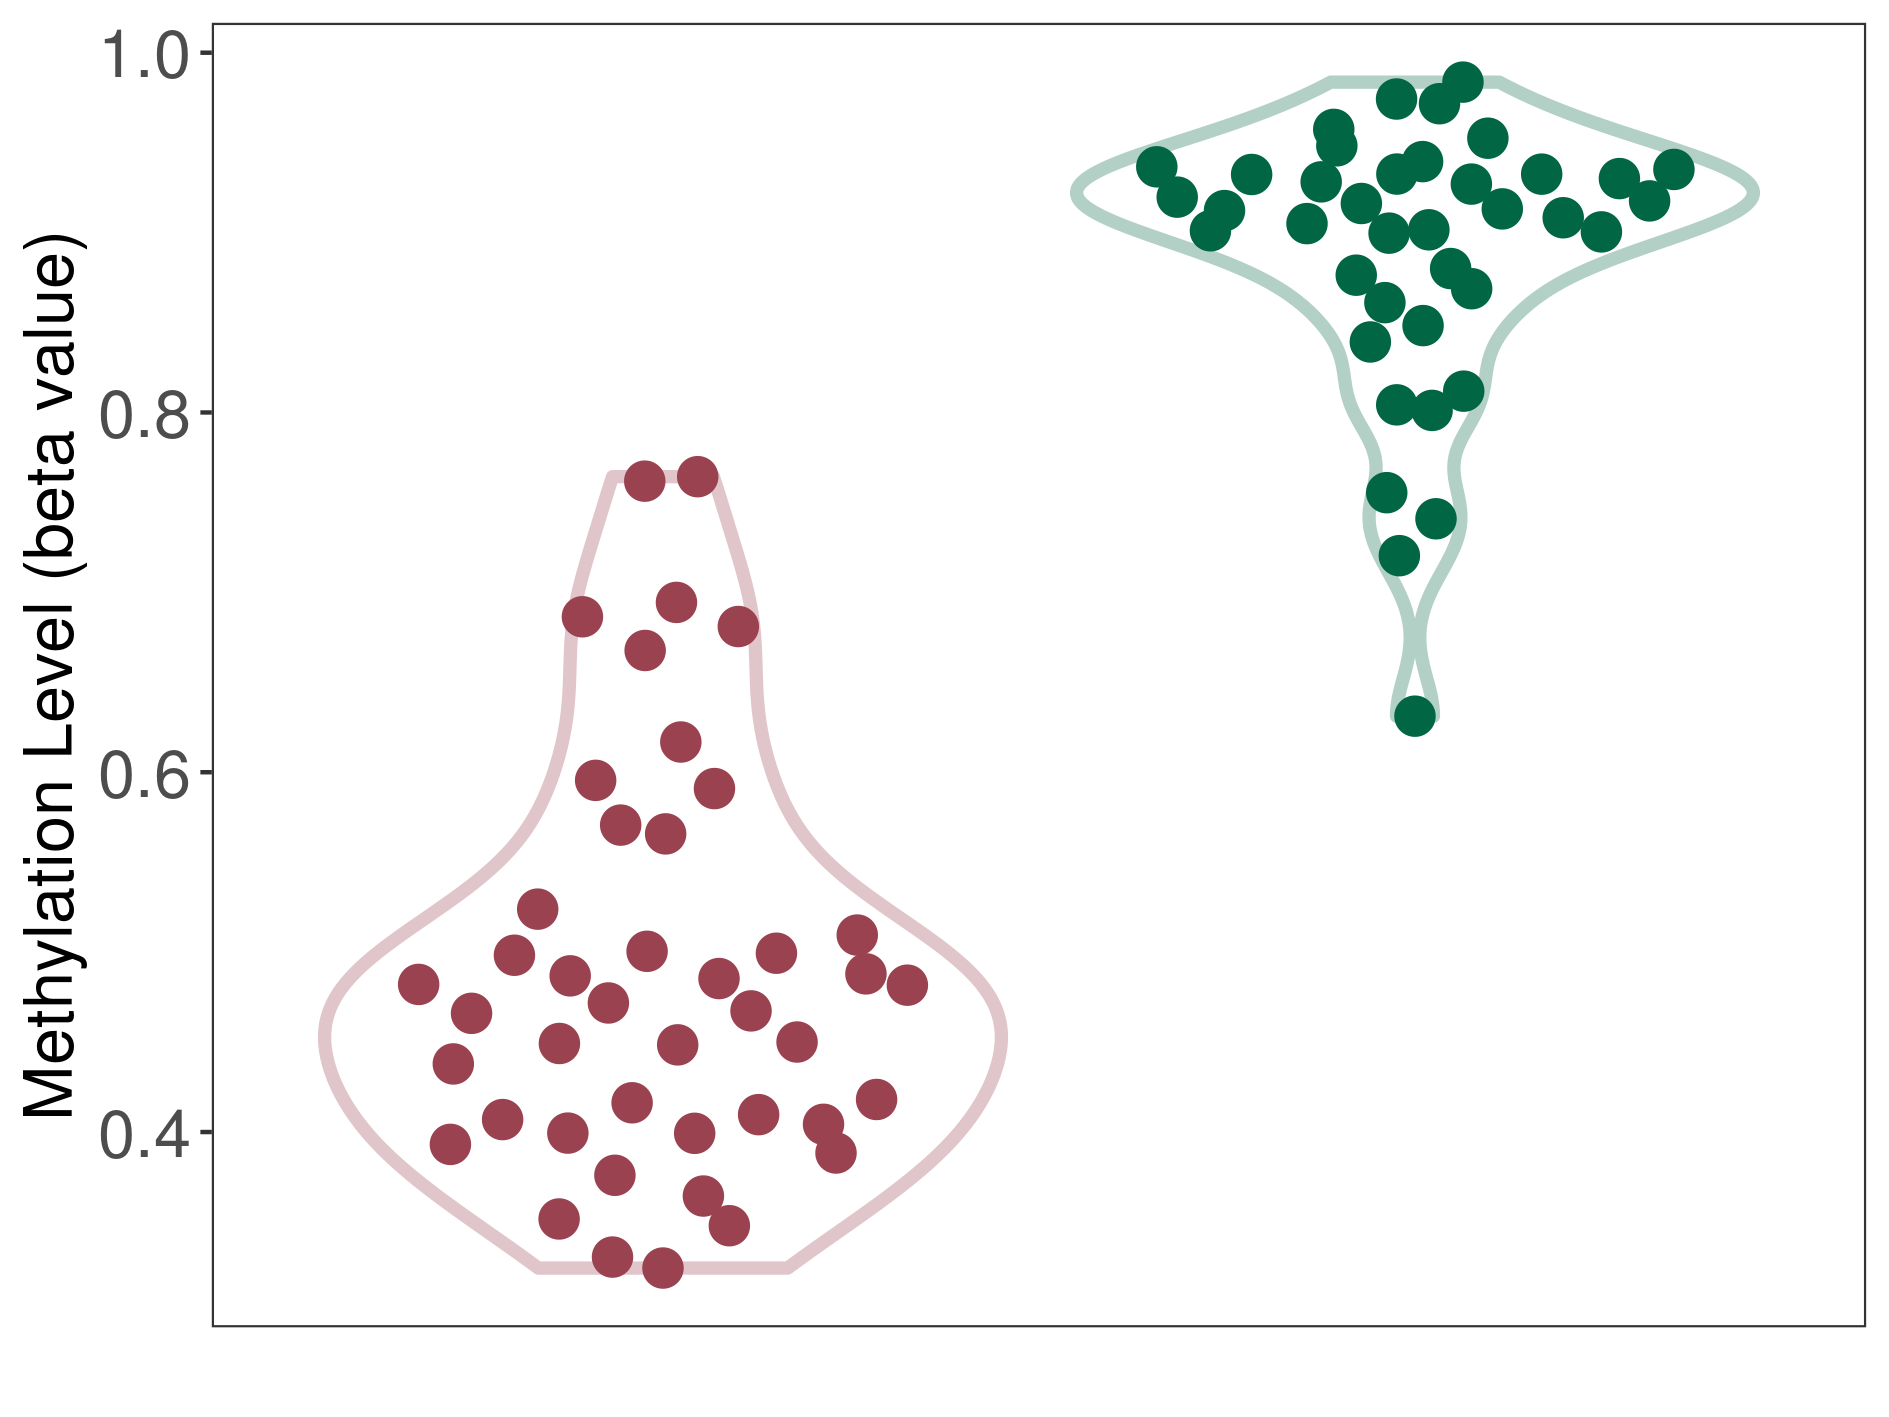
| DNA methyltransferase (DNMT) | Brain neuroblastoma | Significant hypomethylation | |||
| Interaction Name | DNMT-NQO1 interaction | ||||
| The Methylation Level of Disease Section Compare with the Healthy Individual Tissue | Significant hypomethylation p-value: 1.00E-29; delta-beta: -4.40E-01 | ||||
| Description | DNA methyltransferase (DNMT) is reported to significantly hypo-methylate the NQO1 gene, which leads to a significantly increased expression of the drug-metabolizing enzyme Quinone reductase 1. As a result, the interaction between DNMT and NQO1 can significantly affect the drug-metabolizing process of Quinone reductase 1. | ||||
|
DME methylation in the diseased tissue of patients
DME methylation in the normal tissue of healthy individuals
|
|||||
| Violin Diagram of DME Disease-specific Methylation Level |
|
Click to View the Clearer Original Diagram | |||
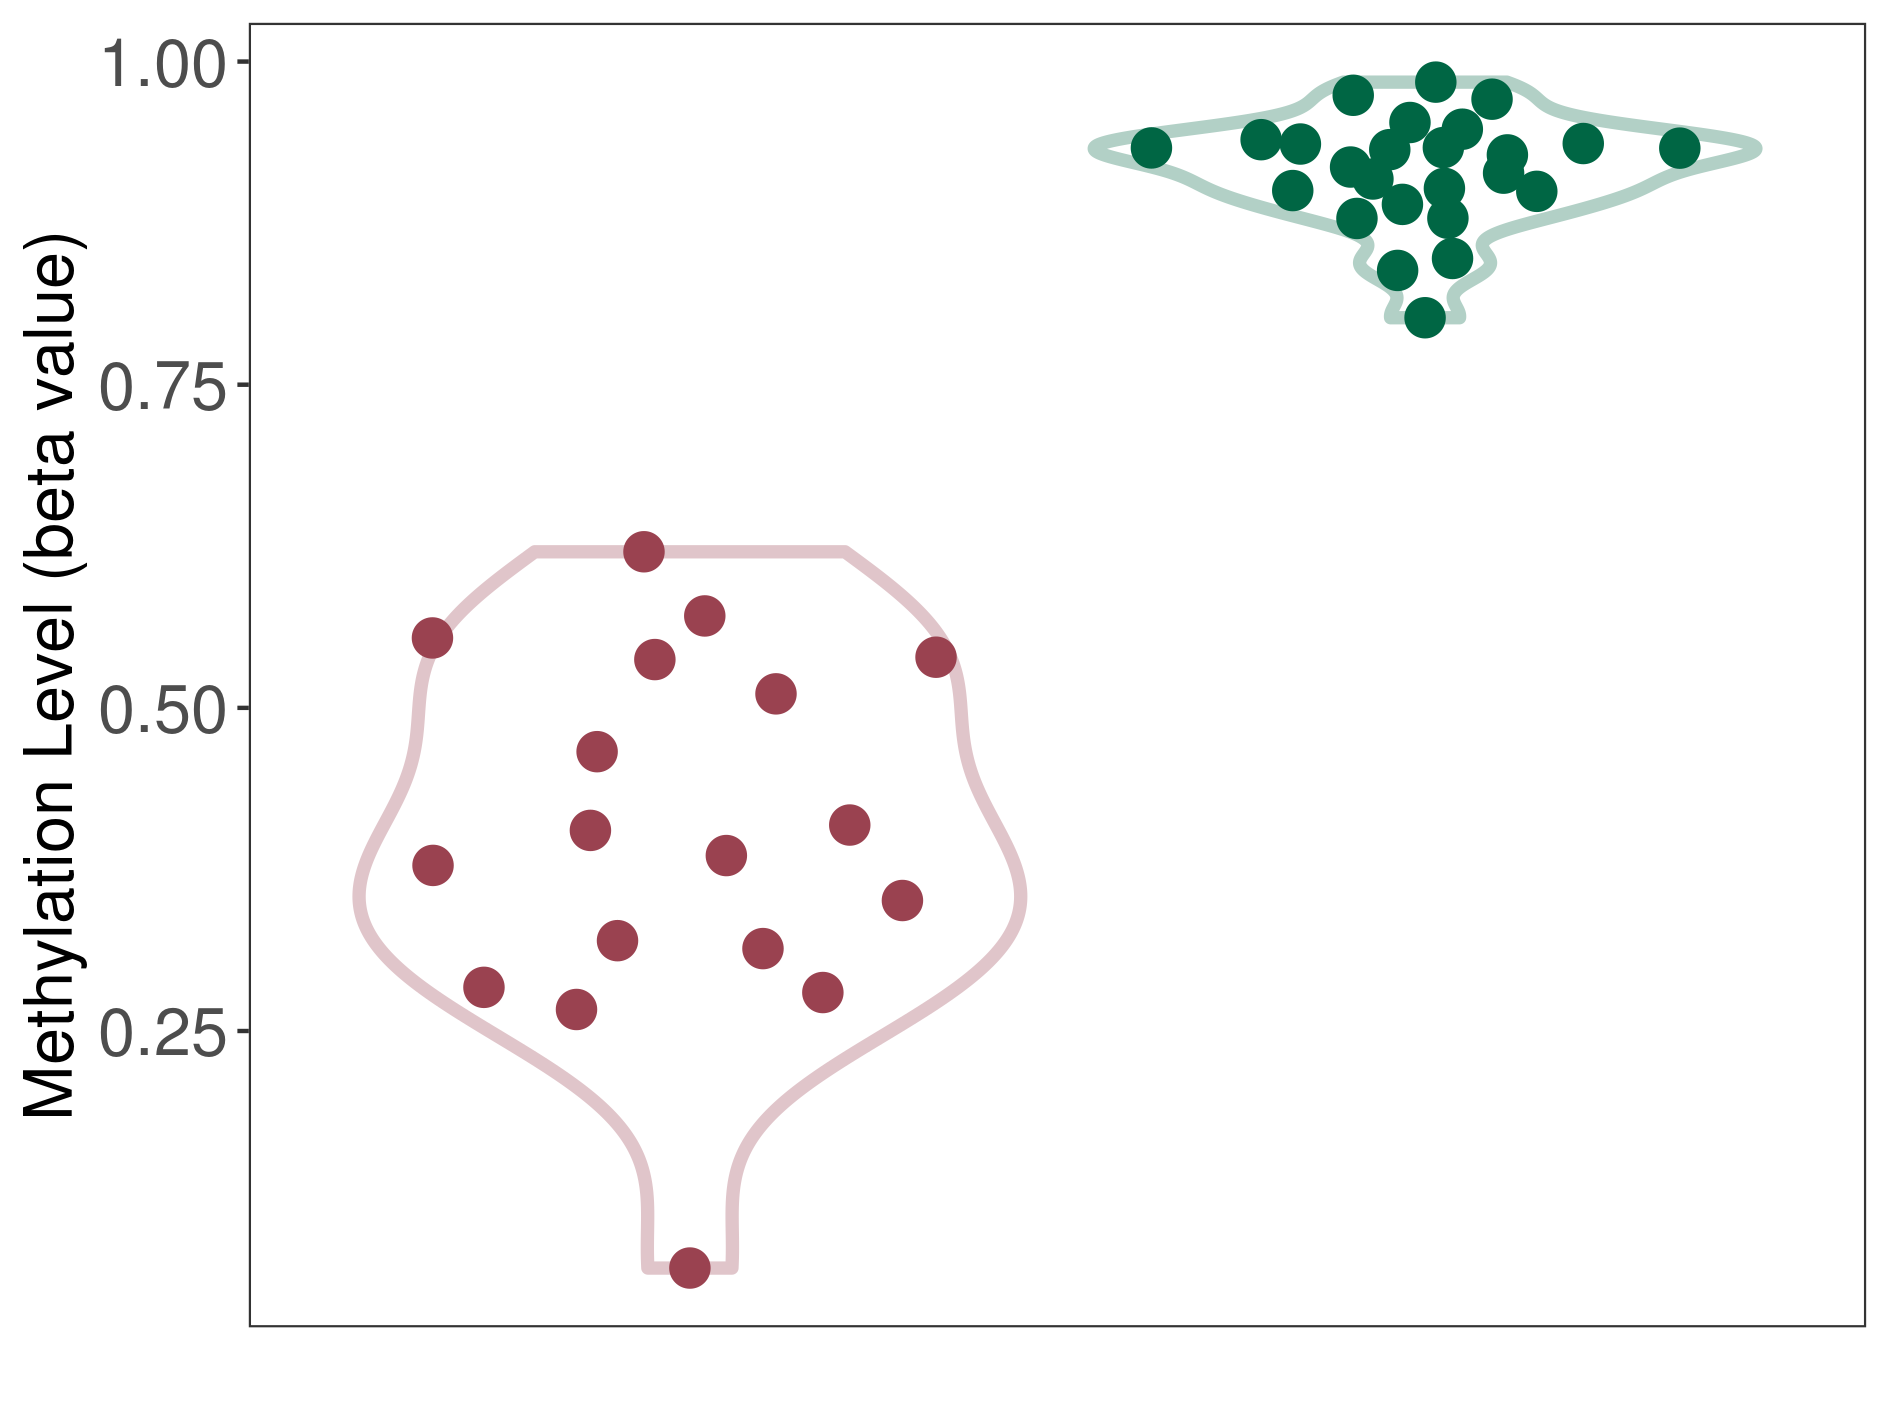
| DNA methyltransferase (DNMT) | Melanocytoma | Significant hypomethylation | |||
| Interaction Name | DNMT-NQO1 interaction | ||||
| The Methylation Level of Disease Section Compare with the Healthy Individual Tissue | Significant hypomethylation p-value: 3.84E-12; delta-beta: -5.32E-01 | ||||
| Description | DNA methyltransferase (DNMT) is reported to significantly hypo-methylate the NQO1 gene, which leads to a significantly increased expression of the drug-metabolizing enzyme Quinone reductase 1. As a result, the interaction between DNMT and NQO1 can significantly affect the drug-metabolizing process of Quinone reductase 1. | ||||
|
DME methylation in the diseased tissue of patients
DME methylation in the normal tissue of healthy individuals
|
|||||
| Violin Diagram of DME Disease-specific Methylation Level |
|
Click to View the Clearer Original Diagram | |||
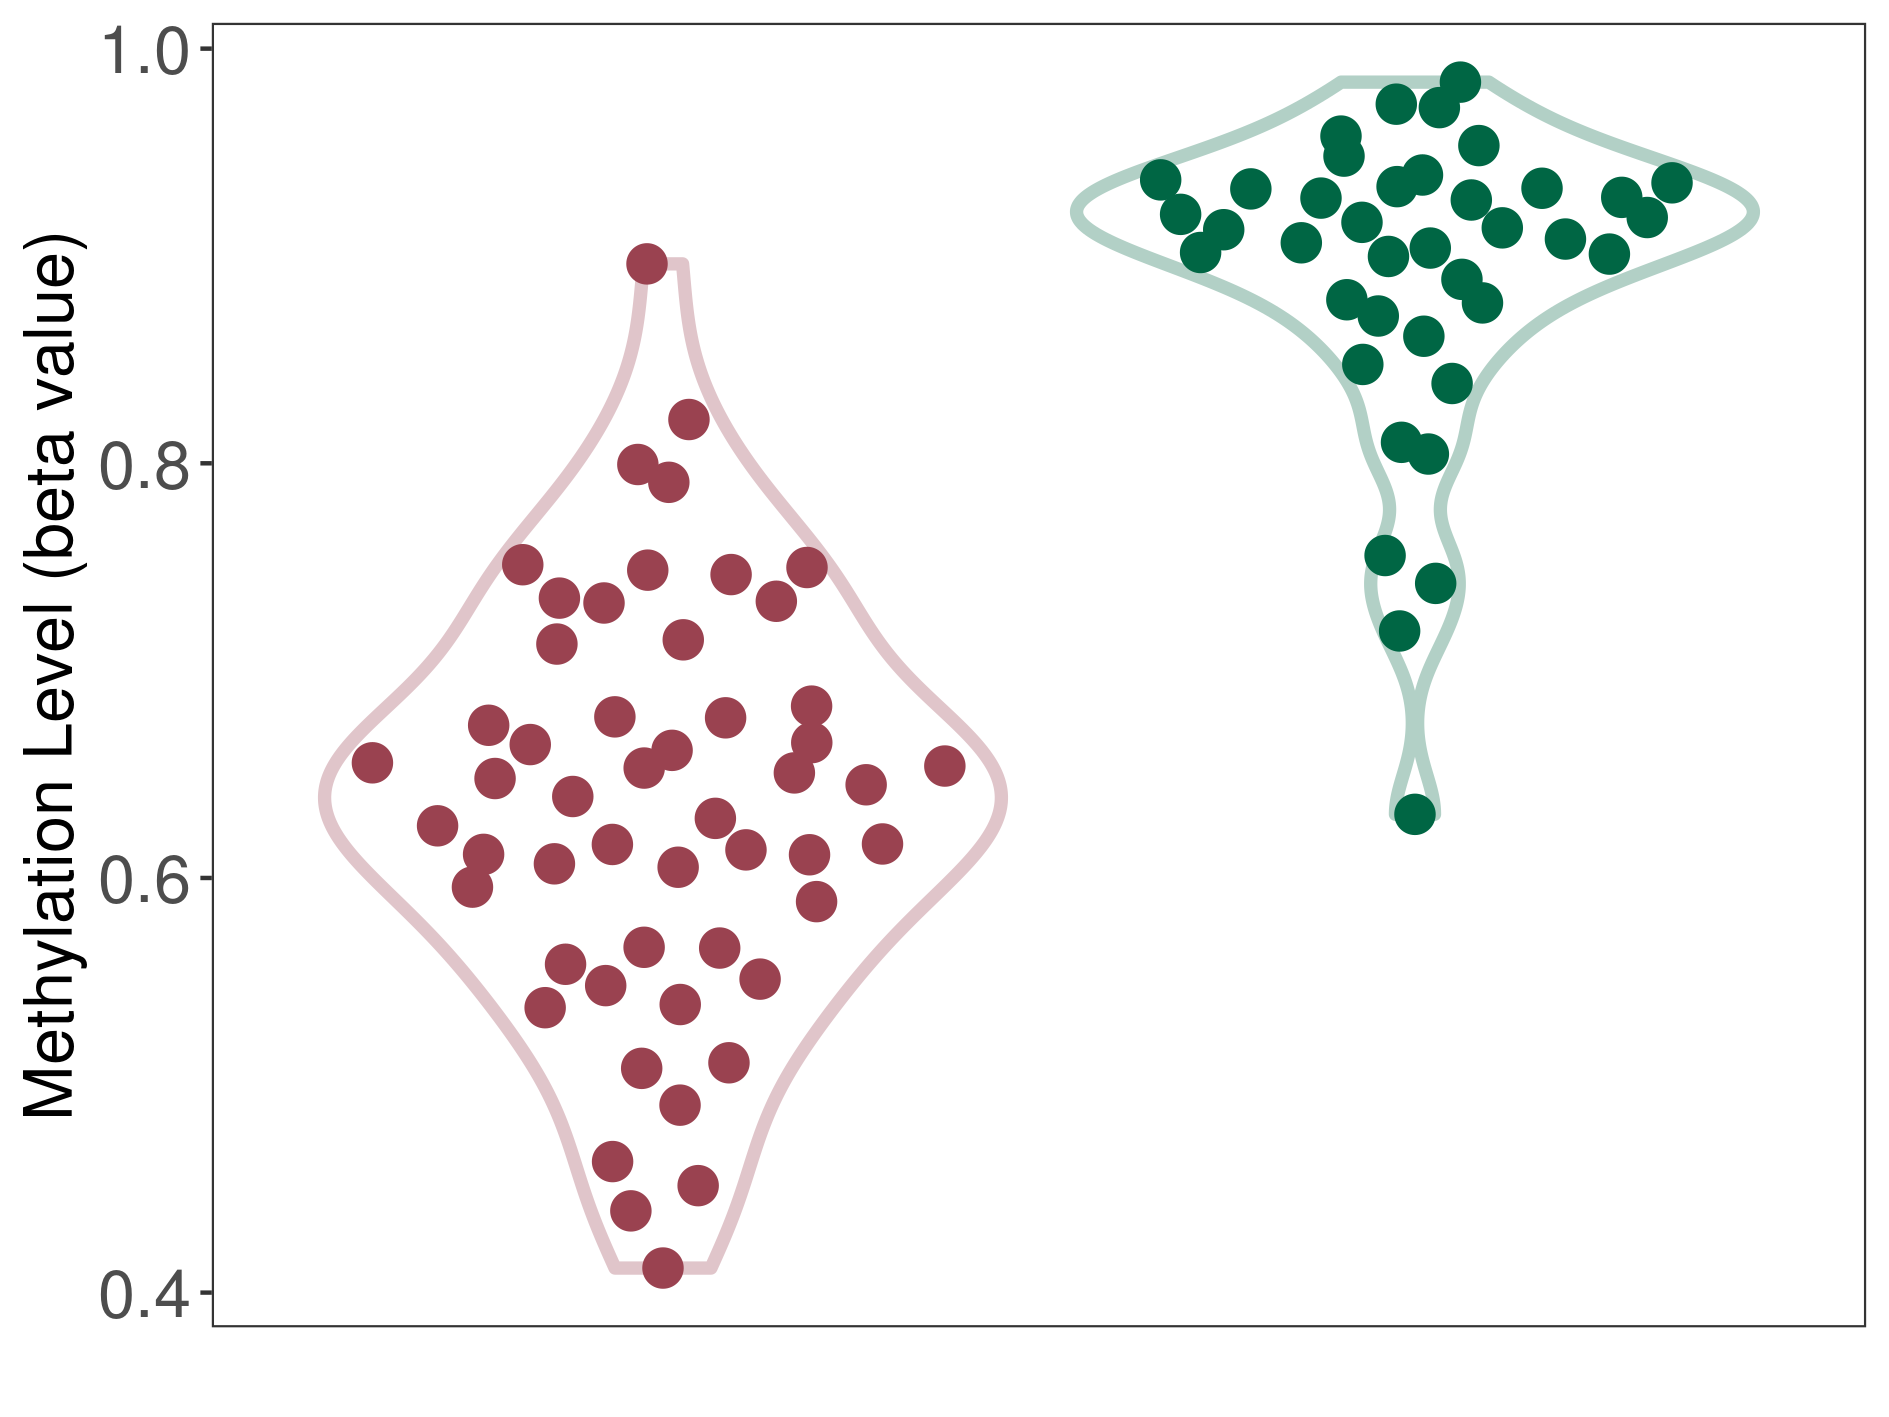
| DNA methyltransferase (DNMT) | Multilayered rosettes embryonal tumour | Moderate hypomethylation | |||
| Interaction Name | DNMT-NQO1 interaction | ||||
| The Methylation Level of Disease Section Compare with the Healthy Individual Tissue | Moderate hypomethylation p-value: 6.72E-24; delta-beta: -2.71E-01 | ||||
| Description | DNA methyltransferase (DNMT) is reported to moderatly hypo-methylate the NQO1 gene, which leads to a moderatly increased expression of the drug-metabolizing enzyme Quinone reductase 1. As a result, the interaction between DNMT and NQO1 can moderatly affect the drug-metabolizing process of Quinone reductase 1. | ||||
|
DME methylation in the diseased tissue of patients
DME methylation in the normal tissue of healthy individuals
|
|||||
| Violin Diagram of DME Disease-specific Methylation Level |
|
Click to View the Clearer Original Diagram | |||
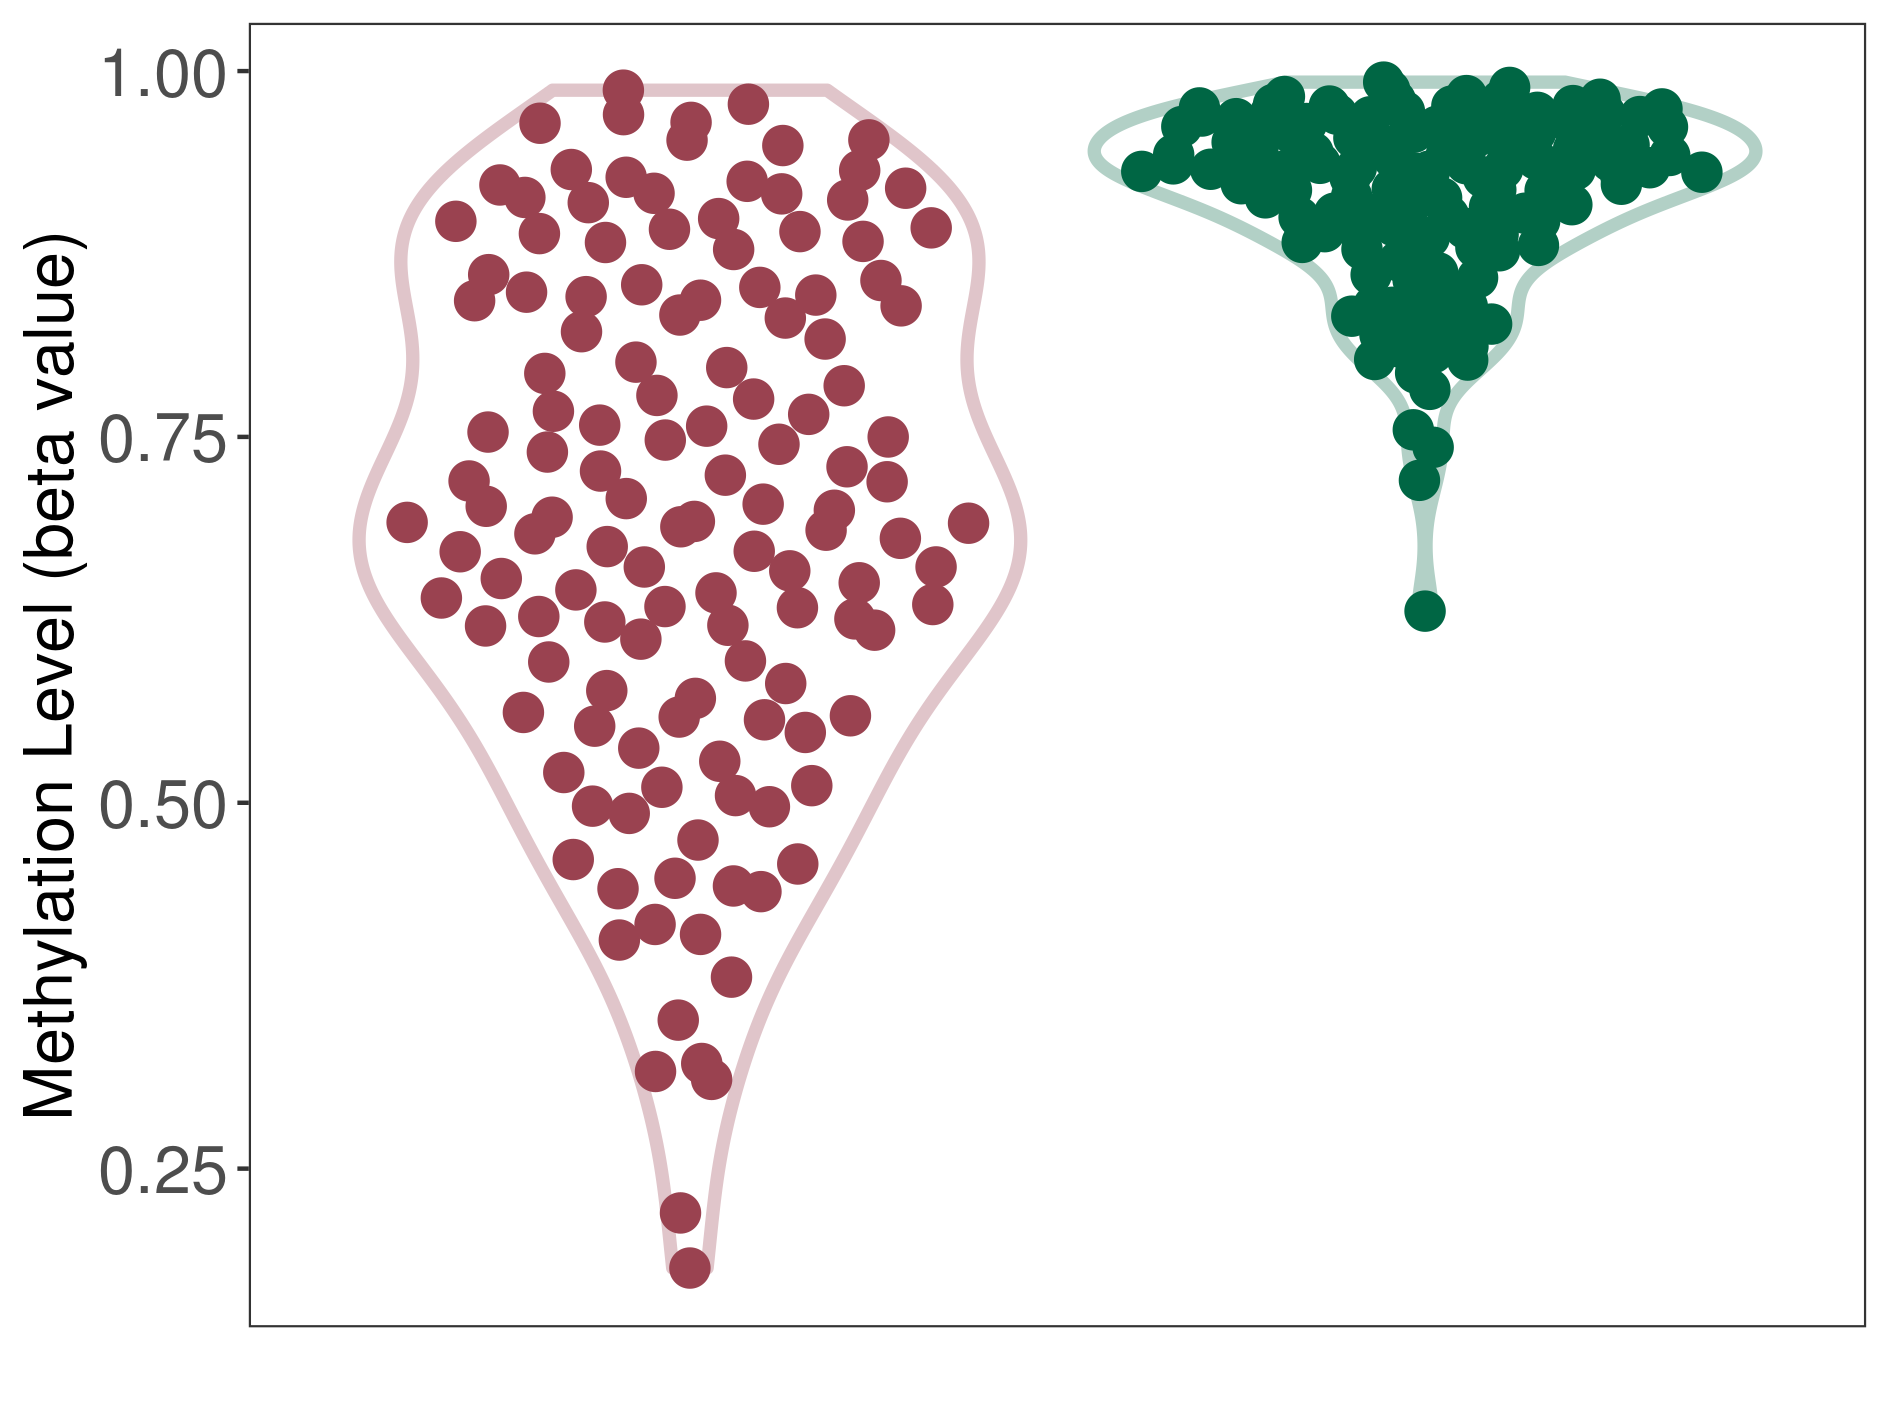
| DNA methyltransferase (DNMT) | Diffuse midline glioma | Moderate hypomethylation | |||
| Interaction Name | DNMT-NQO1 interaction | ||||
| The Methylation Level of Disease Section Compare with the Healthy Individual Tissue | Moderate hypomethylation p-value: 6.49E-27; delta-beta: -2.33E-01 | ||||
| Description | DNA methyltransferase (DNMT) is reported to moderatly hypo-methylate the NQO1 gene, which leads to a moderatly increased expression of the drug-metabolizing enzyme Quinone reductase 1. As a result, the interaction between DNMT and NQO1 can moderatly affect the drug-metabolizing process of Quinone reductase 1. | ||||
|
DME methylation in the diseased tissue of patients
DME methylation in the normal tissue of healthy individuals
|
|||||
| Violin Diagram of DME Disease-specific Methylation Level |
|
Click to View the Clearer Original Diagram | |||
| ICD-11: 2B71 Gastric cancer | Click to Show/Hide the Full List of HOSPPI: 1 HOSPPI | ||||
| DNA methylation | |||||
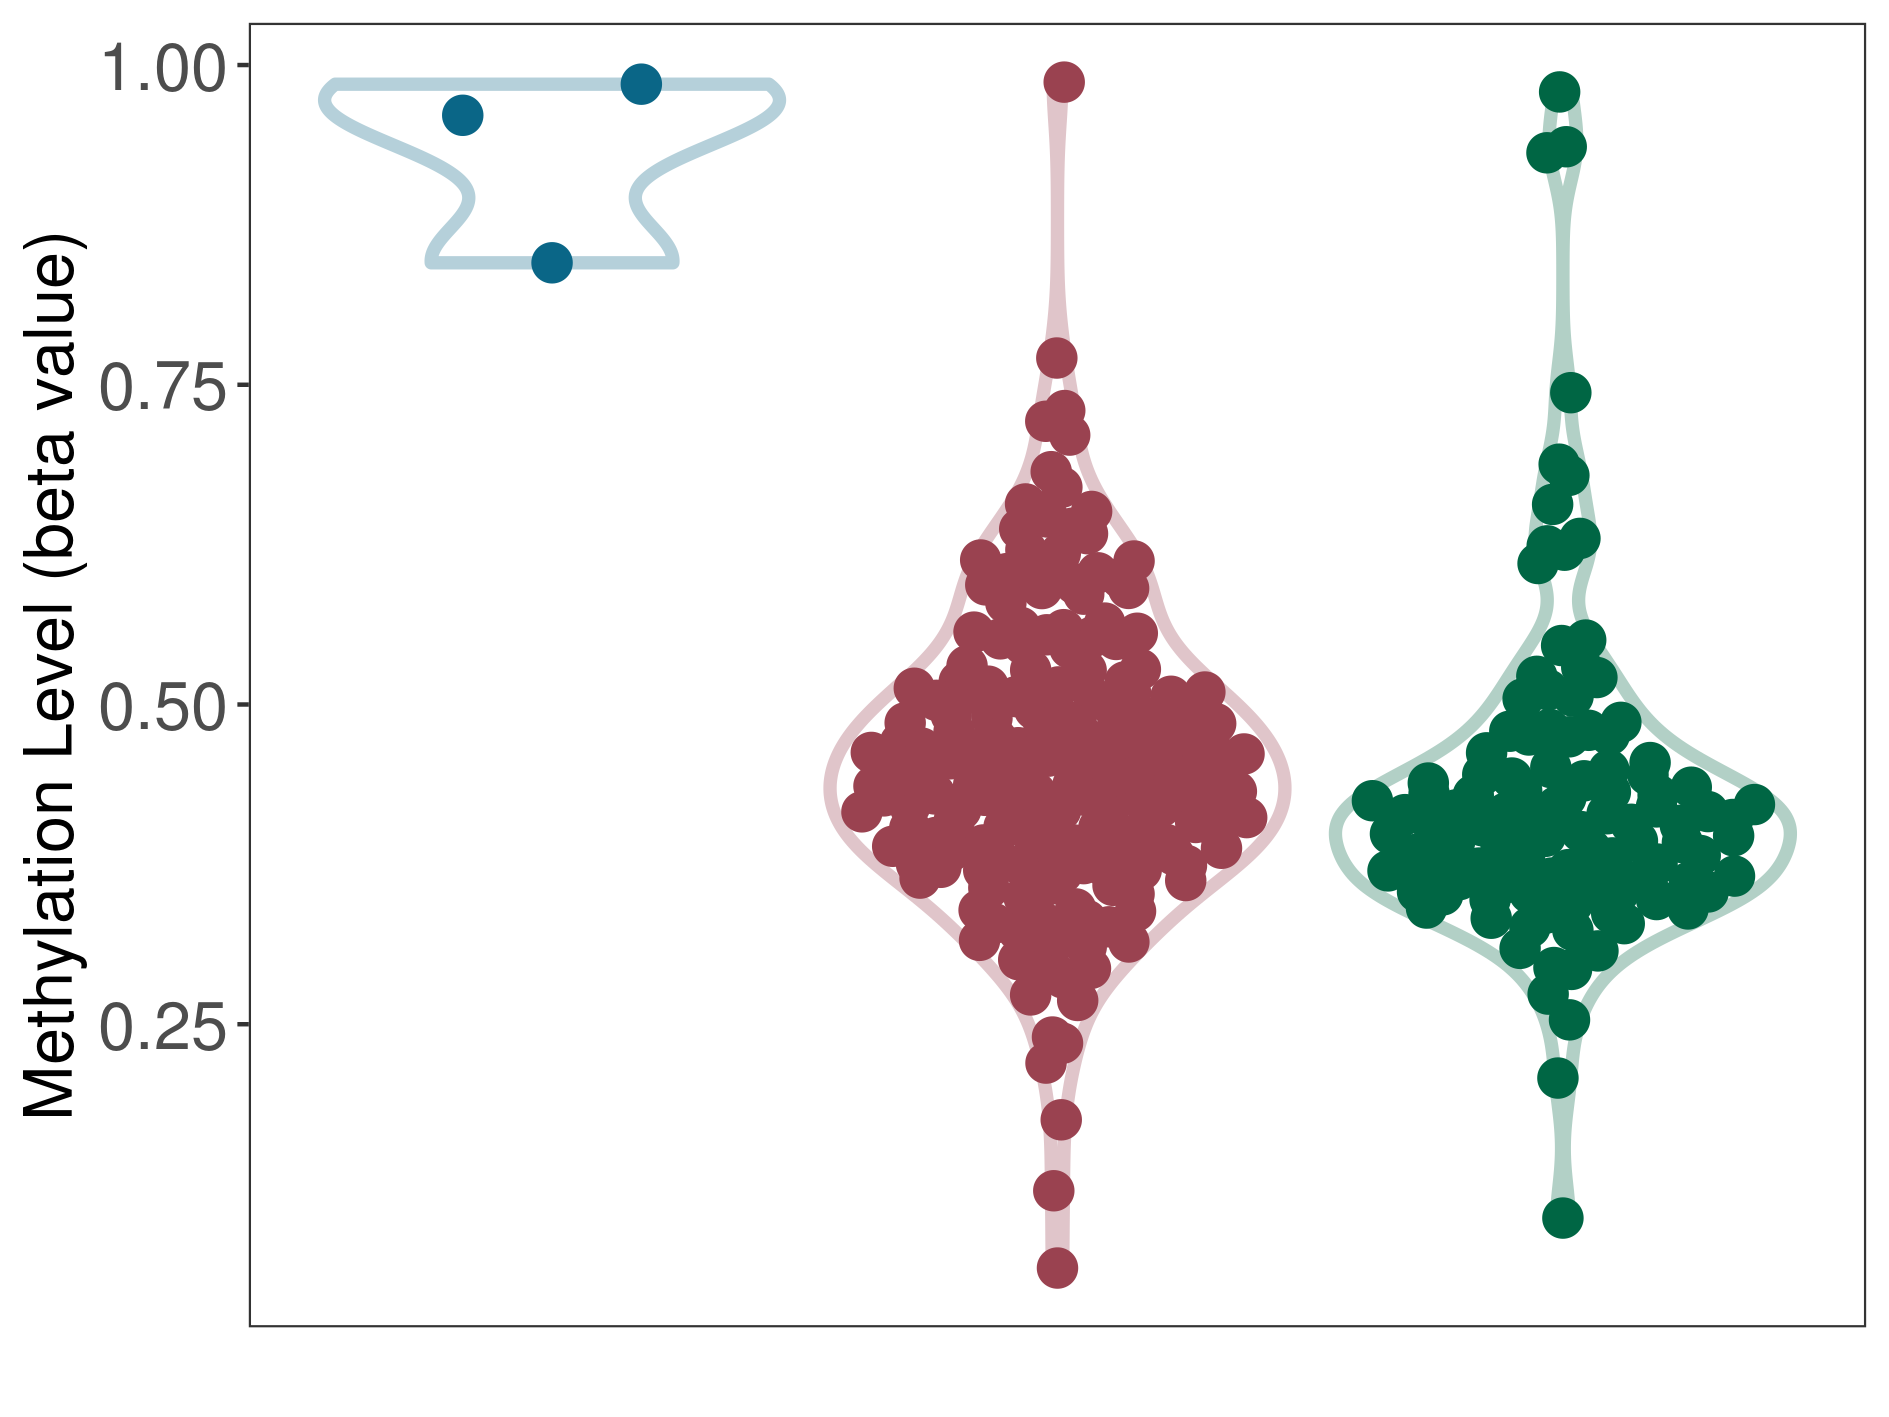
| DNA methyltransferase (DNMT) | Gastric cancer | Significant hypomethylation | |||
| Interaction Name | DNMT-NQO1 interaction | ||||
| The Methylation Level of Disease Section Compare with the Adjacent Tissue | Significant hypomethylation p-value: 6.26E-03; delta-beta: -5.09E-01 | ||||
| Description | DNA methyltransferase (DNMT) is reported to significantly hypo-methylate the NQO1 gene, which leads to a significantly increased expression of the drug-metabolizing enzyme Quinone reductase 1. As a result, the interaction between DNMT and NQO1 can significantly affect the drug-metabolizing process of Quinone reductase 1. | ||||
|
DME methylation in the diseased tissue of patients
DME methylation in the normal tissue adjacent to the diseased tissue of patients
DME methylation in the normal tissue of healthy individuals
|
|||||
| Violin Diagram of DME Disease-specific Methylation Level |
|
Click to View the Clearer Original Diagram | |||
| ICD-11: 2C12 Liver cancer | Click to Show/Hide the Full List of HOSPPI: 3 HOSPPI | ||||
| Transcription-factor regulation | |||||
| NFE2-related factor 1 (NFE2L1) | Liver cancer | Activation | |||
| Uniprot ID | |||||
| Interaction Name | NFE2L1-NQO1 interaction | [2] | |||
| Studied Cell Lines | HepG2 cell line | ||||
| Ensembl ID | |||||
| Description | NFE2-related factor 1 (NFE2L1) is reported to activate the transcription of NQO1 gene, which leads to an increased expression of the drug-metabolizing enzyme Quinone reductase 1. As a result, the interaction between NFE2L1 and NQO1 can activate the drug-metabolizing process of Quinone reductase 1. | ||||
| NFE2-related factor 2 (NFE2L2) | Liver cancer | Activation | |||
| Uniprot ID | |||||
| Interaction Name | NFE2L2-NQO1 interaction | [2] | |||
| Studied Cell Lines | HepG2 cell line | ||||
| Ensembl ID | |||||
| Description | NFE2-related factor 2 (NFE2L2) is reported to activate the transcription of NQO1 gene, which leads to an increased expression of the drug-metabolizing enzyme Quinone reductase 1. As a result, the interaction between NFE2L2 and NQO1 can activate the drug-metabolizing process of Quinone reductase 1. | ||||
| DNA methylation | |||||
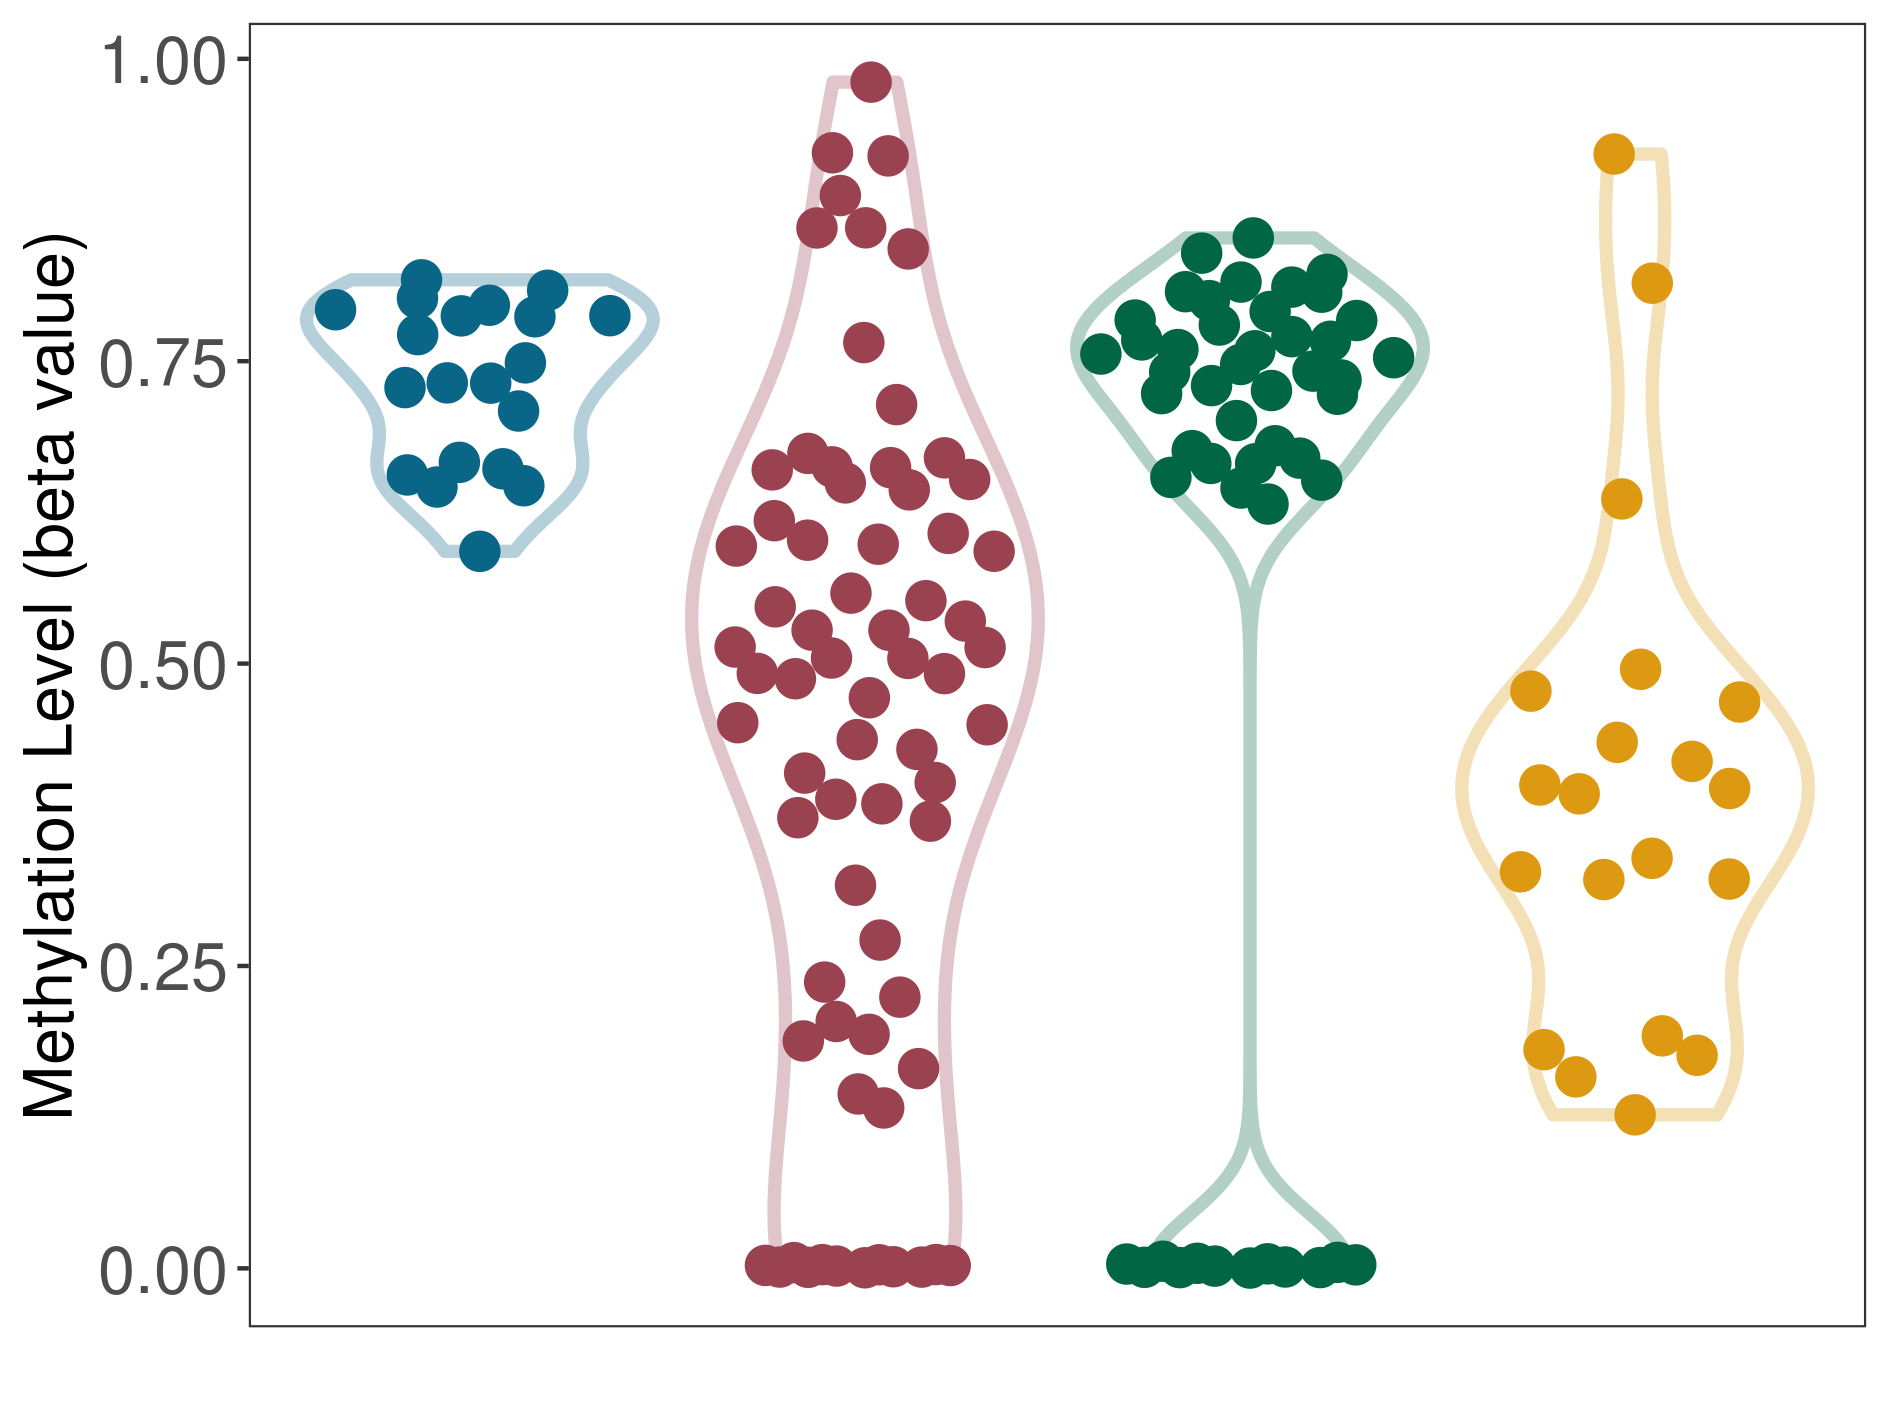
| DNA methyltransferase (DNMT) | Liver cancer | Moderate hypomethylation | |||
| Interaction Name | DNMT-NQO1 interaction | ||||
| The Methylation Level of Disease Section Compare with the Healthy Individual Tissue | Moderate hypomethylation p-value: 2.92E-02; delta-beta: -2.34E-01 | ||||
| Description | DNA methyltransferase (DNMT) is reported to moderatly hypo-methylate the NQO1 gene, which leads to a moderatly increased expression of the drug-metabolizing enzyme Quinone reductase 1. As a result, the interaction between DNMT and NQO1 can moderatly affect the drug-metabolizing process of Quinone reductase 1. | ||||
| The Methylation Level of Disease Section Compare with the Adjacent Tissue | Moderate hypomethylation p-value: 2.48E-12; delta-beta: -2.49E-01 | ||||
| Description | DNA methyltransferase (DNMT) is reported to moderatly hypo-methylate the NQO1 gene, which leads to a moderatly increased expression of the drug-metabolizing enzyme Quinone reductase 1. As a result, the interaction between DNMT and NQO1 can moderatly affect the drug-metabolizing process of Quinone reductase 1. | ||||
|
DME methylation in the diseased tissue of patients
DME methylation in the normal tissue adjacent to the diseased tissue of patients
DME methylation in the normal tissue of healthy individuals
DME methylation in tissue other than the diseased tissue of patients
|
|||||
| Violin Diagram of DME Disease-specific Methylation Level |
|
Click to View the Clearer Original Diagram | |||
| ICD-11: 2C25 Lung cancer | Click to Show/Hide the Full List of HOSPPI: 1 HOSPPI | ||||
| DNA methylation | |||||
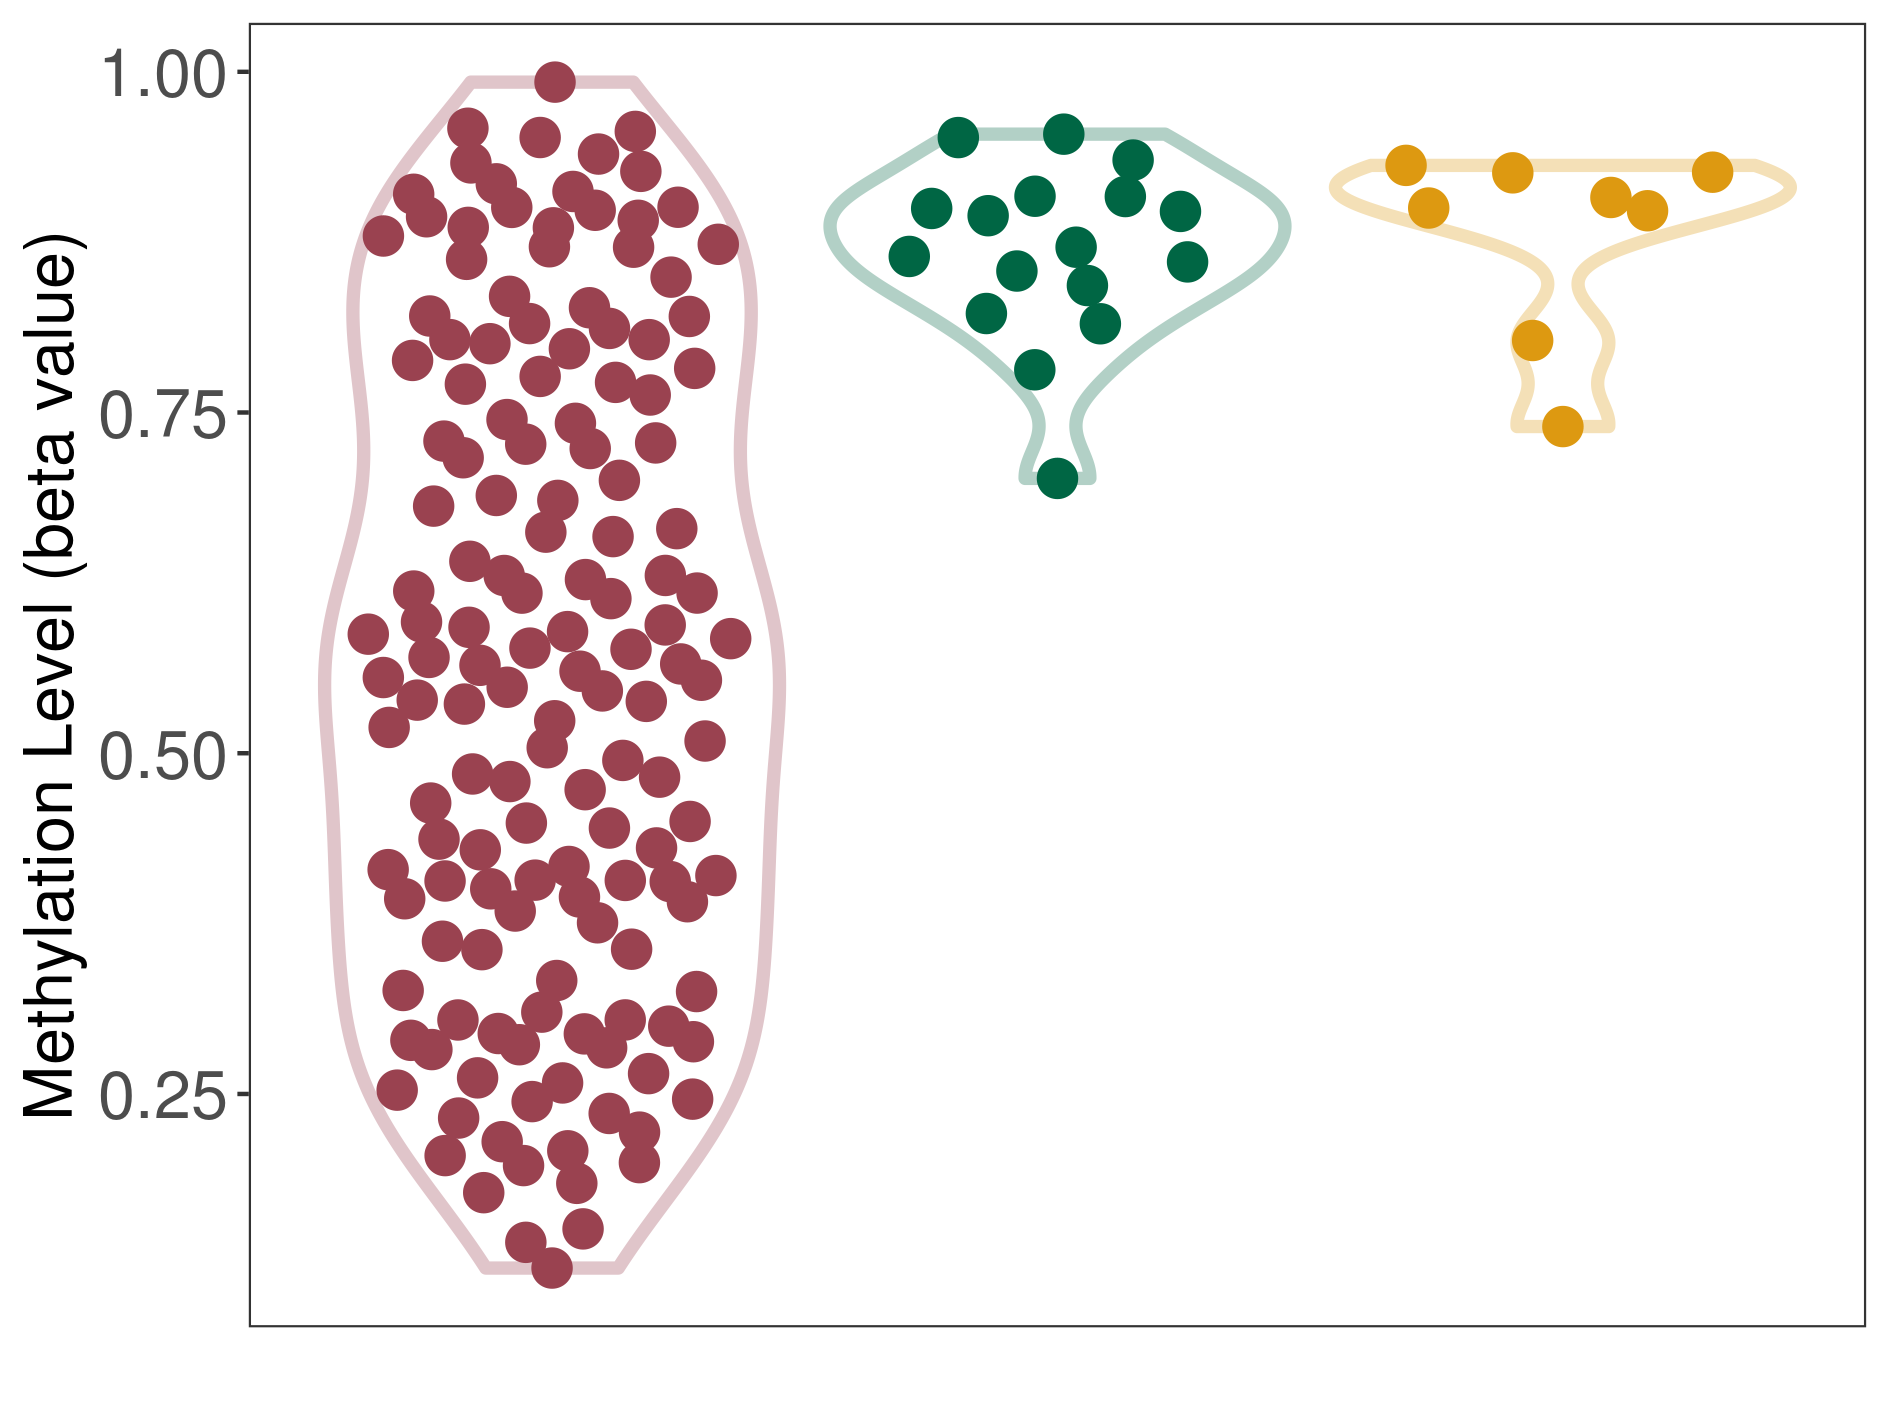
| DNA methyltransferase (DNMT) | Lung cancer | Significant hypomethylation | |||
| Interaction Name | DNMT-NQO1 interaction | ||||
| The Methylation Level of Disease Section Compare with the Healthy Individual Tissue | Significant hypomethylation p-value: 1.91E-20; delta-beta: -3.11E-01 | ||||
| Description | DNA methyltransferase (DNMT) is reported to significantly hypo-methylate the NQO1 gene, which leads to a significantly increased expression of the drug-metabolizing enzyme Quinone reductase 1. As a result, the interaction between DNMT and NQO1 can significantly affect the drug-metabolizing process of Quinone reductase 1. | ||||
| The Methylation Level of Disease Section Compare with the Other Disease Section | Significant hypomethylation p-value: 6.90E-09; delta-beta: -3.44E-01 | ||||
| Description | DNA methyltransferase (DNMT) is reported to significantly hypo-methylate the NQO1 gene, which leads to a significantly increased expression of the drug-metabolizing enzyme Quinone reductase 1. As a result, the interaction between DNMT and NQO1 can significantly affect the drug-metabolizing process of Quinone reductase 1. | ||||
|
DME methylation in the diseased tissue of patients
DME methylation in the normal tissue of healthy individuals
DME methylation in tissue other than the diseased tissue of patients
|
|||||
| Violin Diagram of DME Disease-specific Methylation Level |
|
Click to View the Clearer Original Diagram | |||
| ICD-11: 2C30 Melanoma | Click to Show/Hide the Full List of HOSPPI: 1 HOSPPI | ||||
| DNA methylation | |||||
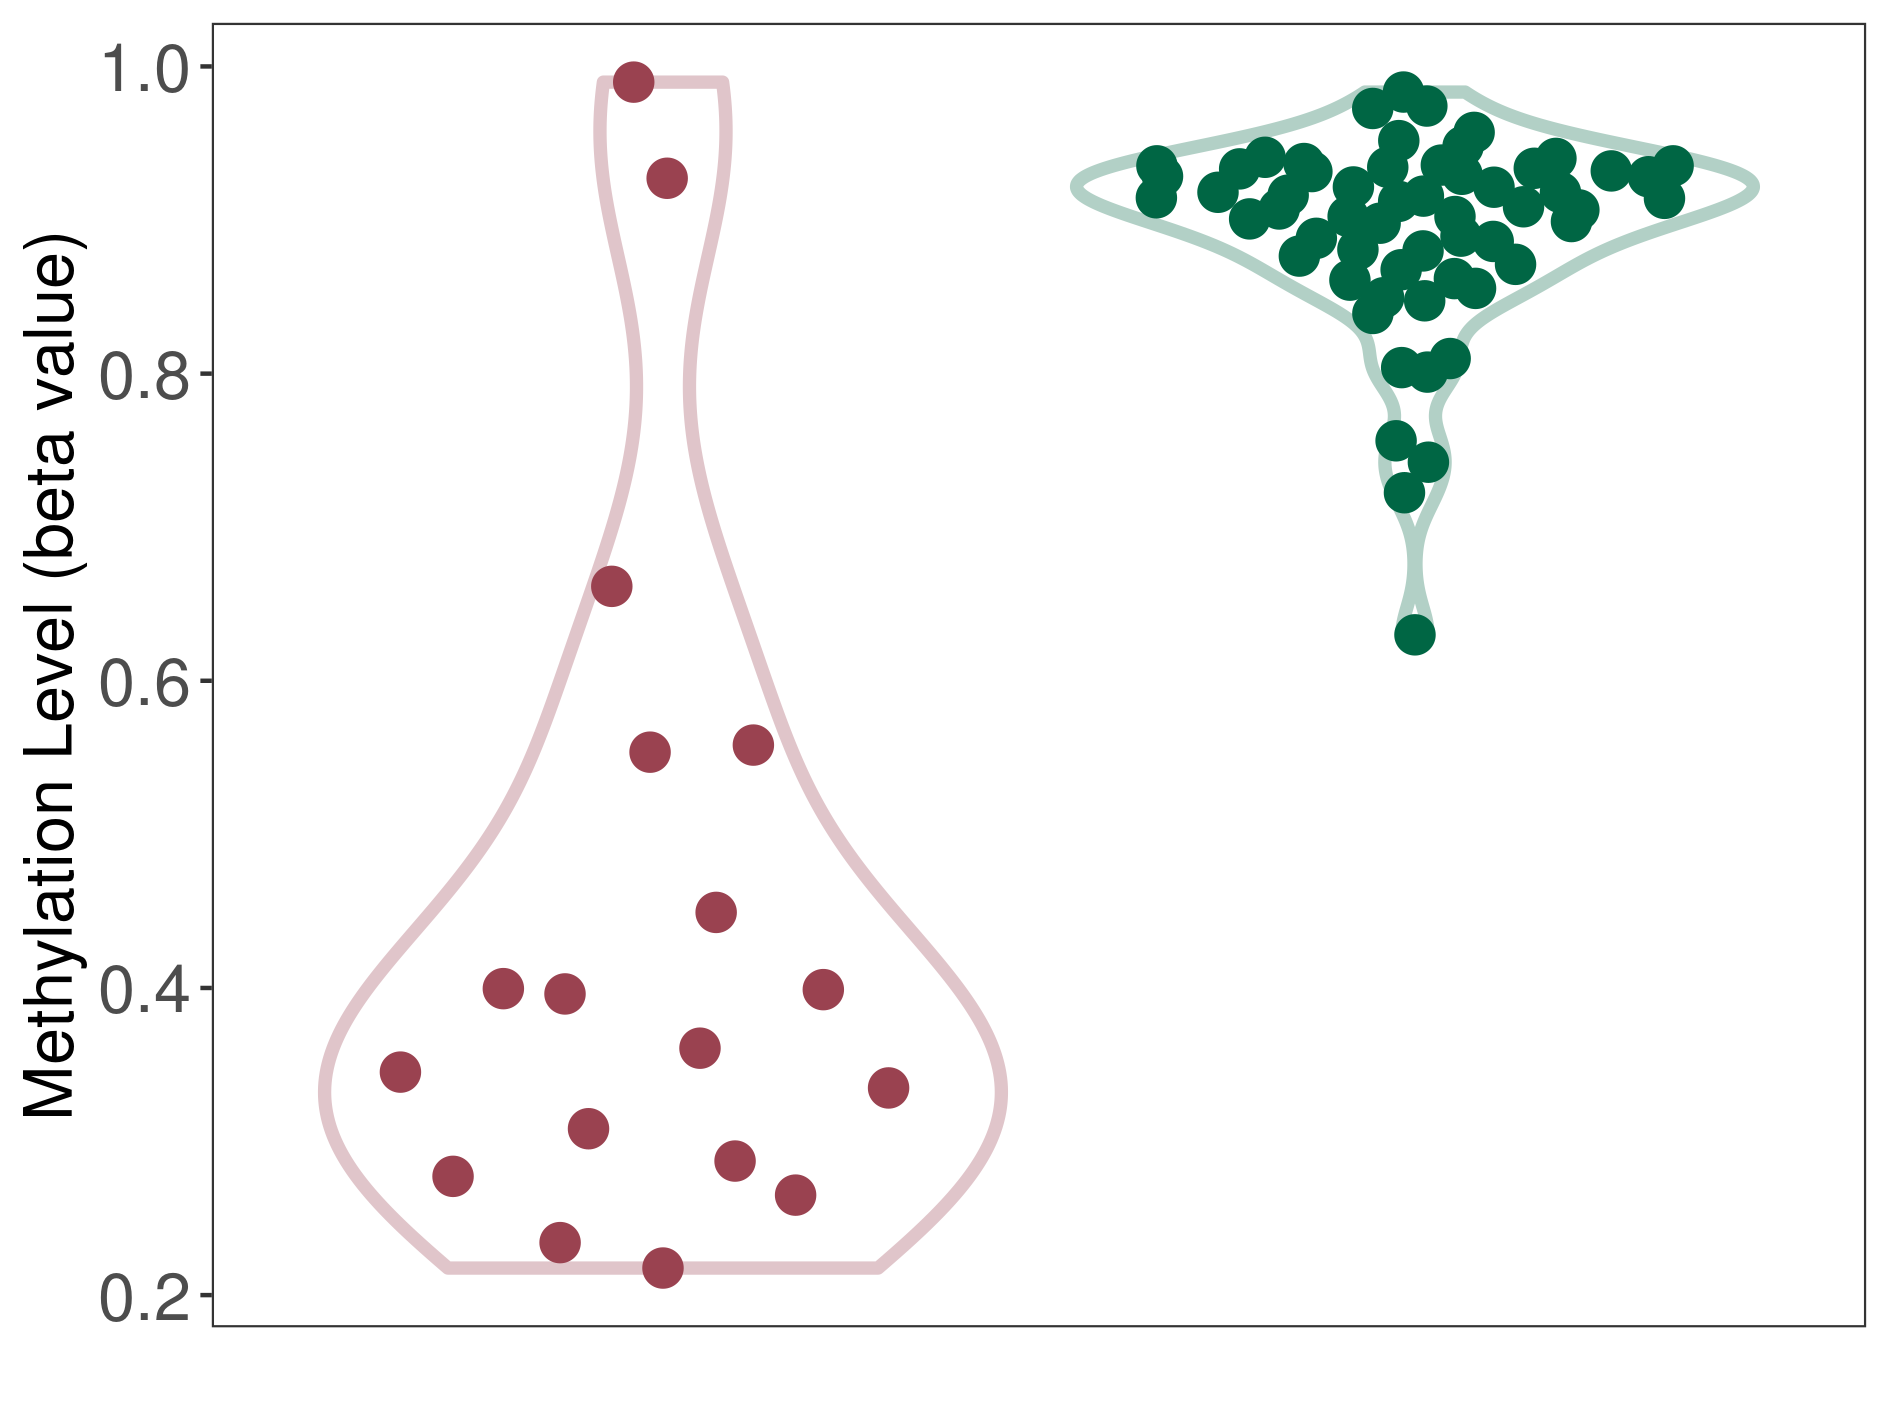
| DNA methyltransferase (DNMT) | Melanoma | Significant hypomethylation | |||
| Interaction Name | DNMT-NQO1 interaction | ||||
| The Methylation Level of Disease Section Compare with the Healthy Individual Tissue | Significant hypomethylation p-value: 1.08E-07; delta-beta: -5.32E-01 | ||||
| Description | DNA methyltransferase (DNMT) is reported to significantly hypo-methylate the NQO1 gene, which leads to a significantly increased expression of the drug-metabolizing enzyme Quinone reductase 1. As a result, the interaction between DNMT and NQO1 can significantly affect the drug-metabolizing process of Quinone reductase 1. | ||||
|
DME methylation in the diseased tissue of patients
DME methylation in the normal tissue of healthy individuals
|
|||||
| Violin Diagram of DME Disease-specific Methylation Level |
|
Click to View the Clearer Original Diagram | |||
| ICD-11: 2C60 Breast cancer | Click to Show/Hide the Full List of HOSPPI: 2 HOSPPI | ||||
| Transcription-factor regulation | |||||
| Estrogen receptor (ESR1) | Breast cancer | Repression | |||
| Uniprot ID | |||||
| Interaction Name | ESR1-NQO1 interaction | [3] | |||
| Studied Cell Lines | MCF-7, T47D and MDA-MB-231 cell lines | ||||
| Ensembl ID | |||||
| Description | Estrogen receptor (ESR1) is reported to repress the transcription of NQO1 gene, which leads to a decreased expression of the drug-metabolizing enzyme Quinone reductase 1. As a result, the interaction between ESR1 and NQO1 can repress the drug-metabolizing process of Quinone reductase 1. | ||||
| SIR2-like protein 1 (SIRT1) | Breast cancer | Repression | |||
| Uniprot ID | |||||
| Interaction Name | SIRT1-NQO1 interaction | [3] | |||
| Studied Cell Lines | MCF-7, T47D and MDA-MB-231 cell lines | ||||
| Description | SIR2-like protein 1 (SIRT1) is reported to repress the transcription of NQO1 gene, which leads to a decreased expression of the drug-metabolizing enzyme Quinone reductase 1. As a result, the interaction between SIRT1 and NQO1 can repress the drug-metabolizing process of Quinone reductase 1. | ||||
If you find any error in data or bug in web service, please kindly report it to Dr. Yin and Dr. Li.

