

Details of Host Protein-DME Interaction (HOSPPI)
| General Information of Drug-Metabolizing Enzyme (DME ID: DME0154) | |||||
|---|---|---|---|---|---|
| DME Name | Asparagine synthetase (ASNS), Homo sapiens | DME Info | |||
| UniProt ID | |||||
| EC Number | EC: 6.3.5.4 (Click to Show/Hide the Complete EC Tree) | ||||
| Lineage | Species: Homo sapiens (Click to Show/Hide the Complete Species Lineage) | ||||
| Interactome | |||||
| Disease Specific Interactions between Host Protein and DME (HOSPPI) | |||||
|---|---|---|---|---|---|
| ICD Disease Classification Healthy | |||||
| ICD-11: Healthy | Click to Show/Hide the Full List of HOSPPI: 1 HOSPPI | ||||
| Transcription-factor regulation | |||||
| C/EBP-homologous protein (DDIT3) | Health | Repression | |||
| Uniprot ID | |||||
| Interaction Name | DDIT3-ASNS interaction | [1] | |||
| Studied Cell Lines | HEK 293T cell line | ||||
| Ensembl ID | |||||
| Description | C/EBP-homologous protein (DDIT3) is reported to repress the transcription of ASNS gene, which leads to a decreased expression of the drug-metabolizing enzyme Asparagine synthetase. As a result, the interaction between DDIT3 and ASNS can repress the drug-metabolizing process of Asparagine synthetase. | ||||
| ICD Disease Classification 01 Infectious/parasitic diseases | |||||
| ICD-11: 1F57 Toxoplasma gondii infection | Click to Show/Hide the Full List of HOSPPI: 1 HOSPPI | ||||
| DNA methylation | |||||
| DNA methyltransferase (DNMT) | Toxoplasma gondii infection | Moderate hypermethylation | |||
| Interaction Name | DNMT-ASNS interaction | ||||
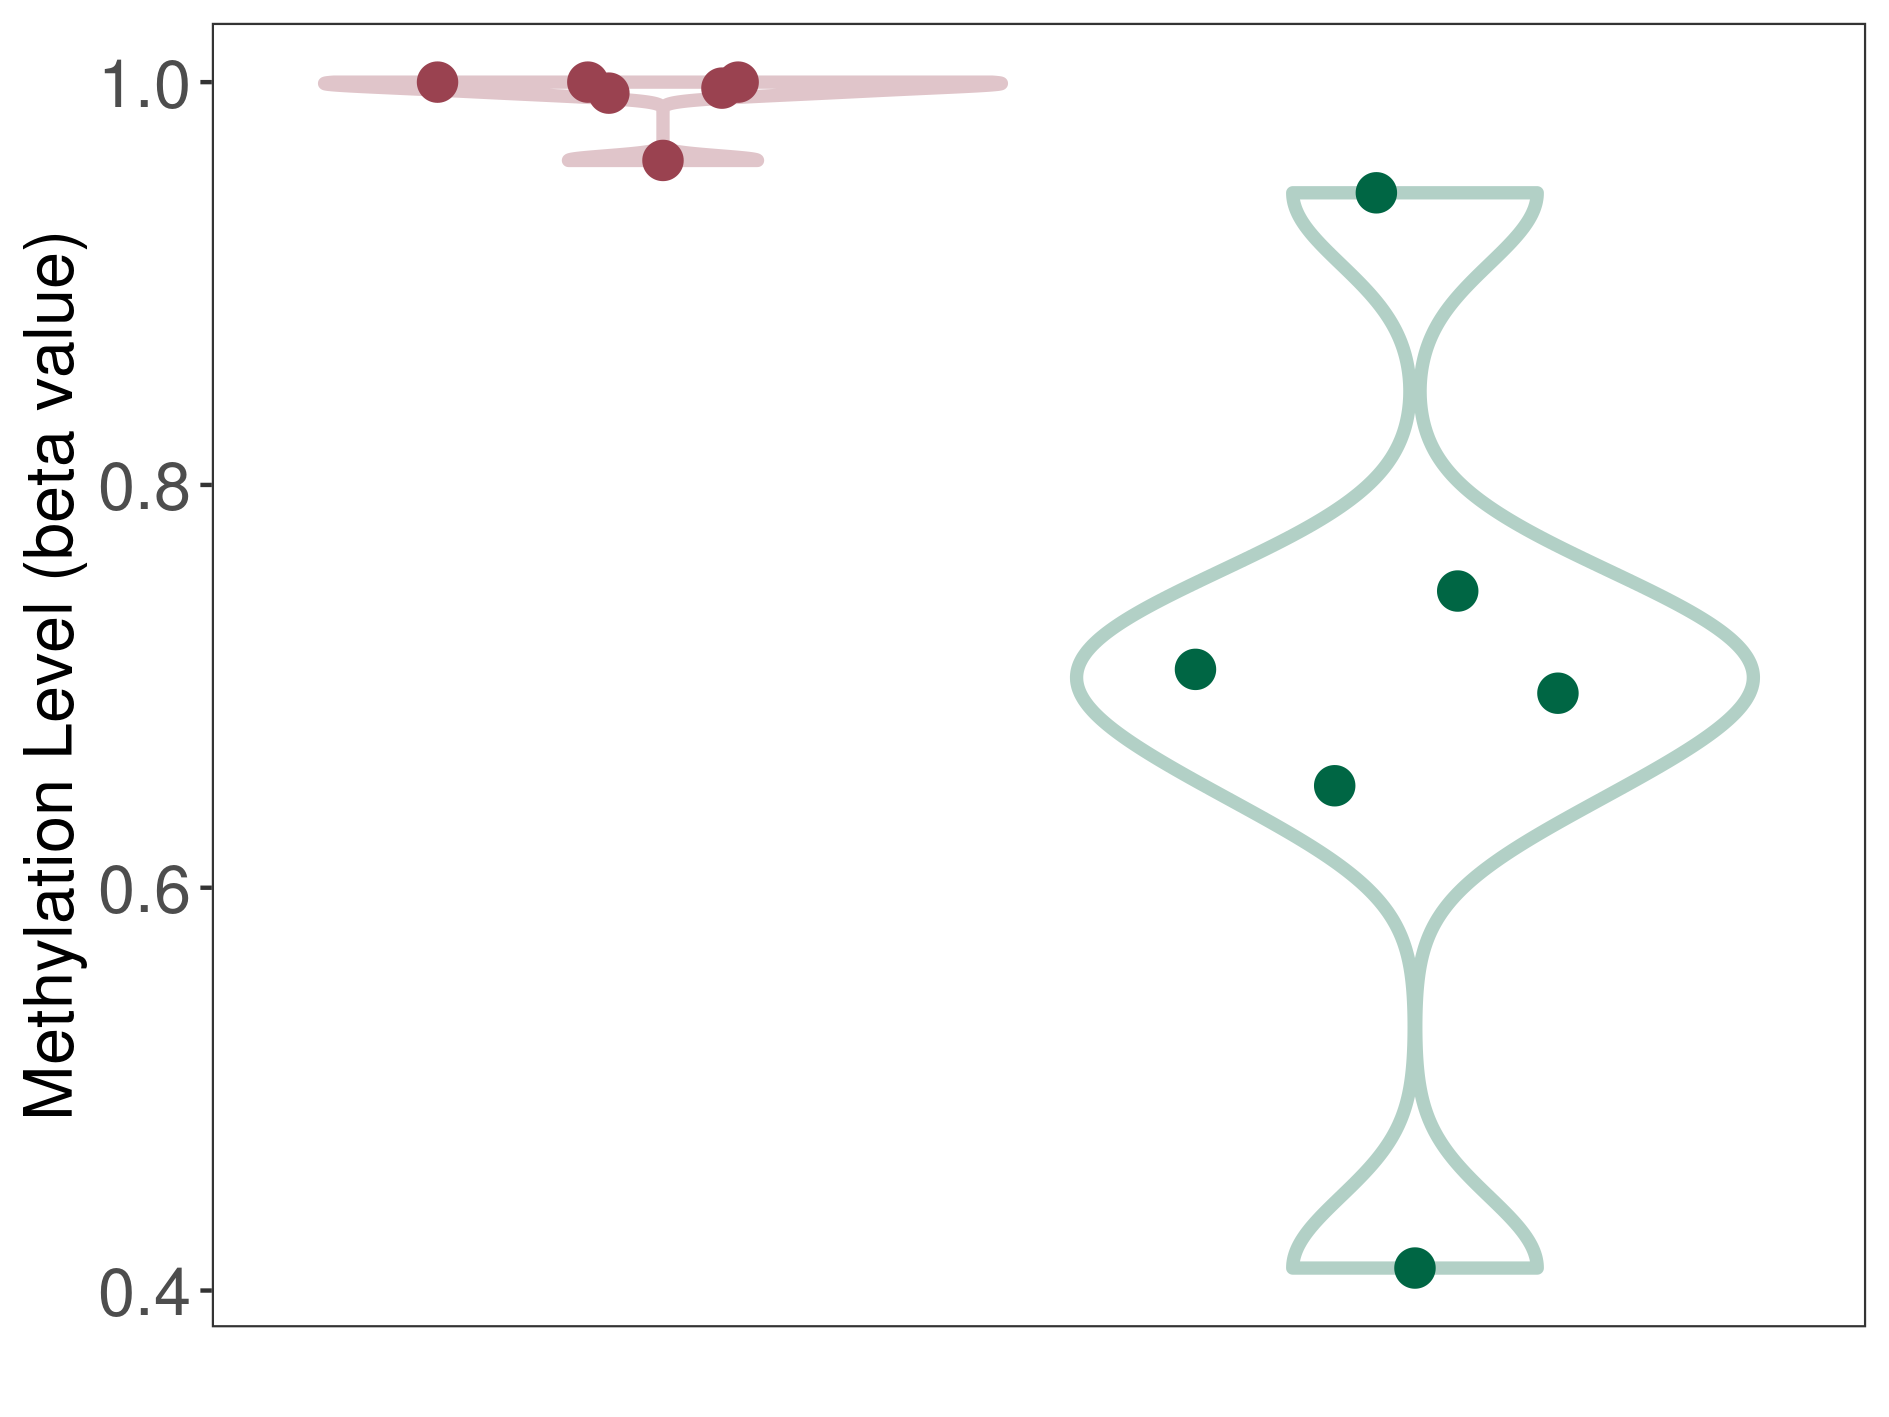
| The Methylation Level of Disease Section Compare with the Healthy Individual Tissue | Moderate hypermethylation p-value: 7.89E-03; delta-beta: 2.96E-01 | ||||
| Description | DNA methyltransferase (DNMT) is reported to moderatly hyper-methylate the ASNS gene, which leads to a moderatly decreased expression of the drug-metabolizing enzyme Asparagine synthetase. As a result, the interaction between DNMT and ASNS can moderatly affect the drug-metabolizing process of Asparagine synthetase. | ||||
|
DME methylation in the diseased tissue of patients
DME methylation in the normal tissue of healthy individuals
|
|||||
| Violin Diagram of DME Disease-specific Methylation Level |
|
Click to View the Clearer Original Diagram | |||
| ICD Disease Classification 02 Neoplasms | |||||
| ICD-11: 2A00 Brain cancer | Click to Show/Hide the Full List of HOSPPI: 1 HOSPPI | ||||
| DNA methylation | |||||
| DNA methyltransferase (DNMT) | Brain neuroblastoma | Moderate hypomethylation | |||
| Interaction Name | DNMT-ASNS interaction | ||||
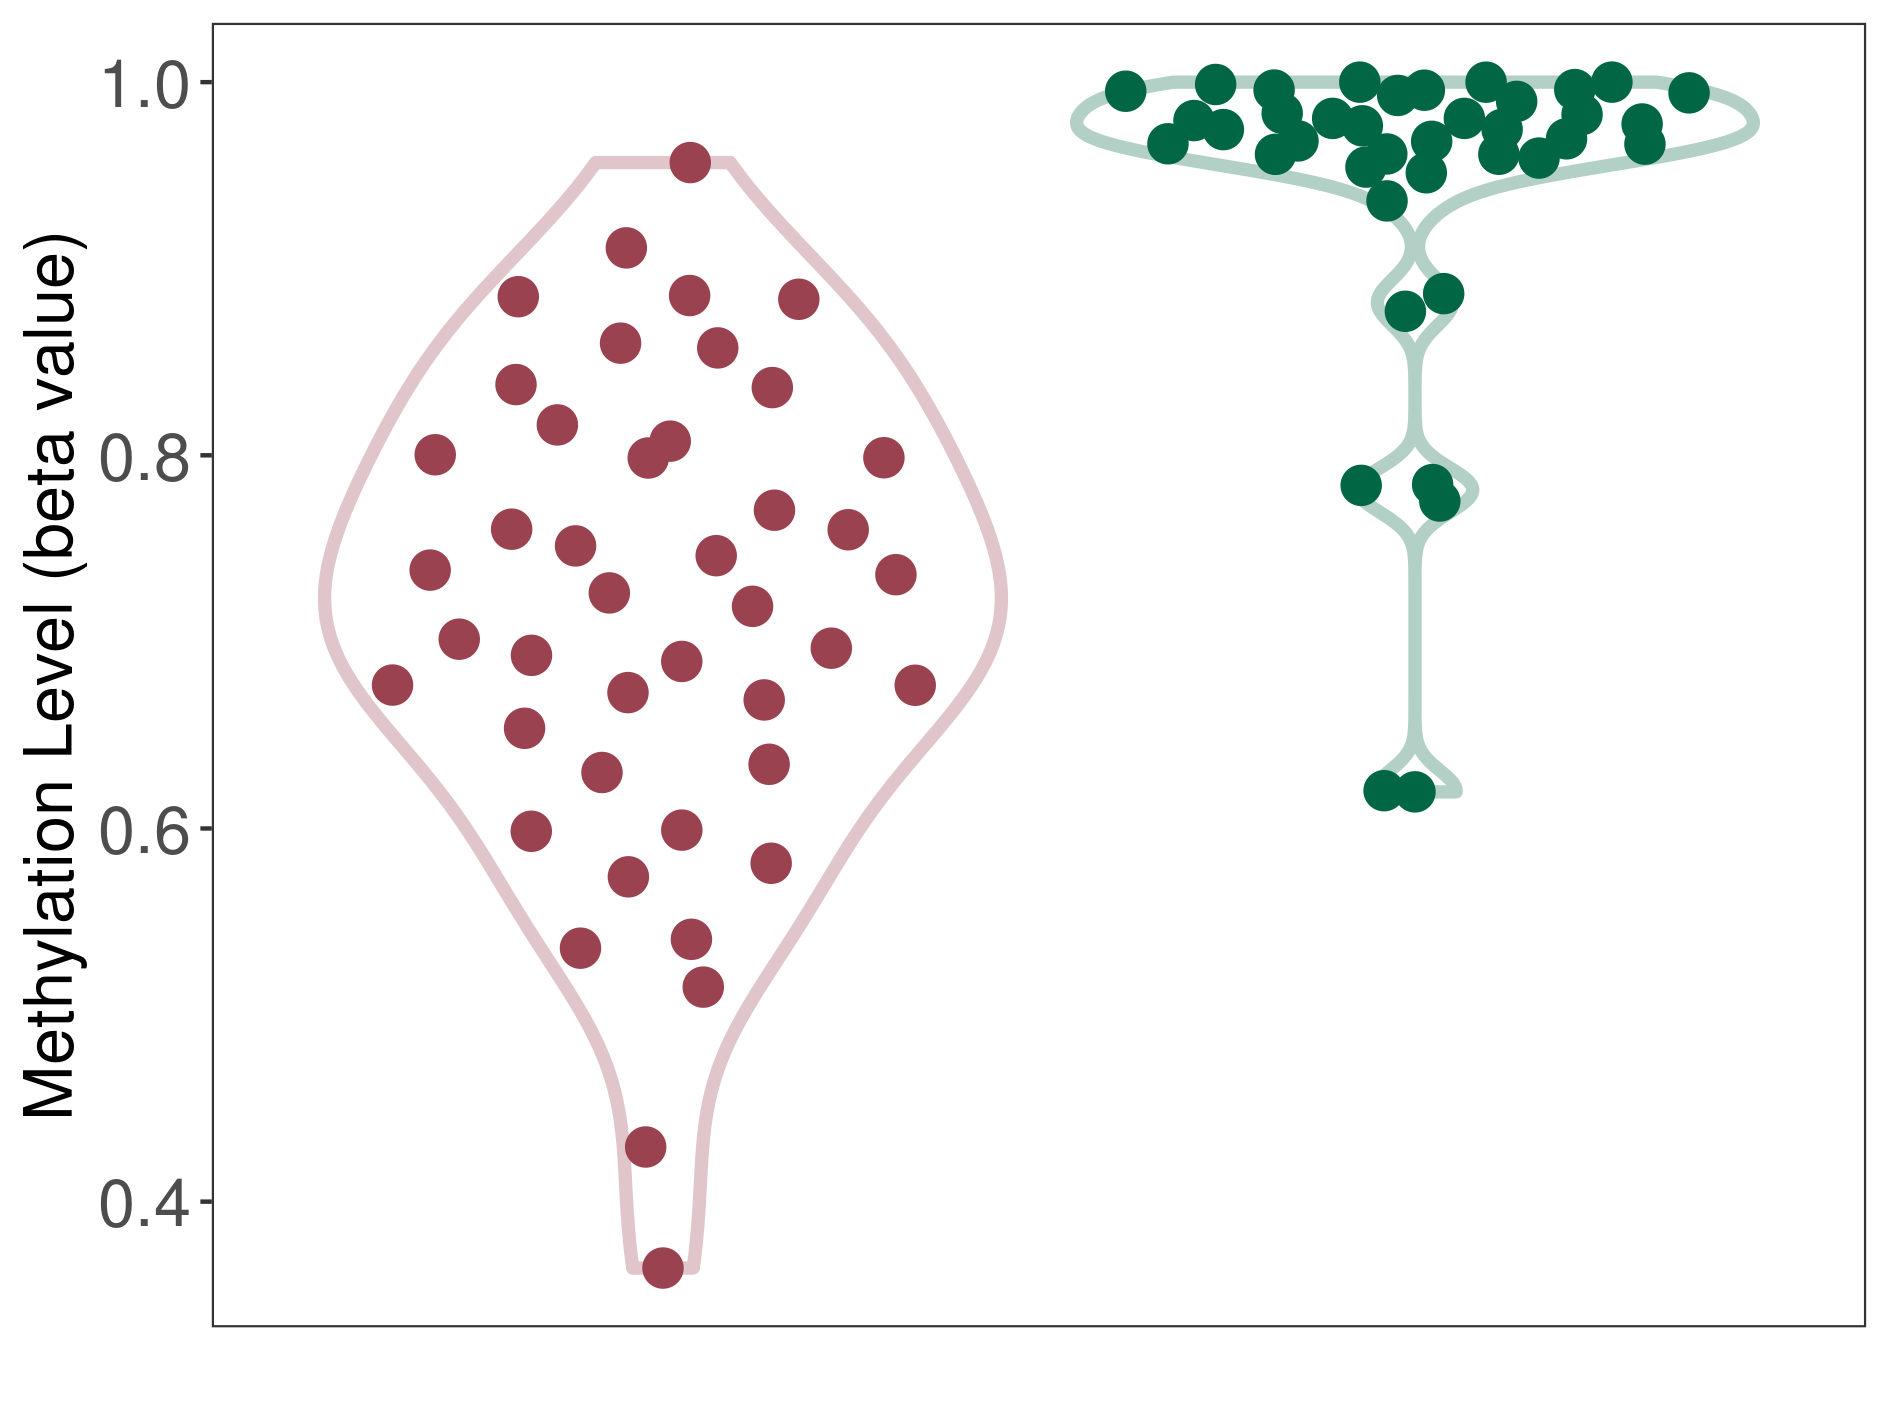
| The Methylation Level of Disease Section Compare with the Healthy Individual Tissue | Moderate hypomethylation p-value: 1.30E-13; delta-beta: -2.48E-01 | ||||
| Description | DNA methyltransferase (DNMT) is reported to moderatly hypo-methylate the ASNS gene, which leads to a moderatly increased expression of the drug-metabolizing enzyme Asparagine synthetase. As a result, the interaction between DNMT and ASNS can moderatly affect the drug-metabolizing process of Asparagine synthetase. | ||||
|
DME methylation in the diseased tissue of patients
DME methylation in the normal tissue of healthy individuals
|
|||||
| Violin Diagram of DME Disease-specific Methylation Level |
|
Click to View the Clearer Original Diagram | |||
| ICD-11: 2B90 Colorectal cancer | Click to Show/Hide the Full List of HOSPPI: 1 HOSPPI | ||||
| Transcription-factor regulation | |||||
| WW-containing regulator 1 (WWTR1) | Colorectal cancer | Repression | |||
| Uniprot ID | |||||
| Interaction Name | WWTR1-ASNS interaction | [2] | |||
| Studied Cell Lines | RKO and HCT116 cell lines | ||||
| Description | WW-containing regulator 1 (WWTR1) is reported to repress the transcription of ASNS gene, which leads to a decreased expression of the drug-metabolizing enzyme Asparagine synthetase. As a result, the interaction between WWTR1 and ASNS can repress the drug-metabolizing process of Asparagine synthetase. | ||||
| ICD-11: 2C12 Liver cancer | Click to Show/Hide the Full List of HOSPPI: 2 HOSPPI | ||||
| Transcription-factor regulation | |||||
| Activating TF factor 3 (ATF3) | Liver cancer | Activation | |||
| Uniprot ID | |||||
| Interaction Name | ATF3-ASNS interaction | [3] | |||
| Studied Cell Lines | HepG2 cell line | ||||
| Ensembl ID | |||||
| Description | Activating TF factor 3 (ATF3) is reported to activate the transcription of ASNS gene, which leads to an increased expression of the drug-metabolizing enzyme Asparagine synthetase. As a result, the interaction between ATF3 and ASNS can activate the drug-metabolizing process of Asparagine synthetase. | ||||
| Activating TF factor 4 (ATF4) | Liver cancer | Activation | |||
| Uniprot ID | |||||
| Interaction Name | ATF4-ASNS interaction | [4], [5], [6] | |||
| Studied Cell Lines | HepG2 cell line | ||||
| Ensembl ID | |||||
| Description | Activating TF factor 4 (ATF4) is reported to activate the transcription of ASNS gene, which leads to an increased expression of the drug-metabolizing enzyme Asparagine synthetase. As a result, the interaction between ATF4 and ASNS can activate the drug-metabolizing process of Asparagine synthetase. | ||||
| ICD-11: 2D50 Brain cancer metastasis | Click to Show/Hide the Full List of HOSPPI: 1 HOSPPI | ||||
| DNA methylation | |||||
| DNA methyltransferase (DNMT) | Esthesioneuroblastoma | Moderate hypomethylation | |||
| Interaction Name | DNMT-ASNS interaction | ||||
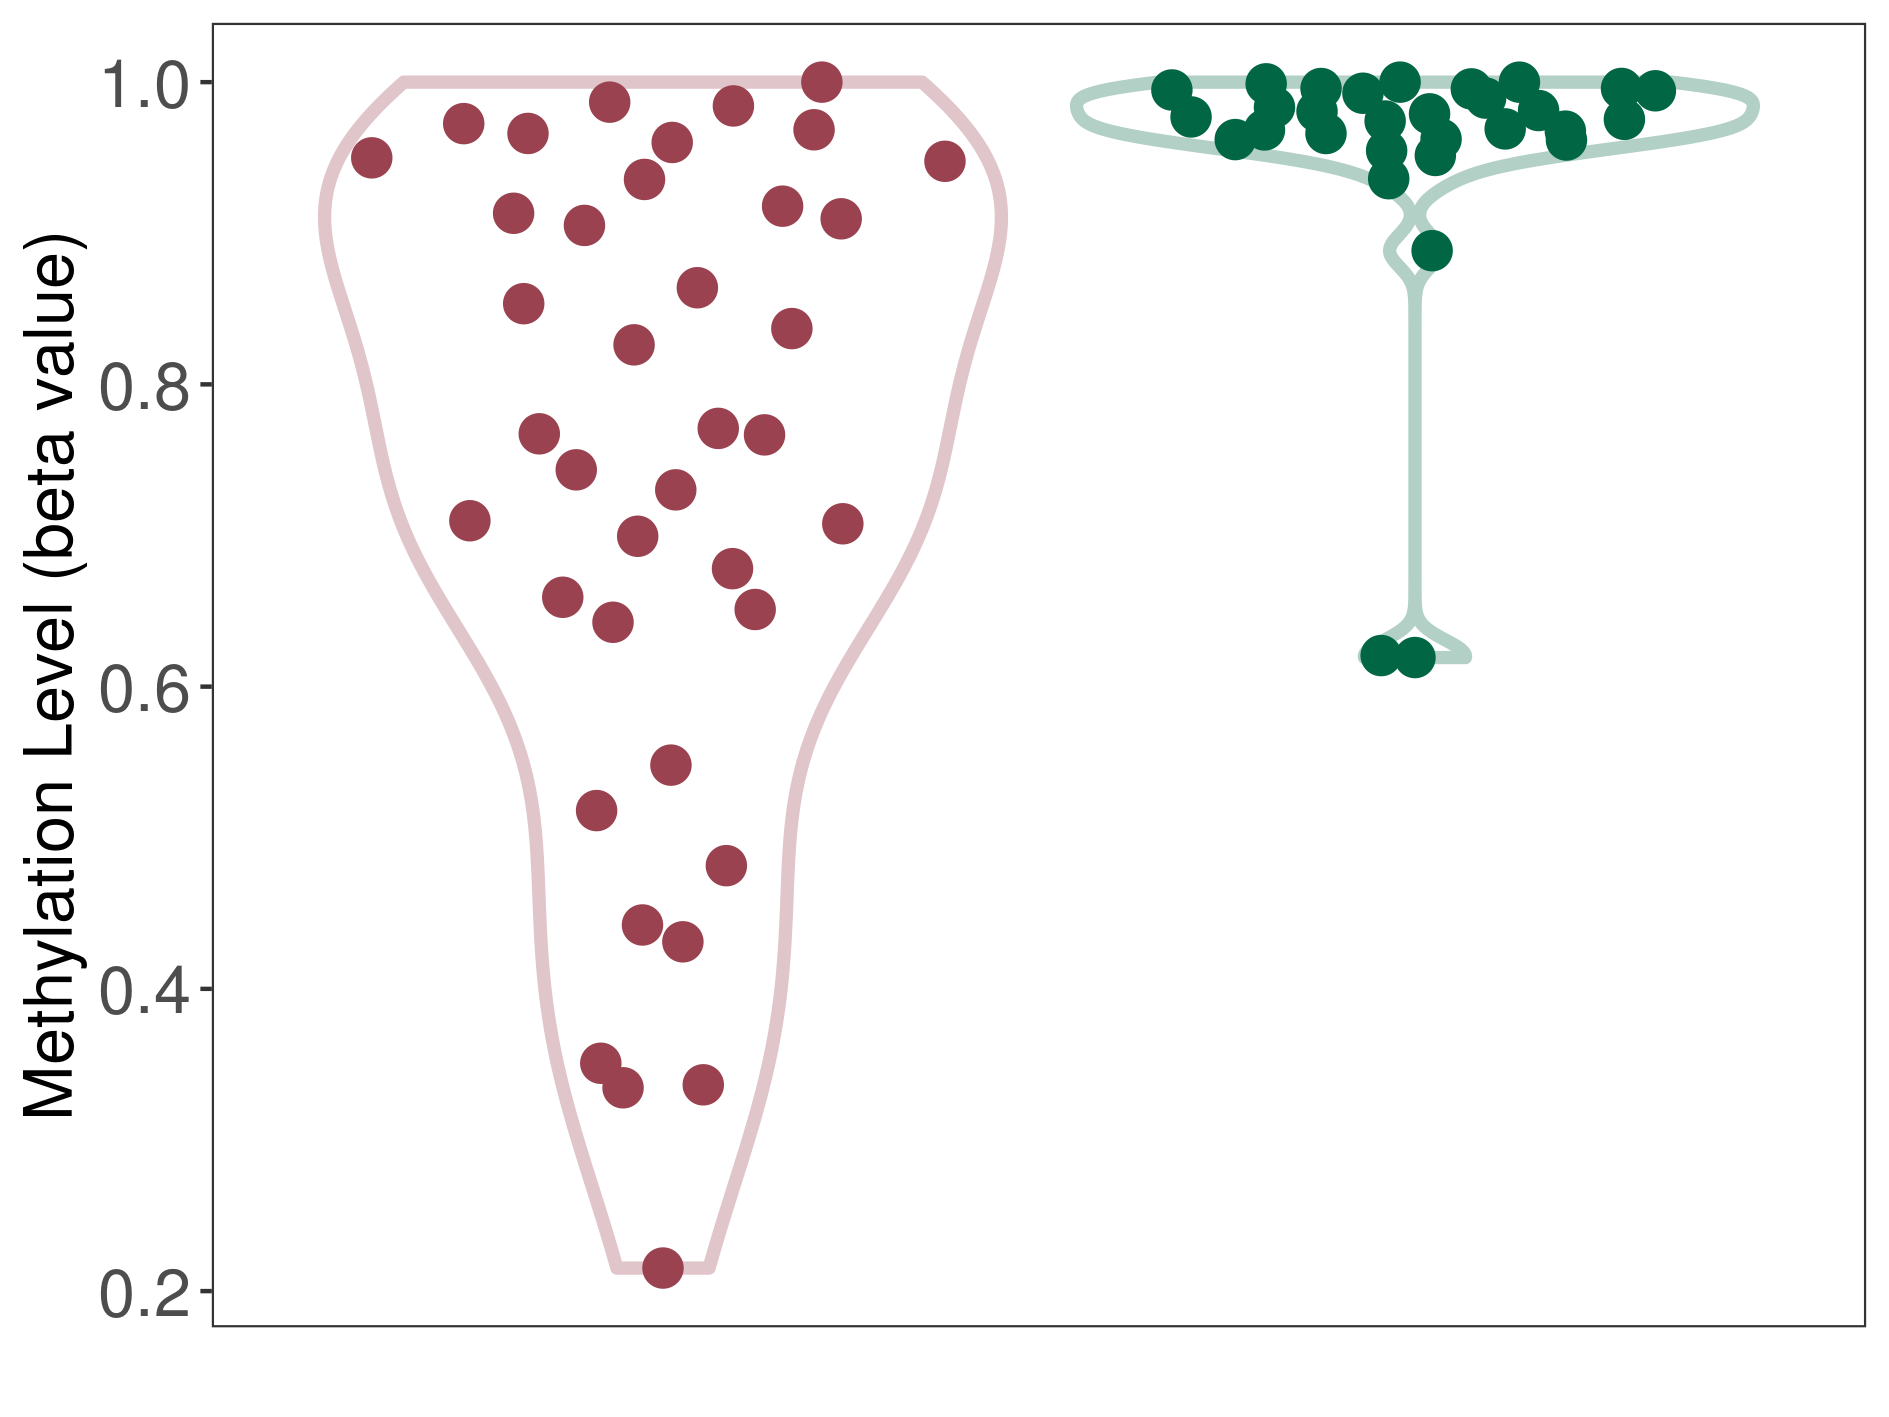
| The Methylation Level of Disease Section Compare with the Healthy Individual Tissue | Moderate hypomethylation p-value: 1.39E-06; delta-beta: -2.09E-01 | ||||
| Description | DNA methyltransferase (DNMT) is reported to moderatly hypo-methylate the ASNS gene, which leads to a moderatly increased expression of the drug-metabolizing enzyme Asparagine synthetase. As a result, the interaction between DNMT and ASNS can moderatly affect the drug-metabolizing process of Asparagine synthetase. | ||||
|
DME methylation in the diseased tissue of patients
DME methylation in the normal tissue of healthy individuals
|
|||||
| Violin Diagram of DME Disease-specific Methylation Level |
|
Click to View the Clearer Original Diagram | |||
If you find any error in data or bug in web service, please kindly report it to Dr. Yin and Dr. Li.