

Details of Host Protein-DME Interaction (HOSPPI)
| General Information of Drug-Metabolizing Enzyme (DME ID: DME0166) | |||||
|---|---|---|---|---|---|
| DME Name | Transglutaminase K (TGM1), Homo sapiens | DME Info | |||
| UniProt ID | |||||
| EC Number | EC: 2.3.2.13 (Click to Show/Hide the Complete EC Tree) | ||||
| Lineage | Species: Homo sapiens (Click to Show/Hide the Complete Species Lineage) | ||||
| Interactome | |||||
| Disease Specific Interactions between Host Protein and DME (HOSPPI) | |||||
|---|---|---|---|---|---|
| ICD Disease Classification Healthy | |||||
| ICD-11: Healthy | Click to Show/Hide the Full List of HOSPPI: 1 HOSPPI | ||||
| Histone modification | |||||
| Histone deacetylase 3 (HDAC3) | Health | Repression | |||
| Uniprot ID | |||||
| Interaction Name | HDAC3-TGM1 interaction | [1] | |||
| Studied Cell Lines | Basal cells | ||||
| Description | Histone deacetylase 3 (HDAC3) is reported to deacetylate the TGM1 gene and thereby represses the transcriptional activity of the drug-metabolizing enzyme Transglutaminase K. As a result, the interaction between HDAC3 and TGM1 can inhibit the drug-metabolizing process of Transglutaminase K. | ||||
| ICD Disease Classification 02 Neoplasms | |||||
| ICD-11: 2A00 Brain cancer | Click to Show/Hide the Full List of HOSPPI: 1 HOSPPI | ||||
| DNA methylation | |||||
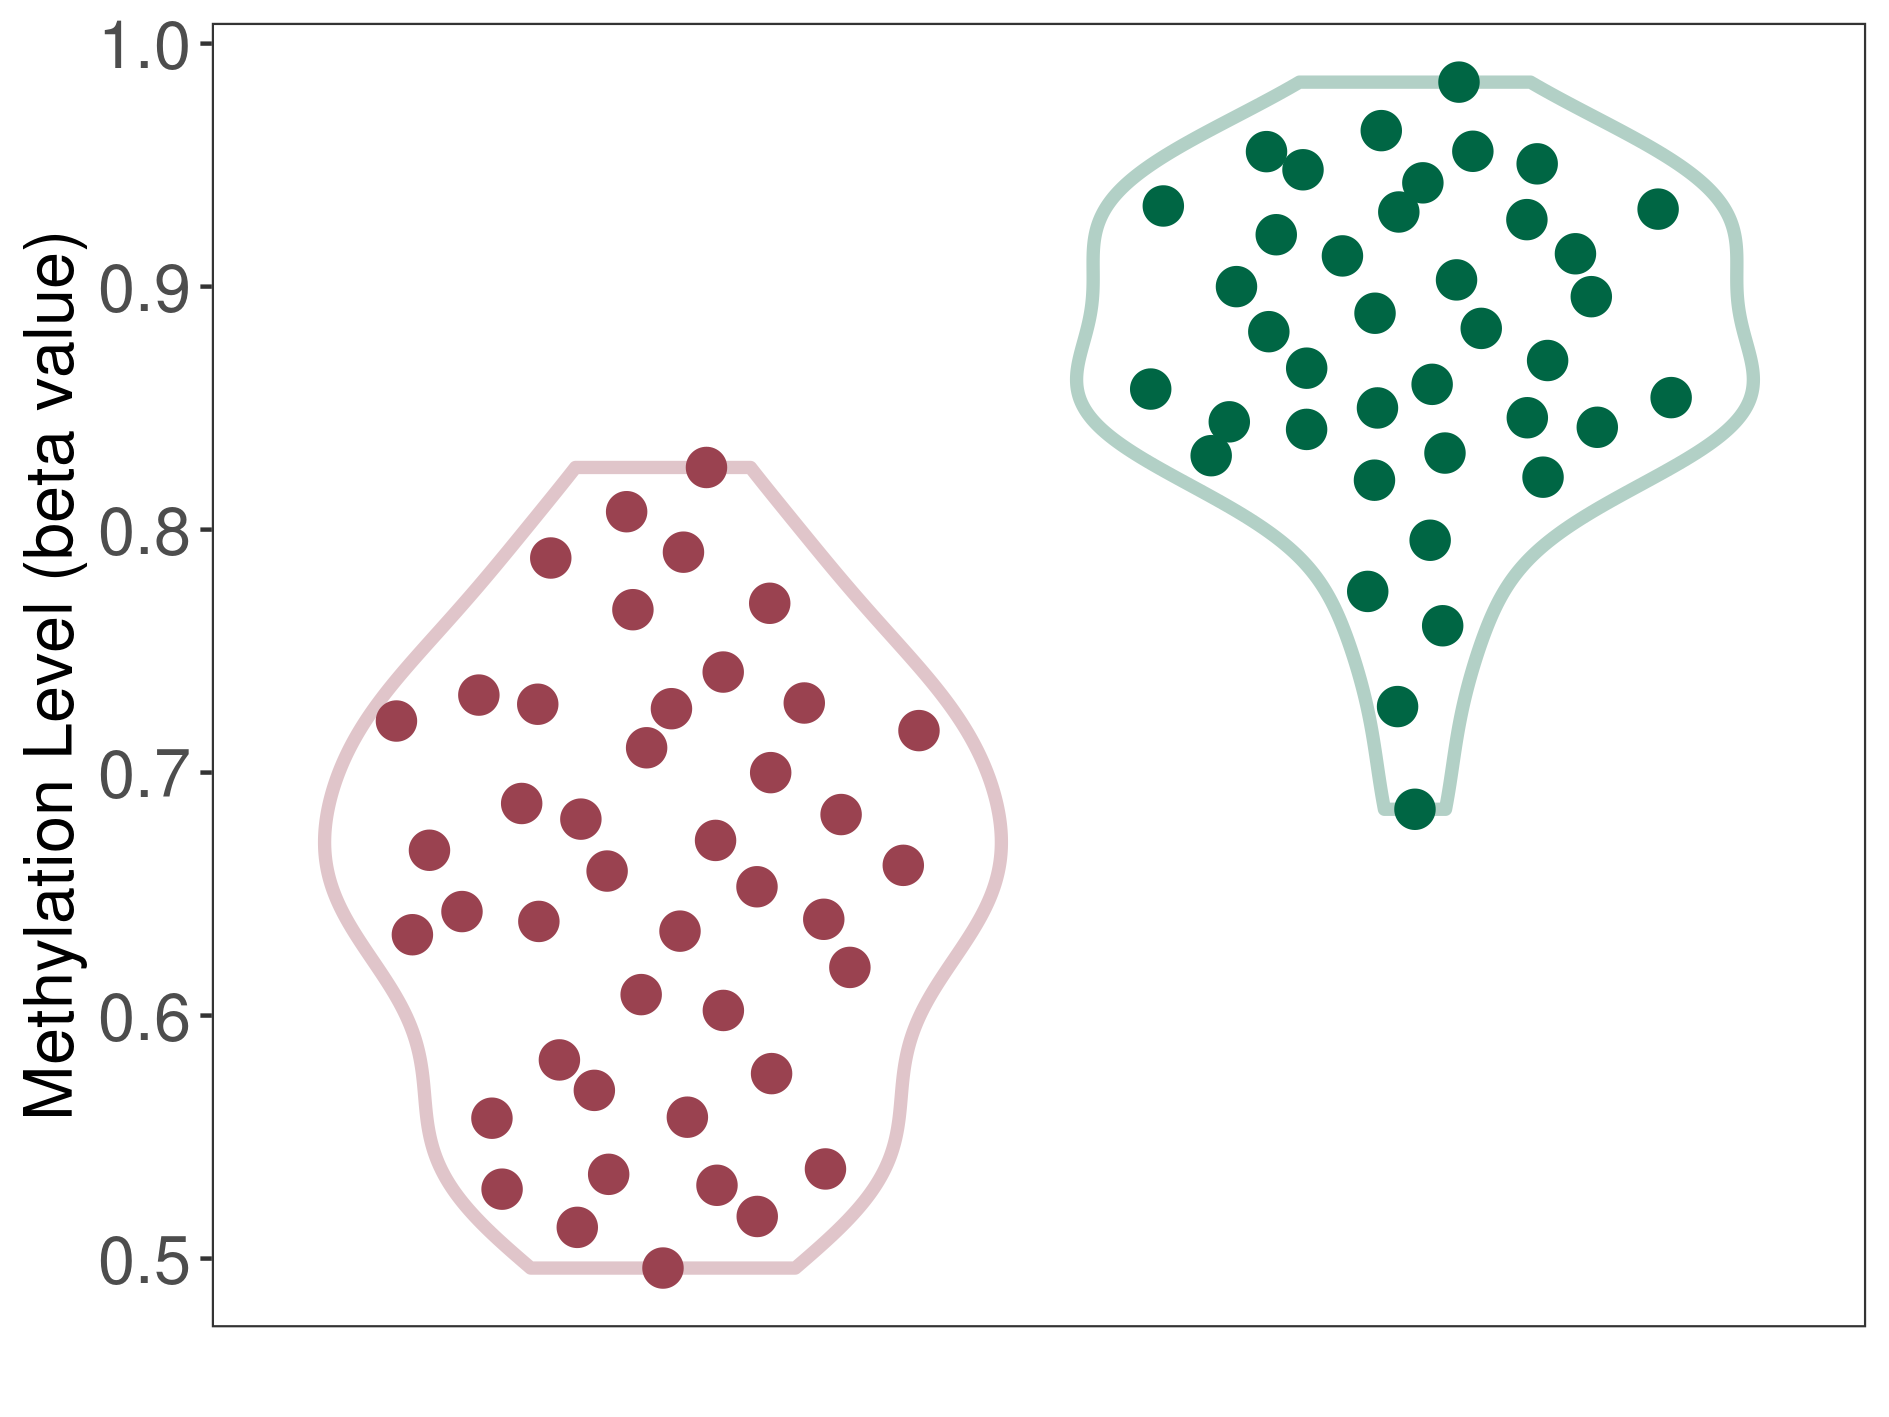
| DNA methyltransferase (DNMT) | Brain neuroblastoma | Moderate hypomethylation | |||
| Interaction Name | DNMT-TGM1 interaction | ||||
| The Methylation Level of Disease Section Compare with the Healthy Individual Tissue | Moderate hypomethylation p-value: 1.01E-20; delta-beta: -2.22E-01 | ||||
| Description | DNA methyltransferase (DNMT) is reported to moderatly hypo-methylate the TGM1 gene, which leads to a moderatly increased expression of the drug-metabolizing enzyme Transglutaminase K. As a result, the interaction between DNMT and TGM1 can moderatly affect the drug-metabolizing process of Transglutaminase K. | ||||
|
DME methylation in the diseased tissue of patients
DME methylation in the normal tissue of healthy individuals
|
|||||
| Violin Diagram of DME Disease-specific Methylation Level |
|
Click to View the Clearer Original Diagram | |||
| ICD-11: 2B30 Lymphoma | Click to Show/Hide the Full List of HOSPPI: 1 HOSPPI | ||||
| DNA methylation | |||||
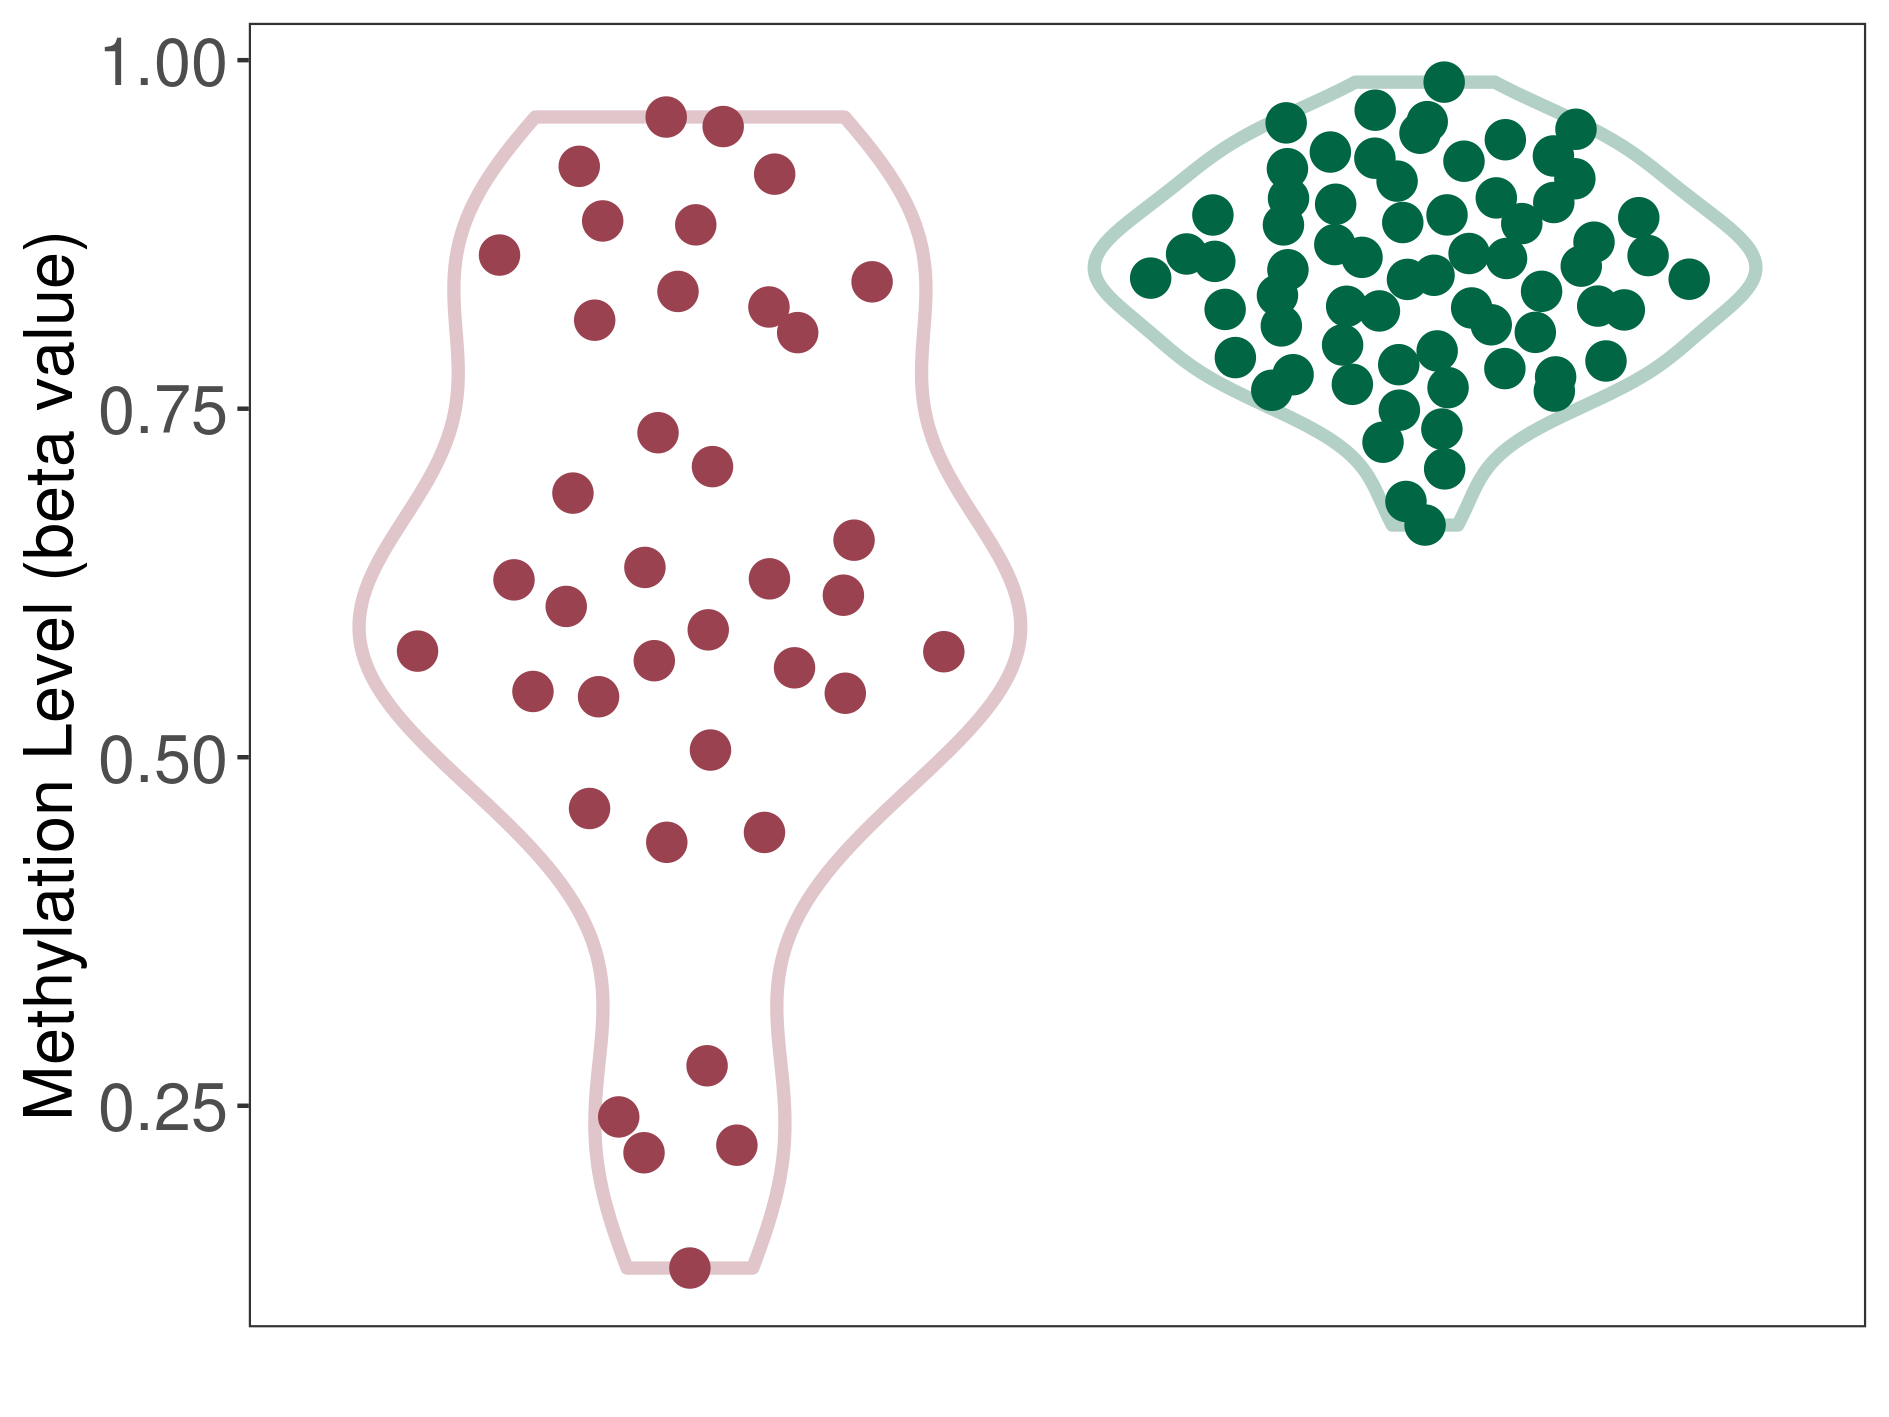
| DNA methyltransferase (DNMT) | Lymphoma | Moderate hypomethylation | |||
| Interaction Name | DNMT-TGM1 interaction | ||||
| The Methylation Level of Disease Section Compare with the Healthy Individual Tissue | Moderate hypomethylation p-value: 4.94E-07; delta-beta: -2.28E-01 | ||||
| Description | DNA methyltransferase (DNMT) is reported to moderatly hypo-methylate the TGM1 gene, which leads to a moderatly increased expression of the drug-metabolizing enzyme Transglutaminase K. As a result, the interaction between DNMT and TGM1 can moderatly affect the drug-metabolizing process of Transglutaminase K. | ||||
|
DME methylation in the diseased tissue of patients
DME methylation in the normal tissue of healthy individuals
|
|||||
| Violin Diagram of DME Disease-specific Methylation Level |
|
Click to View the Clearer Original Diagram | |||
| ICD Disease Classification 05 Endocrine/nutritional/metabolic diseases | |||||
| ICD-11: 5B81 Obesity | Click to Show/Hide the Full List of HOSPPI: 1 HOSPPI | ||||
| DNA methylation | |||||
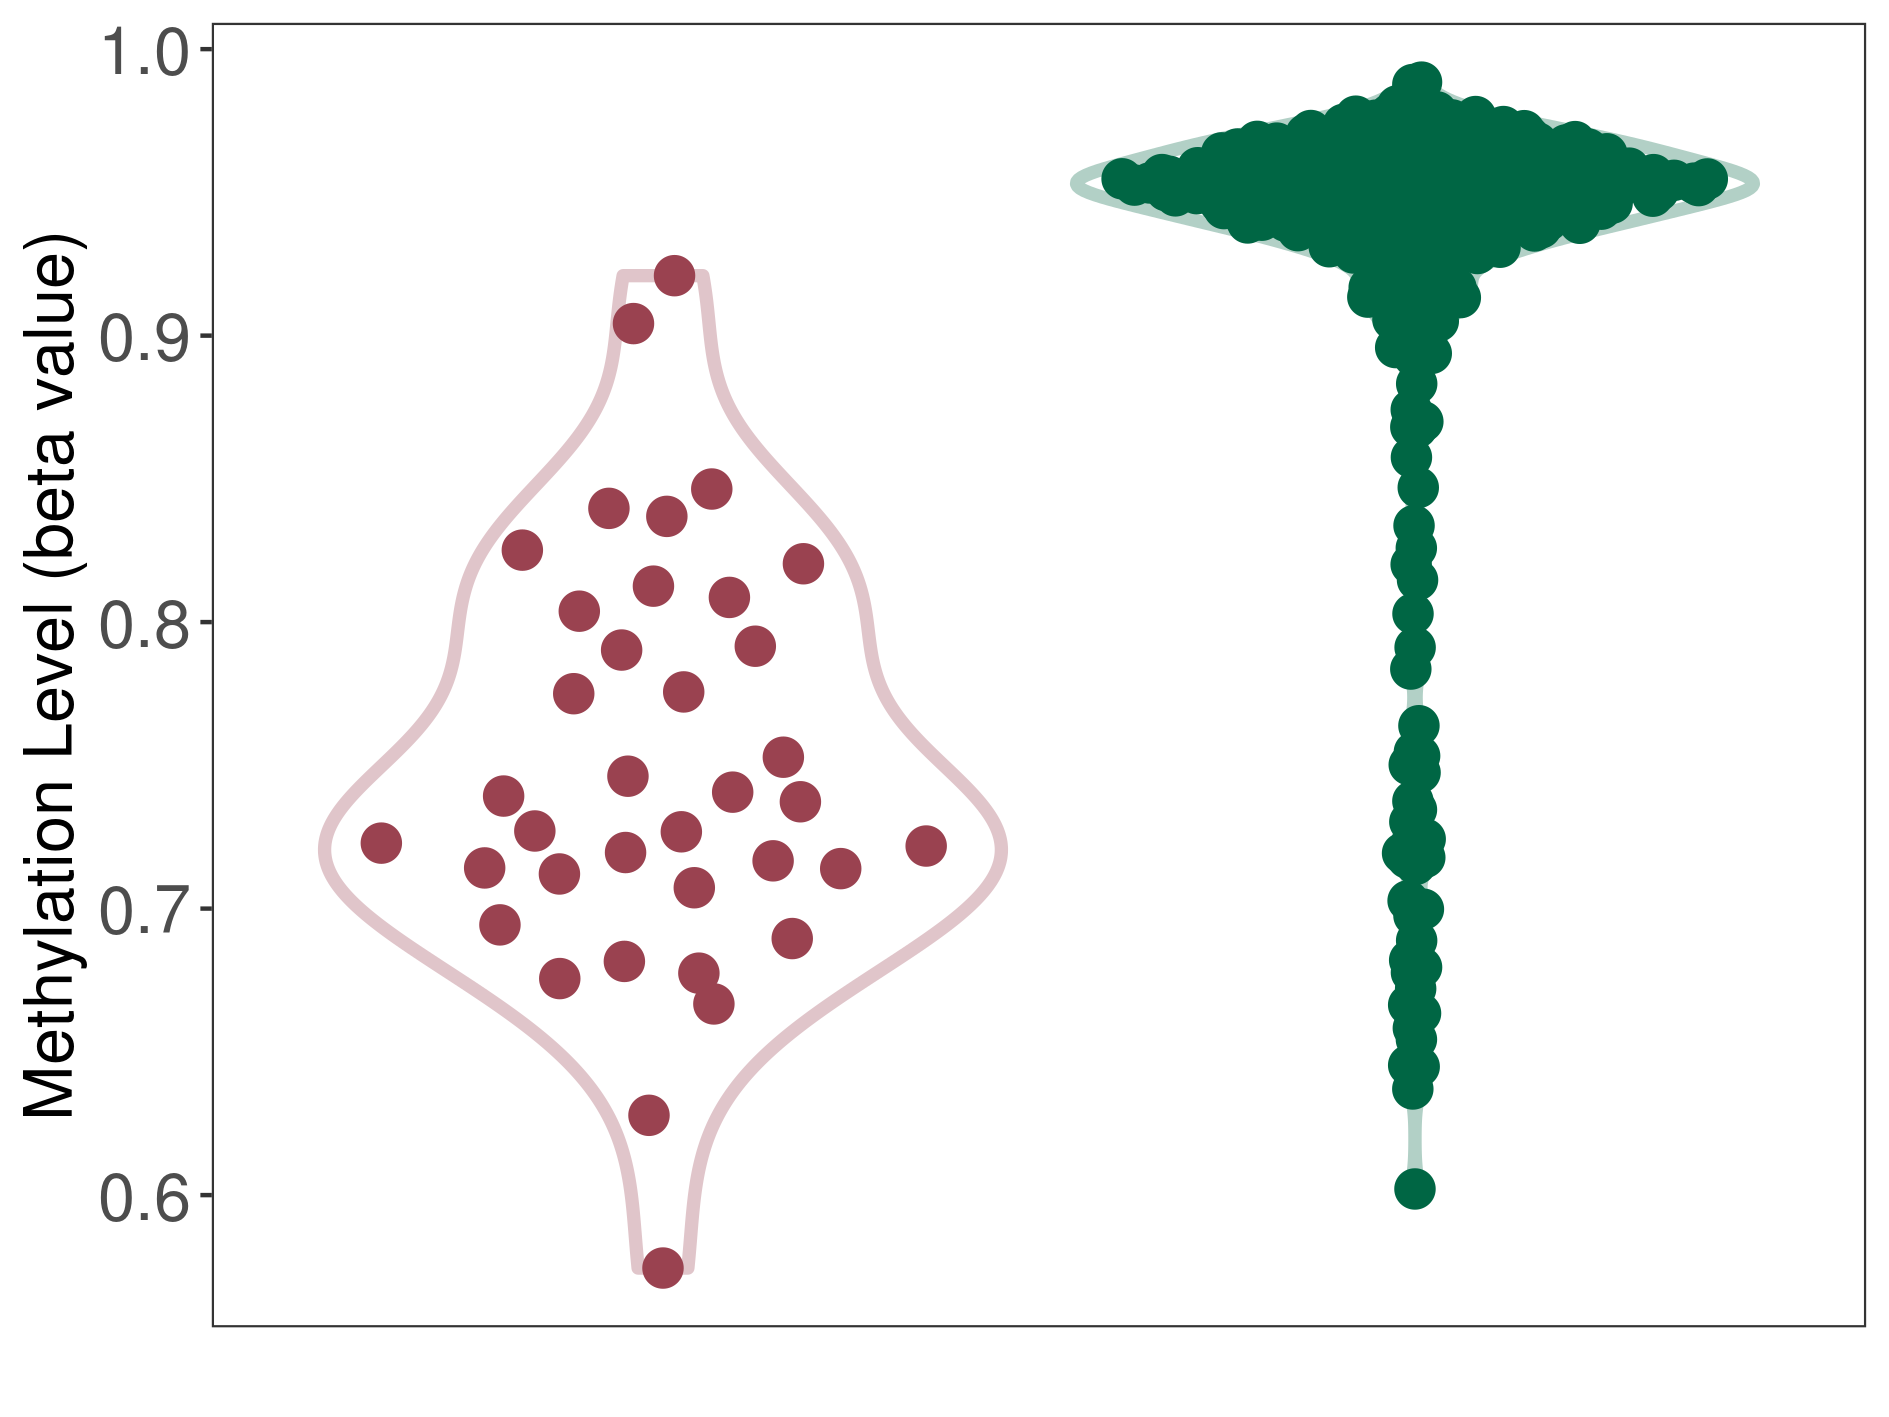
| DNA methyltransferase (DNMT) | Obesity | Moderate hypomethylation | |||
| Interaction Name | DNMT-TGM1 interaction | ||||
| The Methylation Level of Disease Section Compare with the Healthy Individual Tissue | Moderate hypomethylation p-value: 1.02E-17; delta-beta: -2.12E-01 | ||||
| Description | DNA methyltransferase (DNMT) is reported to moderatly hypo-methylate the TGM1 gene, which leads to a moderatly increased expression of the drug-metabolizing enzyme Transglutaminase K. As a result, the interaction between DNMT and TGM1 can moderatly affect the drug-metabolizing process of Transglutaminase K. | ||||
|
DME methylation in the diseased tissue of patients
DME methylation in the normal tissue of healthy individuals
|
|||||
| Violin Diagram of DME Disease-specific Methylation Level |
|
Click to View the Clearer Original Diagram | |||
| References | |||||
|---|---|---|---|---|---|
| 1 | HDAC3 ensures stepwise epidermal stratification via NCoR/SMRT-reliant mechanisms independent of its histone deacetylase activity. Genes Dev. 2020 Jul 1;34(13-14):973-988. | ||||
If you find any error in data or bug in web service, please kindly report it to Dr. Yin and Dr. Li.