

Details of Host Protein-DME Interaction (HOSPPI)
| General Information of Drug-Metabolizing Enzyme (DME ID: DME0191) | |||||
|---|---|---|---|---|---|
| DME Name | Folylpolyglutamate synthase (FPGS), Homo sapiens | DME Info | |||
| UniProt ID | |||||
| EC Number | EC: 6.3.2.17 (Click to Show/Hide the Complete EC Tree) | ||||
| Lineage | Species: Homo sapiens (Click to Show/Hide the Complete Species Lineage) | ||||
| Interactome | |||||
| Disease Specific Interactions between Host Protein and DME (HOSPPI) | |||||
|---|---|---|---|---|---|
| ICD Disease Classification 02 Neoplasms | |||||
| ICD-11: 2A00 Brain cancer | Click to Show/Hide the Full List of HOSPPI: 2 HOSPPI | ||||
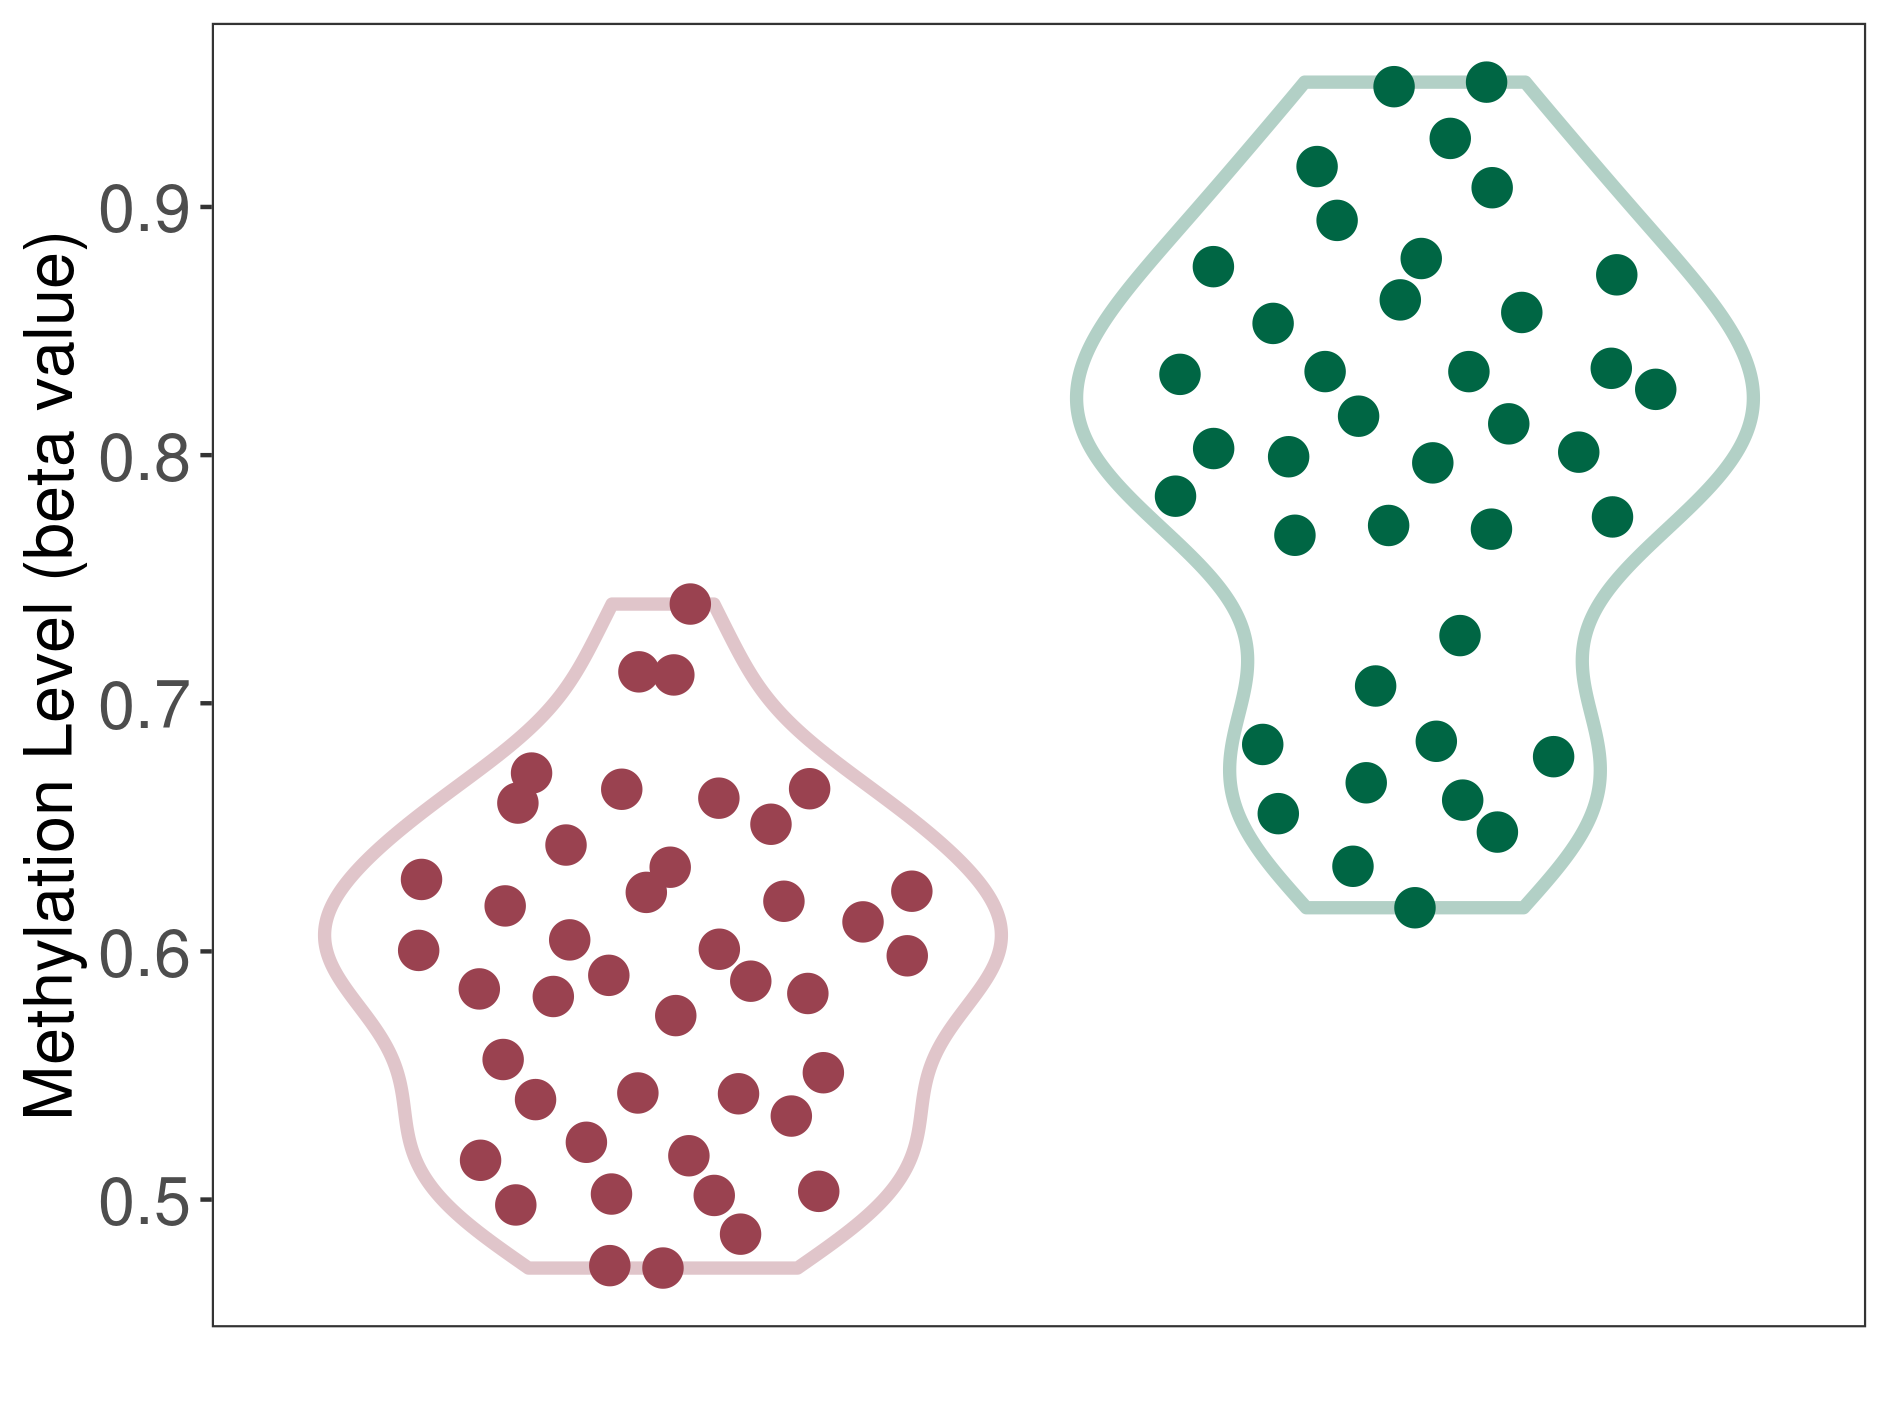
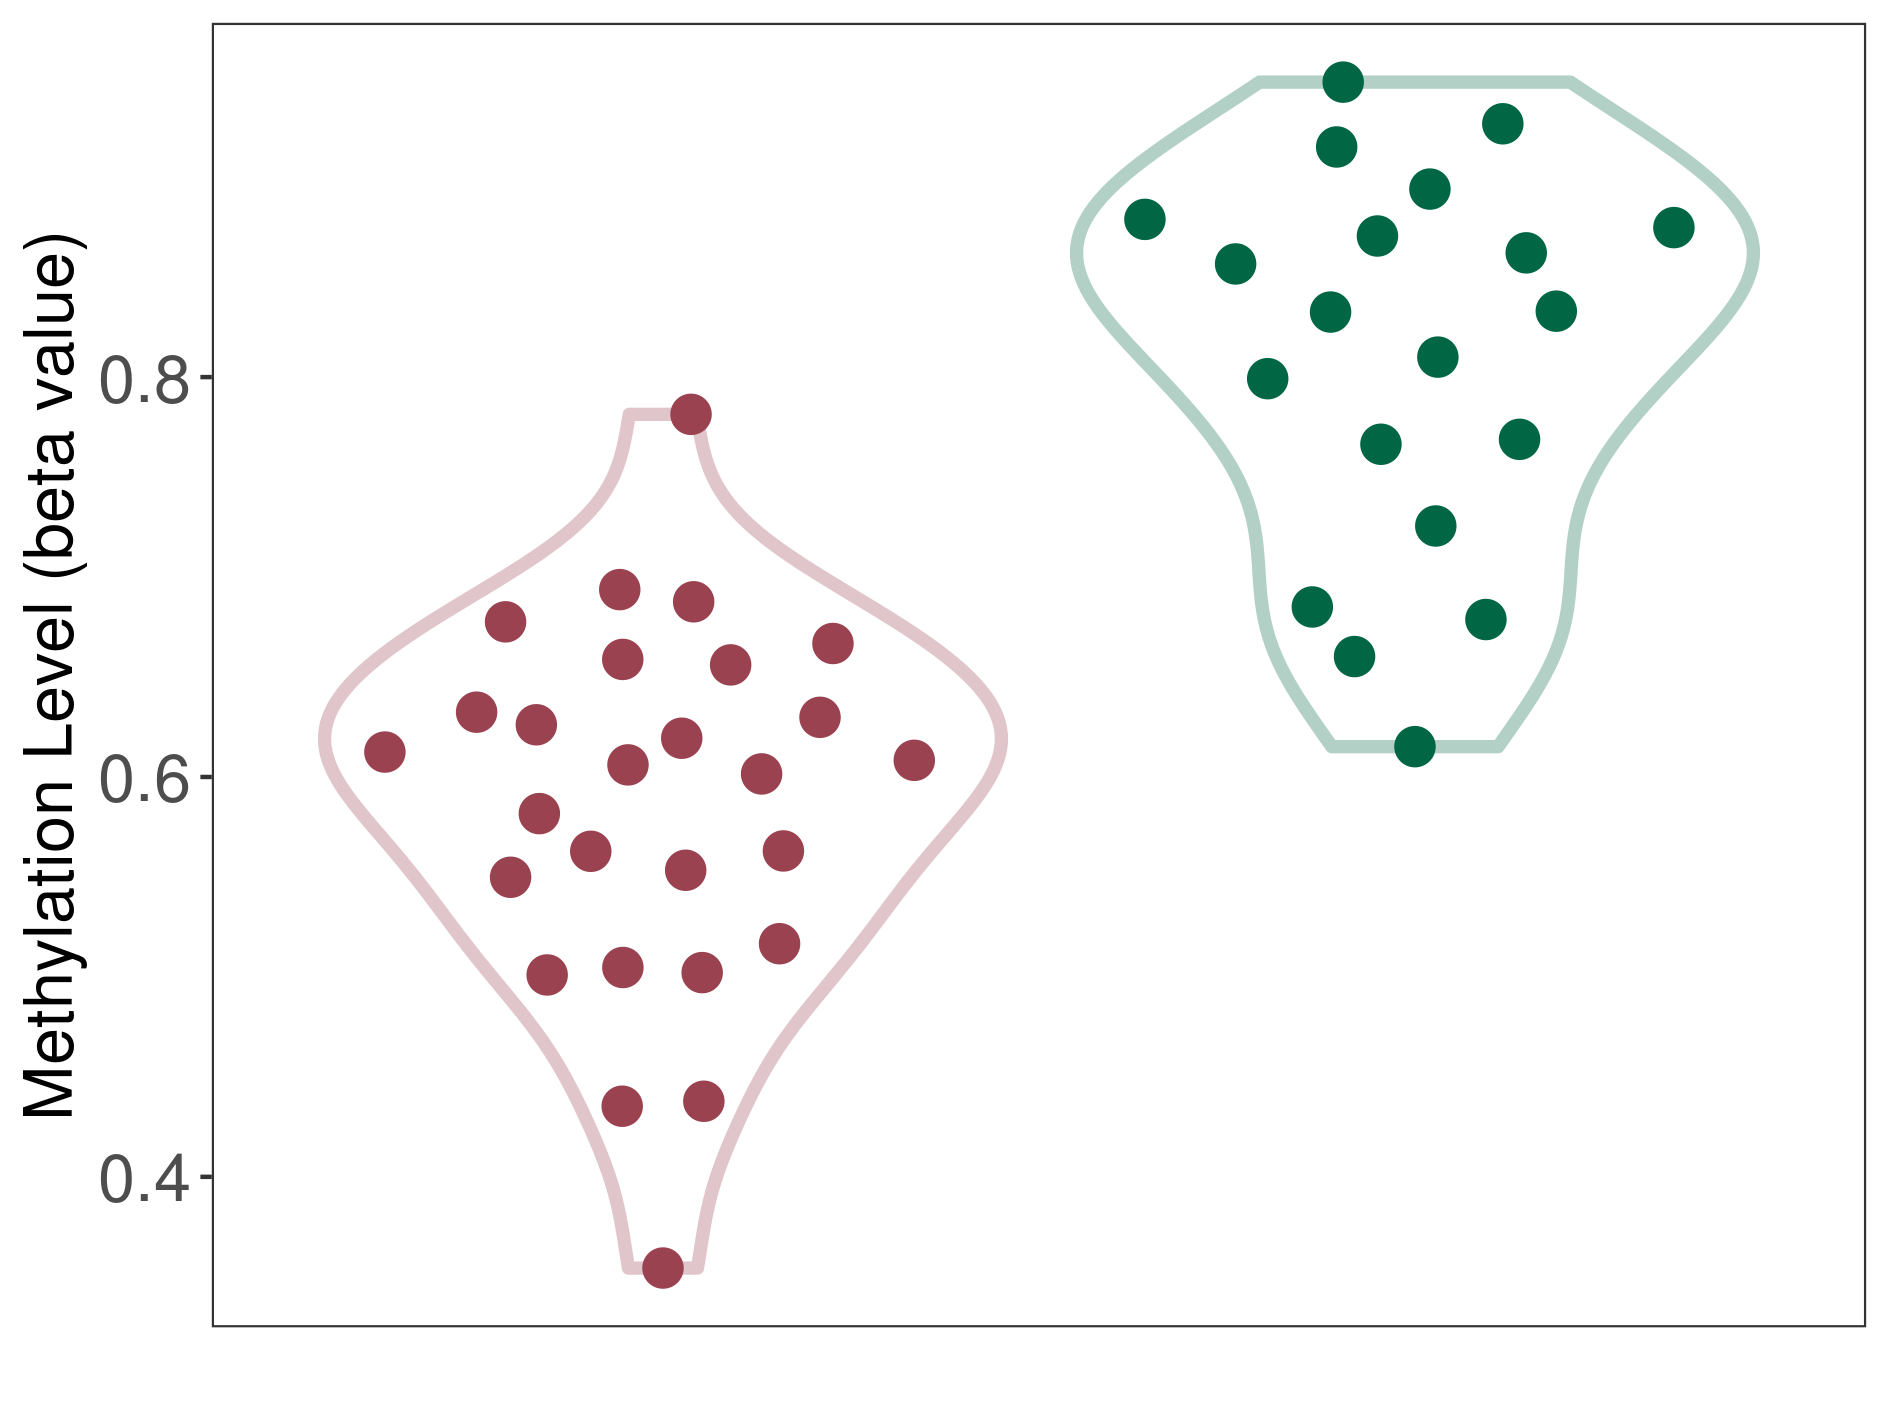
| DNA methylation | |||||
| DNA methyltransferase (DNMT) | Brain neuroblastoma | Moderate hypomethylation | |||
| Interaction Name | DNMT-FPGS interaction | ||||
| The Methylation Level of Disease Section Compare with the Healthy Individual Tissue | Moderate hypomethylation p-value: 1.96E-17; delta-beta: -2.12E-01 | ||||
| Description | DNA methyltransferase (DNMT) is reported to moderatly hypo-methylate the FPGS gene, which leads to a moderatly increased expression of the drug-metabolizing enzyme Folylpolyglutamate synthase. As a result, the interaction between DNMT and FPGS can moderatly affect the drug-metabolizing process of Folylpolyglutamate synthase. | ||||
|
DME methylation in the diseased tissue of patients
DME methylation in the normal tissue of healthy individuals
|
|||||
| Violin Diagram of DME Disease-specific Methylation Level |
|
Click to View the Clearer Original Diagram | |||
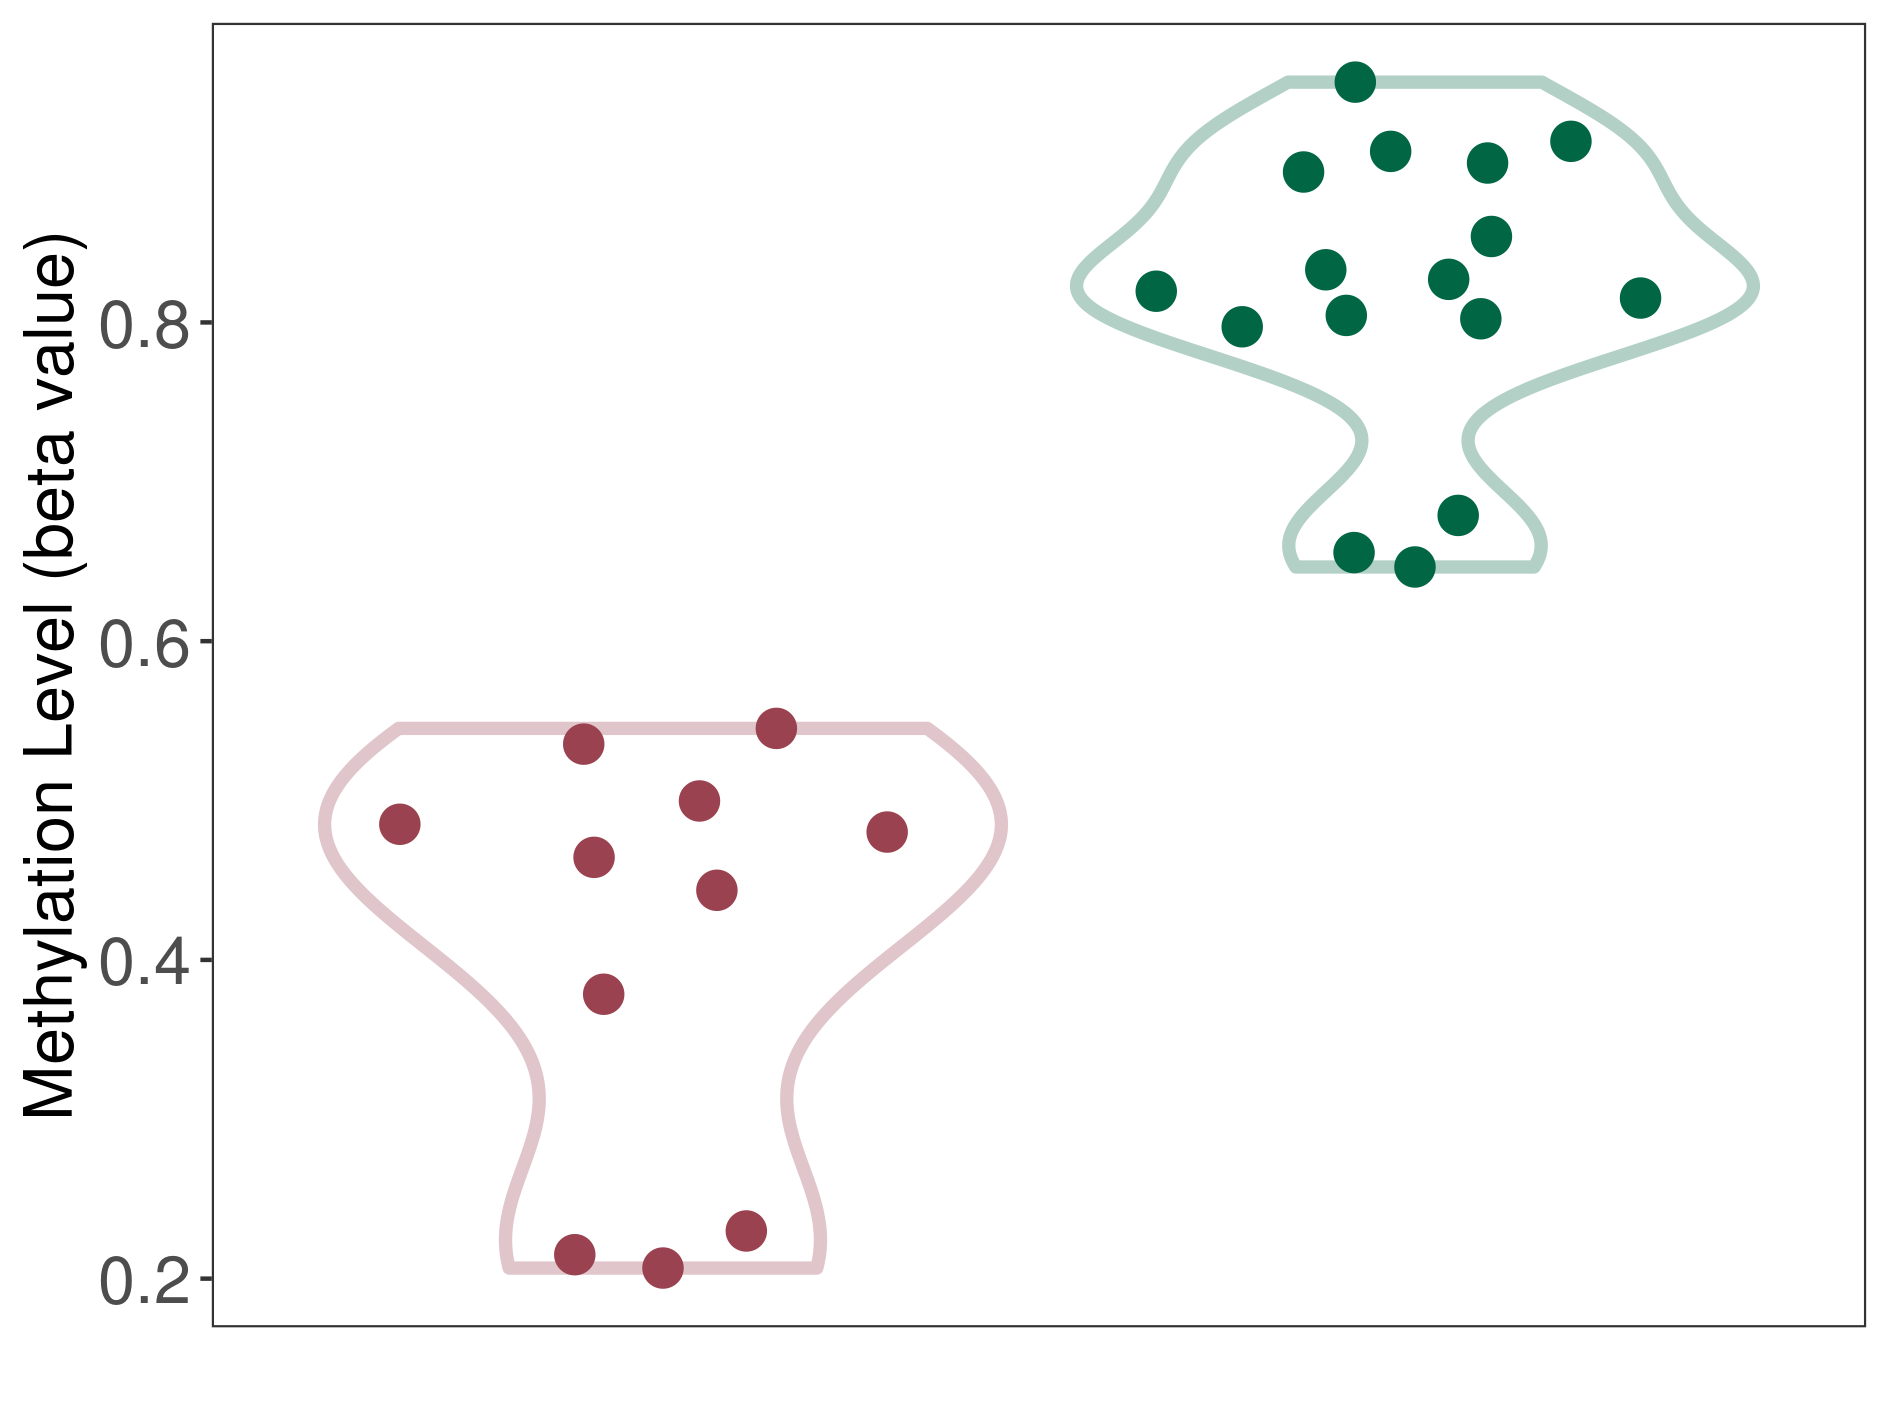
| DNA methyltransferase (DNMT) | Cerebellar liponeurocytoma | Significant hypomethylation | |||
| Interaction Name | DNMT-FPGS interaction | ||||
| The Methylation Level of Disease Section Compare with the Healthy Individual Tissue | Significant hypomethylation p-value: 7.78E-08; delta-beta: -3.59E-01 | ||||
| Description | DNA methyltransferase (DNMT) is reported to significantly hypo-methylate the FPGS gene, which leads to a significantly increased expression of the drug-metabolizing enzyme Folylpolyglutamate synthase. As a result, the interaction between DNMT and FPGS can significantly affect the drug-metabolizing process of Folylpolyglutamate synthase. | ||||
|
DME methylation in the diseased tissue of patients
DME methylation in the normal tissue of healthy individuals
|
|||||
| Violin Diagram of DME Disease-specific Methylation Level |
|
Click to View the Clearer Original Diagram | |||
| ICD-11: 2B33 Acute lymphoblastic leukemia | Click to Show/Hide the Full List of HOSPPI: 1 HOSPPI | ||||
| Histone modification | |||||
| Histone deacetylases (HDACs) | Acute lymphoblastic leukemia | Repression | |||
| Uniprot ID | |||||
| Interaction Name | HDACs-FPGS interaction | [1] | |||
| Studied Cell Lines | T-ALL cell line | ||||
| Description | Histone deacetylases (HDACs) are reported to deacetylate the FPGS gene and thereby repress the transcriptional activity of the drug-metabolizing enzyme Folylpolyglutamate synthase. As a result, the interaction between HDACs and FPGS can inhibit the drug-metabolizing process of Folylpolyglutamate synthase. | ||||
| ICD-11: 2B71 Gastric cancer | Click to Show/Hide the Full List of HOSPPI: 1 HOSPPI | ||||
| DNA methylation | |||||
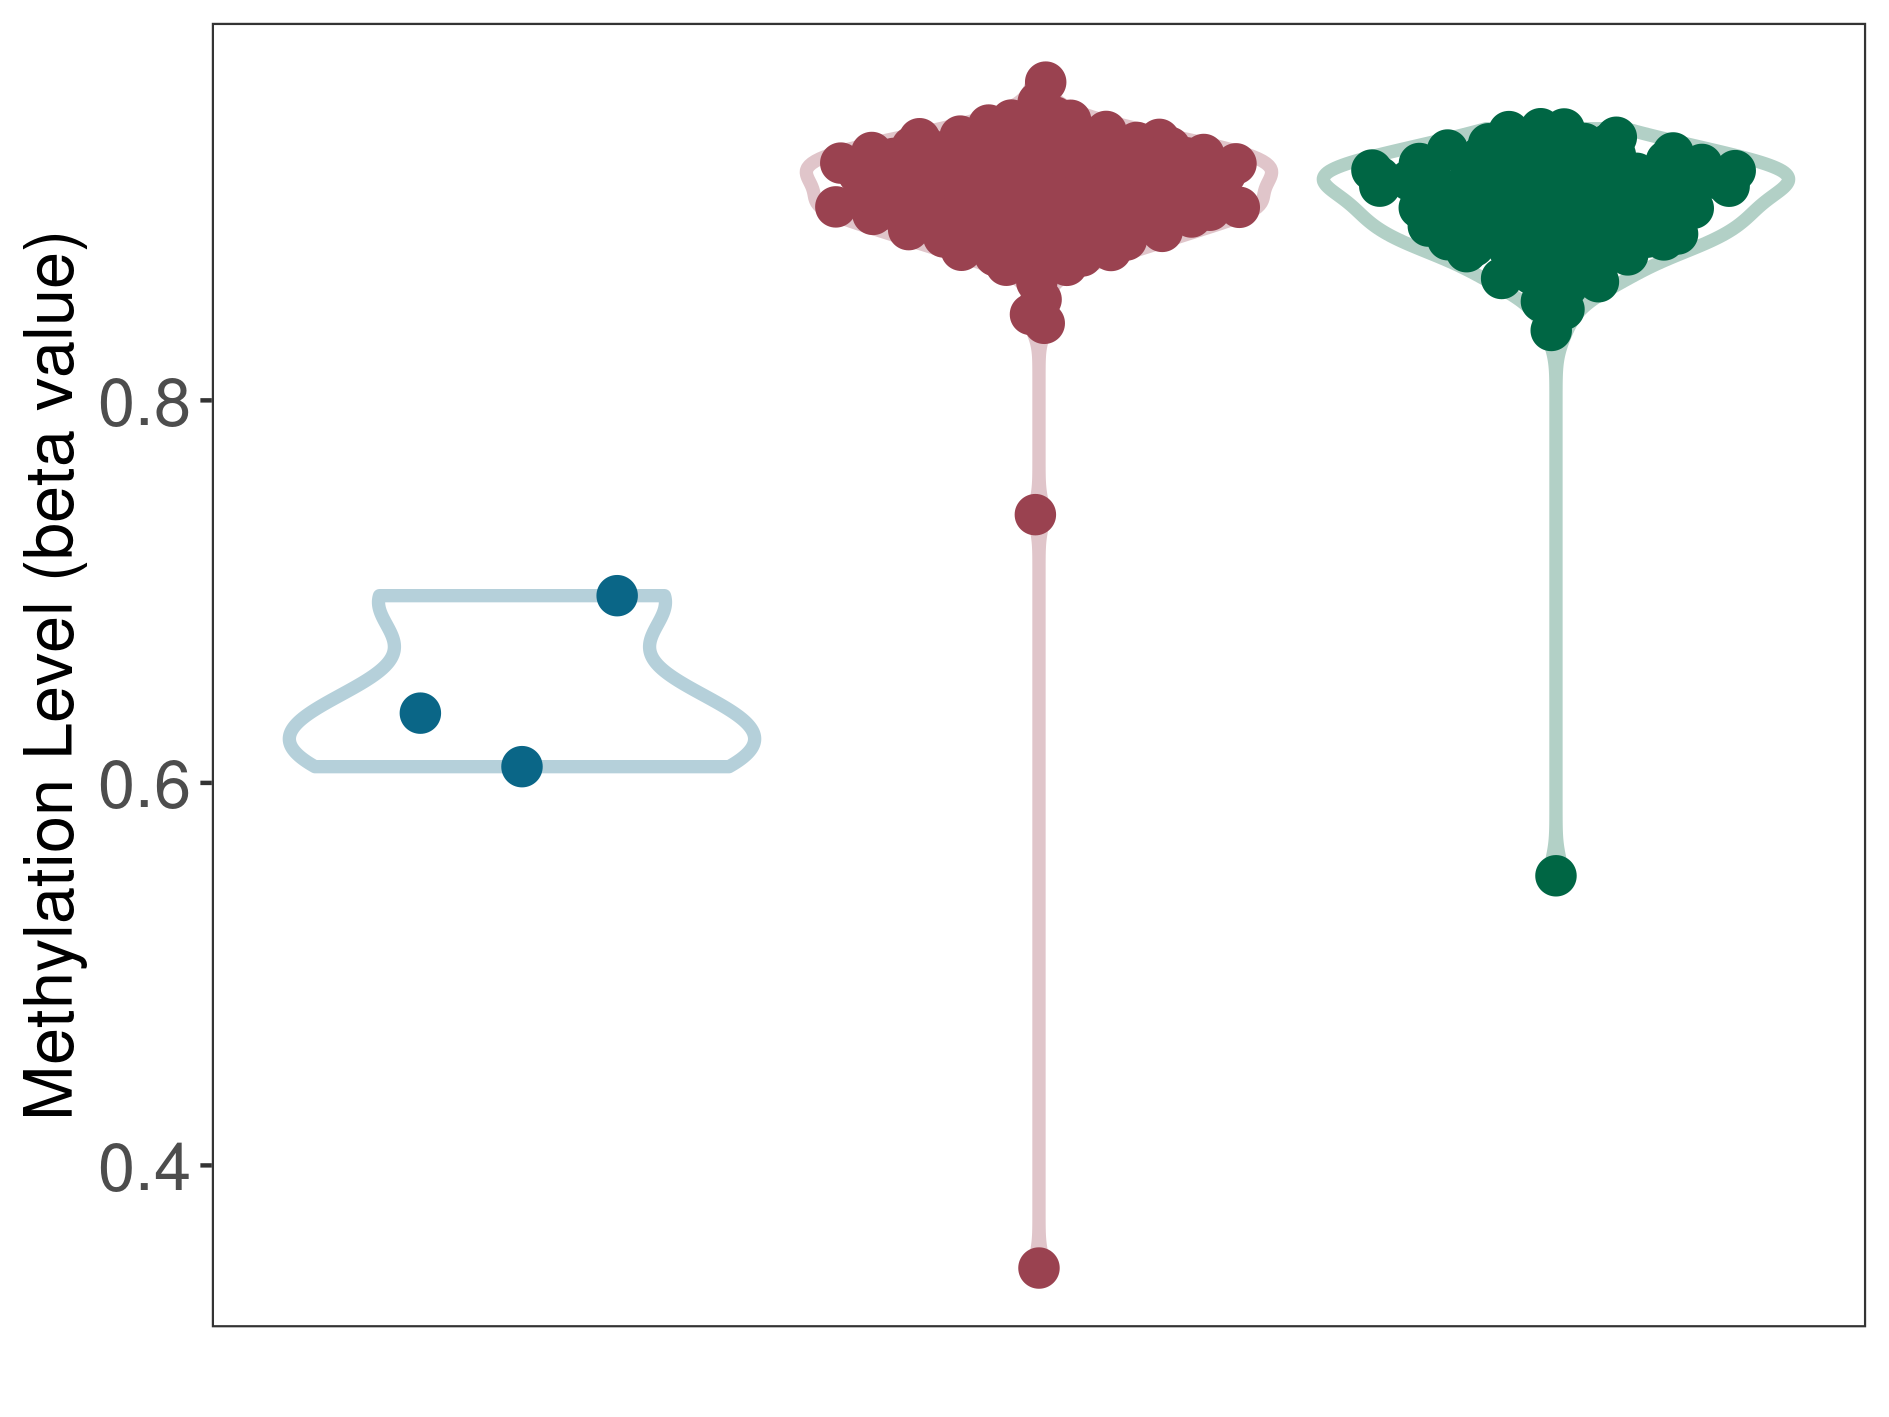
| DNA methyltransferase (DNMT) | Gastric cancer | Moderate hypermethylation | |||
| Interaction Name | DNMT-FPGS interaction | ||||
| The Methylation Level of Disease Section Compare with the Adjacent Tissue | Moderate hypermethylation p-value: 9.23E-03; delta-beta: 2.74E-01 | ||||
| Description | DNA methyltransferase (DNMT) is reported to moderatly hyper-methylate the FPGS gene, which leads to a moderatly decreased expression of the drug-metabolizing enzyme Folylpolyglutamate synthase. As a result, the interaction between DNMT and FPGS can moderatly affect the drug-metabolizing process of Folylpolyglutamate synthase. | ||||
|
DME methylation in the diseased tissue of patients
DME methylation in the normal tissue adjacent to the diseased tissue of patients
DME methylation in the normal tissue of healthy individuals
|
|||||
| Violin Diagram of DME Disease-specific Methylation Level |
|
Click to View the Clearer Original Diagram | |||
| ICD-11: 2D50 Brain cancer metastasis | Click to Show/Hide the Full List of HOSPPI: 1 HOSPPI | ||||
| DNA methylation | |||||
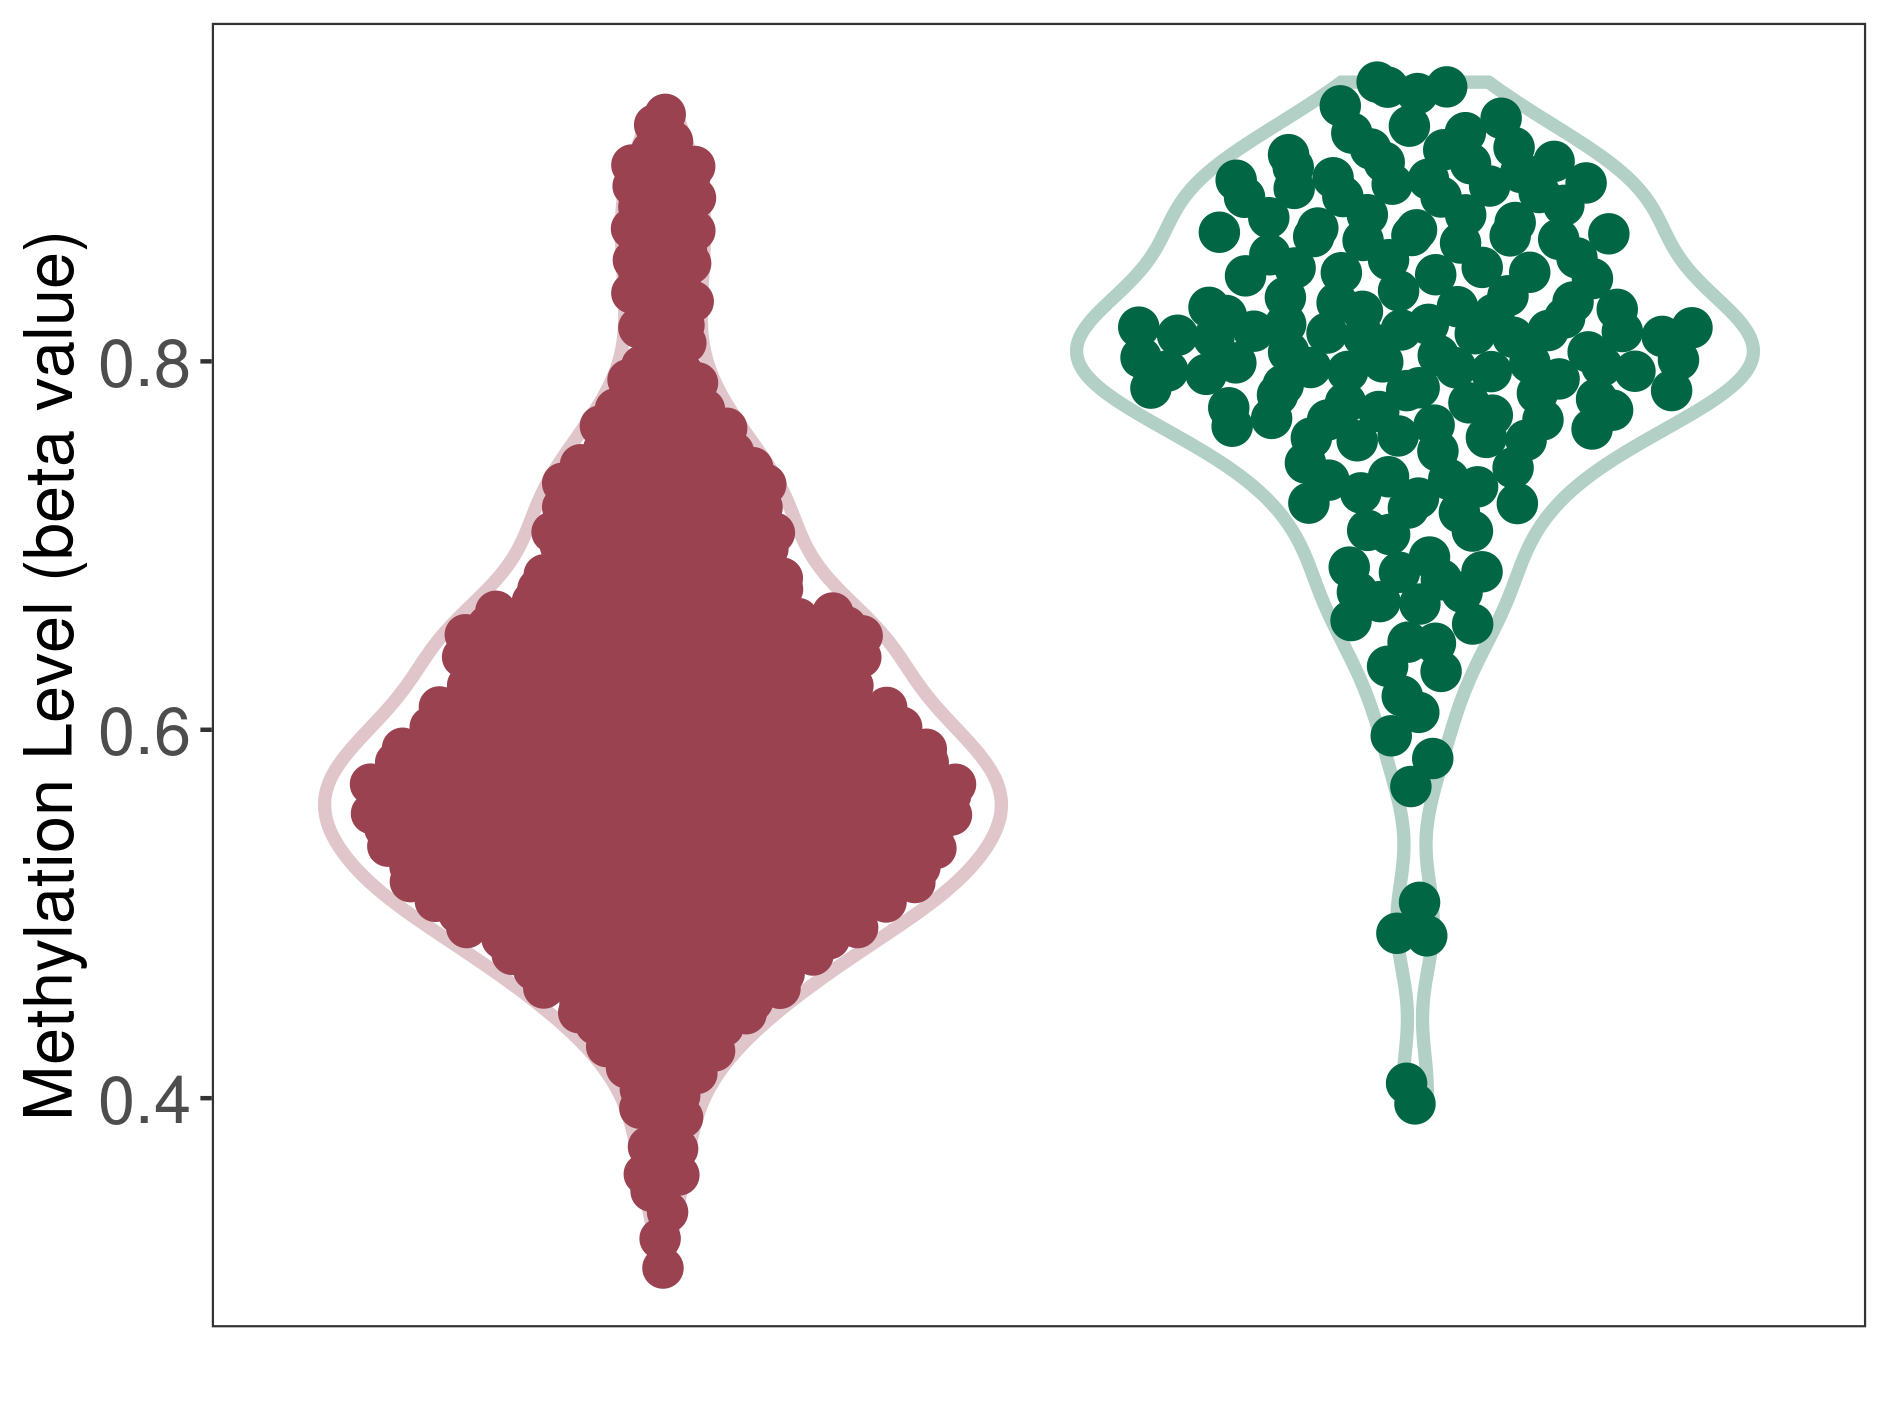
| DNA methyltransferase (DNMT) | Posterior fossa ependymoma | Moderate hypomethylation | |||
| Interaction Name | DNMT-FPGS interaction | ||||
| The Methylation Level of Disease Section Compare with the Healthy Individual Tissue | Moderate hypomethylation p-value: 2.35E-60; delta-beta: -2.22E-01 | ||||
| Description | DNA methyltransferase (DNMT) is reported to moderatly hypo-methylate the FPGS gene, which leads to a moderatly increased expression of the drug-metabolizing enzyme Folylpolyglutamate synthase. As a result, the interaction between DNMT and FPGS can moderatly affect the drug-metabolizing process of Folylpolyglutamate synthase. | ||||
|
DME methylation in the diseased tissue of patients
DME methylation in the normal tissue of healthy individuals
|
|||||
| Violin Diagram of DME Disease-specific Methylation Level |
|
Click to View the Clearer Original Diagram | |||
| ICD-11: 2F7C Connective tissue cancer | Click to Show/Hide the Full List of HOSPPI: 1 HOSPPI | ||||
| DNA methylation | |||||
| DNA methyltransferase (DNMT) | Hemangioblastoma | Moderate hypomethylation | |||
| Interaction Name | DNMT-FPGS interaction | ||||
| The Methylation Level of Disease Section Compare with the Healthy Individual Tissue | Moderate hypomethylation p-value: 6.04E-10; delta-beta: -2.27E-01 | ||||
| Description | DNA methyltransferase (DNMT) is reported to moderatly hypo-methylate the FPGS gene, which leads to a moderatly increased expression of the drug-metabolizing enzyme Folylpolyglutamate synthase. As a result, the interaction between DNMT and FPGS can moderatly affect the drug-metabolizing process of Folylpolyglutamate synthase. | ||||
|
DME methylation in the diseased tissue of patients
DME methylation in the normal tissue of healthy individuals
|
|||||
| Violin Diagram of DME Disease-specific Methylation Level |
|
Click to View the Clearer Original Diagram | |||
If you find any error in data or bug in web service, please kindly report it to Dr. Yin and Dr. Li.