

Details of Host Protein-DME Interaction (HOSPPI)
| General Information of Drug-Metabolizing Enzyme (DME ID: DME0224) | |||||
|---|---|---|---|---|---|
| DME Name | HMG-CoA reductase (HMGCR), Homo sapiens | DME Info | |||
| UniProt ID | |||||
| EC Number | EC: 1.1.1.34 (Click to Show/Hide the Complete EC Tree) | ||||
| Lineage | Species: Homo sapiens (Click to Show/Hide the Complete Species Lineage) | ||||
| Interactome | |||||
| Disease Specific Interactions between Host Protein and DME (HOSPPI) | |||||
|---|---|---|---|---|---|
| ICD Disease Classification 02 Neoplasms | |||||
| ICD-11: 2A00 Brain cancer | Click to Show/Hide the Full List of HOSPPI: 13 HOSPPI | ||||
| DNA methylation | |||||
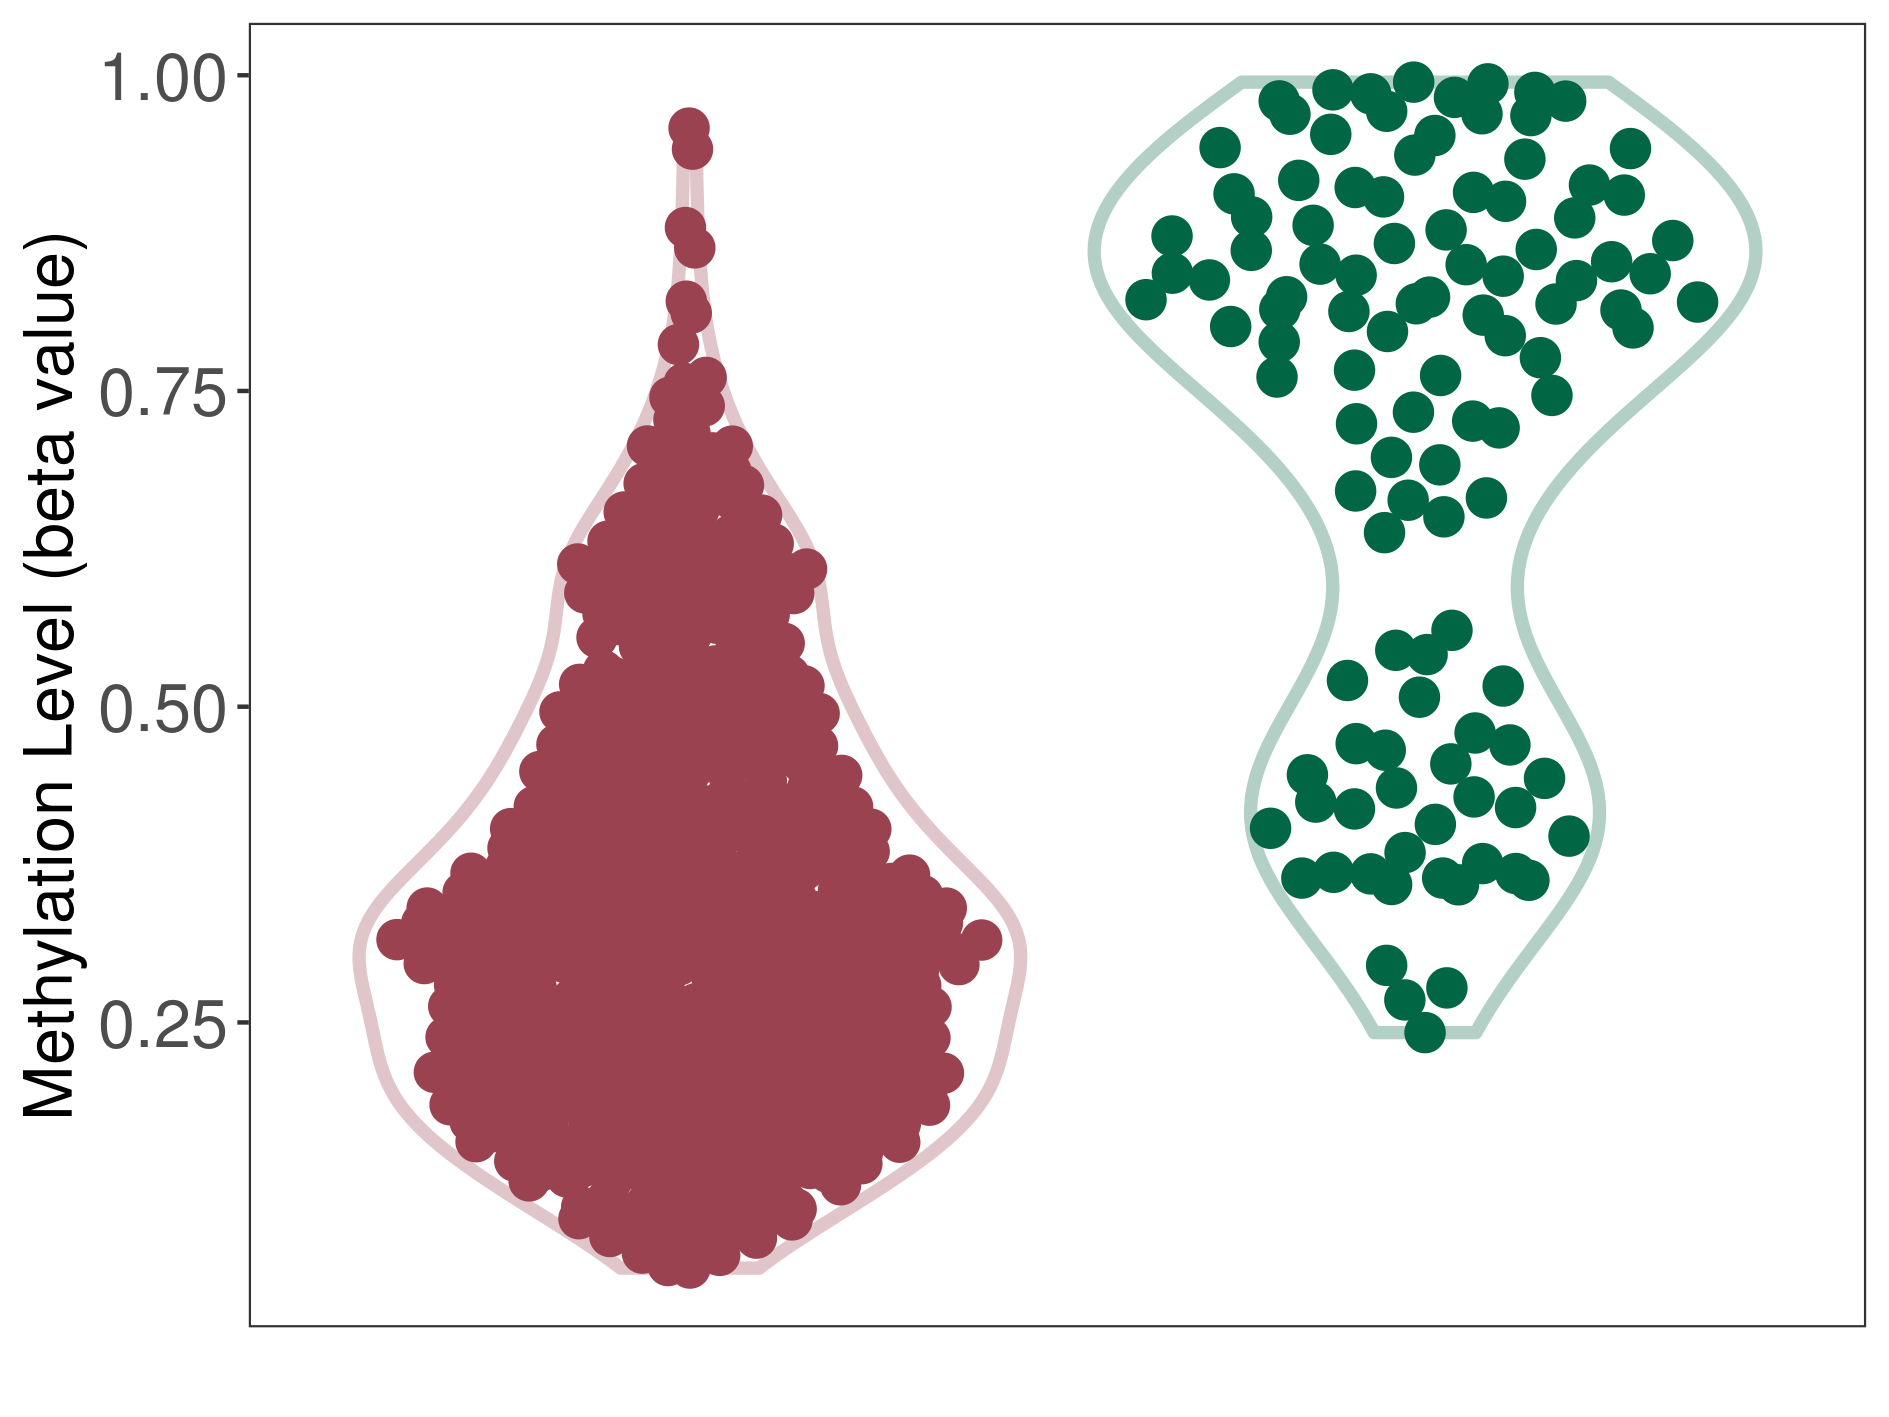
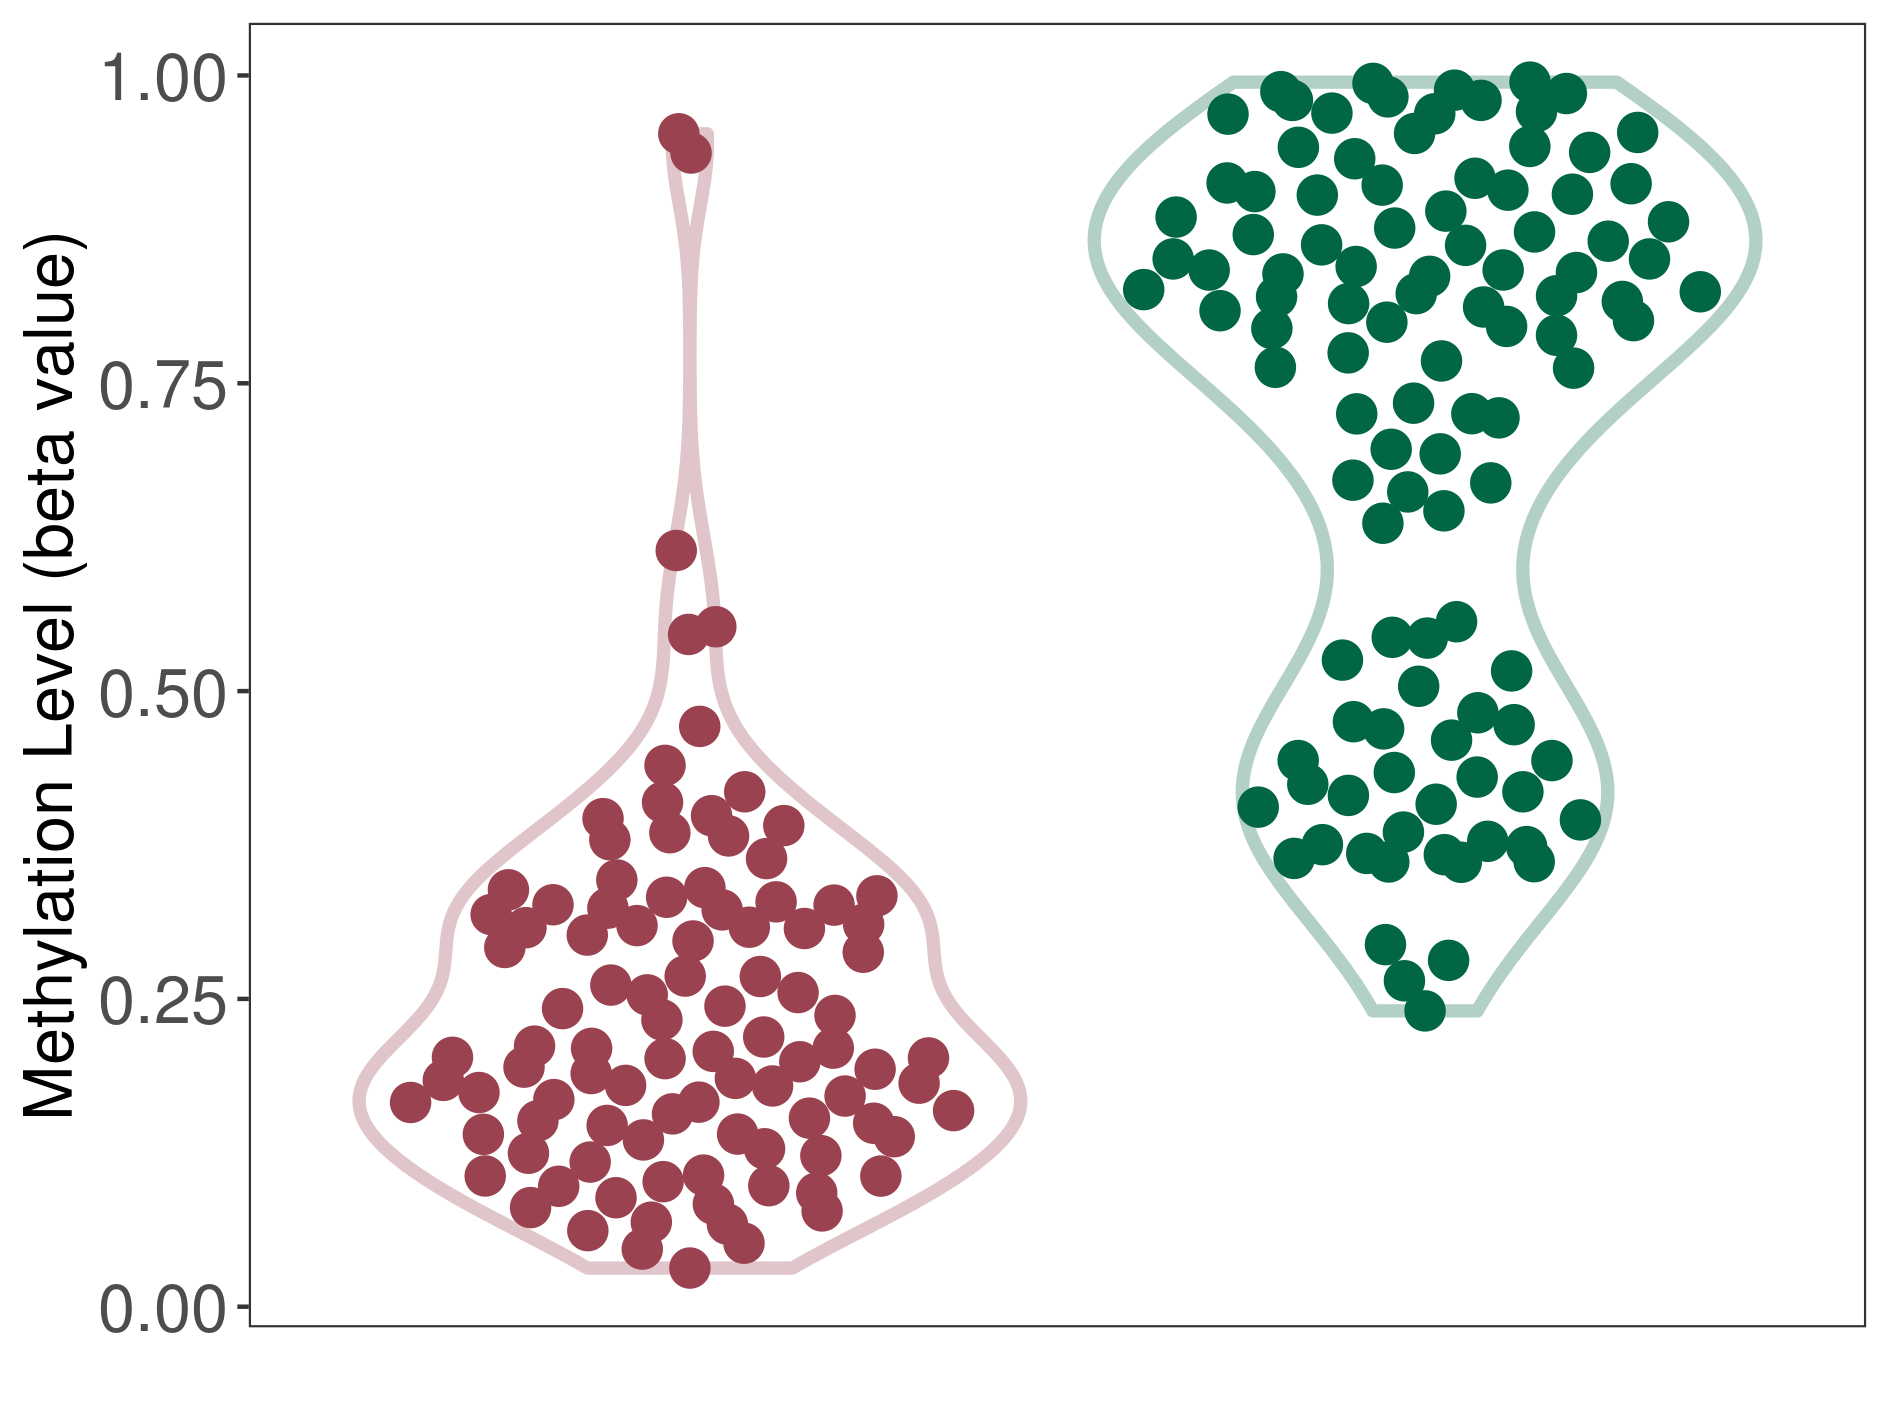
| DNA methyltransferase (DNMT) | Glioblastoma | Significant hypomethylation | |||
| Interaction Name | DNMT-HMGCR interaction | ||||
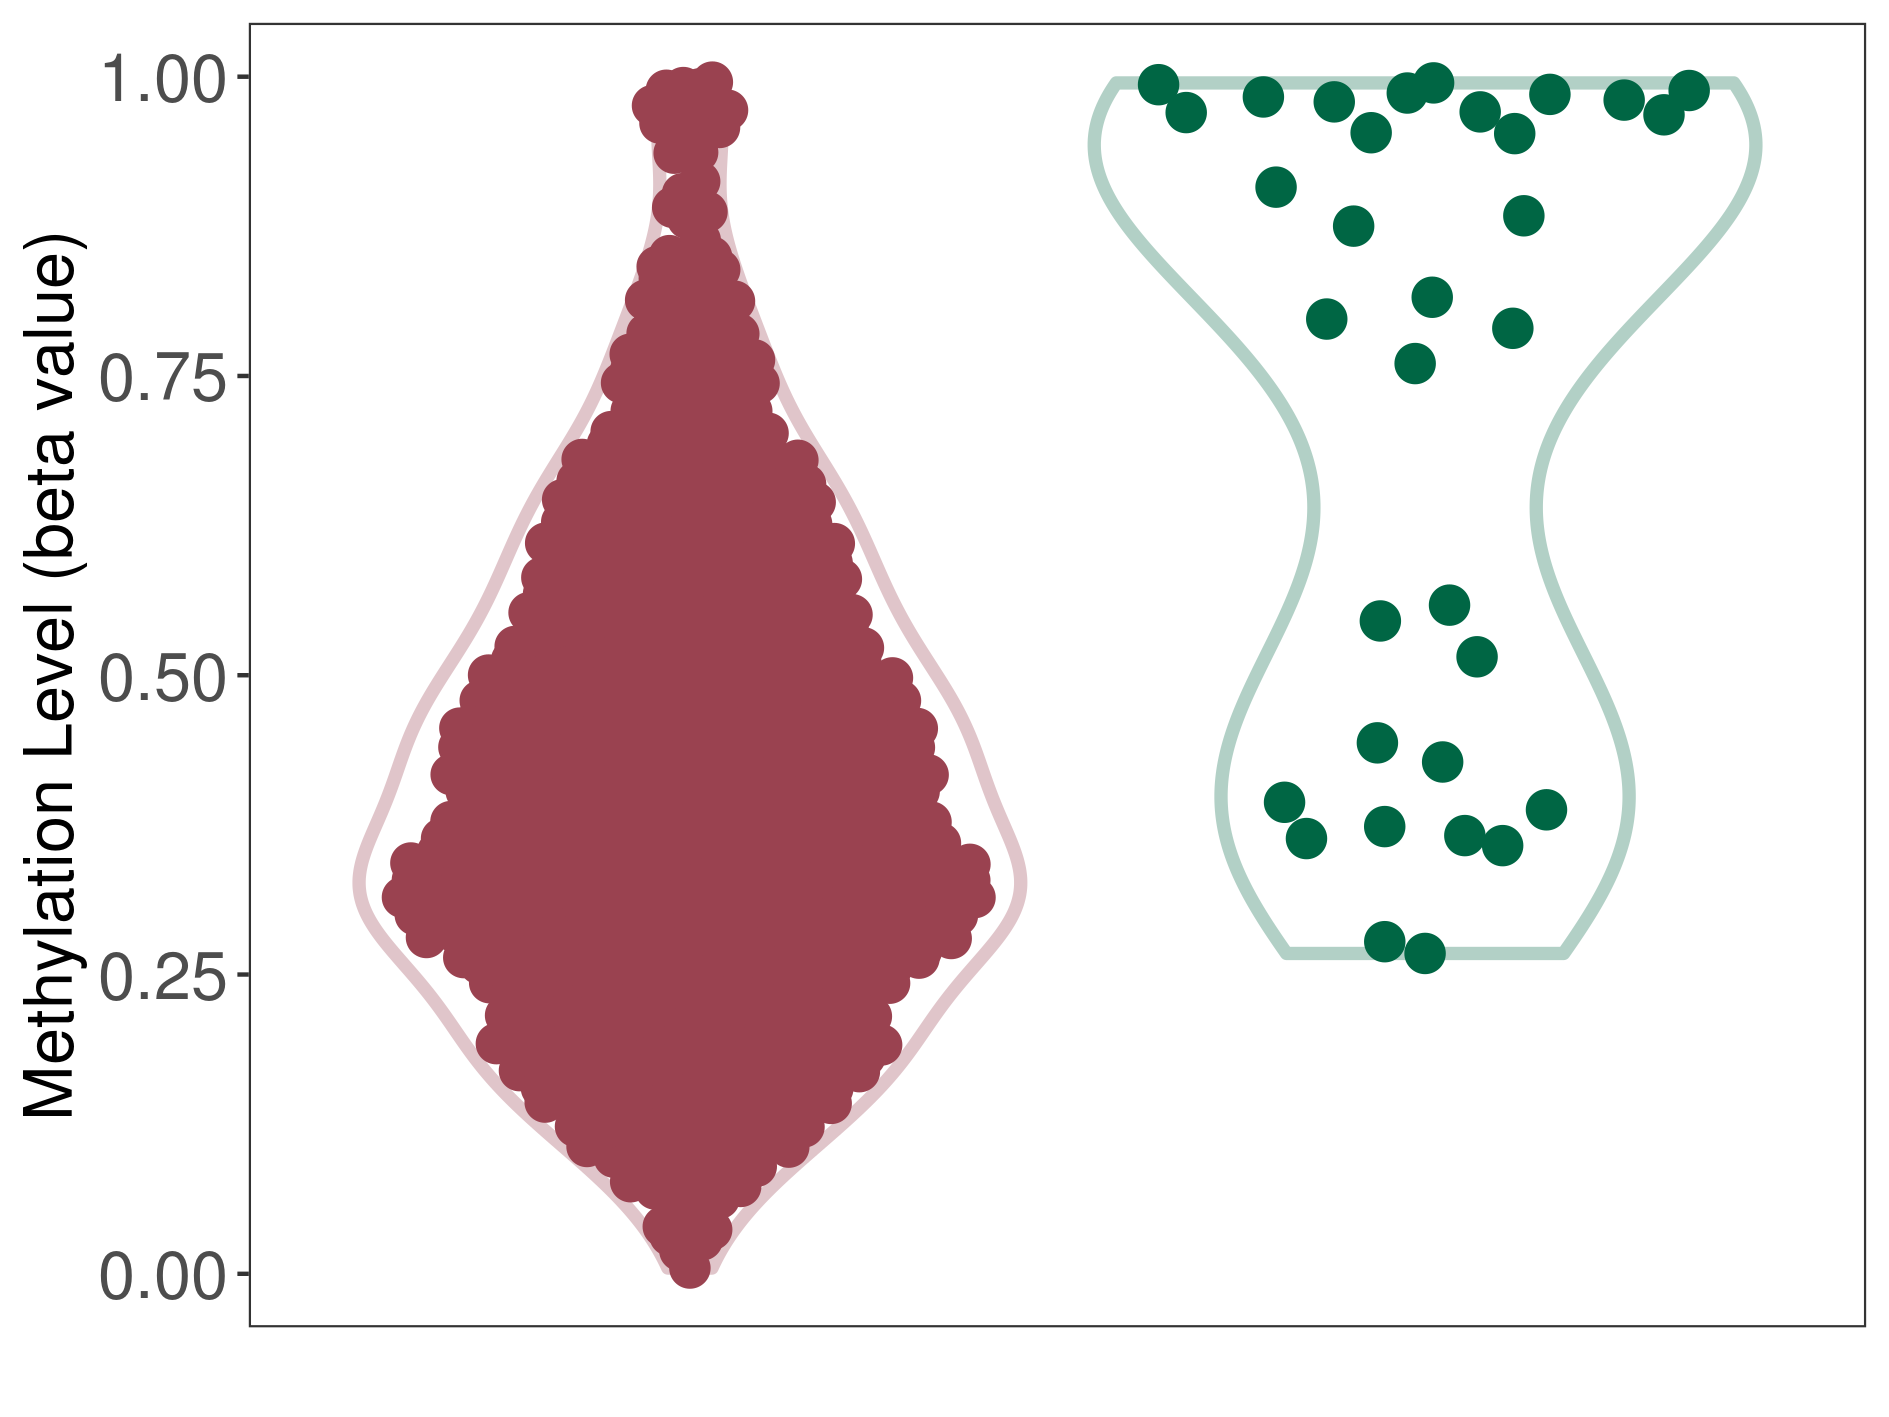
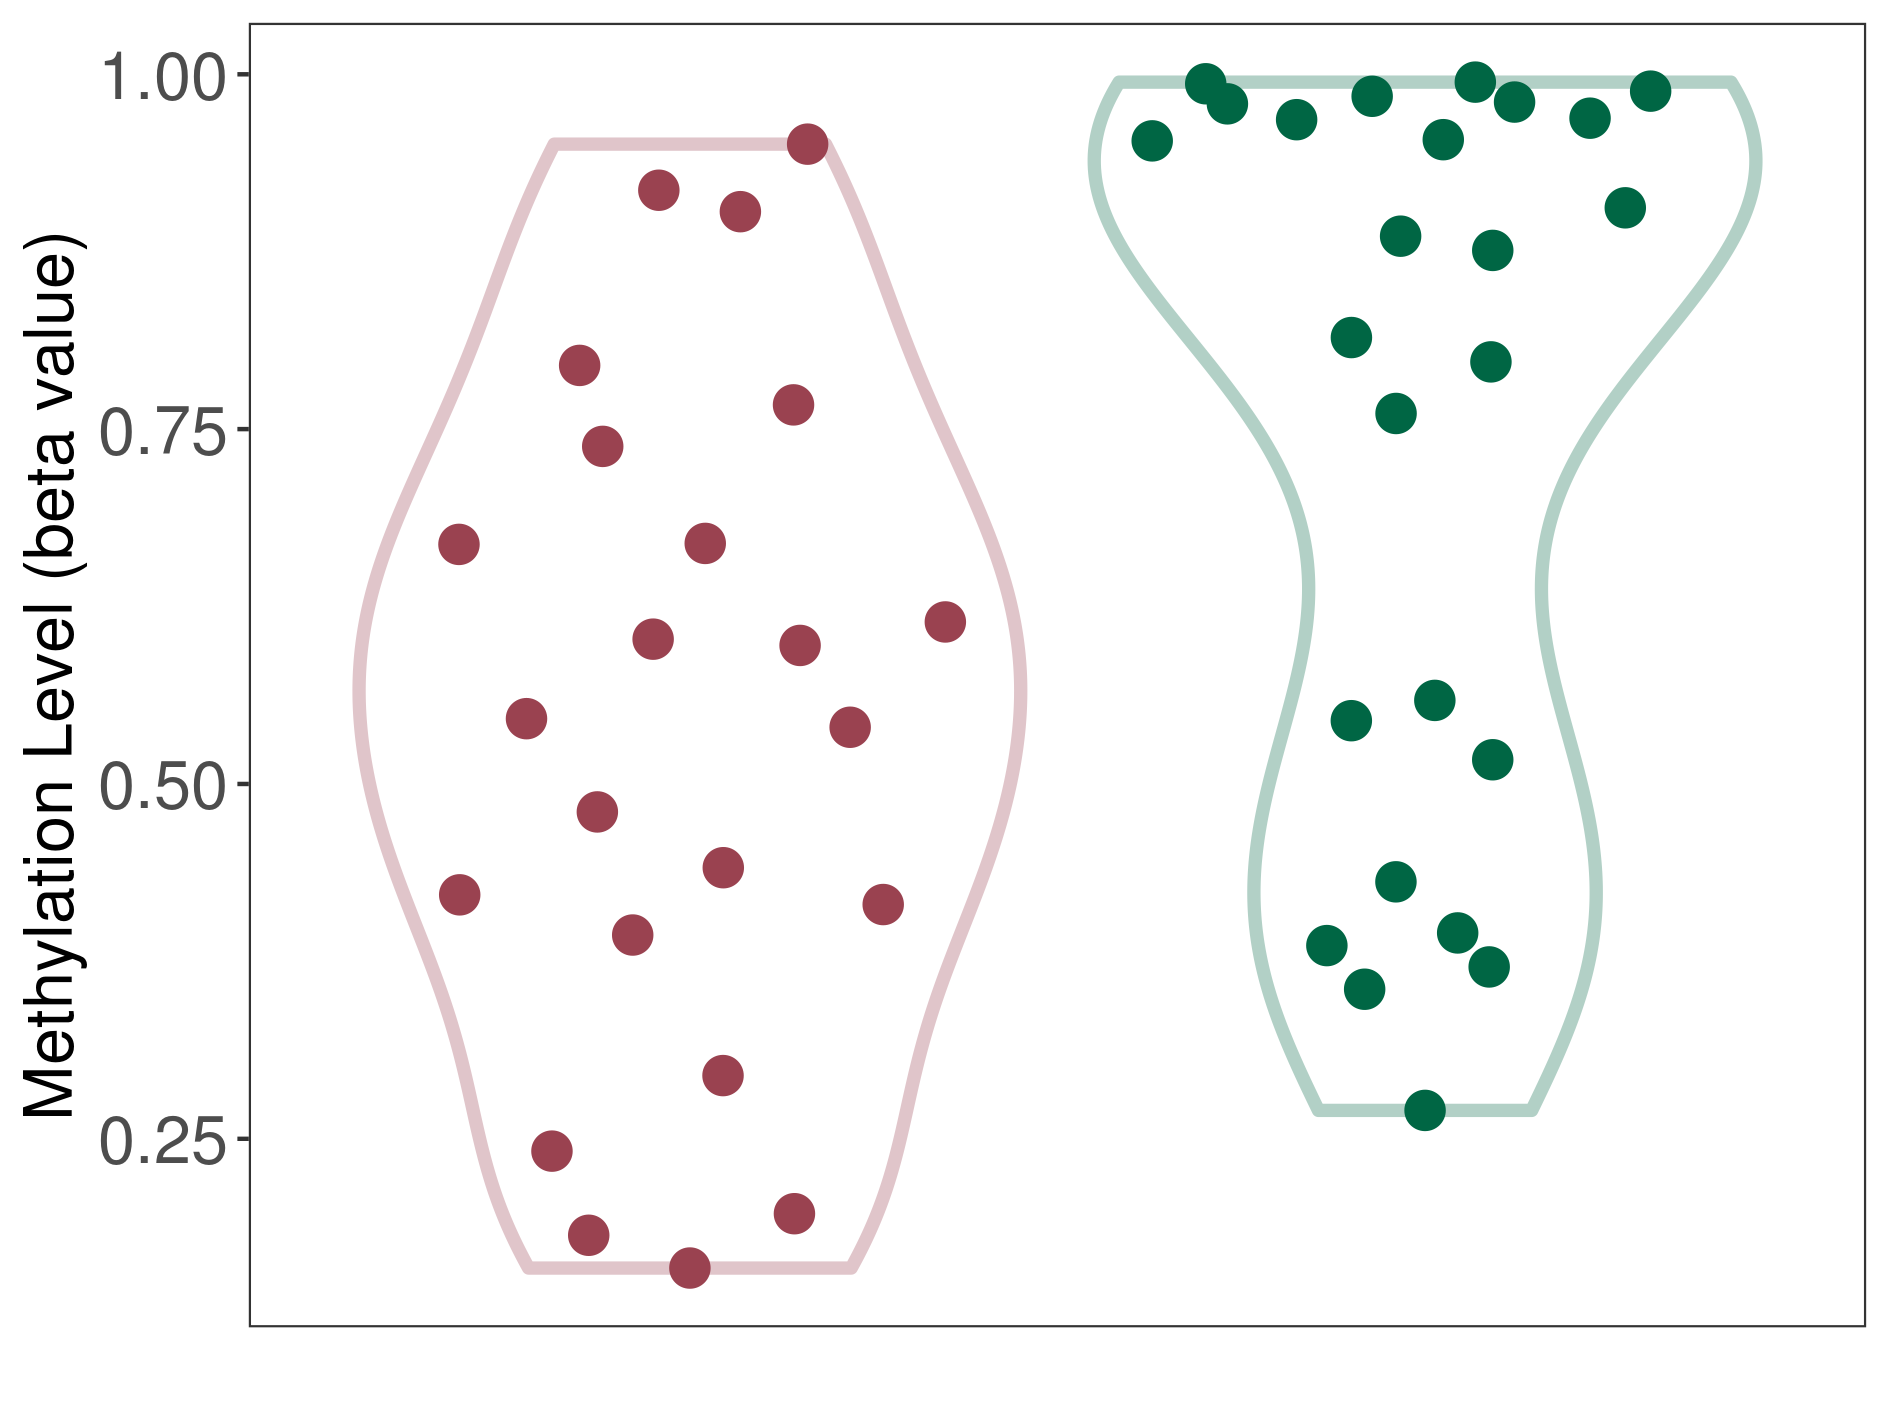
| The Methylation Level of Disease Section Compare with the Healthy Individual Tissue | Significant hypomethylation p-value: 3.18E-07; delta-beta: -4.20E-01 | ||||
| Description | DNA methyltransferase (DNMT) is reported to significantly hypo-methylate the HMGCR gene, which leads to a significantly increased expression of the drug-metabolizing enzyme HMG-CoA reductase. As a result, the interaction between DNMT and HMGCR can significantly affect the drug-metabolizing process of HMG-CoA reductase. | ||||
|
DME methylation in the diseased tissue of patients
DME methylation in the normal tissue of healthy individuals
|
|||||
| Violin Diagram of DME Disease-specific Methylation Level |
|
Click to View the Clearer Original Diagram | |||
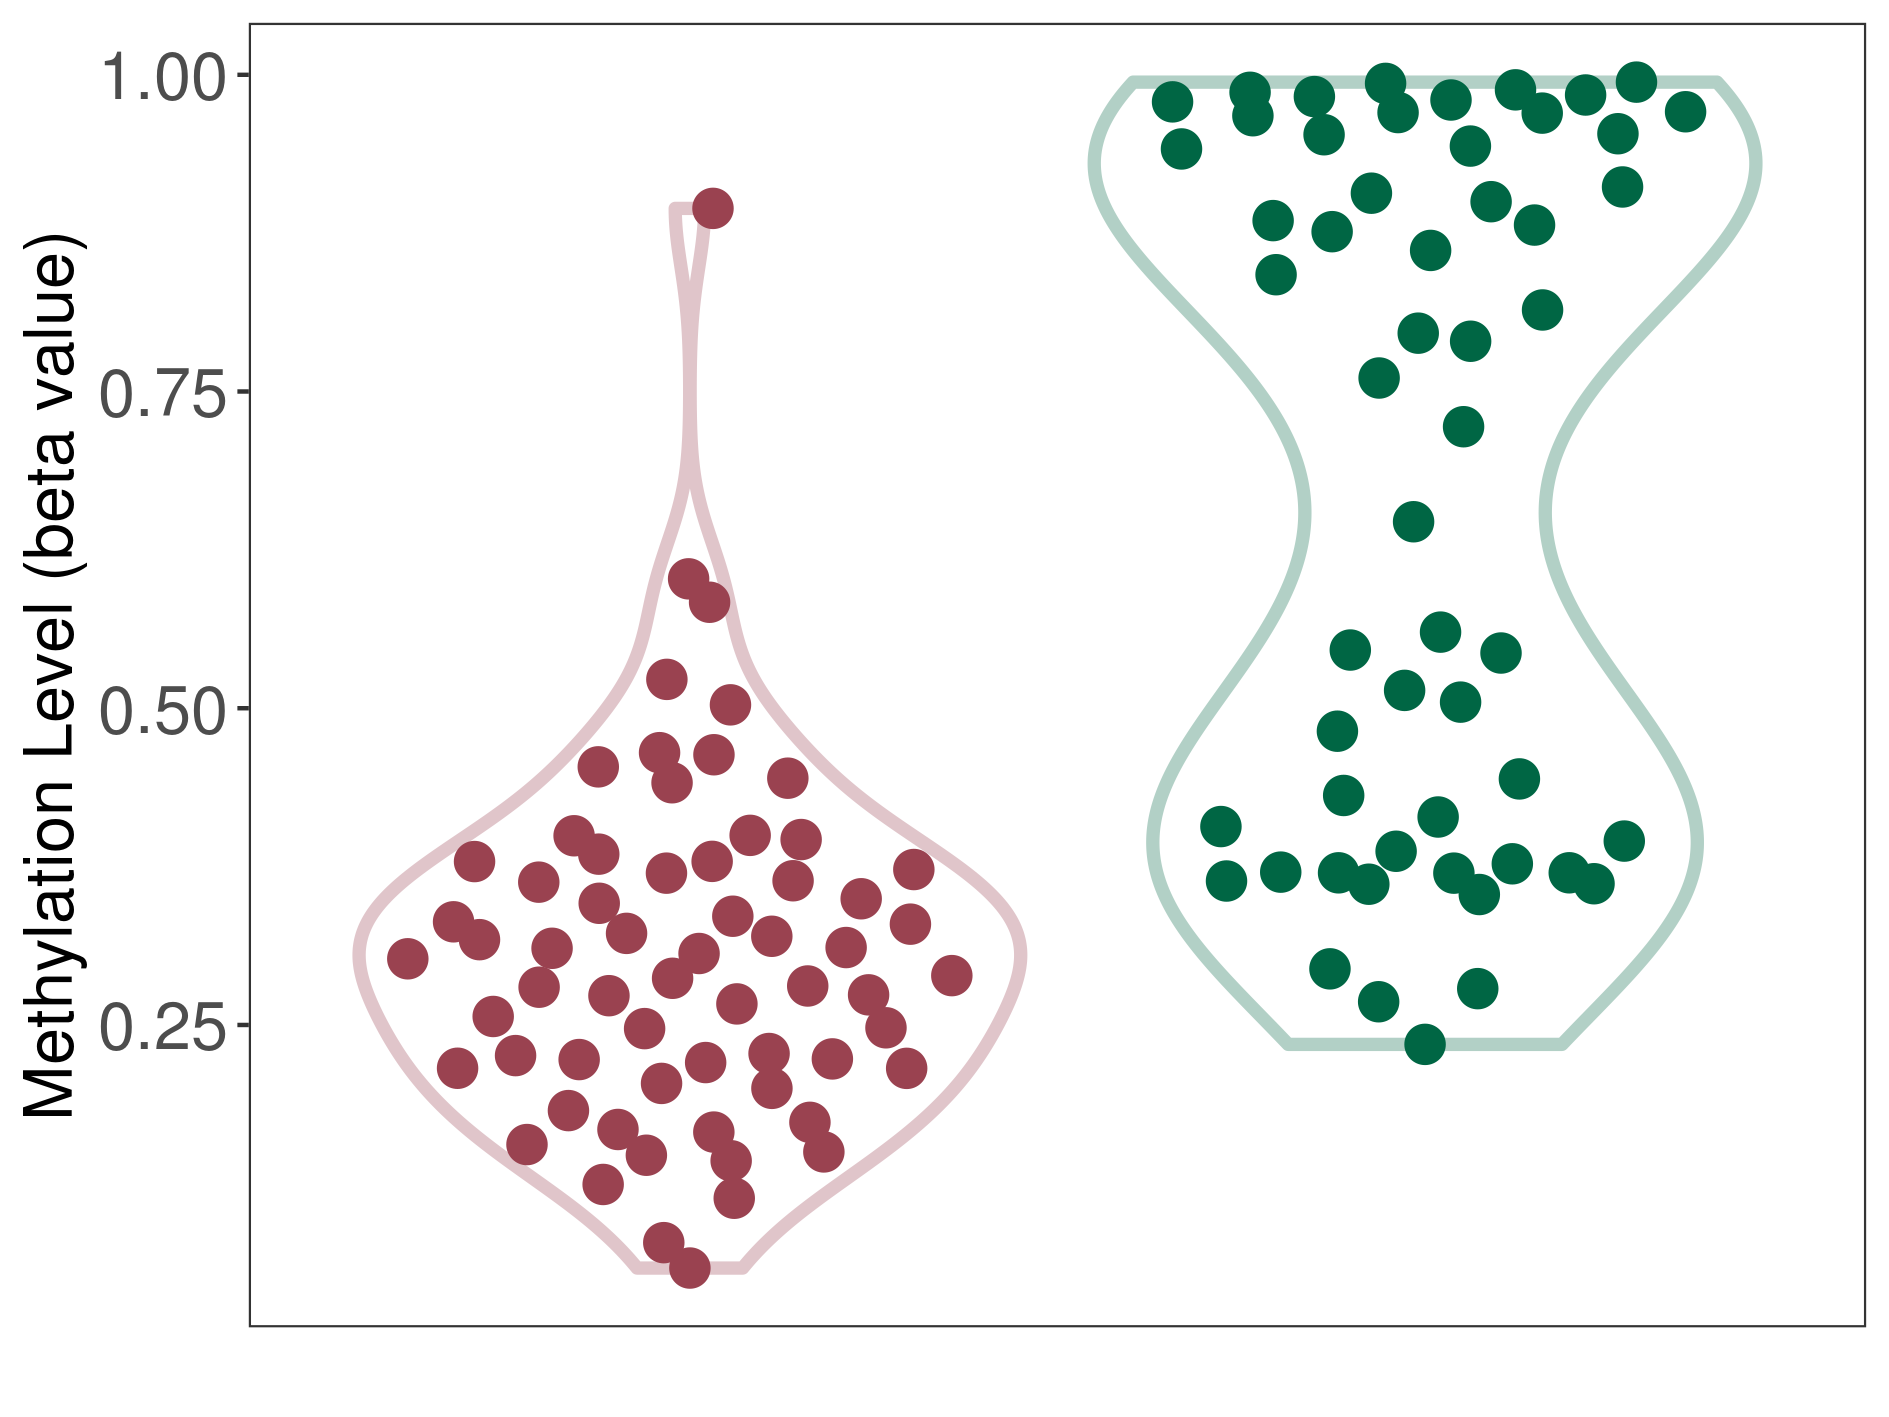
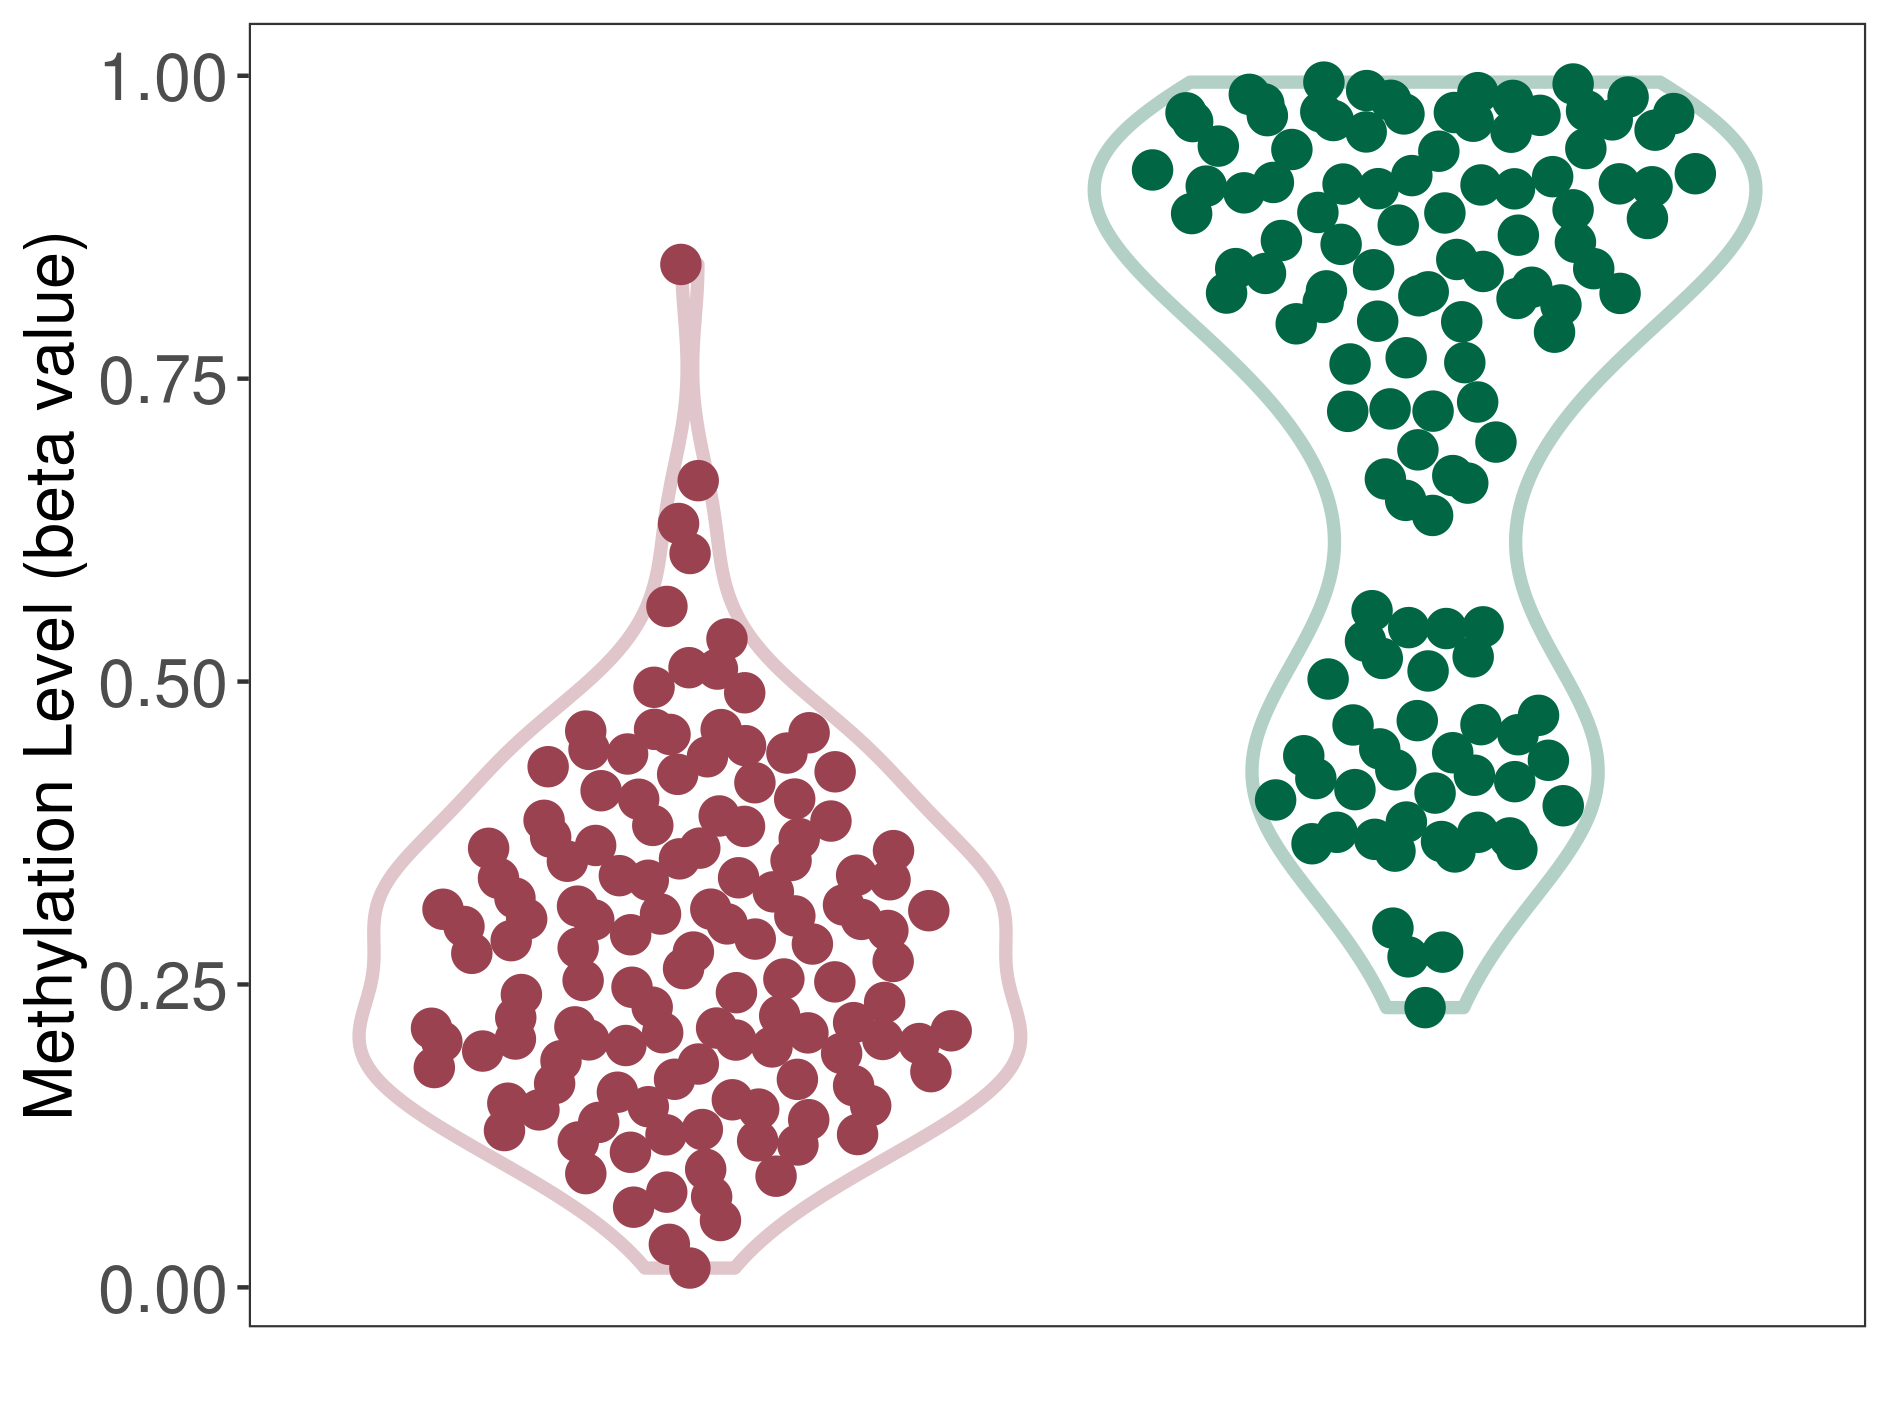
| DNA methyltransferase (DNMT) | Anaplastic pilocytic astrocytoma | Moderate hypomethylation | |||
| Interaction Name | DNMT-HMGCR interaction | ||||
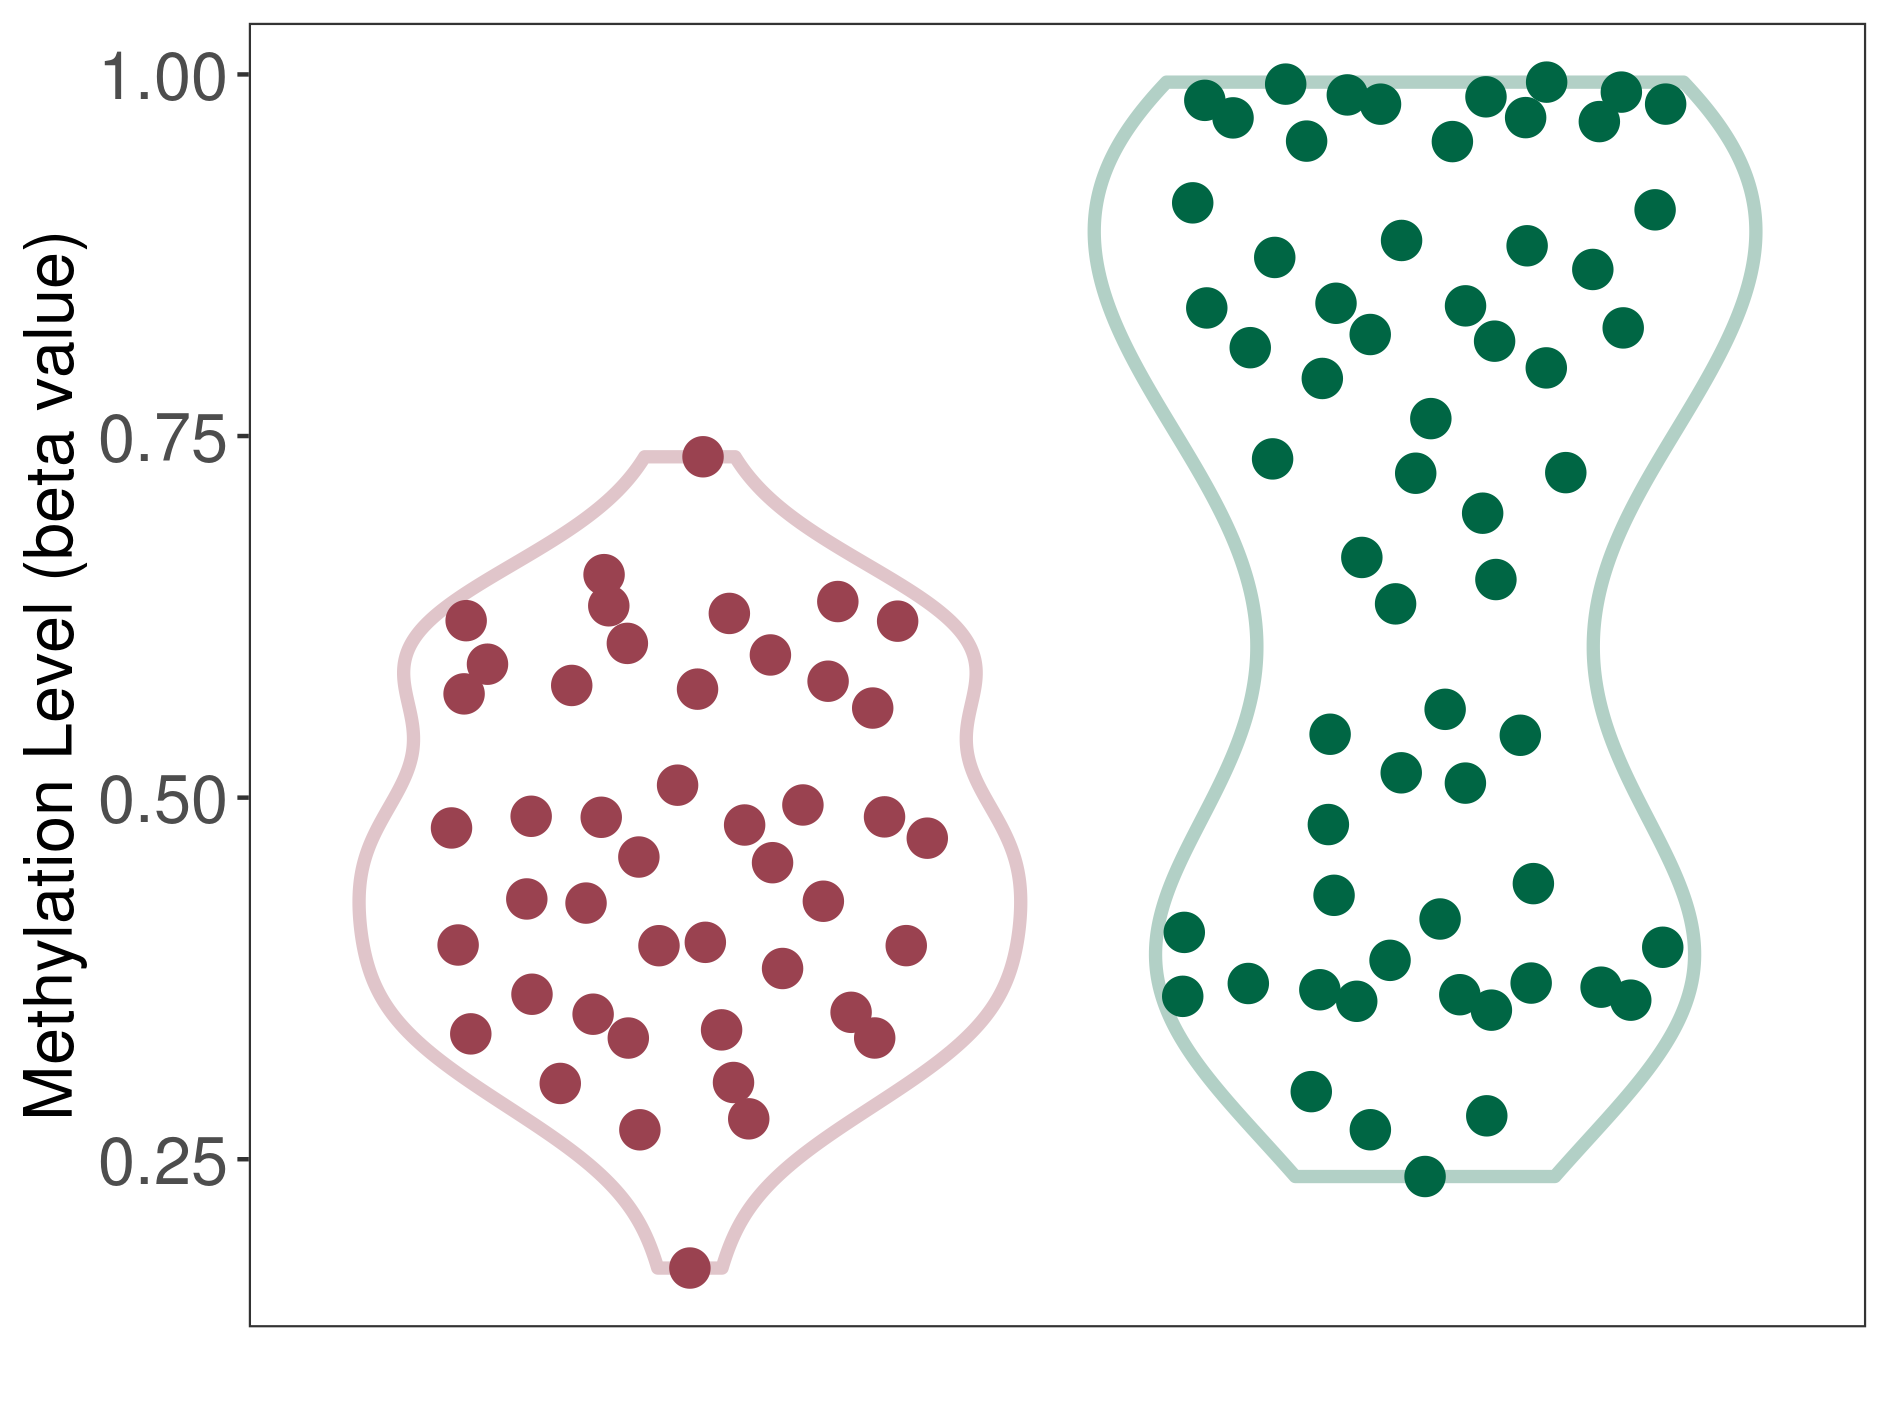
| The Methylation Level of Disease Section Compare with the Healthy Individual Tissue | Moderate hypomethylation p-value: 2.84E-07; delta-beta: -2.53E-01 | ||||
| Description | DNA methyltransferase (DNMT) is reported to moderatly hypo-methylate the HMGCR gene, which leads to a moderatly increased expression of the drug-metabolizing enzyme HMG-CoA reductase. As a result, the interaction between DNMT and HMGCR can moderatly affect the drug-metabolizing process of HMG-CoA reductase. | ||||
|
DME methylation in the diseased tissue of patients
DME methylation in the normal tissue of healthy individuals
|
|||||
| Violin Diagram of DME Disease-specific Methylation Level |
|
Click to View the Clearer Original Diagram | |||
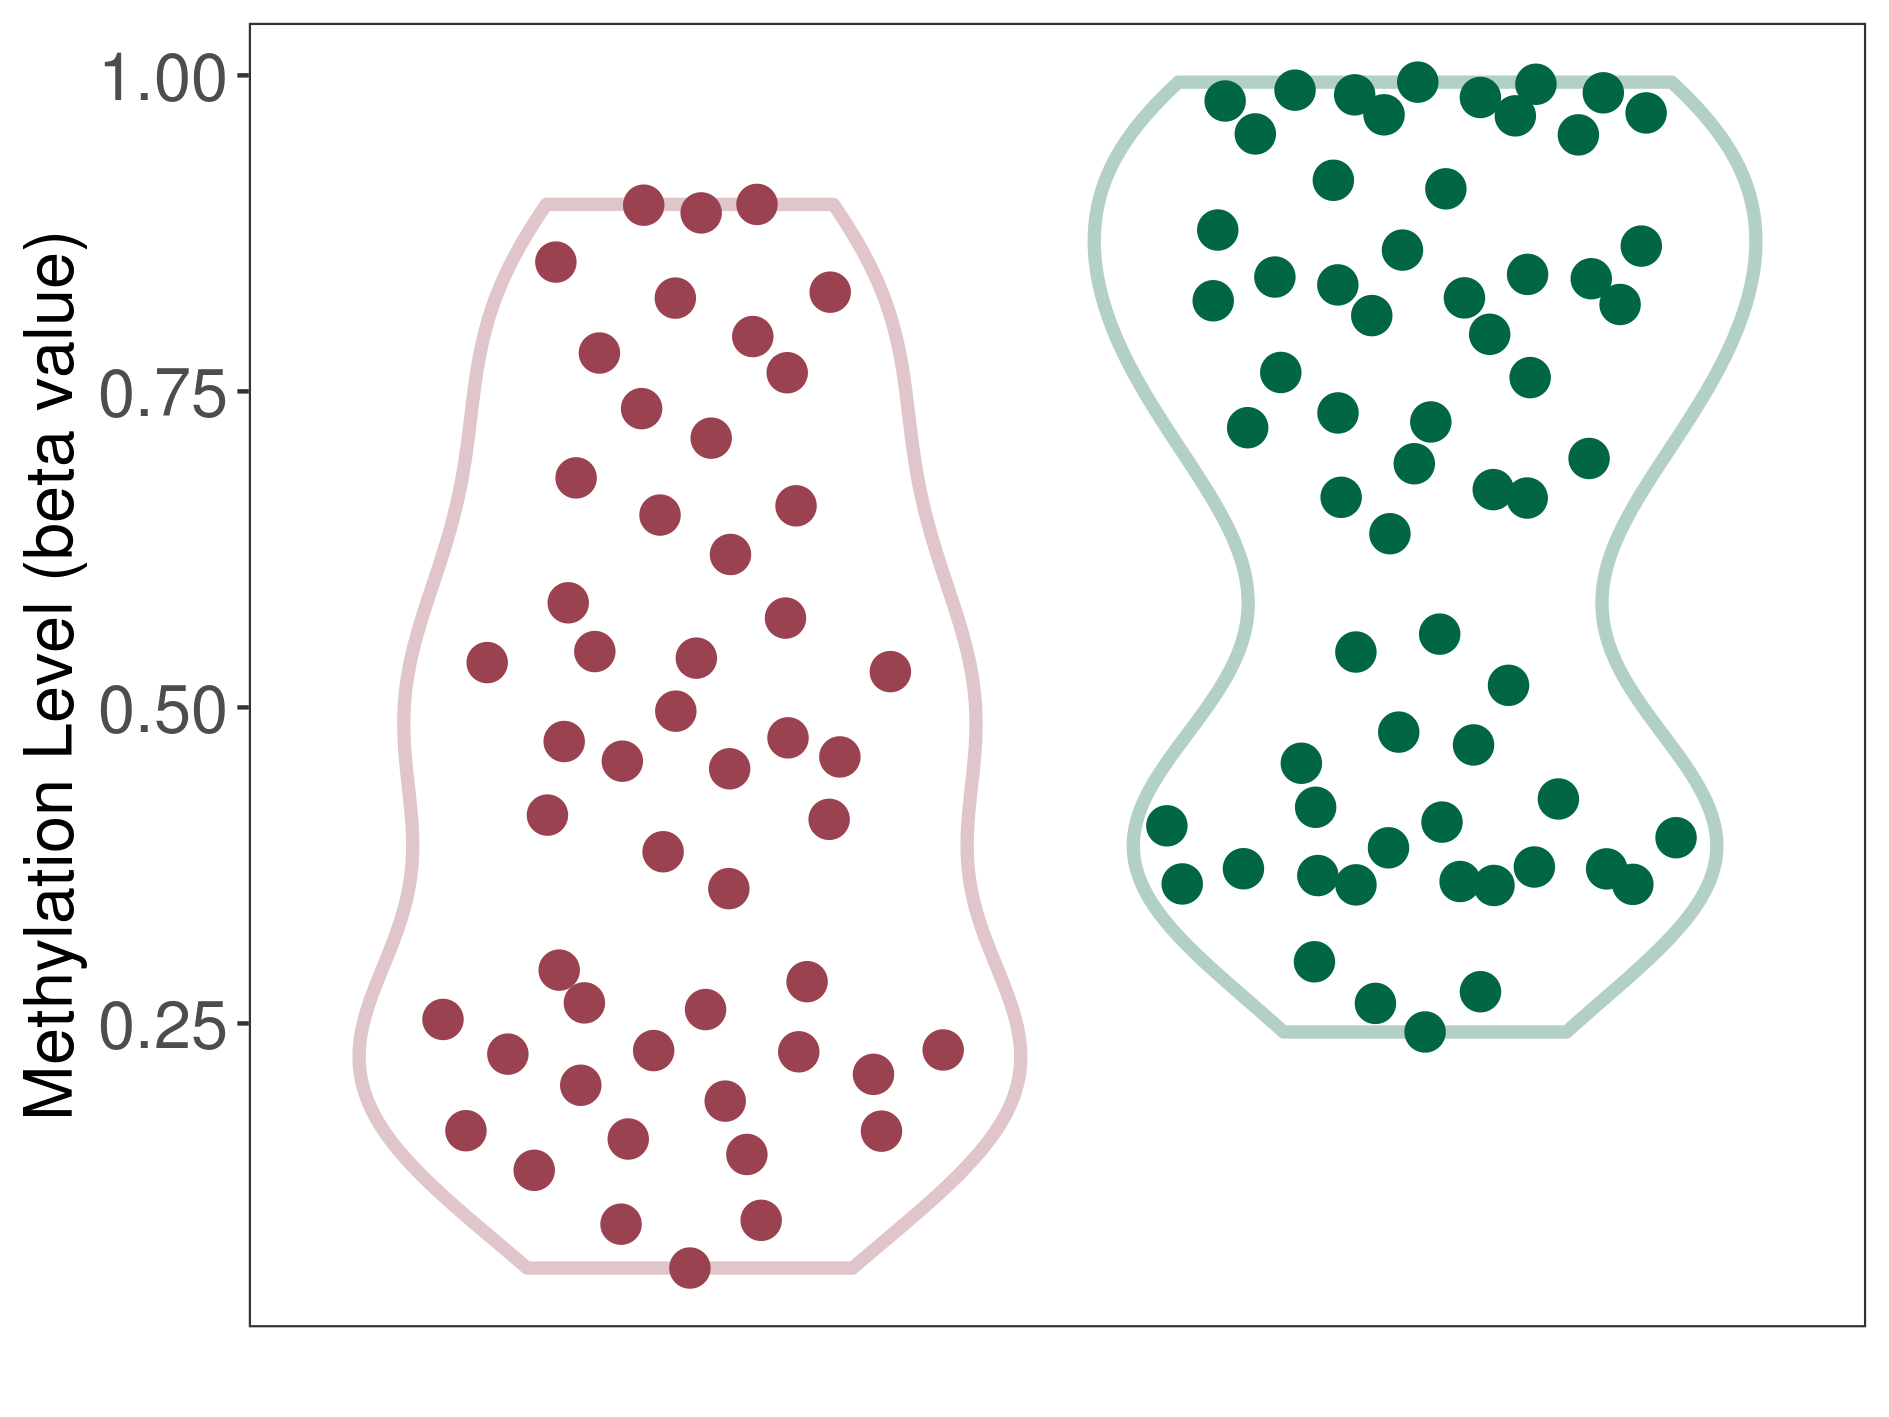
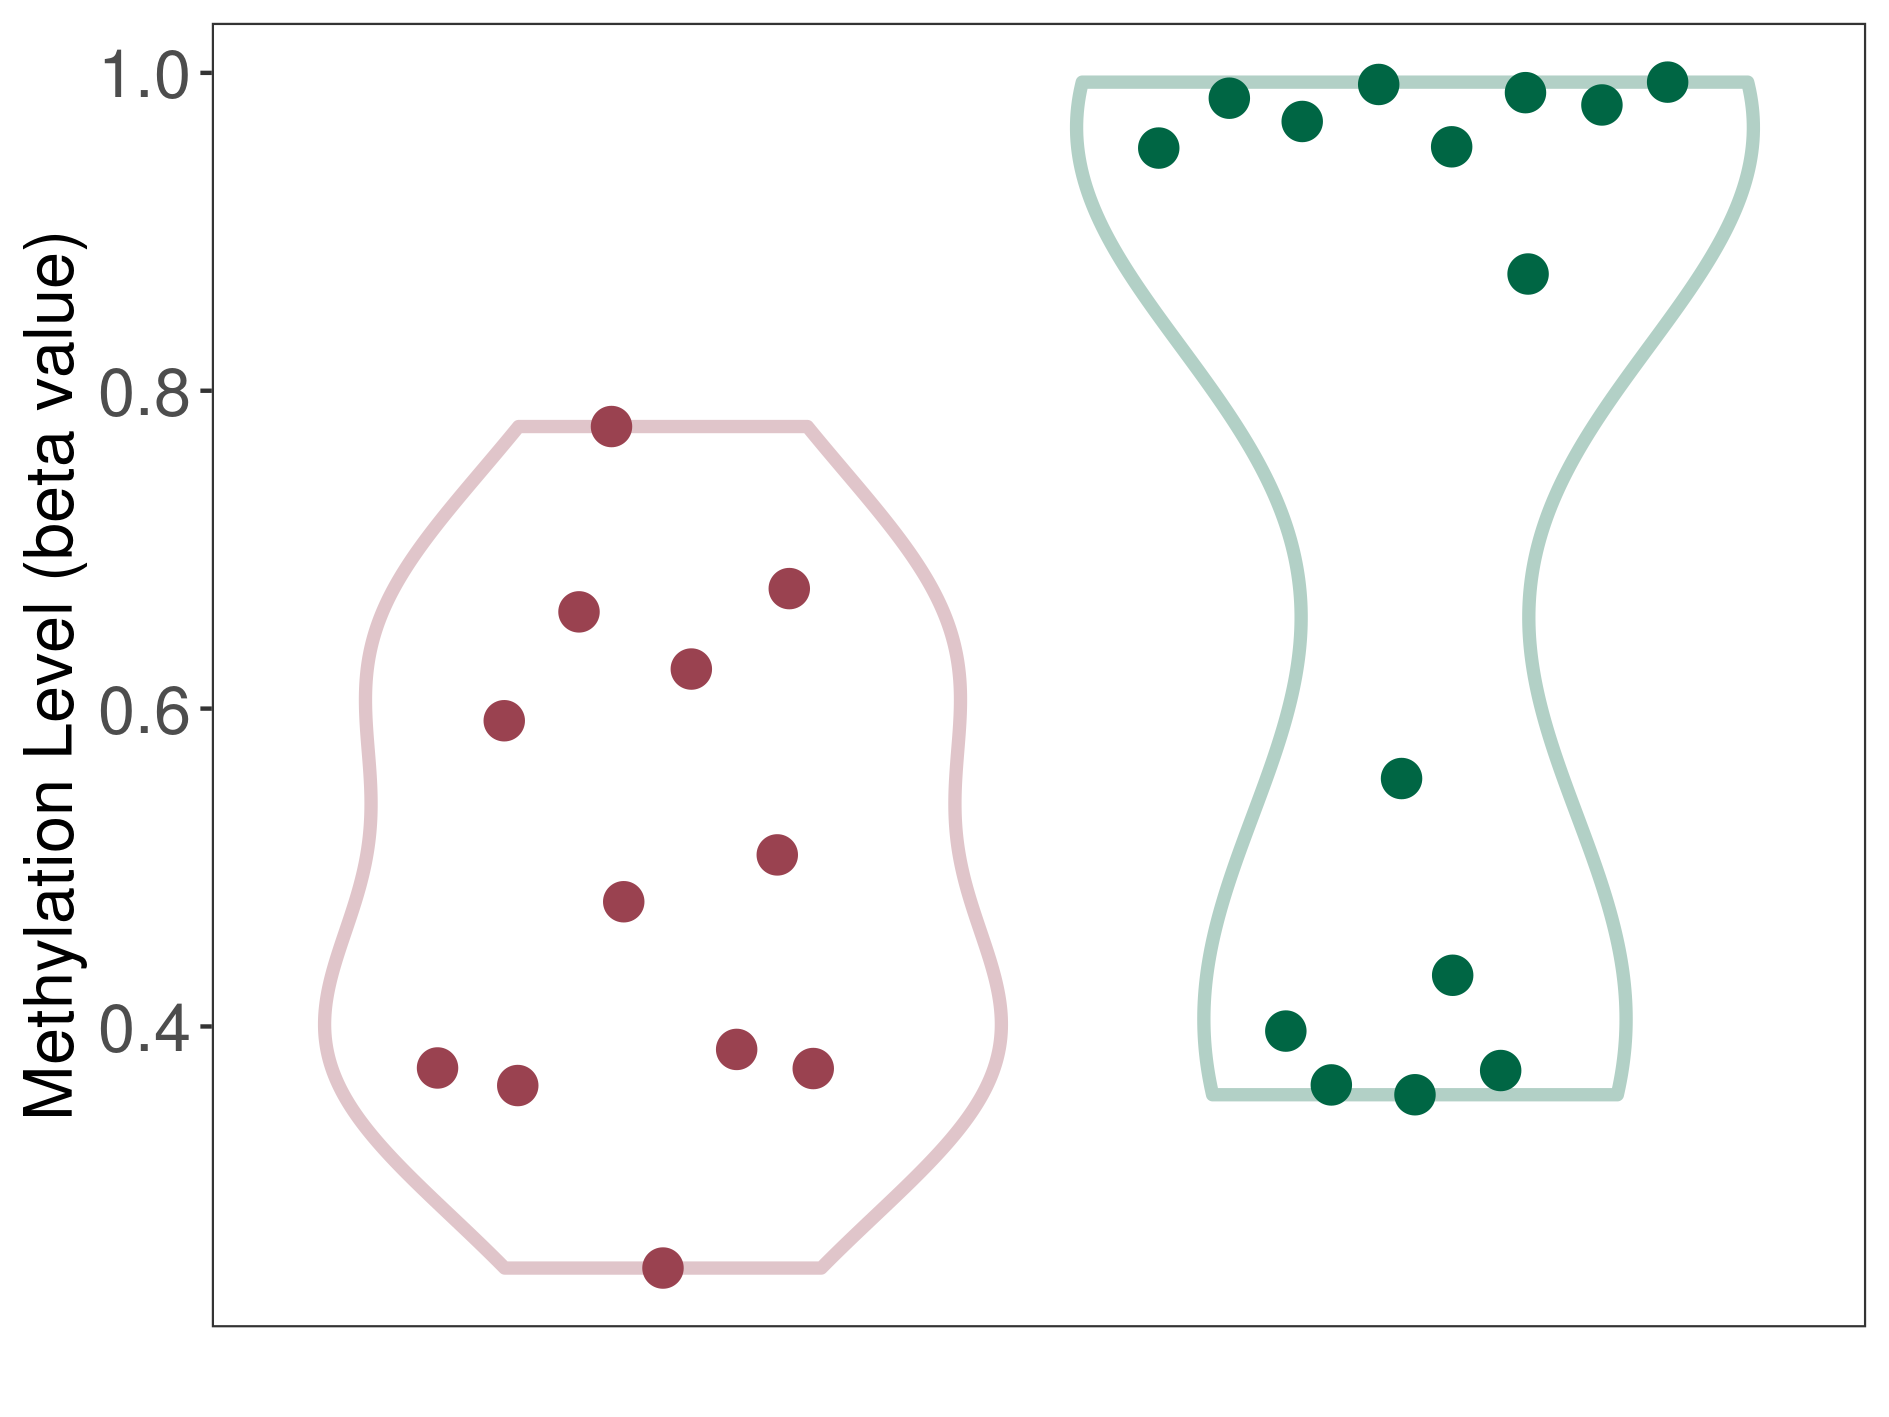
| DNA methyltransferase (DNMT) | Low grade glioma | Significant hypomethylation | |||
| Interaction Name | DNMT-HMGCR interaction | ||||
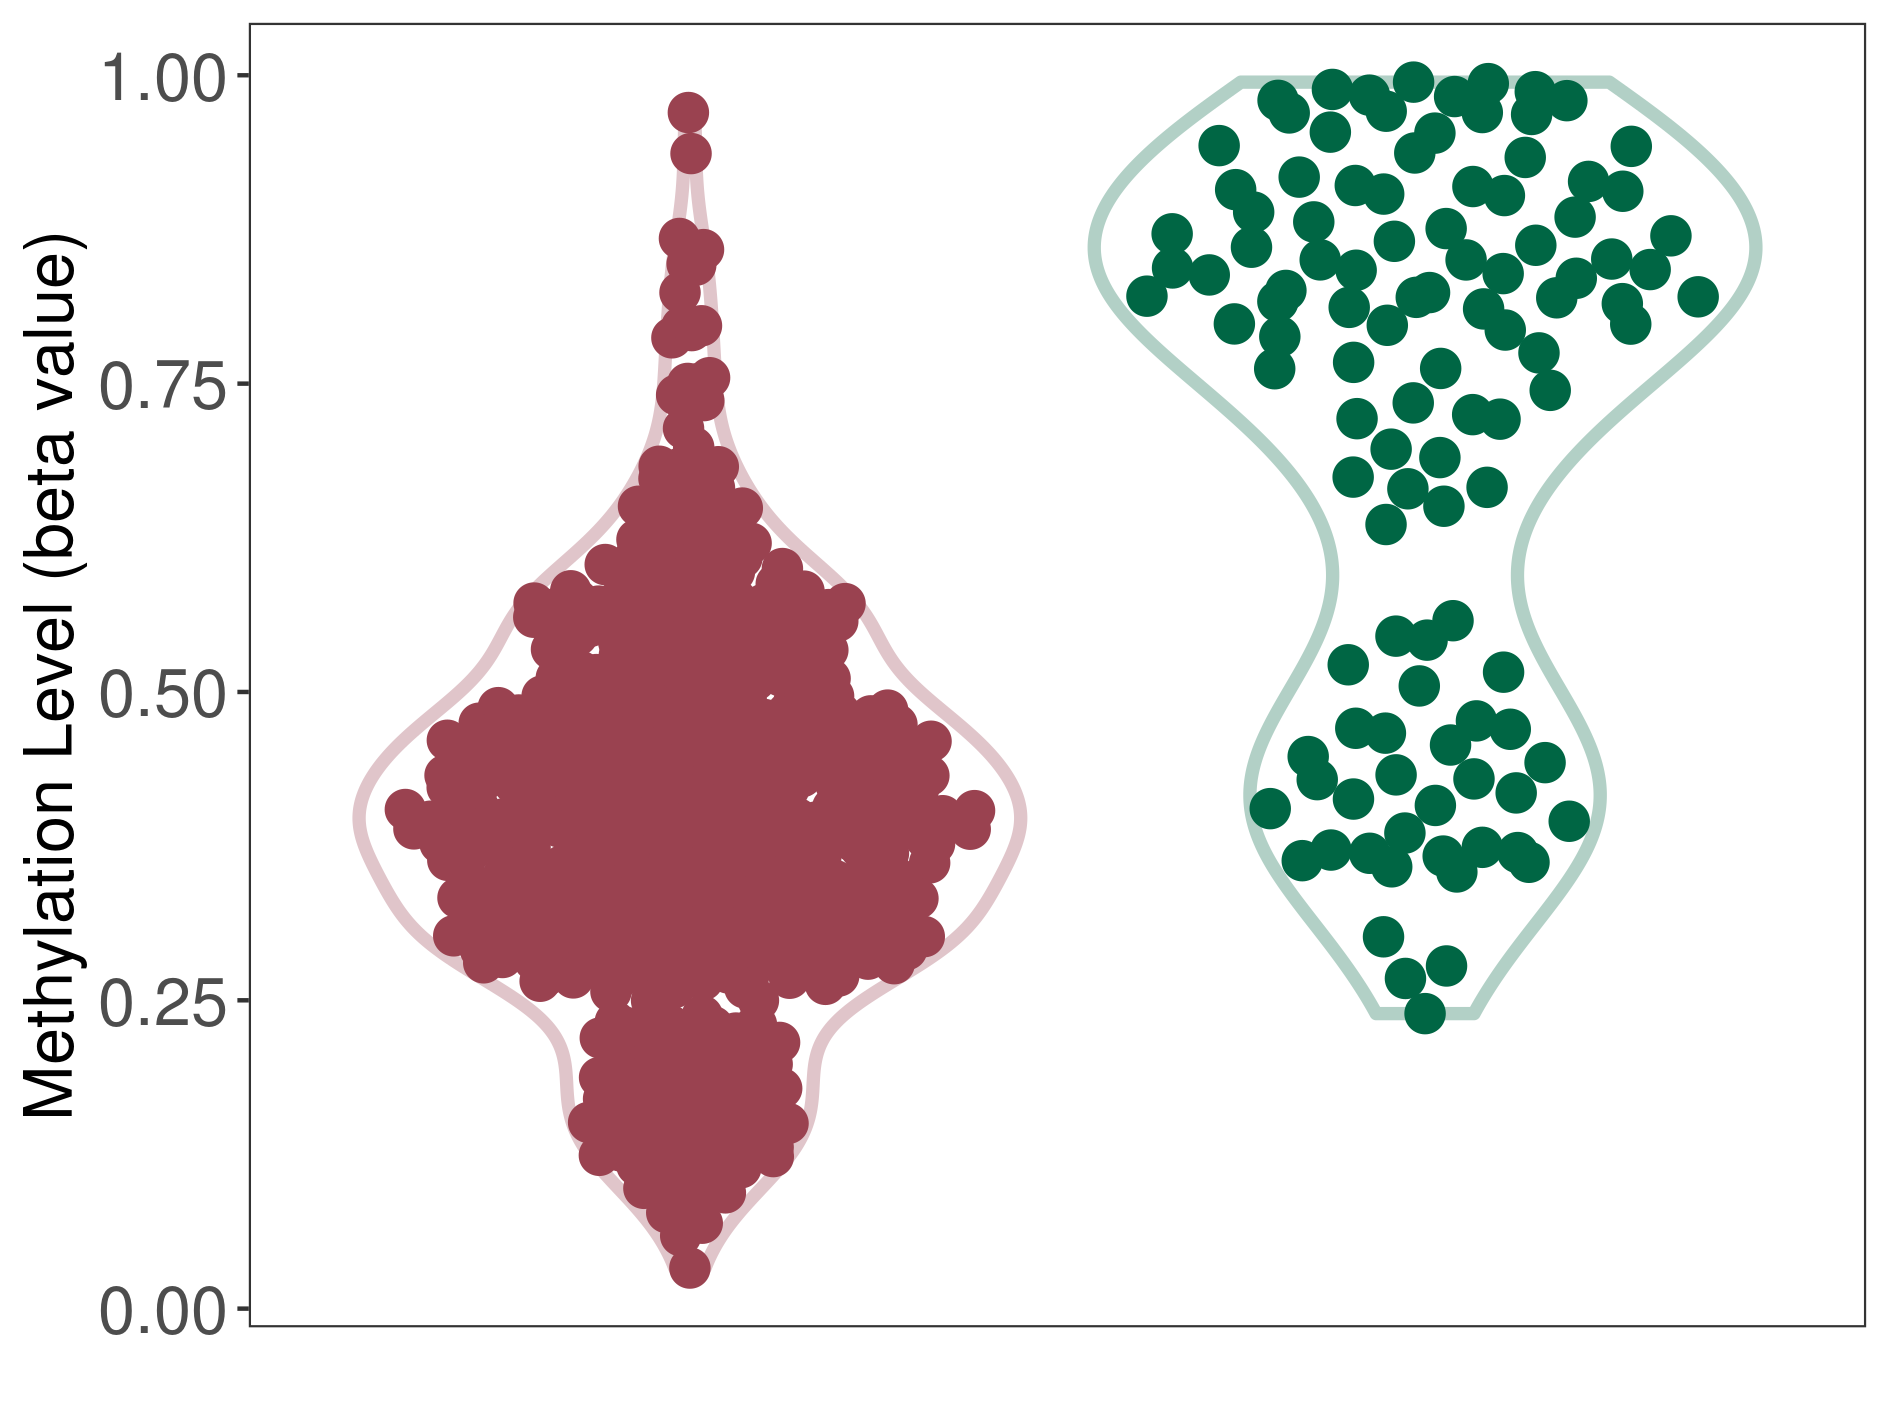
| The Methylation Level of Disease Section Compare with the Healthy Individual Tissue | Significant hypomethylation p-value: 7.93E-28; delta-beta: -4.04E-01 | ||||
| Description | DNA methyltransferase (DNMT) is reported to significantly hypo-methylate the HMGCR gene, which leads to a significantly increased expression of the drug-metabolizing enzyme HMG-CoA reductase. As a result, the interaction between DNMT and HMGCR can significantly affect the drug-metabolizing process of HMG-CoA reductase. | ||||
|
DME methylation in the diseased tissue of patients
DME methylation in the normal tissue of healthy individuals
|
|||||
| Violin Diagram of DME Disease-specific Methylation Level |
|
Click to View the Clearer Original Diagram | |||
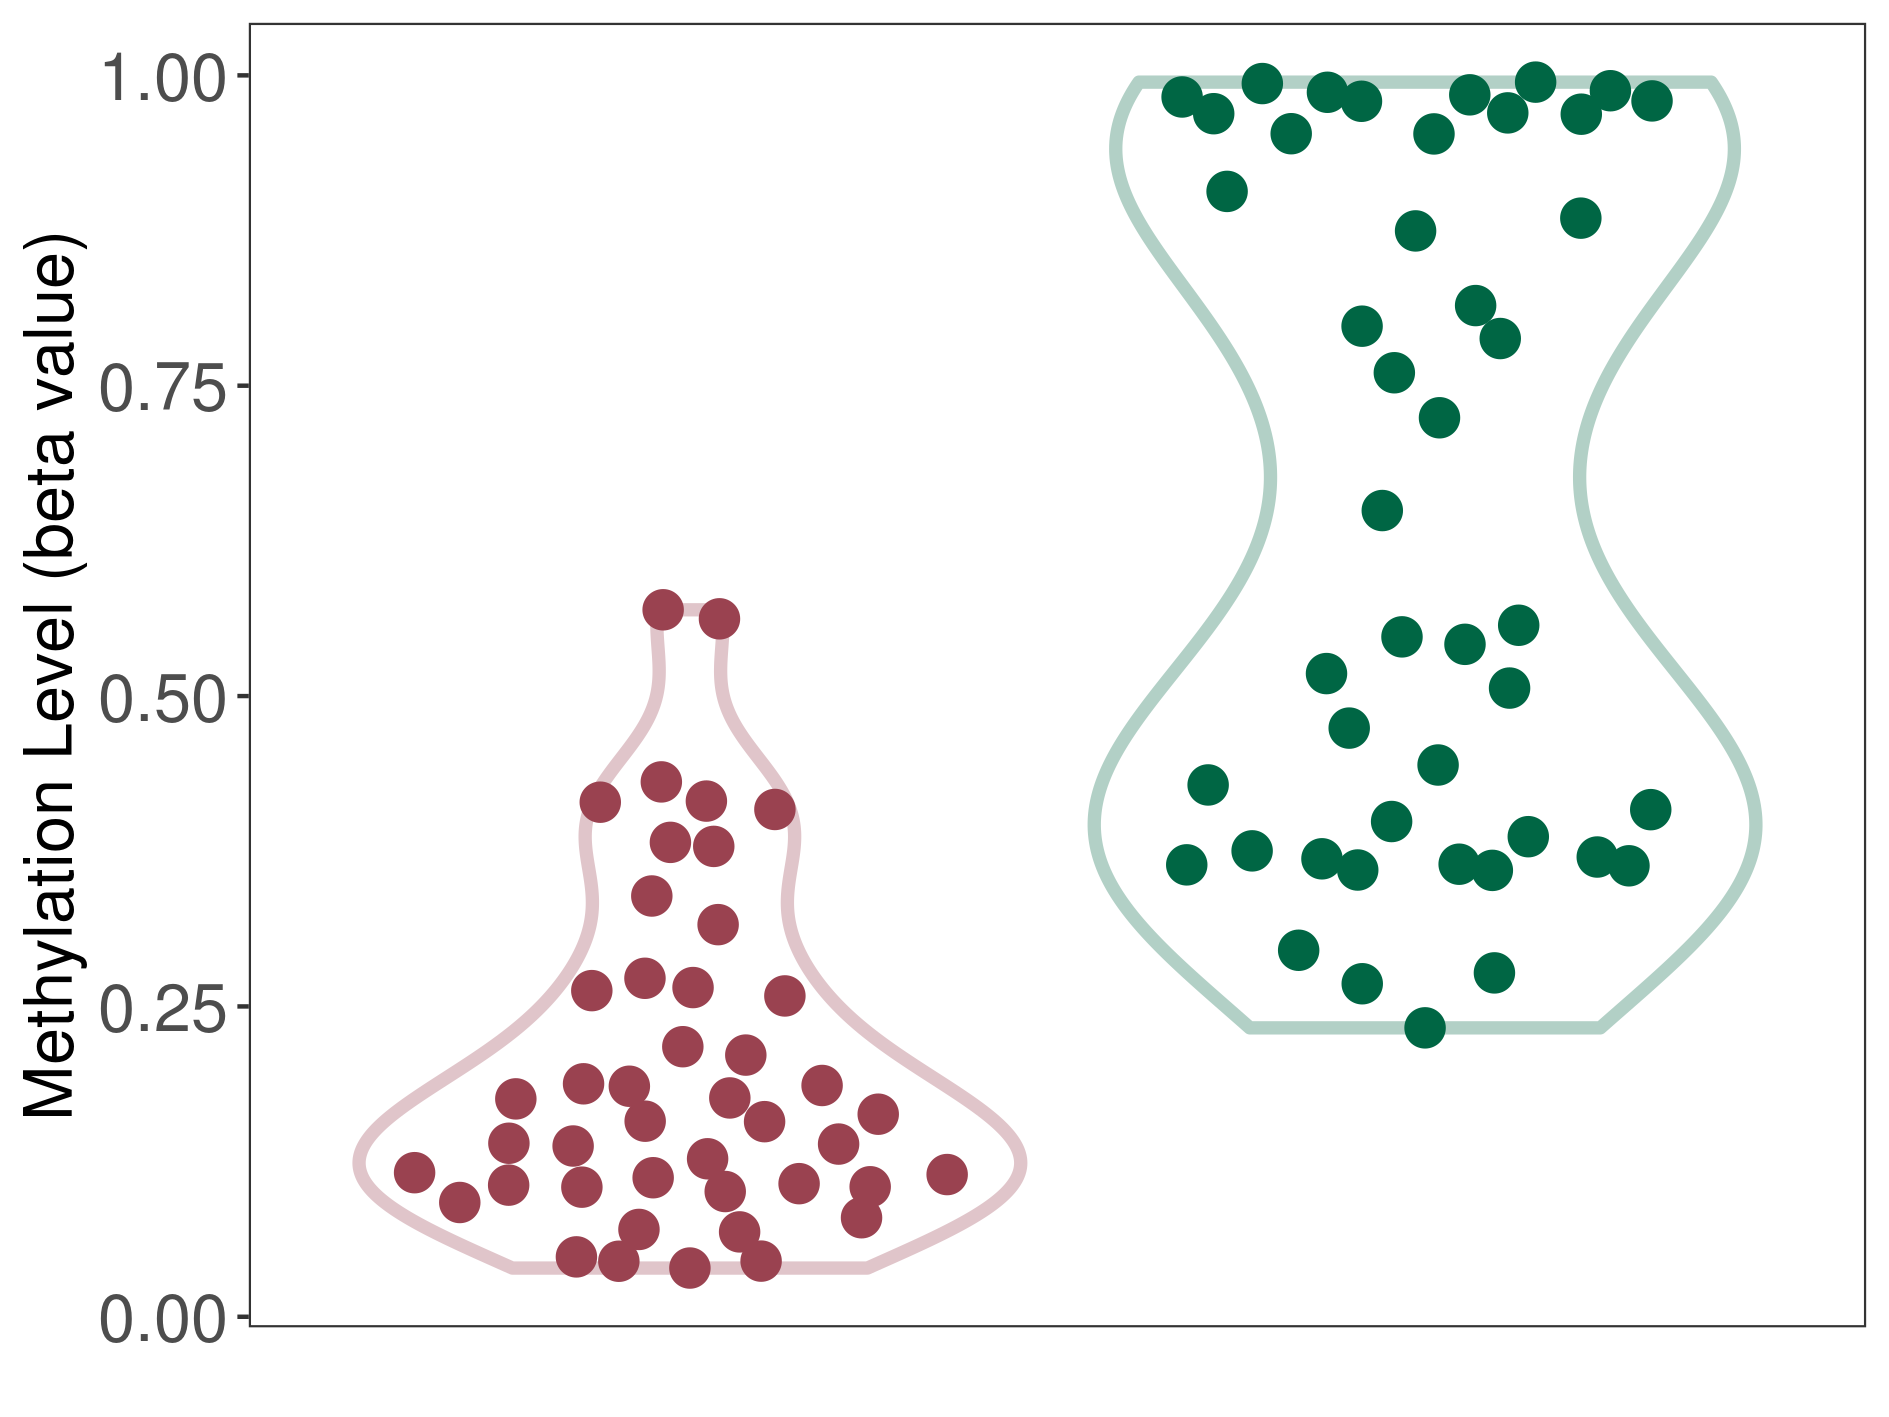
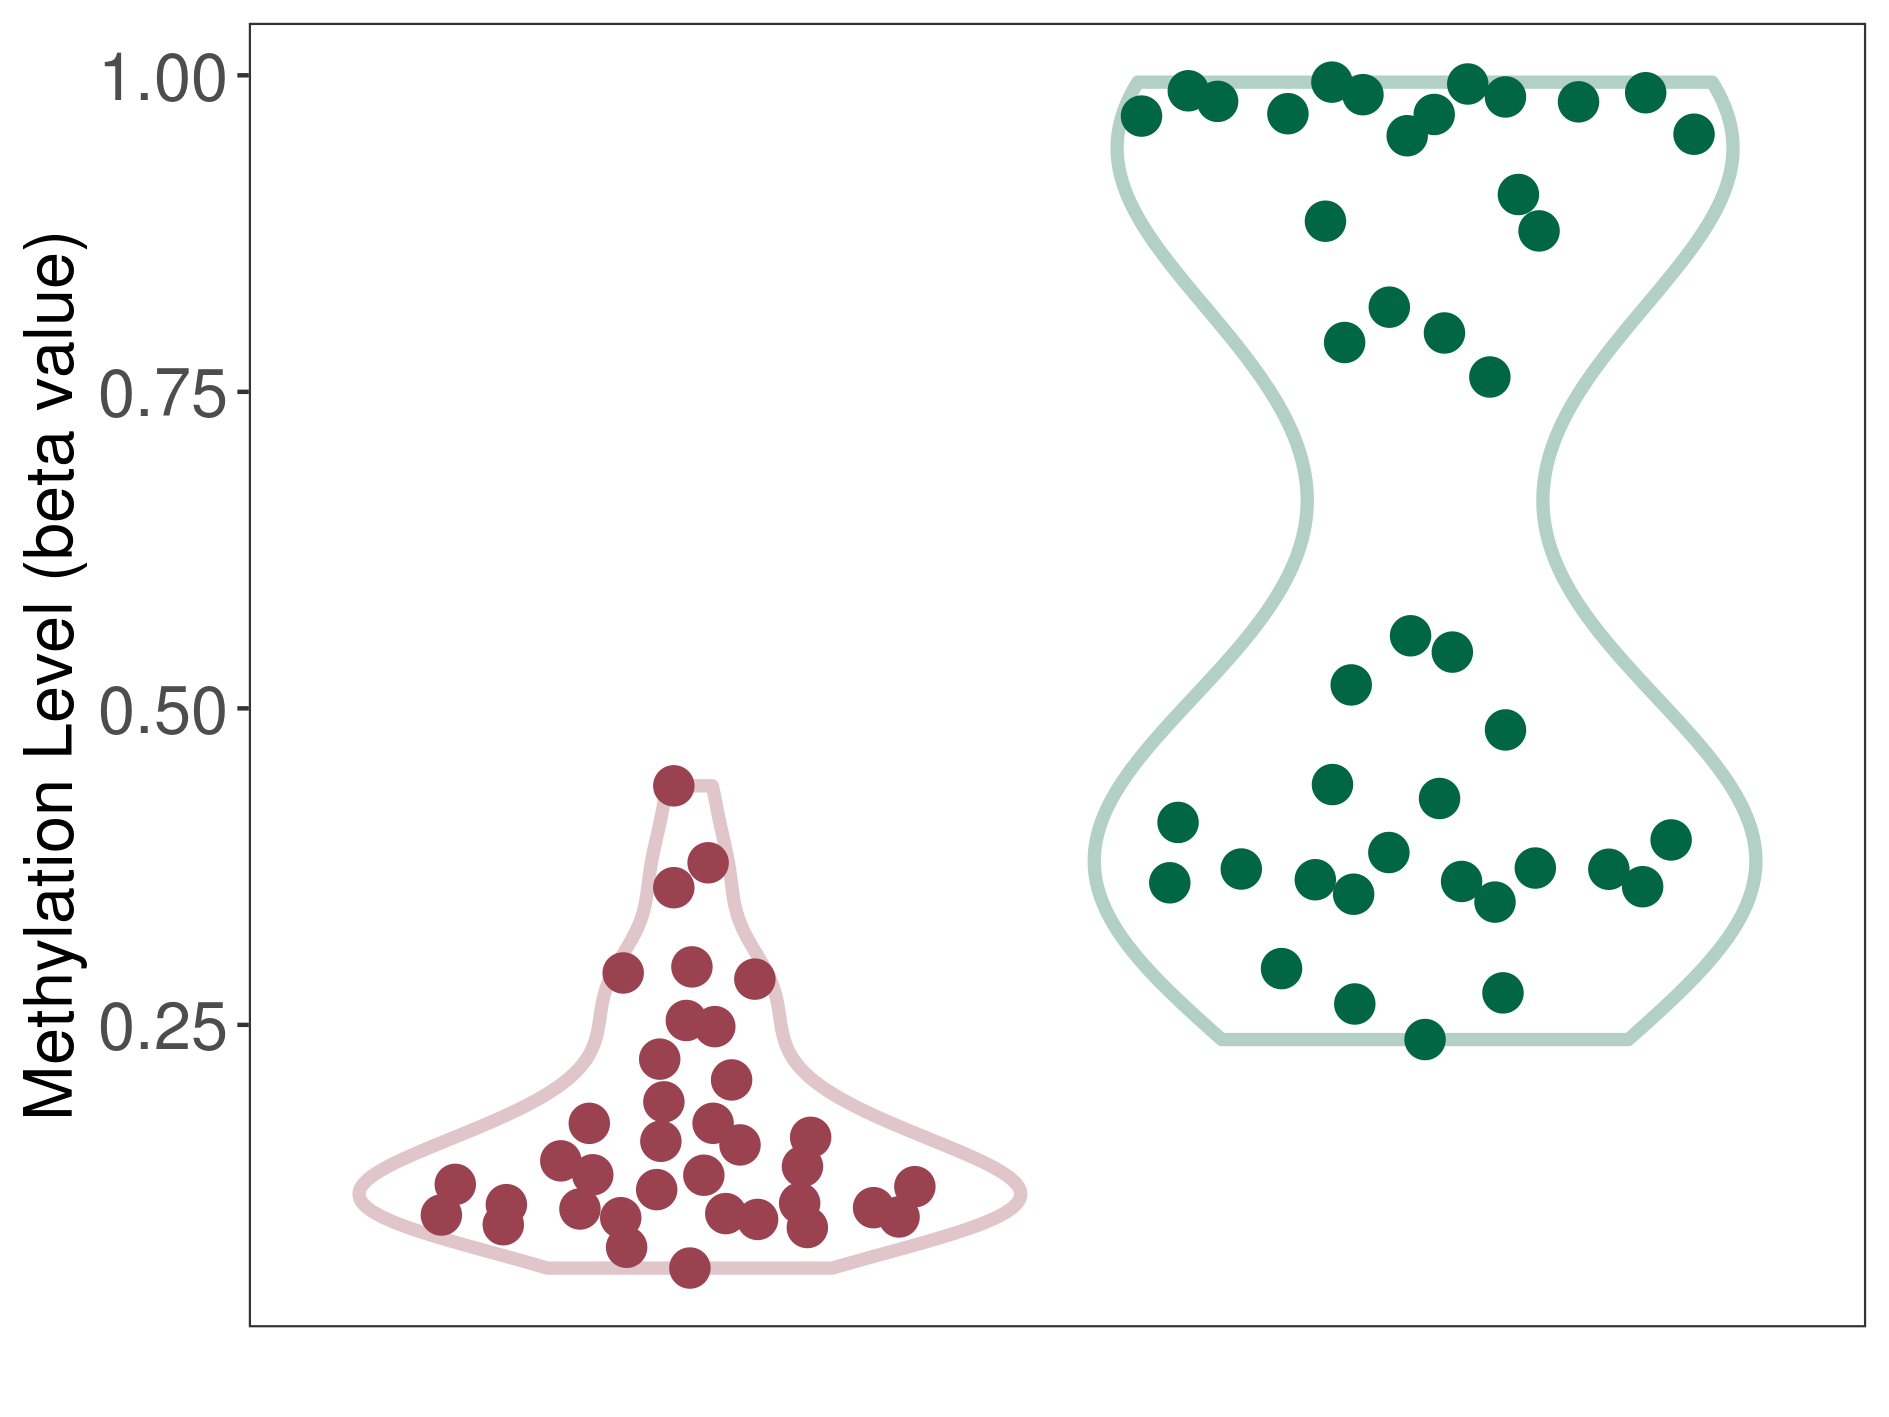
| DNA methyltransferase (DNMT) | Brain neuroblastoma | Significant hypomethylation | |||
| Interaction Name | DNMT-HMGCR interaction | ||||
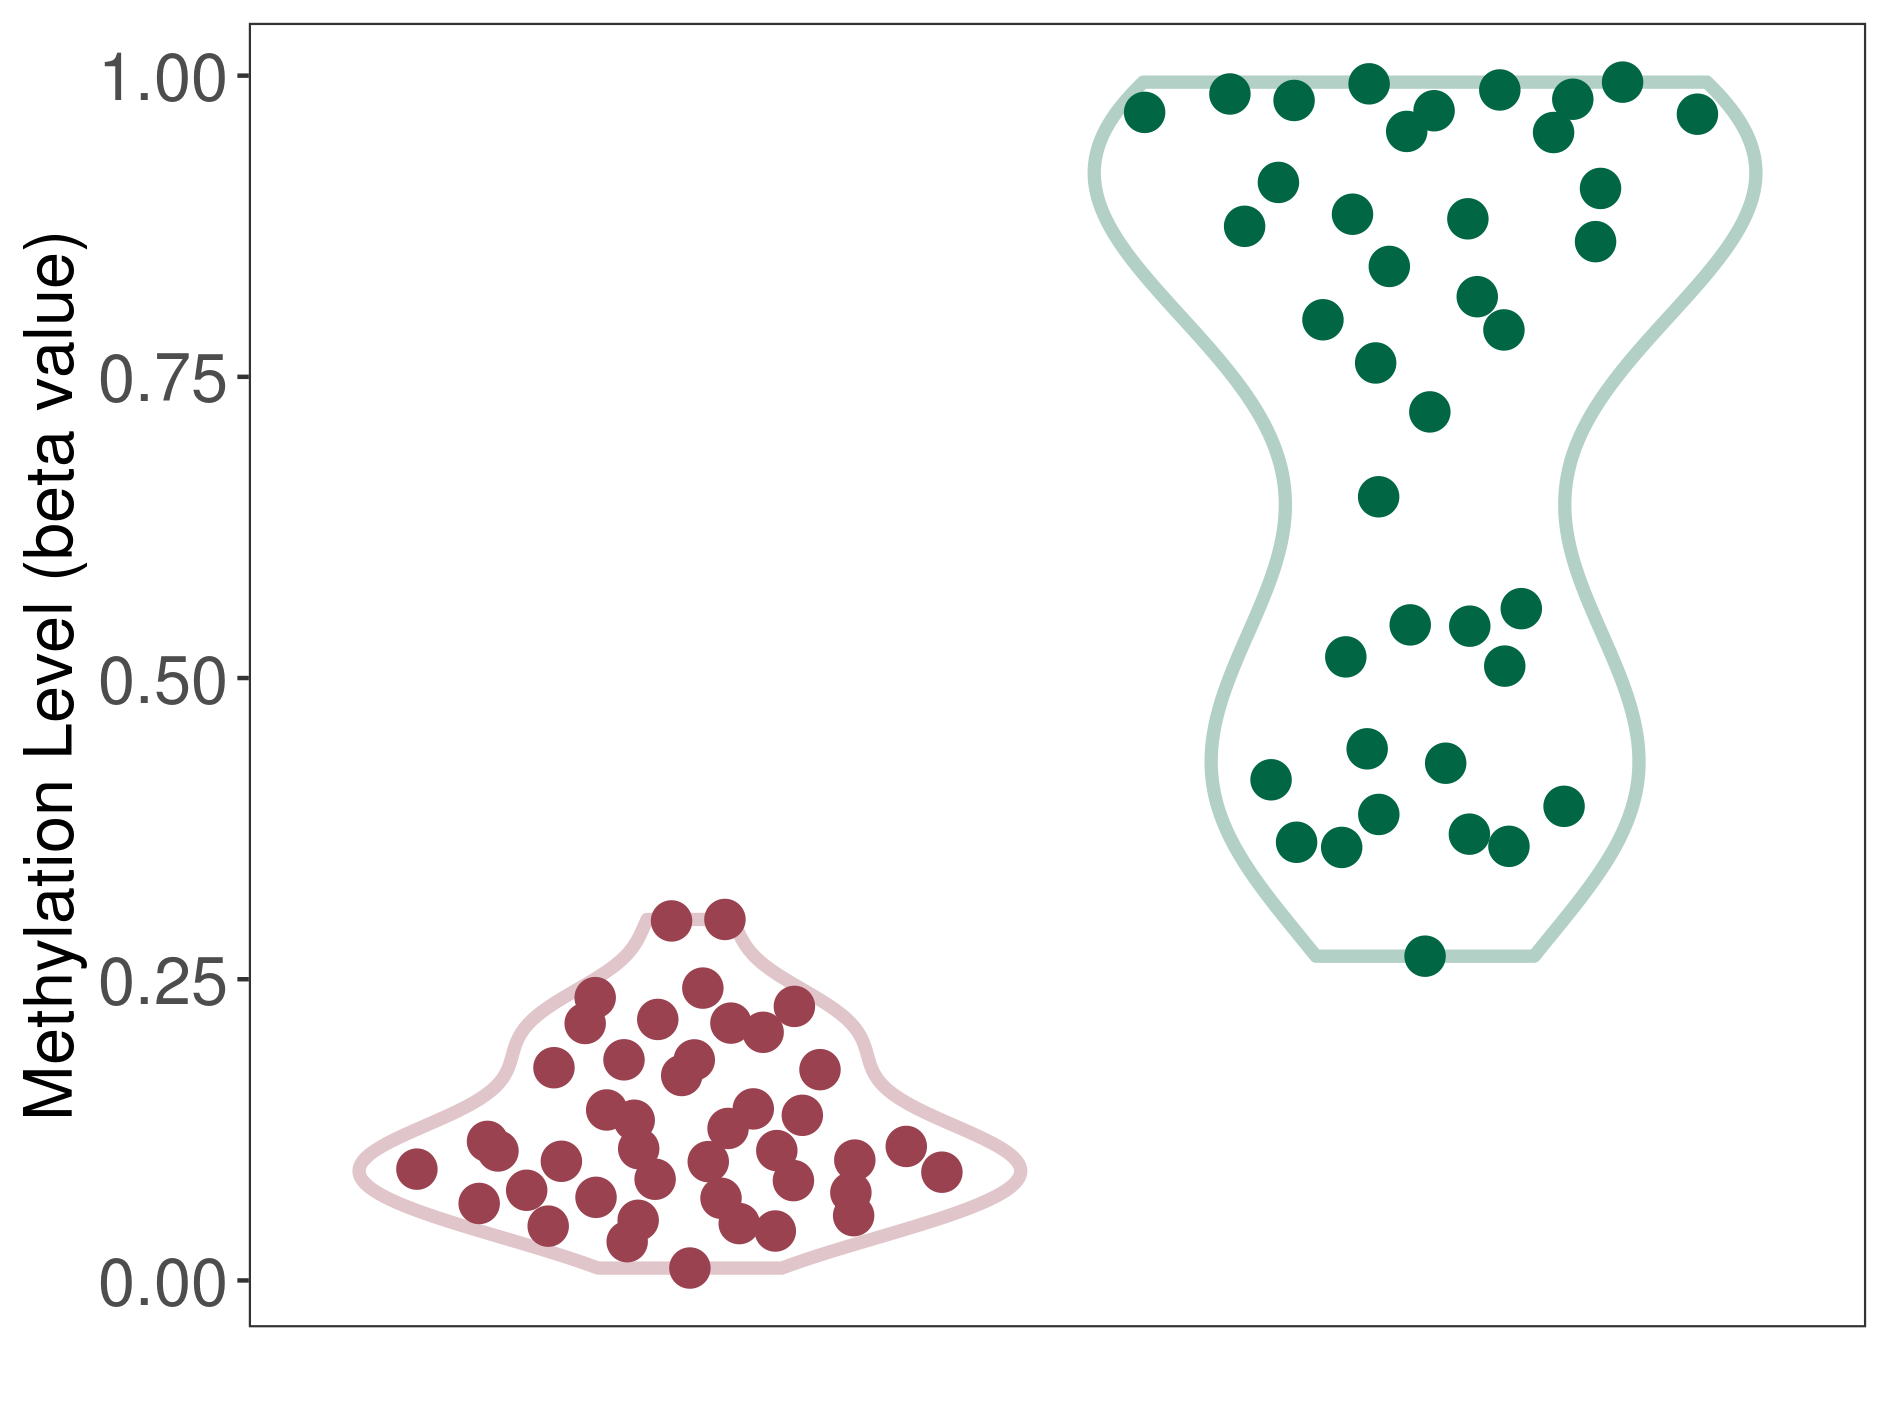
| The Methylation Level of Disease Section Compare with the Healthy Individual Tissue | Significant hypomethylation p-value: 3.33E-18; delta-beta: -6.88E-01 | ||||
| Description | DNA methyltransferase (DNMT) is reported to significantly hypo-methylate the HMGCR gene, which leads to a significantly increased expression of the drug-metabolizing enzyme HMG-CoA reductase. As a result, the interaction between DNMT and HMGCR can significantly affect the drug-metabolizing process of HMG-CoA reductase. | ||||
|
DME methylation in the diseased tissue of patients
DME methylation in the normal tissue of healthy individuals
|
|||||
| Violin Diagram of DME Disease-specific Methylation Level |
|
Click to View the Clearer Original Diagram | |||
| DNA methyltransferase (DNMT) | Malignant astrocytoma | Significant hypomethylation | |||
| Interaction Name | DNMT-HMGCR interaction | ||||
| The Methylation Level of Disease Section Compare with the Healthy Individual Tissue | Significant hypomethylation p-value: 2.01E-33; delta-beta: -4.79E-01 | ||||
| Description | DNA methyltransferase (DNMT) is reported to significantly hypo-methylate the HMGCR gene, which leads to a significantly increased expression of the drug-metabolizing enzyme HMG-CoA reductase. As a result, the interaction between DNMT and HMGCR can significantly affect the drug-metabolizing process of HMG-CoA reductase. | ||||
|
DME methylation in the diseased tissue of patients
DME methylation in the normal tissue of healthy individuals
|
|||||
| Violin Diagram of DME Disease-specific Methylation Level |
|
Click to View the Clearer Original Diagram | |||
| DNA methyltransferase (DNMT) | Mixed neuronal-glial tumour | Significant hypomethylation | |||
| Interaction Name | DNMT-HMGCR interaction | ||||
| The Methylation Level of Disease Section Compare with the Healthy Individual Tissue | Significant hypomethylation p-value: 5.50E-14; delta-beta: -4.58E-01 | ||||
| Description | DNA methyltransferase (DNMT) is reported to significantly hypo-methylate the HMGCR gene, which leads to a significantly increased expression of the drug-metabolizing enzyme HMG-CoA reductase. As a result, the interaction between DNMT and HMGCR can significantly affect the drug-metabolizing process of HMG-CoA reductase. | ||||
|
DME methylation in the diseased tissue of patients
DME methylation in the normal tissue of healthy individuals
|
|||||
| Violin Diagram of DME Disease-specific Methylation Level |
|
Click to View the Clearer Original Diagram | |||
| DNA methyltransferase (DNMT) | Brain neuroepithelial tumour | Moderate hypomethylation | |||
| Interaction Name | DNMT-HMGCR interaction | ||||
| The Methylation Level of Disease Section Compare with the Healthy Individual Tissue | Moderate hypomethylation p-value: 2.02E-05; delta-beta: -2.52E-01 | ||||
| Description | DNA methyltransferase (DNMT) is reported to moderatly hypo-methylate the HMGCR gene, which leads to a moderatly increased expression of the drug-metabolizing enzyme HMG-CoA reductase. As a result, the interaction between DNMT and HMGCR can moderatly affect the drug-metabolizing process of HMG-CoA reductase. | ||||
|
DME methylation in the diseased tissue of patients
DME methylation in the normal tissue of healthy individuals
|
|||||
| Violin Diagram of DME Disease-specific Methylation Level |
|
Click to View the Clearer Original Diagram | |||
| DNA methyltransferase (DNMT) | Myxopapillary ependymoma | Significant hypomethylation | |||
| Interaction Name | DNMT-HMGCR interaction | ||||
| The Methylation Level of Disease Section Compare with the Healthy Individual Tissue | Significant hypomethylation p-value: 2.68E-14; delta-beta: -3.97E-01 | ||||
| Description | DNA methyltransferase (DNMT) is reported to significantly hypo-methylate the HMGCR gene, which leads to a significantly increased expression of the drug-metabolizing enzyme HMG-CoA reductase. As a result, the interaction between DNMT and HMGCR can significantly affect the drug-metabolizing process of HMG-CoA reductase. | ||||
|
DME methylation in the diseased tissue of patients
DME methylation in the normal tissue of healthy individuals
|
|||||
| Violin Diagram of DME Disease-specific Methylation Level |
|
Click to View the Clearer Original Diagram | |||
| DNA methyltransferase (DNMT) | RELA YAP fusion ependymoma | Significant hypomethylation | |||
| Interaction Name | DNMT-HMGCR interaction | ||||
| The Methylation Level of Disease Section Compare with the Healthy Individual Tissue | Significant hypomethylation p-value: 1.26E-40; delta-beta: -5.91E-01 | ||||
| Description | DNA methyltransferase (DNMT) is reported to significantly hypo-methylate the HMGCR gene, which leads to a significantly increased expression of the drug-metabolizing enzyme HMG-CoA reductase. As a result, the interaction between DNMT and HMGCR can significantly affect the drug-metabolizing process of HMG-CoA reductase. | ||||
|
DME methylation in the diseased tissue of patients
DME methylation in the normal tissue of healthy individuals
|
|||||
| Violin Diagram of DME Disease-specific Methylation Level |
|
Click to View the Clearer Original Diagram | |||
| DNA methyltransferase (DNMT) | Diffuse midline glioma | Significant hypomethylation | |||
| Interaction Name | DNMT-HMGCR interaction | ||||
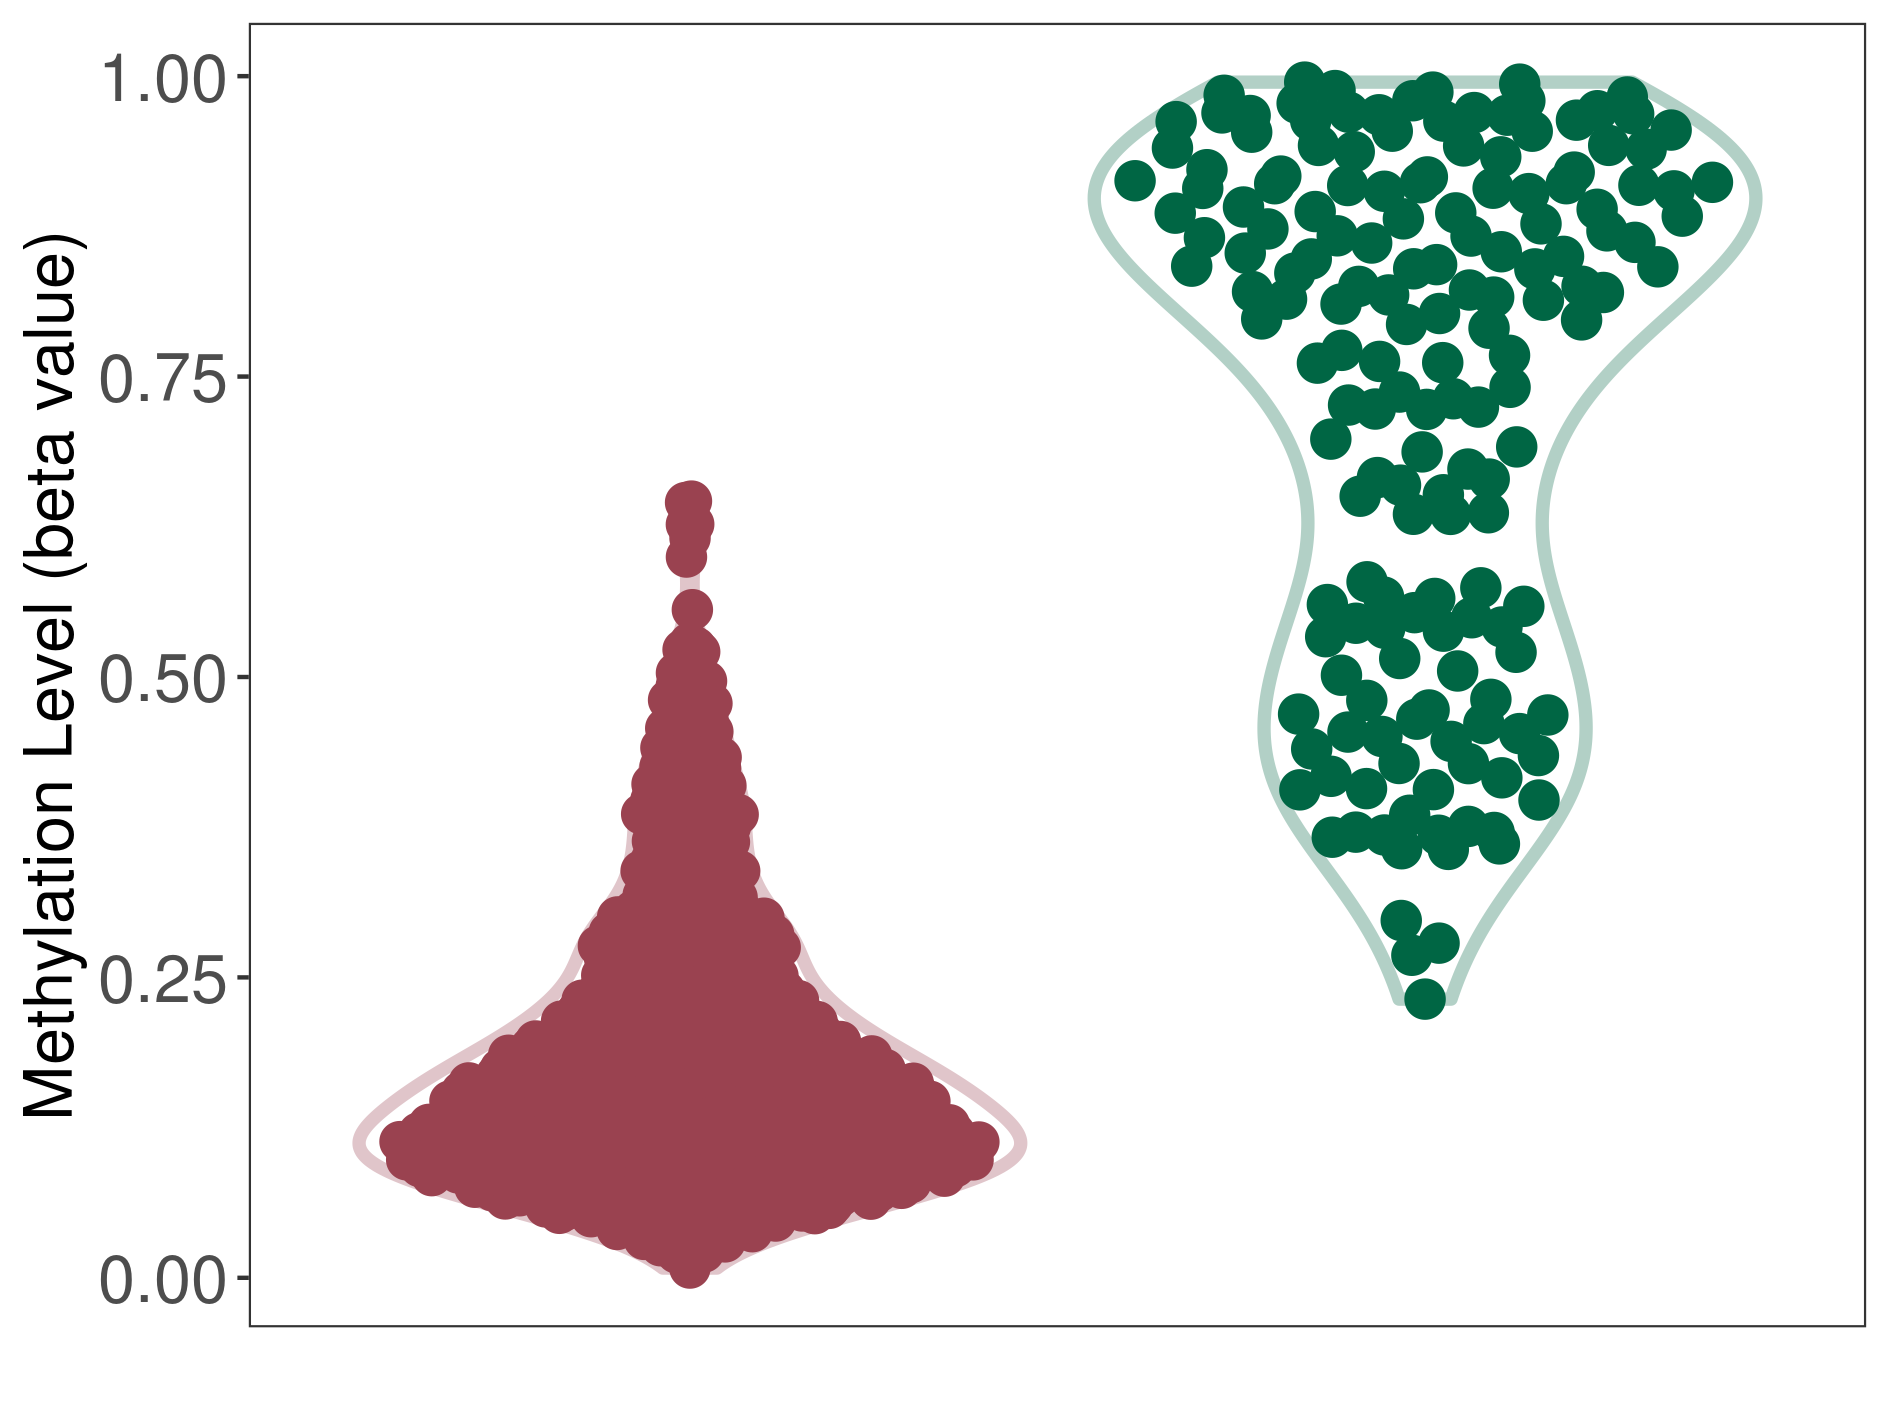
| The Methylation Level of Disease Section Compare with the Healthy Individual Tissue | Significant hypomethylation p-value: 4.49E-45; delta-beta: -5.38E-01 | ||||
| Description | DNA methyltransferase (DNMT) is reported to significantly hypo-methylate the HMGCR gene, which leads to a significantly increased expression of the drug-metabolizing enzyme HMG-CoA reductase. As a result, the interaction between DNMT and HMGCR can significantly affect the drug-metabolizing process of HMG-CoA reductase. | ||||
|
DME methylation in the diseased tissue of patients
DME methylation in the normal tissue of healthy individuals
|
|||||
| Violin Diagram of DME Disease-specific Methylation Level |
|
Click to View the Clearer Original Diagram | |||
| DNA methyltransferase (DNMT) | Third ventricle chordoid glioma | Significant hypomethylation | |||
| Interaction Name | DNMT-HMGCR interaction | ||||
| The Methylation Level of Disease Section Compare with the Healthy Individual Tissue | Significant hypomethylation p-value: 1.15E-02; delta-beta: -4.59E-01 | ||||
| Description | DNA methyltransferase (DNMT) is reported to significantly hypo-methylate the HMGCR gene, which leads to a significantly increased expression of the drug-metabolizing enzyme HMG-CoA reductase. As a result, the interaction between DNMT and HMGCR can significantly affect the drug-metabolizing process of HMG-CoA reductase. | ||||
|
DME methylation in the diseased tissue of patients
DME methylation in the normal tissue of healthy individuals
|
|||||
| Violin Diagram of DME Disease-specific Methylation Level |
|
Click to View the Clearer Original Diagram | |||
| DNA methyltransferase (DNMT) | Spinal ependymoma | Significant hypomethylation | |||
| Interaction Name | DNMT-HMGCR interaction | ||||
| The Methylation Level of Disease Section Compare with the Healthy Individual Tissue | Significant hypomethylation p-value: 7.31E-14; delta-beta: -4.16E-01 | ||||
| Description | DNA methyltransferase (DNMT) is reported to significantly hypo-methylate the HMGCR gene, which leads to a significantly increased expression of the drug-metabolizing enzyme HMG-CoA reductase. As a result, the interaction between DNMT and HMGCR can significantly affect the drug-metabolizing process of HMG-CoA reductase. | ||||
|
DME methylation in the diseased tissue of patients
DME methylation in the normal tissue of healthy individuals
|
|||||
| Violin Diagram of DME Disease-specific Methylation Level |
|
Click to View the Clearer Original Diagram | |||
| DNA methyltransferase (DNMT) | Anaplastic pleomorphic xanthoastrocytoma | Significant hypomethylation | |||
| Interaction Name | DNMT-HMGCR interaction | ||||
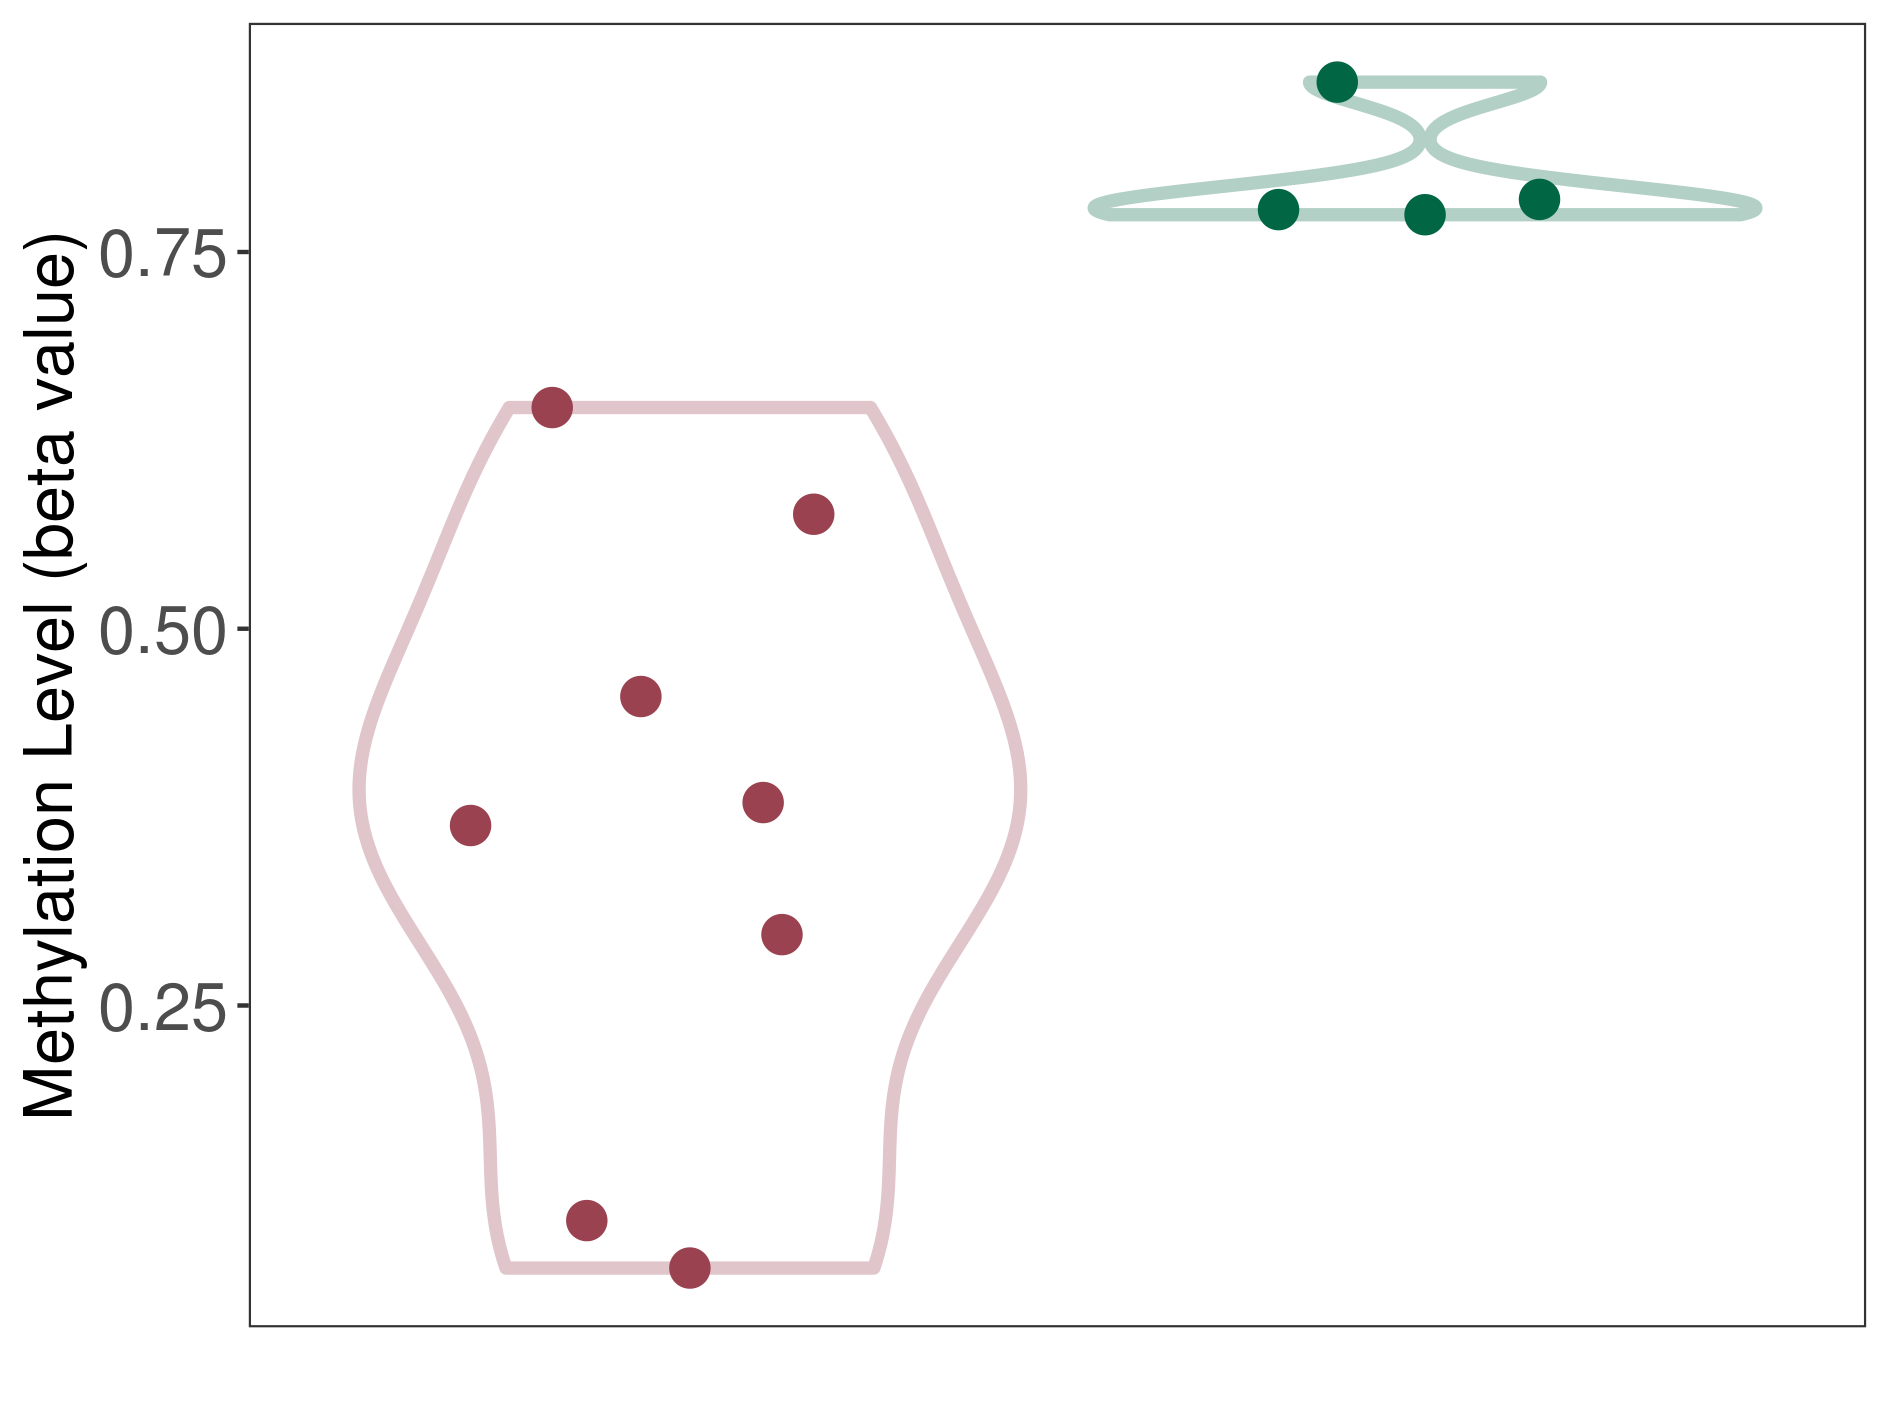
| The Methylation Level of Disease Section Compare with the Healthy Individual Tissue | Significant hypomethylation p-value: 7.56E-03; delta-beta: -3.30E-01 | ||||
| Description | DNA methyltransferase (DNMT) is reported to significantly hypo-methylate the HMGCR gene, which leads to a significantly increased expression of the drug-metabolizing enzyme HMG-CoA reductase. As a result, the interaction between DNMT and HMGCR can significantly affect the drug-metabolizing process of HMG-CoA reductase. | ||||
|
DME methylation in the diseased tissue of patients
DME methylation in the normal tissue of healthy individuals
|
|||||
| Violin Diagram of DME Disease-specific Methylation Level |
|
Click to View the Clearer Original Diagram | |||
| ICD-11: 2C12 Liver cancer | Click to Show/Hide the Full List of HOSPPI: 4 HOSPPI | ||||
| Non-coding RNA regulation | |||||
| hsa-miR-27a-3p | Liver cancer | Suppression | |||
| miRBase ID | |||||
| Interaction Name | hsa-miR-27a-3p--HMGCR regulation | [1] | |||
| Studied Cell Lines | Huh7 cell line | ||||
| Description | hsa-miR-27a-3p is reported to suppress HMGCR mRNA translation by binding to the 3' untranslated region (3'UTR) of HMGCR mRNA, which leads to a decreased expression of the drug-metabolizing enzyme HMG-CoA reductase. | ||||
| hsa-miR-29a-3p | Liver cancer | Suppression | |||
| miRBase ID | |||||
| Interaction Name | hsa-miR-29a-3p--HMGCR regulation | [2] | |||
| Studied Cell Lines | HepG2 cell line | ||||
| Description | hsa-miR-29a-3p is reported to suppress HMGCR mRNA translation by binding to the 3' untranslated region (3'UTR) of HMGCR mRNA, which leads to a decreased expression of the drug-metabolizing enzyme HMG-CoA reductase. | ||||
| hsa-miR-29b-3p | Liver cancer | Suppression | |||
| miRBase ID | |||||
| Interaction Name | hsa-miR-29b-3p--HMGCR regulation | [2] | |||
| Studied Cell Lines | HepG2 cell line | ||||
| Description | hsa-miR-29b-3p is reported to suppress HMGCR mRNA translation by binding to the 3' untranslated region (3'UTR) of HMGCR mRNA, which leads to a decreased expression of the drug-metabolizing enzyme HMG-CoA reductase. | ||||
| hsa-miR-29c-3p | Liver cancer | Suppression | |||
| miRBase ID | |||||
| Interaction Name | hsa-miR-29c-3p--HMGCR regulation | [2] | |||
| Studied Cell Lines | HepG2 cell line | ||||
| Description | hsa-miR-29c-3p is reported to suppress HMGCR mRNA translation by binding to the 3' untranslated region (3'UTR) of HMGCR mRNA, which leads to a decreased expression of the drug-metabolizing enzyme HMG-CoA reductase. | ||||
| ICD-11: 2D50 Brain cancer metastasis | Click to Show/Hide the Full List of HOSPPI: 1 HOSPPI | ||||
| DNA methylation | |||||
| DNA methyltransferase (DNMT) | Posterior fossa ependymoma | Significant hypomethylation | |||
| Interaction Name | DNMT-HMGCR interaction | ||||
| The Methylation Level of Disease Section Compare with the Healthy Individual Tissue | Significant hypomethylation p-value: 1.18E-75; delta-beta: -6.56E-01 | ||||
| Description | DNA methyltransferase (DNMT) is reported to significantly hypo-methylate the HMGCR gene, which leads to a significantly increased expression of the drug-metabolizing enzyme HMG-CoA reductase. As a result, the interaction between DNMT and HMGCR can significantly affect the drug-metabolizing process of HMG-CoA reductase. | ||||
|
DME methylation in the diseased tissue of patients
DME methylation in the normal tissue of healthy individuals
|
|||||
| Violin Diagram of DME Disease-specific Methylation Level |
|
Click to View the Clearer Original Diagram | |||
| ICD-11: 2E06 Prostate cancer metastasis | Click to Show/Hide the Full List of HOSPPI: 1 HOSPPI | ||||
| DNA methylation | |||||
| DNA methyltransferase (DNMT) | Prostate cancer metastasis | Significant hypomethylation | |||
| Interaction Name | DNMT-HMGCR interaction | ||||
| The Methylation Level of Disease Section Compare with the Healthy Individual Tissue | Significant hypomethylation p-value: 3.65E-04; delta-beta: -4.04E-01 | ||||
| Description | DNA methyltransferase (DNMT) is reported to significantly hypo-methylate the HMGCR gene, which leads to a significantly increased expression of the drug-metabolizing enzyme HMG-CoA reductase. As a result, the interaction between DNMT and HMGCR can significantly affect the drug-metabolizing process of HMG-CoA reductase. | ||||
|
DME methylation in the diseased tissue of patients
DME methylation in the normal tissue of healthy individuals
|
|||||
| Violin Diagram of DME Disease-specific Methylation Level |
|
Click to View the Clearer Original Diagram | |||
| ICD Disease Classification 11 Circulatory system diseases | |||||
| ICD-11: BD51 Arterial aneurysm | Click to Show/Hide the Full List of HOSPPI: 1 HOSPPI | ||||
| DNA methylation | |||||
| DNA methyltransferase (DNMT) | Arterial aneurysm | Significant hypermethylation | |||
| Interaction Name | DNMT-HMGCR interaction | ||||
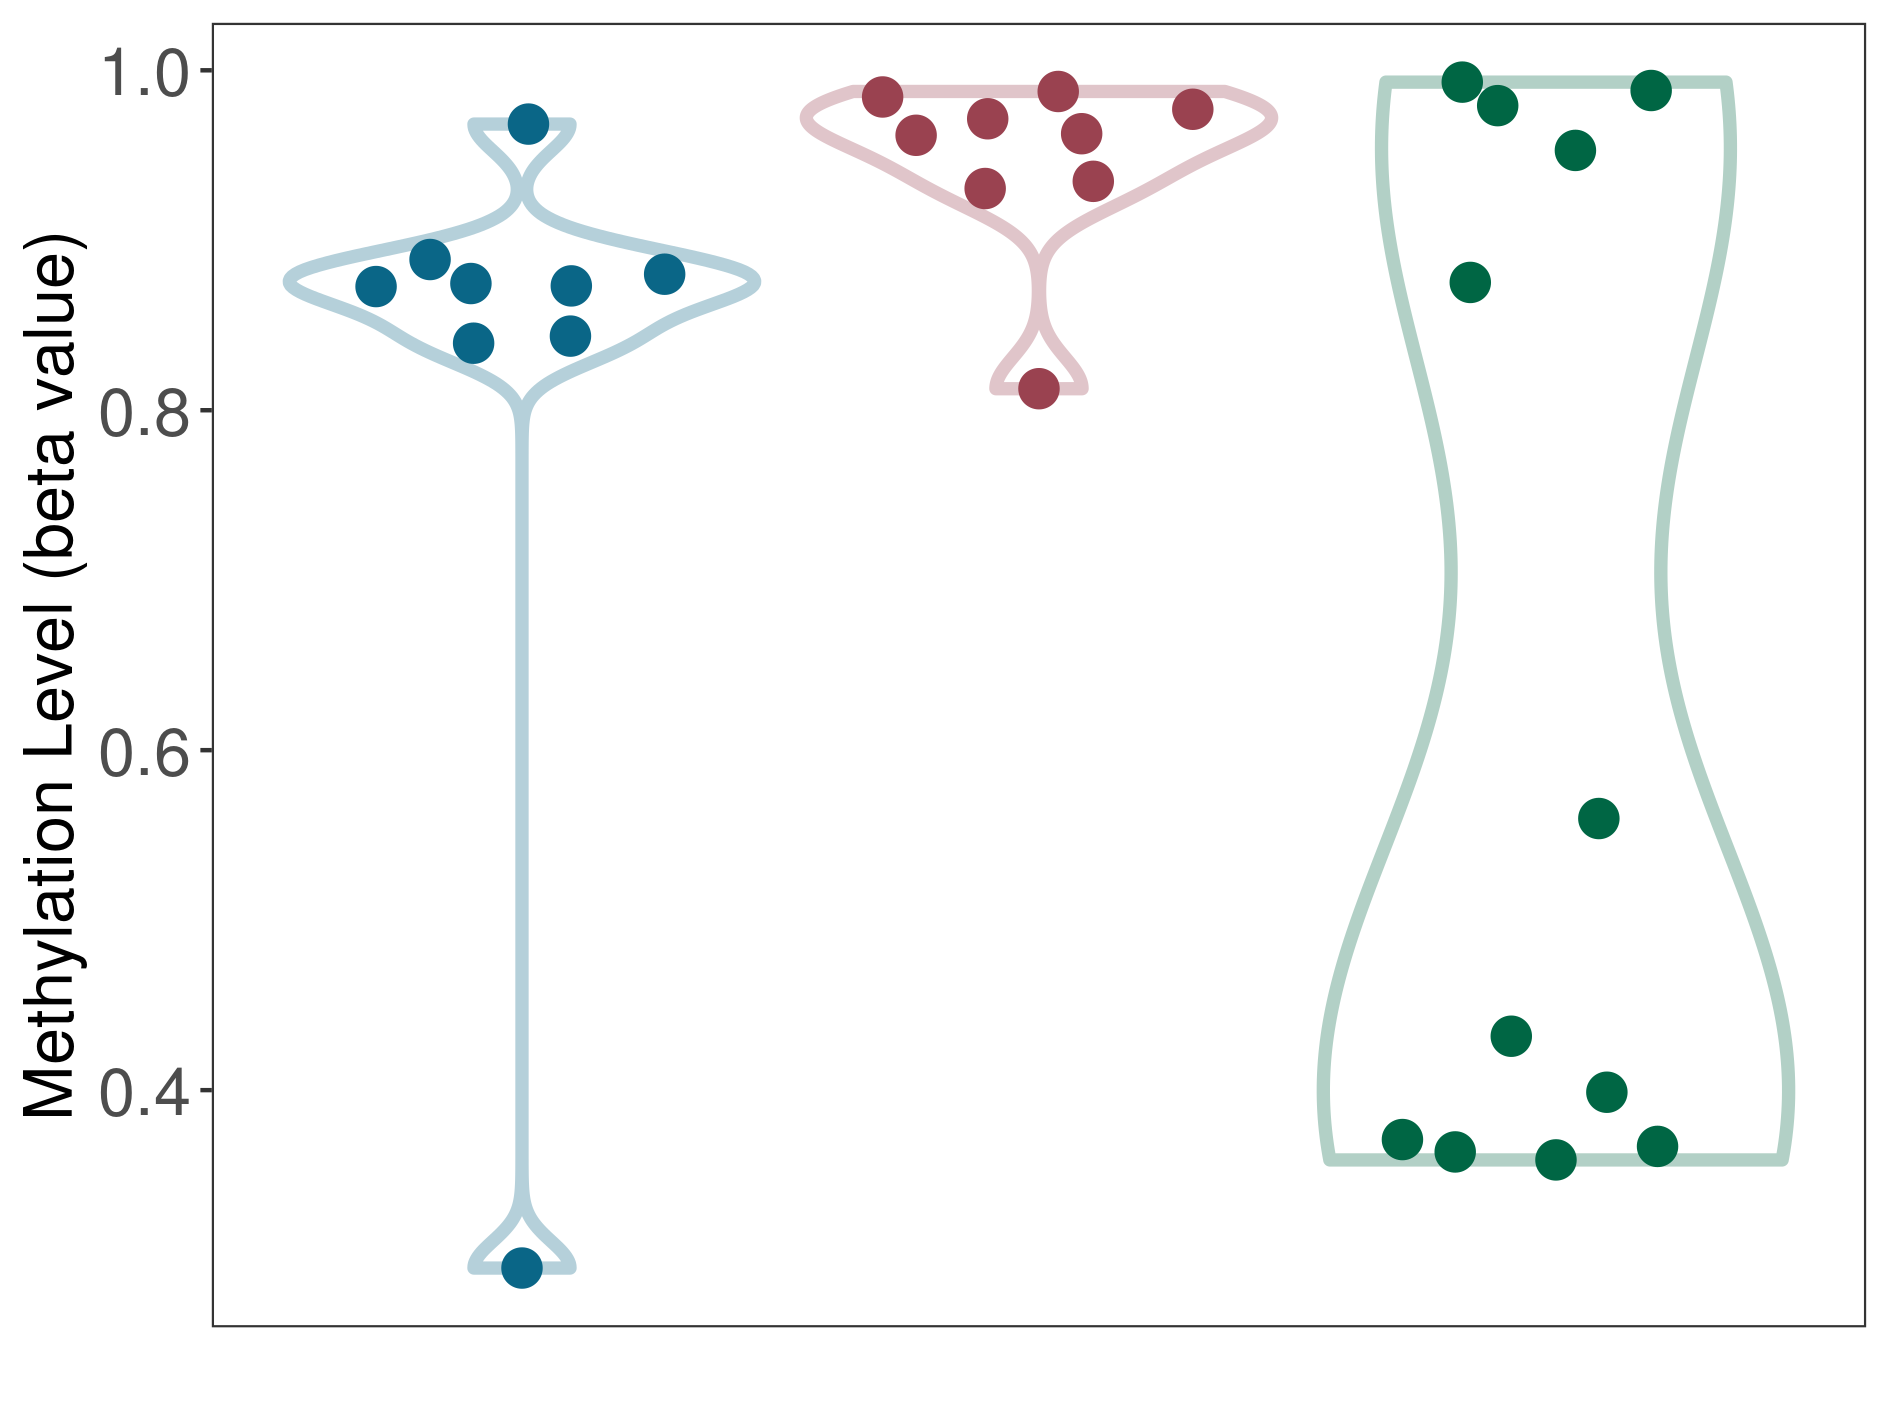
| The Methylation Level of Disease Section Compare with the Healthy Individual Tissue | Significant hypermethylation p-value: 3.47E-03; delta-beta: 4.67E-01 | ||||
| Description | DNA methyltransferase (DNMT) is reported to significantly hyper-methylate the HMGCR gene, which leads to a significantly decreased expression of the drug-metabolizing enzyme HMG-CoA reductase. As a result, the interaction between DNMT and HMGCR can significantly affect the drug-metabolizing process of HMG-CoA reductase. | ||||
|
DME methylation in the diseased tissue of patients
DME methylation in the normal tissue adjacent to the diseased tissue of patients
DME methylation in the normal tissue of healthy individuals
|
|||||
| Violin Diagram of DME Disease-specific Methylation Level |
|
Click to View the Clearer Original Diagram | |||
| ICD Disease Classification 13 Digestive system diseases | |||||
| ICD-11: DC11 Gallstone disease | Click to Show/Hide the Full List of HOSPPI: 1 HOSPPI | ||||
| Transcription-factor regulation | |||||
| Sterol element-binding 2 (SREBF2) | Gallstone disease | Activation | |||
| Uniprot ID | |||||
| Interaction Name | SREBF2-HMGCR interaction | [3] | |||
| Studied Cell Lines | Gallstone disease liver tissue | ||||
| Ensembl ID | |||||
| Description | Sterol element-binding 2 (SREBF2) is reported to activate the transcription of HMGCR gene, which leads to an increased expression of the drug-metabolizing enzyme HMG-CoA reductase. As a result, the interaction between SREBF2 and HMGCR can activate the drug-metabolizing process of HMG-CoA reductase. | ||||
If you find any error in data or bug in web service, please kindly report it to Dr. Yin and Dr. Li.