

Details of Host Protein-DME Interaction (HOSPPI)
| General Information of Drug-Metabolizing Enzyme (DME ID: DME0581) | |||||
|---|---|---|---|---|---|
| DME Name | Metallo-endopeptidase-like 1 (MMEL1), Homo sapiens | DME Info | |||
| UniProt ID | |||||
| EC Number | EC: 3.4.24.11 (Click to Show/Hide the Complete EC Tree) | ||||
| Lineage | Species: Homo sapiens (Click to Show/Hide the Complete Species Lineage) | ||||
| Interactome | |||||
| Disease Specific Interactions between Host Protein and DME (HOSPPI) | |||||
|---|---|---|---|---|---|
| ICD Disease Classification 02 Neoplasms | |||||
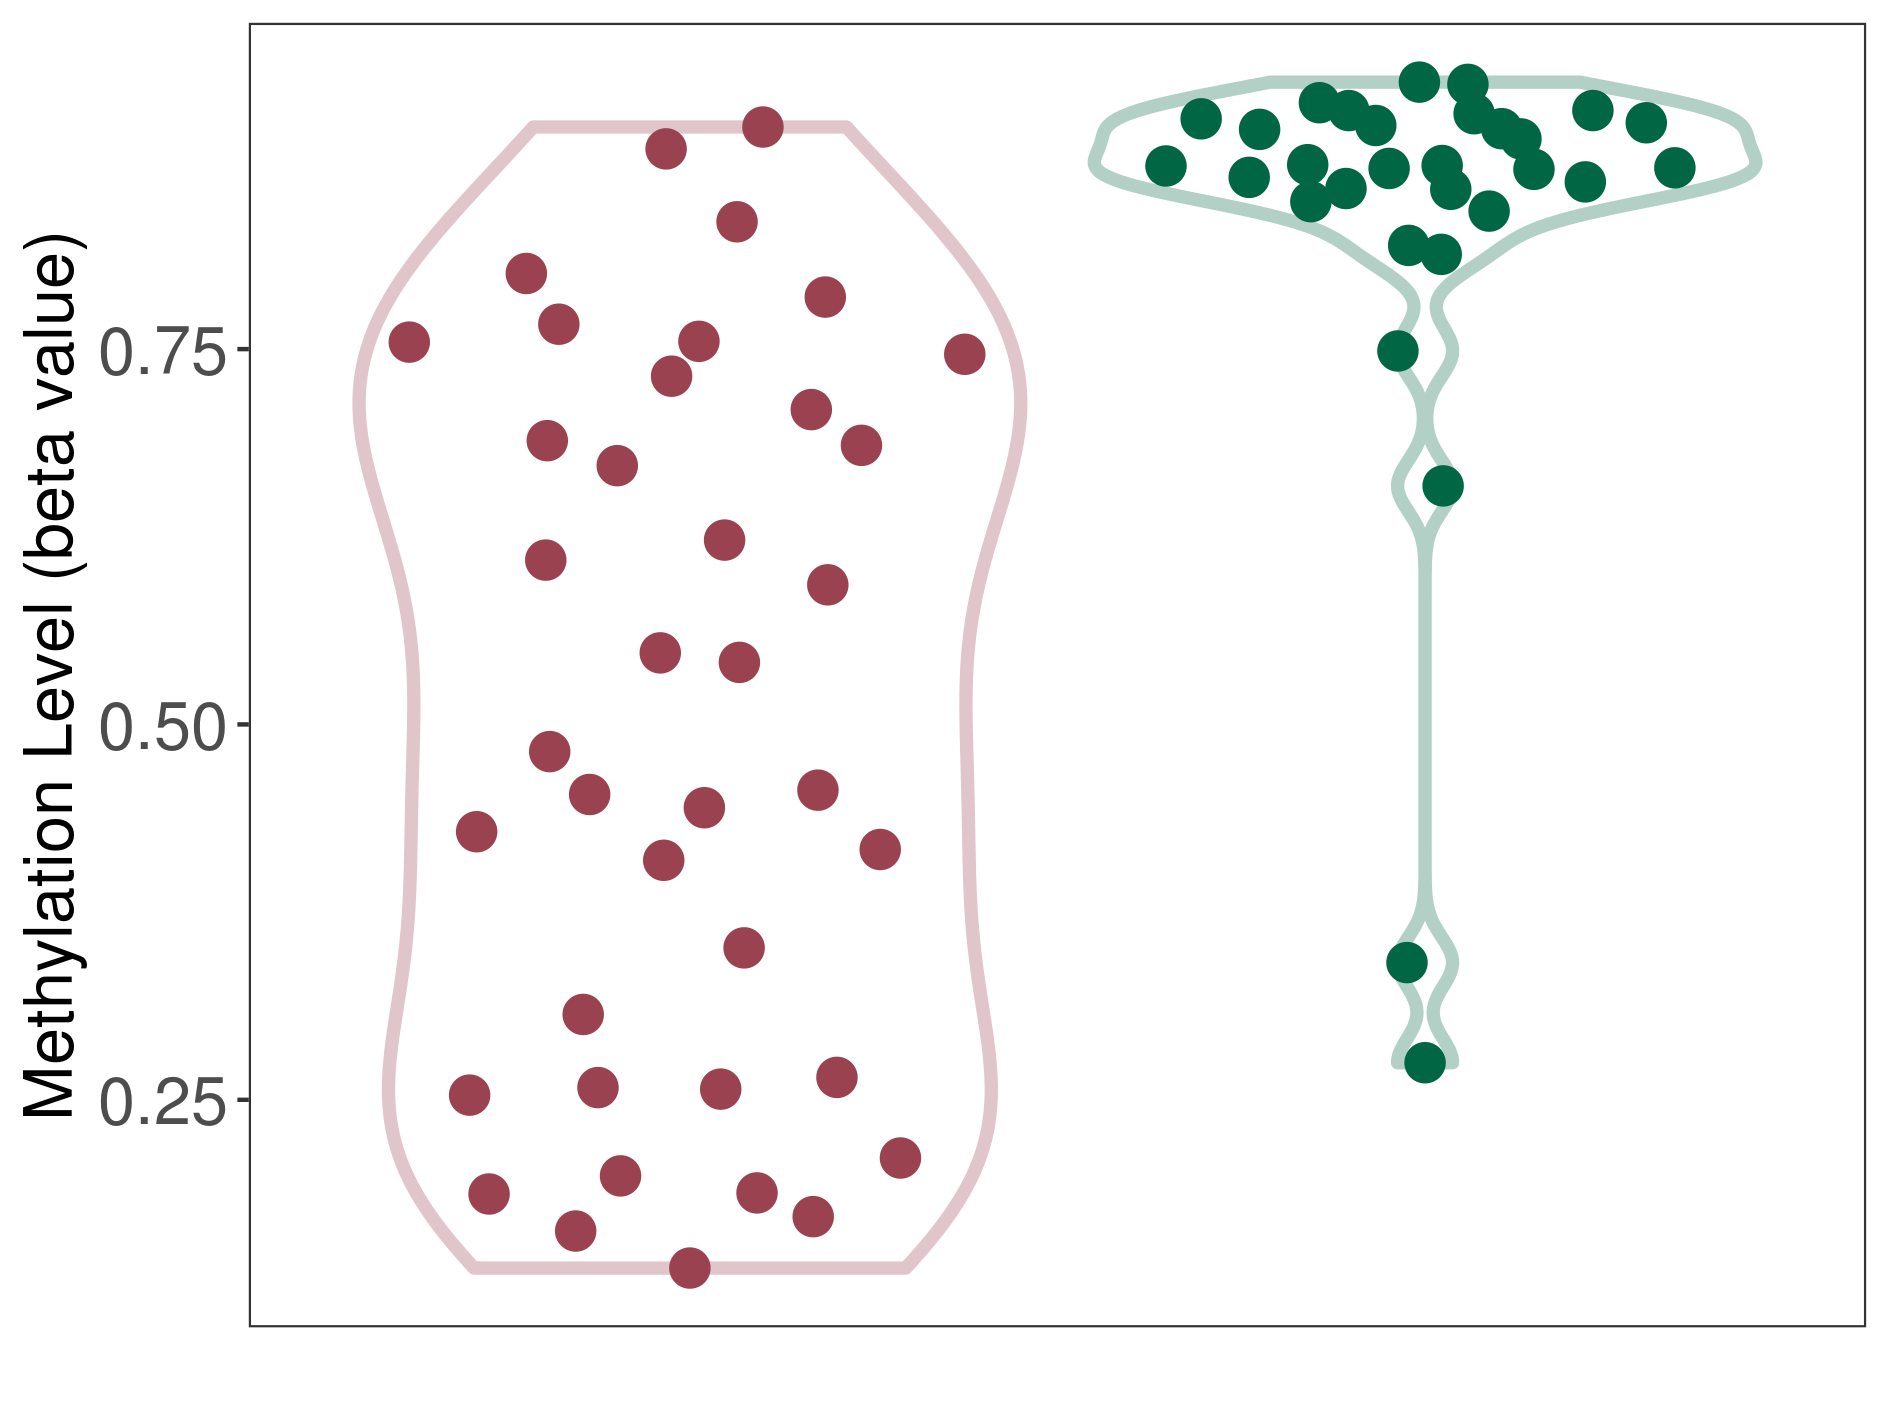
| ICD-11: 2A00 Brain cancer | Click to Show/Hide the Full List of HOSPPI: 1 HOSPPI | ||||
| DNA methylation | |||||
| DNA methyltransferase (DNMT) | Brain neuroblastoma | Significant hypomethylation | |||
| Interaction Name | DNMT-MMEL1 interaction | ||||
| The Methylation Level of Disease Section Compare with the Healthy Individual Tissue | Significant hypomethylation p-value: 9.47E-11; delta-beta: -3.17E-01 | ||||
| Description | DNA methyltransferase (DNMT) is reported to significantly hypo-methylate the MMEL1 gene, which leads to a significantly increased expression of the drug-metabolizing enzyme Metallo-endopeptidase-like 1. As a result, the interaction between DNMT and MMEL1 can significantly affect the drug-metabolizing process of Metallo-endopeptidase-like 1. | ||||
|
DME methylation in the diseased tissue of patients
DME methylation in the normal tissue of healthy individuals
|
|||||
| Violin Diagram of DME Disease-specific Methylation Level |
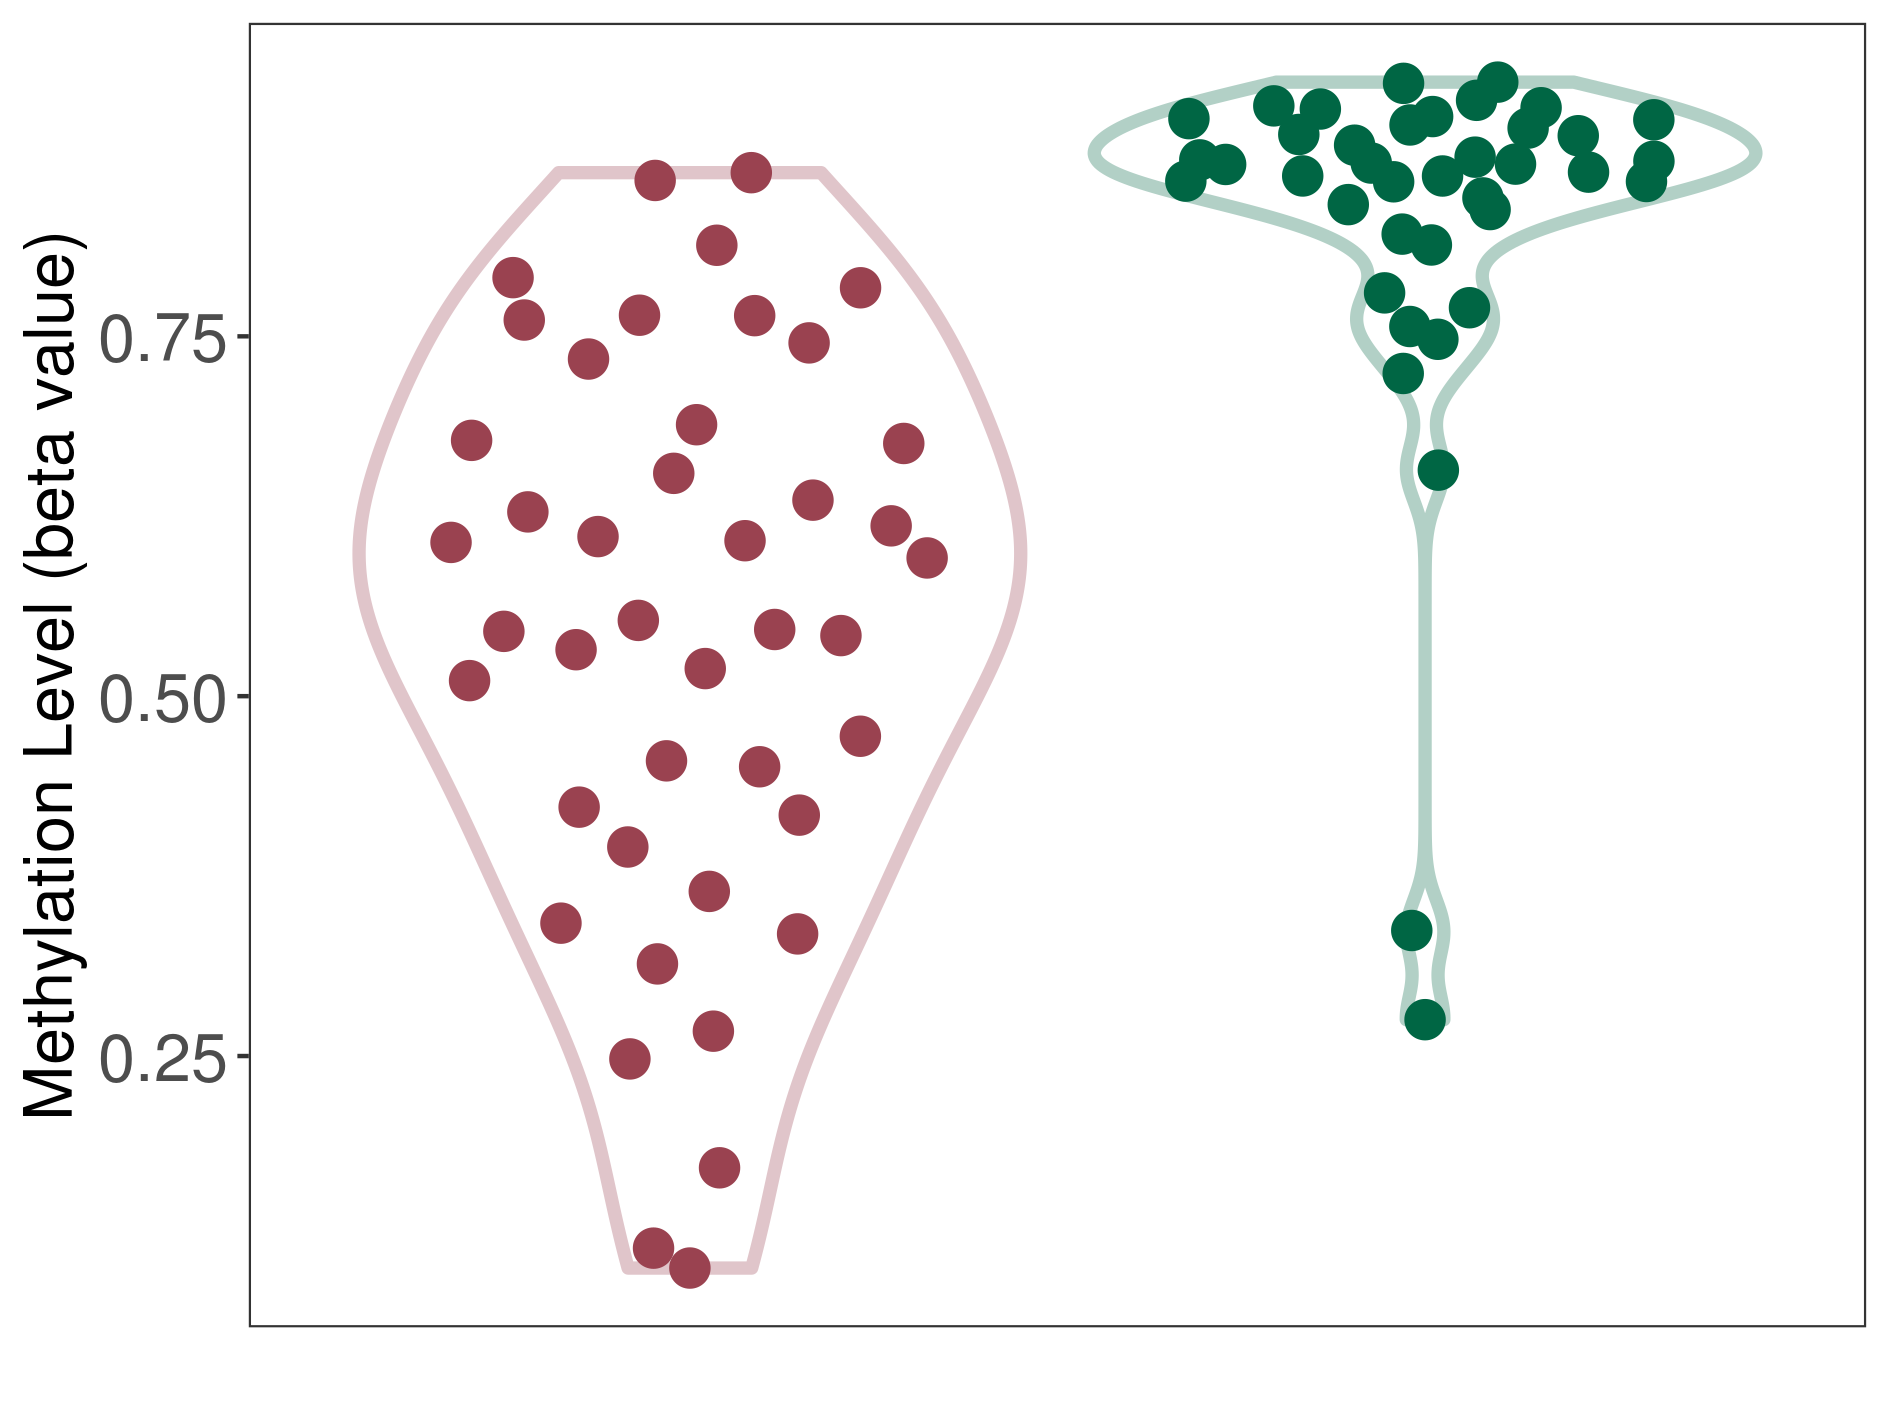
|
Click to View the Clearer Original Diagram | |||
| ICD-11: 2B30 Lymphoma | Click to Show/Hide the Full List of HOSPPI: 1 HOSPPI | ||||
| DNA methylation | |||||
| DNA methyltransferase (DNMT) | Lymphoma | Significant hypomethylation | |||
| Interaction Name | DNMT-MMEL1 interaction | ||||
| The Methylation Level of Disease Section Compare with the Healthy Individual Tissue | Significant hypomethylation p-value: 1.50E-16; delta-beta: -5.57E-01 | ||||
| Description | DNA methyltransferase (DNMT) is reported to significantly hypo-methylate the MMEL1 gene, which leads to a significantly increased expression of the drug-metabolizing enzyme Metallo-endopeptidase-like 1. As a result, the interaction between DNMT and MMEL1 can significantly affect the drug-metabolizing process of Metallo-endopeptidase-like 1. | ||||
|
DME methylation in the diseased tissue of patients
DME methylation in the normal tissue of healthy individuals
|
|||||
| Violin Diagram of DME Disease-specific Methylation Level |
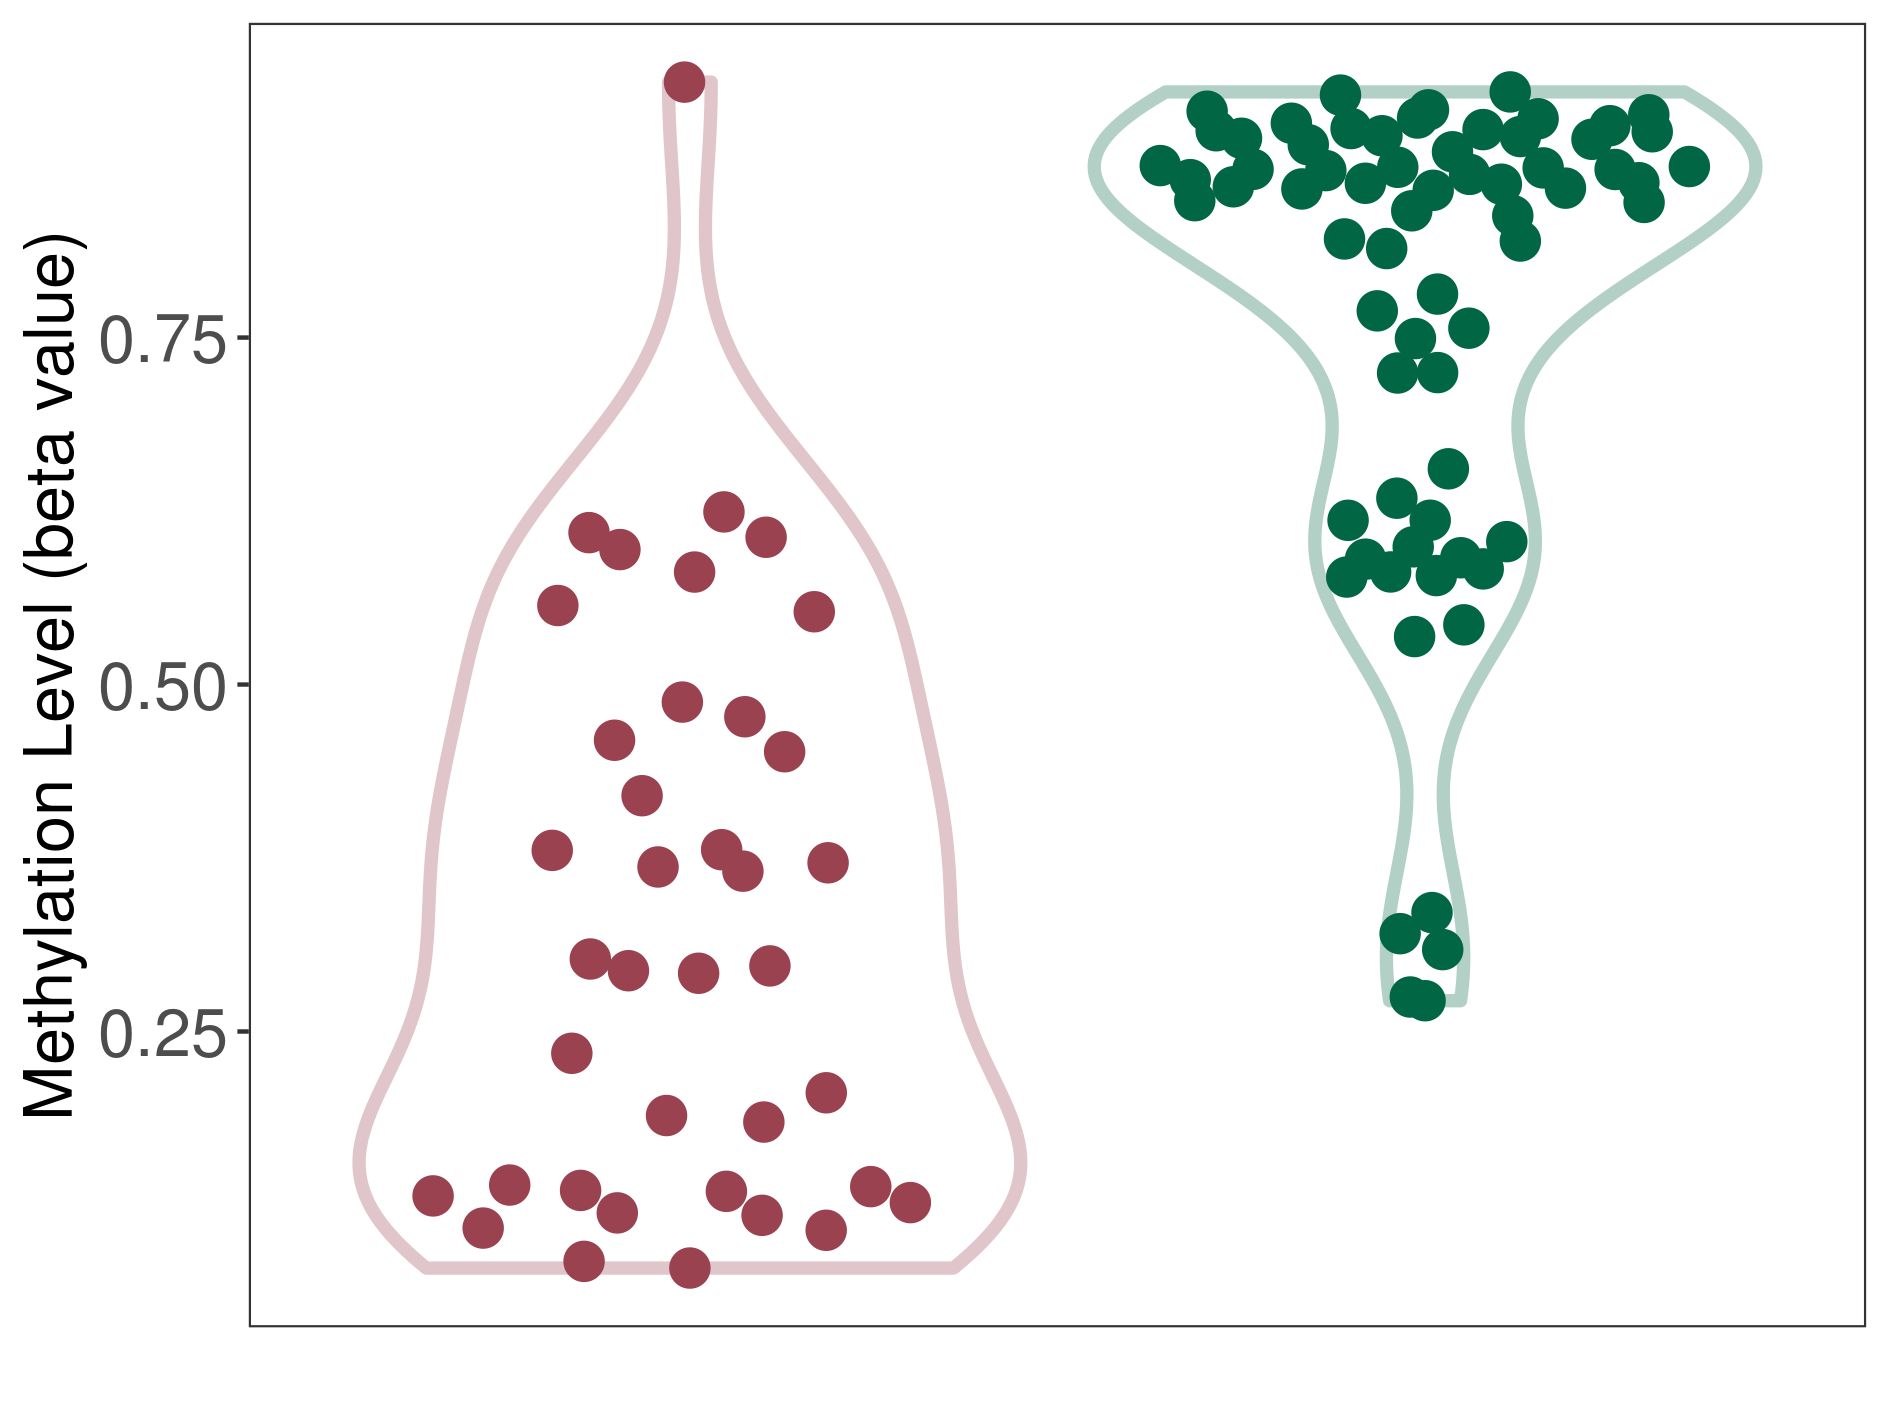
|
Click to View the Clearer Original Diagram | |||
| ICD-11: 2C12 Liver cancer | Click to Show/Hide the Full List of HOSPPI: 1 HOSPPI | ||||
| DNA methylation | |||||
| DNA methyltransferase (DNMT) | Liver cancer | Moderate hypomethylation | |||
| Interaction Name | DNMT-MMEL1 interaction | ||||
| The Methylation Level of Disease Section Compare with the Healthy Individual Tissue | Moderate hypomethylation p-value: 1.58E-04; delta-beta: -2.69E-01 | ||||
| Description | DNA methyltransferase (DNMT) is reported to moderatly hypo-methylate the MMEL1 gene, which leads to a moderatly increased expression of the drug-metabolizing enzyme Metallo-endopeptidase-like 1. As a result, the interaction between DNMT and MMEL1 can moderatly affect the drug-metabolizing process of Metallo-endopeptidase-like 1. | ||||
| The Methylation Level of Disease Section Compare with the Adjacent Tissue | Moderate hypomethylation p-value: 4.58E-13; delta-beta: -2.81E-01 | ||||
| Description | DNA methyltransferase (DNMT) is reported to moderatly hypo-methylate the MMEL1 gene, which leads to a moderatly increased expression of the drug-metabolizing enzyme Metallo-endopeptidase-like 1. As a result, the interaction between DNMT and MMEL1 can moderatly affect the drug-metabolizing process of Metallo-endopeptidase-like 1. | ||||
|
DME methylation in the diseased tissue of patients
DME methylation in the normal tissue adjacent to the diseased tissue of patients
DME methylation in the normal tissue of healthy individuals
DME methylation in tissue other than the diseased tissue of patients
|
|||||
| Violin Diagram of DME Disease-specific Methylation Level |
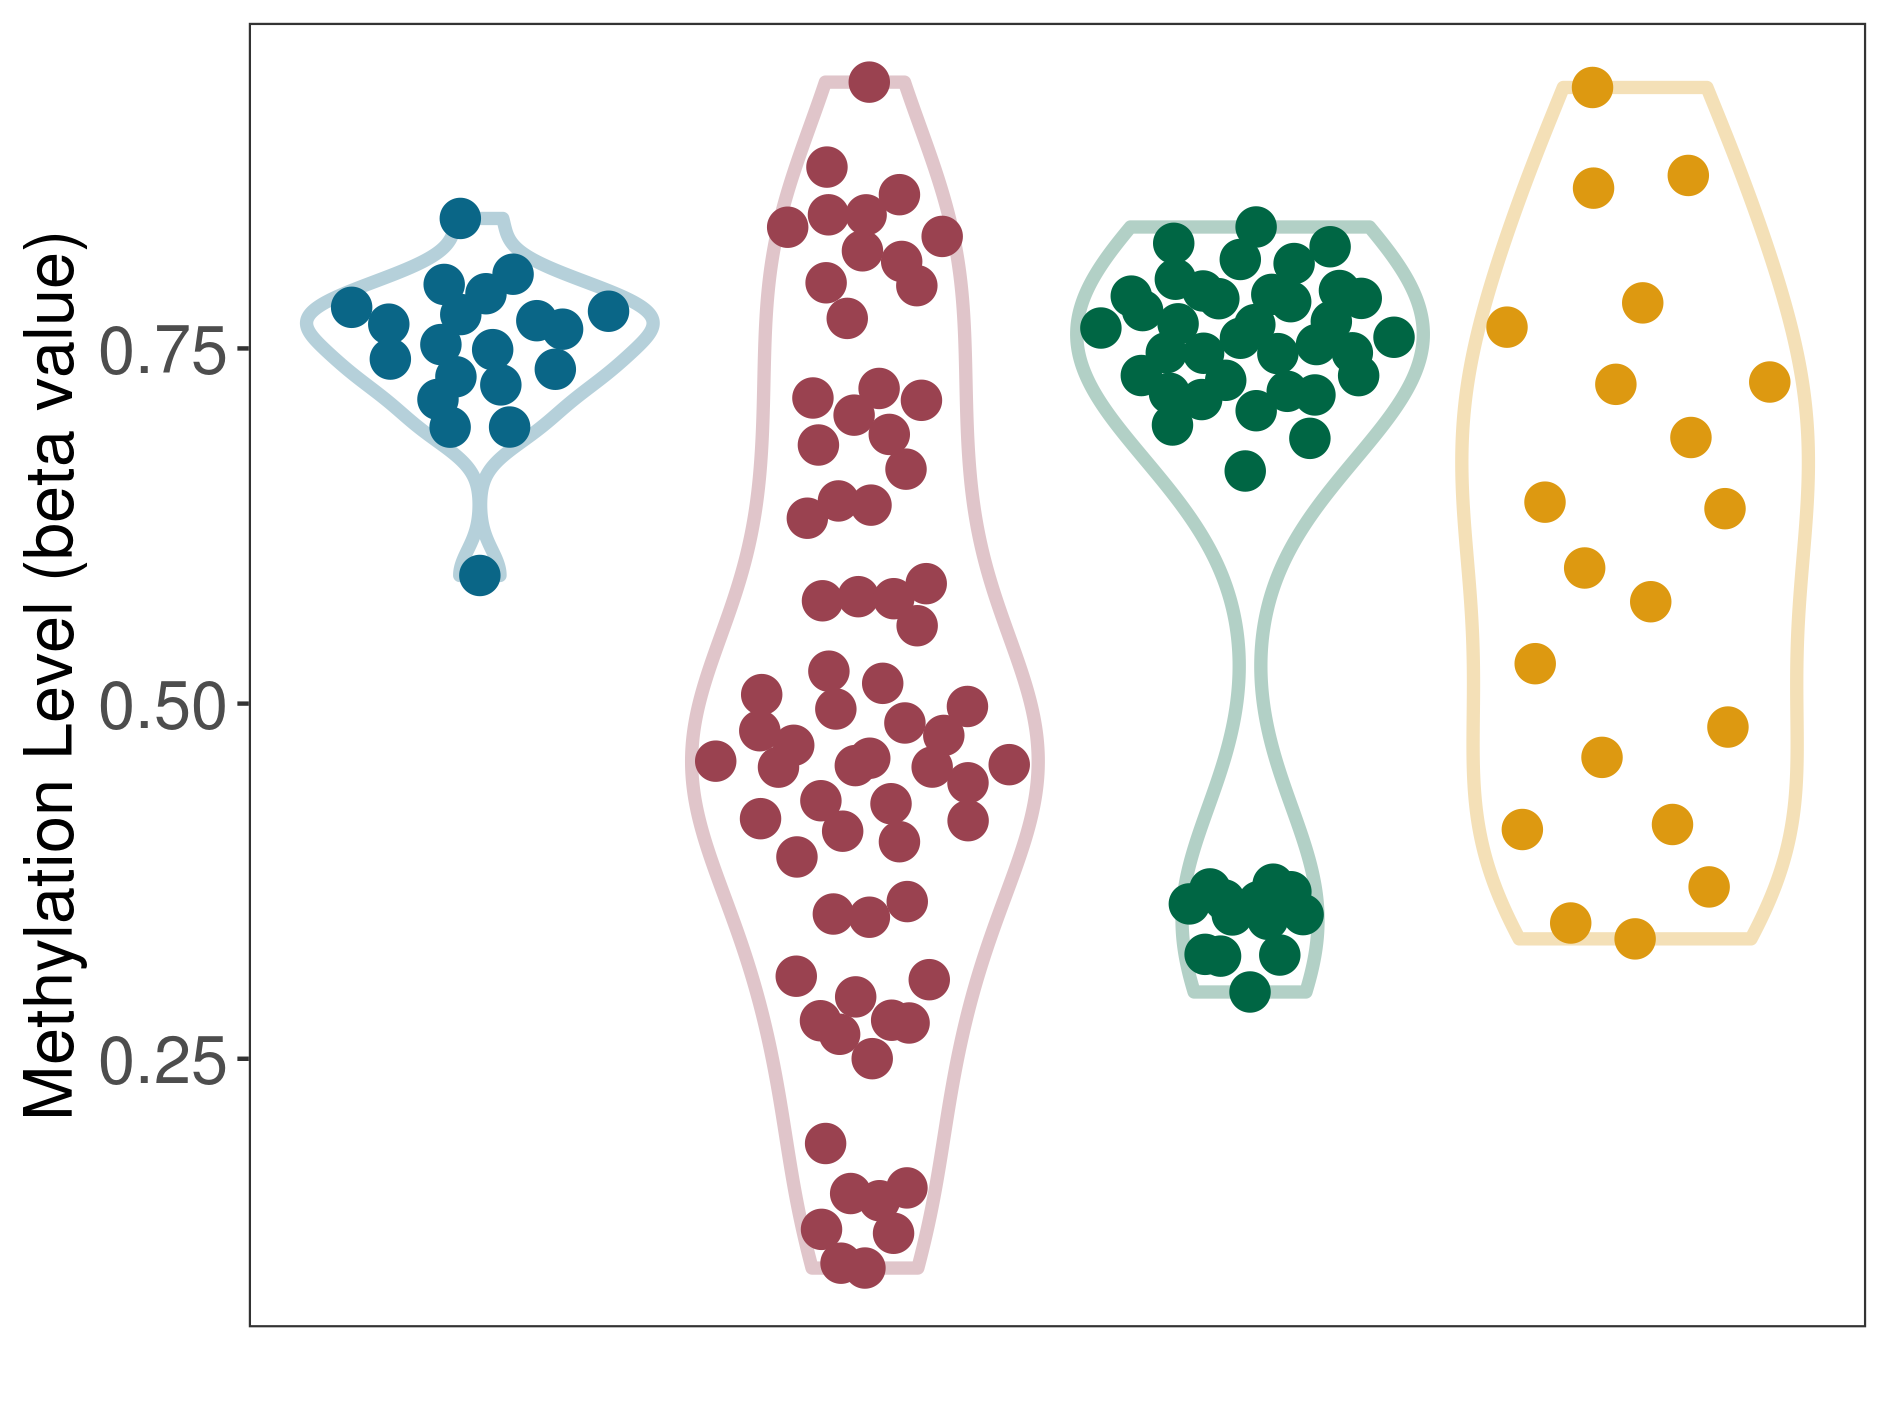
|
Click to View the Clearer Original Diagram | |||
| ICD-11: 2C90 Renal cell carcinoma | Click to Show/Hide the Full List of HOSPPI: 1 HOSPPI | ||||
| DNA methylation | |||||
| DNA methyltransferase (DNMT) | Renal cell carcinoma | Significant hypermethylation | |||
| Interaction Name | DNMT-MMEL1 interaction | ||||
| The Methylation Level of Disease Section Compare with the Other Disease Section | Significant hypermethylation p-value: 1.74E-02; delta-beta: 4.18E-02 | ||||
| Description | DNA methyltransferase (DNMT) is reported to significantly hyper-methylate the MMEL1 gene, which leads to a significantly decreased expression of the drug-metabolizing enzyme Metallo-endopeptidase-like 1. As a result, the interaction between DNMT and MMEL1 can significantly affect the drug-metabolizing process of Metallo-endopeptidase-like 1. | ||||
|
DME methylation in the diseased tissue of patients
DME methylation in the normal tissue of healthy individuals
DME methylation in tissue other than the diseased tissue of patients
|
|||||
| Violin Diagram of DME Disease-specific Methylation Level |
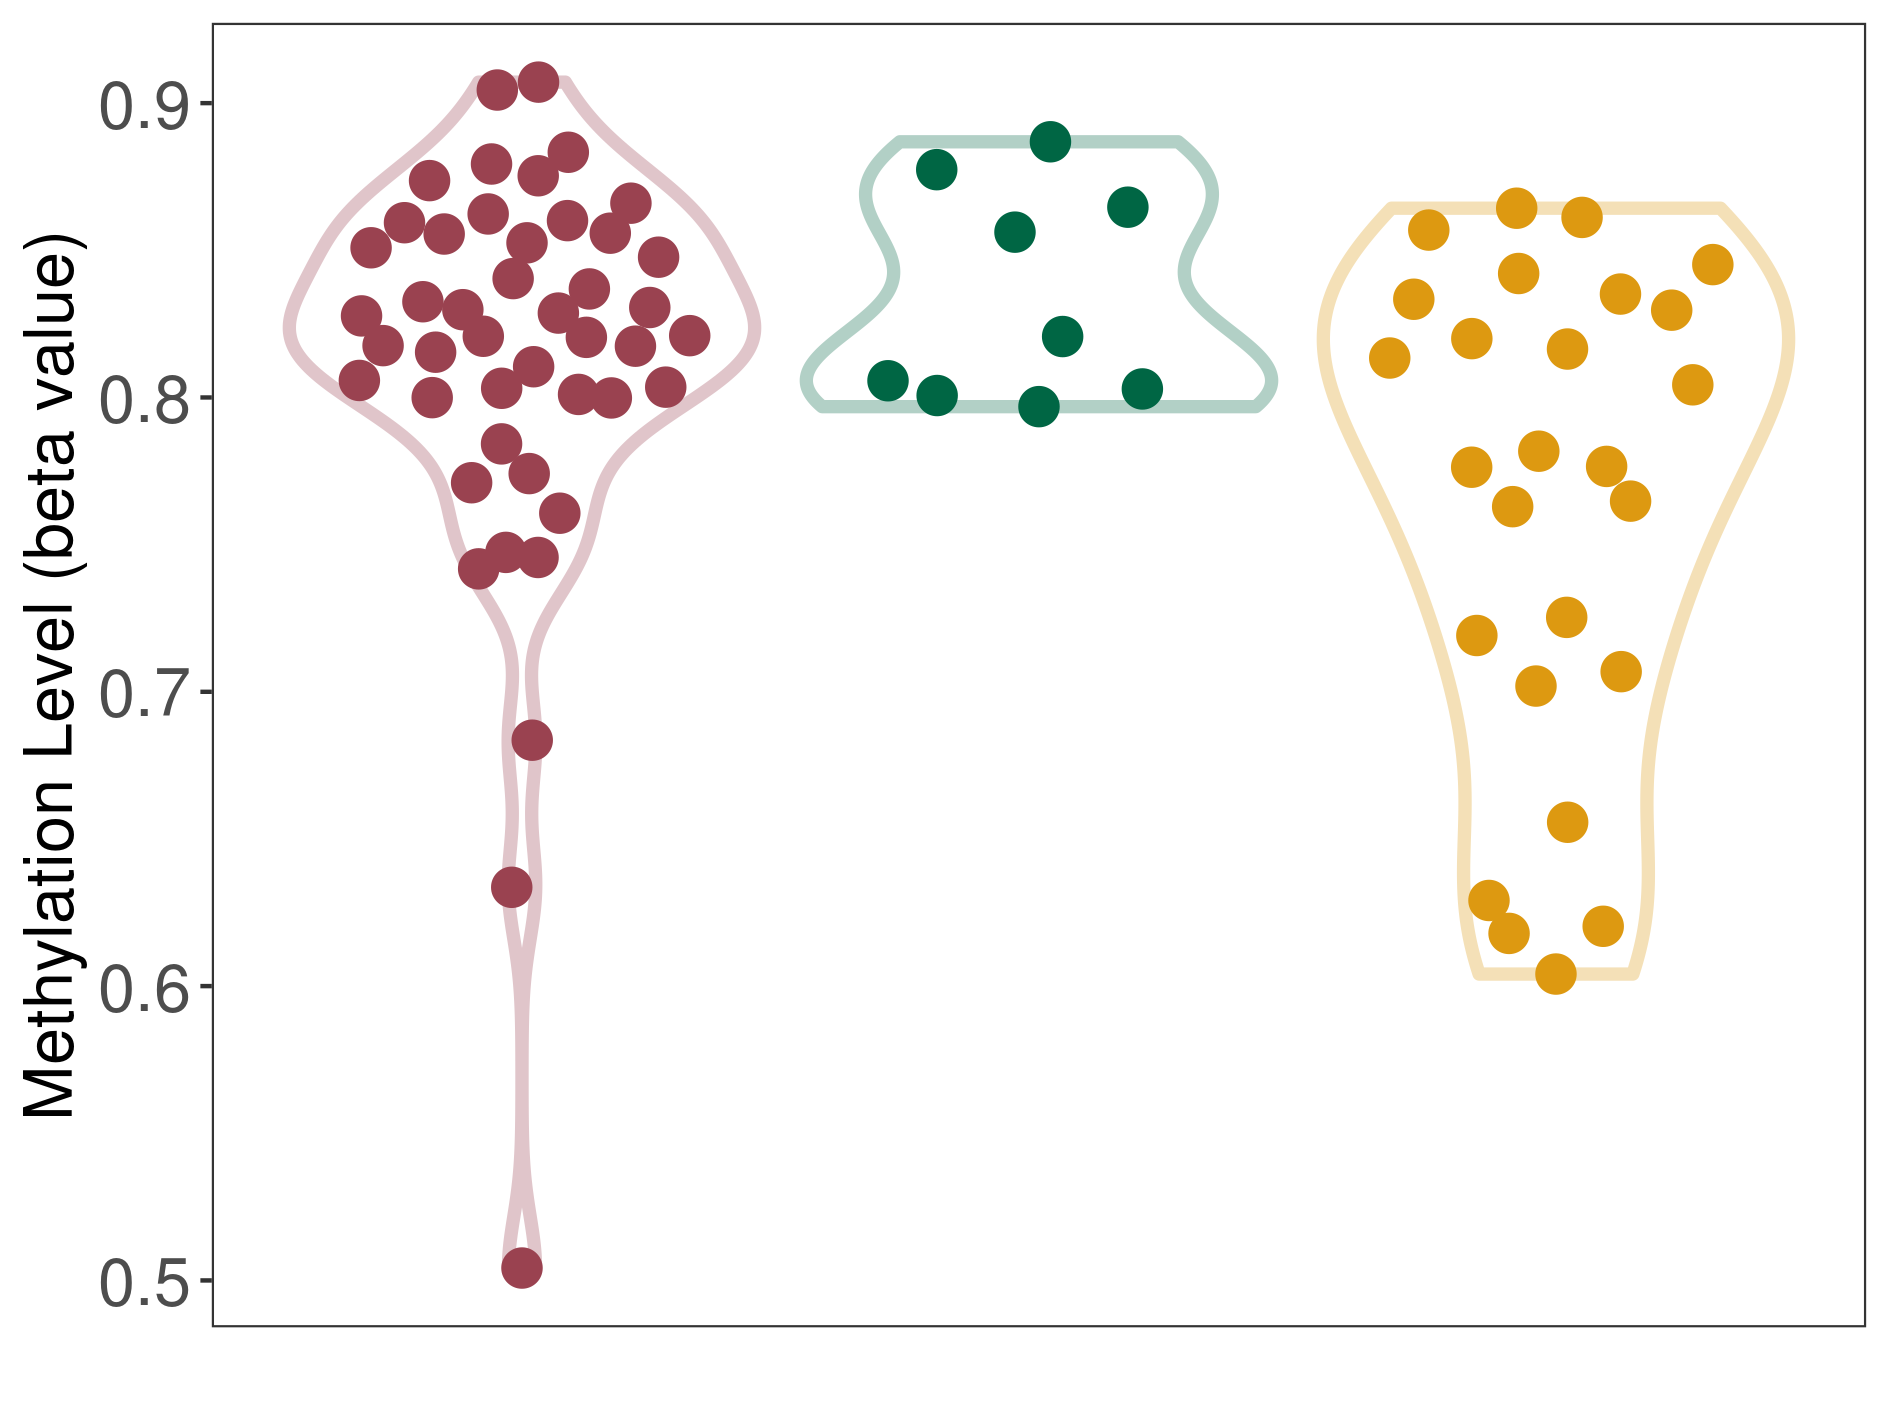
|
Click to View the Clearer Original Diagram | |||
| ICD-11: 2D50 Brain cancer metastasis | Click to Show/Hide the Full List of HOSPPI: 1 HOSPPI | ||||
| DNA methylation | |||||
| DNA methyltransferase (DNMT) | Esthesioneuroblastoma | Significant hypomethylation | |||
| Interaction Name | DNMT-MMEL1 interaction | ||||
| The Methylation Level of Disease Section Compare with the Healthy Individual Tissue | Significant hypomethylation p-value: 2.31E-09; delta-beta: -3.89E-01 | ||||
| Description | DNA methyltransferase (DNMT) is reported to significantly hypo-methylate the MMEL1 gene, which leads to a significantly increased expression of the drug-metabolizing enzyme Metallo-endopeptidase-like 1. As a result, the interaction between DNMT and MMEL1 can significantly affect the drug-metabolizing process of Metallo-endopeptidase-like 1. | ||||
|
DME methylation in the diseased tissue of patients
DME methylation in the normal tissue of healthy individuals
|
|||||
| Violin Diagram of DME Disease-specific Methylation Level |
|
Click to View the Clearer Original Diagram | |||
If you find any error in data or bug in web service, please kindly report it to Dr. Yin and Dr. Li.