

Details of Drug-Metabolizing Enzyme (DME)
| Full List of Drug(s) Metabolized by This DME | |||||
|---|---|---|---|---|---|
| Drugs Approved by FDA | Click to Show/Hide the Full List of Drugs: 6 Drugs | ||||
Tamoxifen citrate |
Drug Info | Approved | Breast cancer | ICD11: 2C60 | [1] |
Lorcaserin |
Drug Info | Approved | Obesity | ICD11: 5B81 | [2] |
Olopatadine |
Drug Info | Approved | Conjunctivitis | ICD11: 9A60 | [3] |
Vandetanib |
Drug Info | Approved | Thyroid cancer | ICD11: 2D10 | [4] |
Risdiplam |
Drug Info | Approved | Muscular atrophy | ICD11: 8B61 | [5] |
Risdiplam |
Drug Info | Approved | Muscular atrophy | ICD11: 8B61 | [6] |
| Drugs in Phase 4 Clinical Trial | Click to Show/Hide the Full List of Drugs: 2 Drugs | ||||
Dapoxetine |
Drug Info | Phase 4 | Ejaculatory dysfunction | ICD11: HA03 | [7] |
Propiverine |
Drug Info | Phase 4 | Overactive bladder | ICD11: GC50 | [8] |
| Drugs in Phase 3 Clinical Trial | Click to Show/Hide the Full List of Drugs: 1 Drugs | ||||
AZD-2171 |
Drug Info | Phase 3 | Lung cancer | ICD11: 2C25 | [9] |
| Drugs in Phase 2 Clinical Trial | Click to Show/Hide the Full List of Drugs: 2 Drugs | ||||
ABT-126 |
Drug Info | Phase 2 | Alzheimer disease | ICD11: 8A20 | [10] |
RG-7916 |
Drug Info | Phase 2 | Muscular atrophy | ICD11: 8B61 | |
| Drugs in Phase 1 Clinical Trial | Click to Show/Hide the Full List of Drugs: 2 Drugs | ||||
CB-3304 |
Drug Info | Phase 1/2 | Chronic lymphocytic leukaemia | ICD11: 2A82 | [11] |
MP-513 |
Drug Info | Phase 1 | Diabetes mellitus | ICD11: 5A10 | [12], [13] |
| Discontinued/withdrawn Drugs | Click to Show/Hide the Full List of Drugs: 4 Drugs | ||||
AZD0328 |
Drug Info | Discontinued in Phase 2 | Alzheimer disease | ICD11: 8A20 | [14] |
Geldanamycin |
Drug Info | Discontinued in Phase 2 | Renal cell carcinoma | ICD11: 2C90 | [15] |
CAM-2028 |
Drug Info | Discontinued | Acute nasopharyngitis | ICD11: CA00 | [16], [17] |
Nomifensine |
Drug Info | Discontinued | Depression | ICD11: 6A71 | [18] |
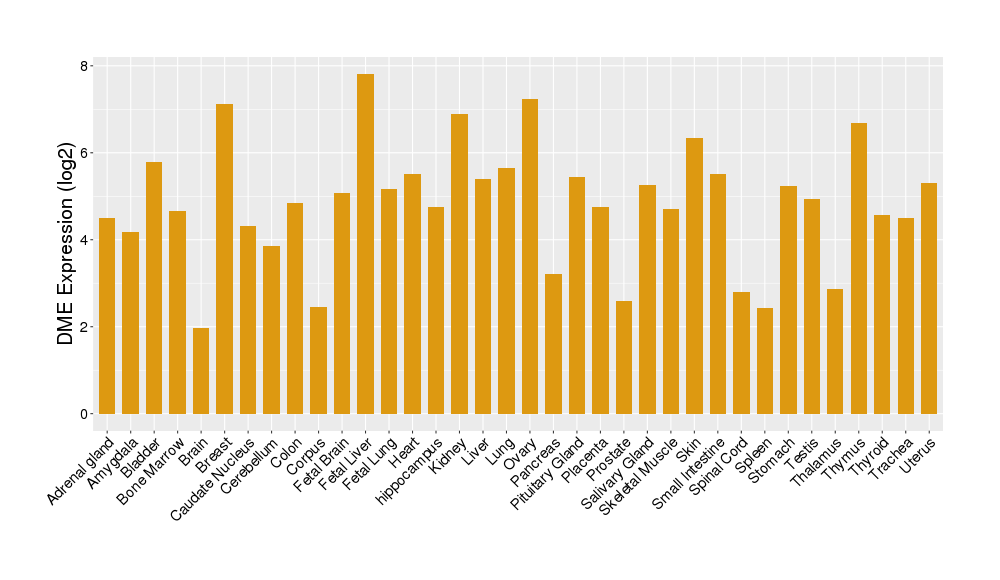
| Tissue/Disease-Specific Protein Abundances of This DME | |||||
|---|---|---|---|---|---|
| Tissue-specific Protein Abundances in Healthy Individuals | Click to Show/Hide | ||||
|
|||||
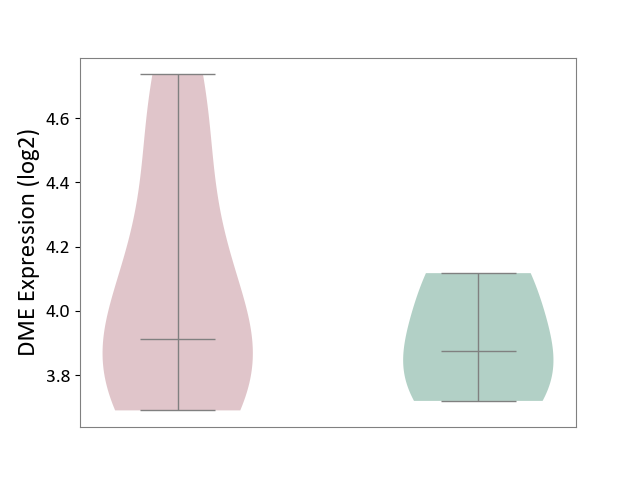
| ICD Disease Classification 01 | Infectious/parasitic disease | Click to Show/Hide | |||
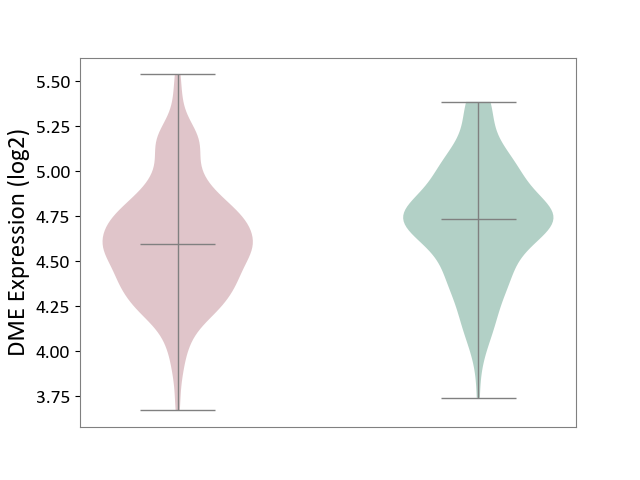
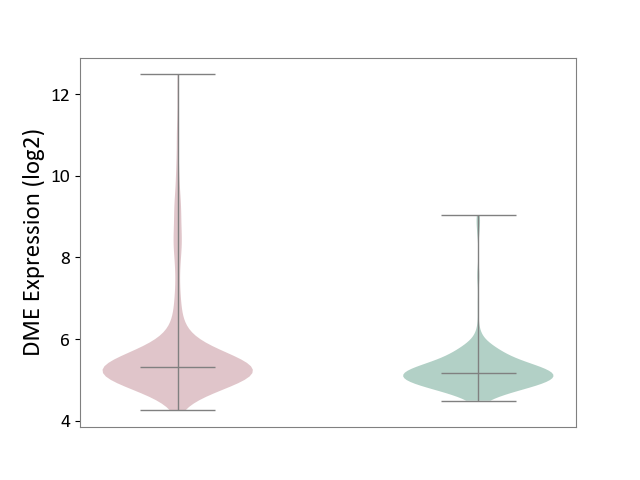
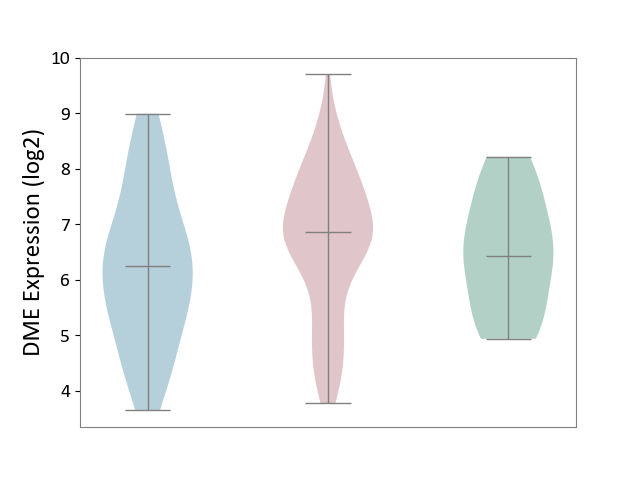
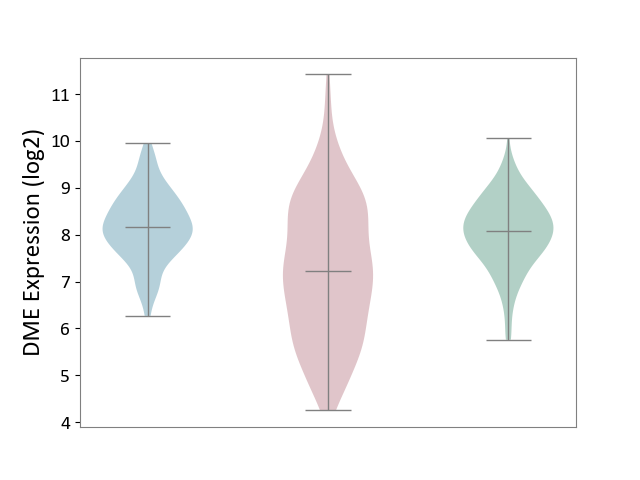
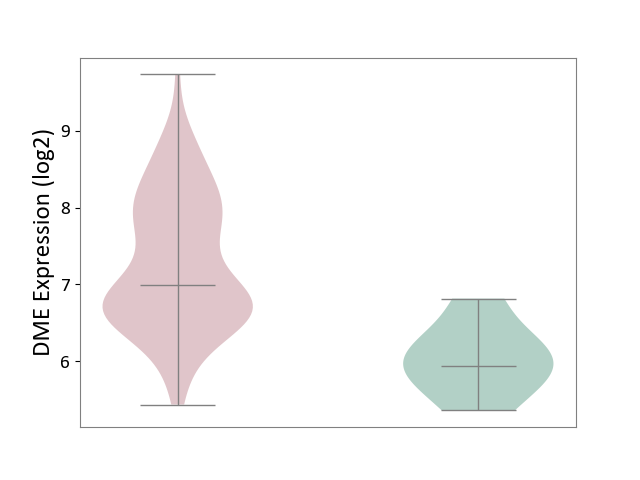
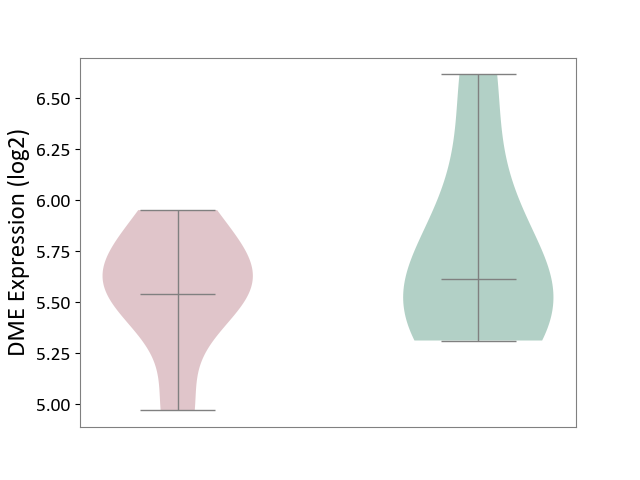
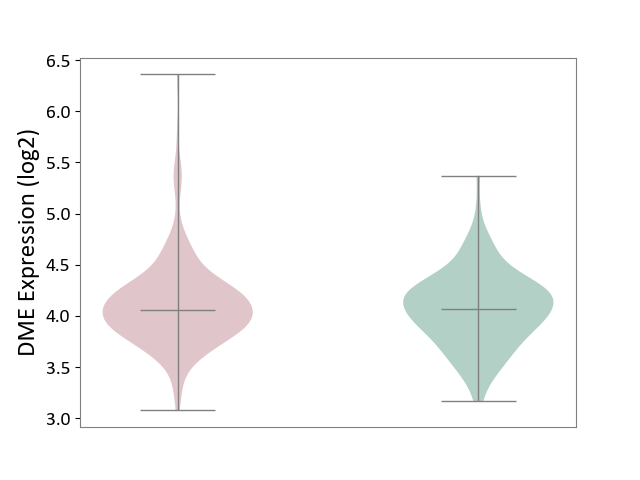
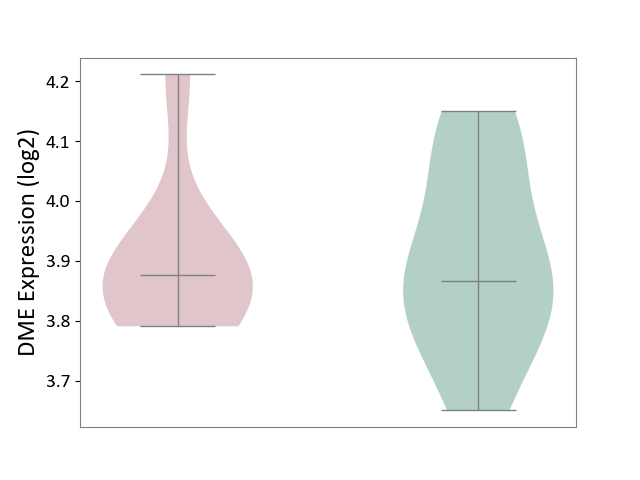
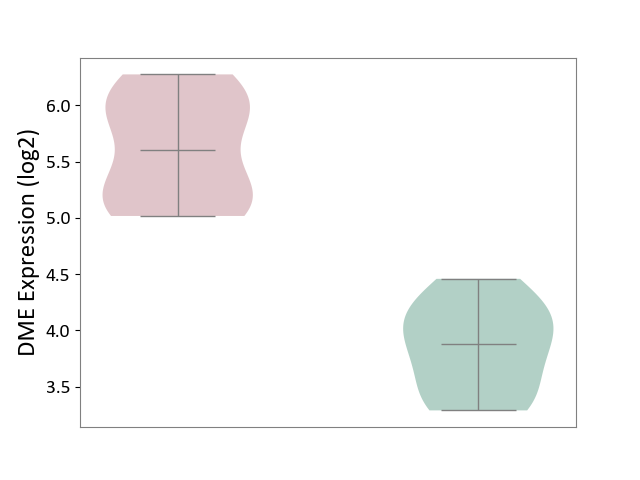
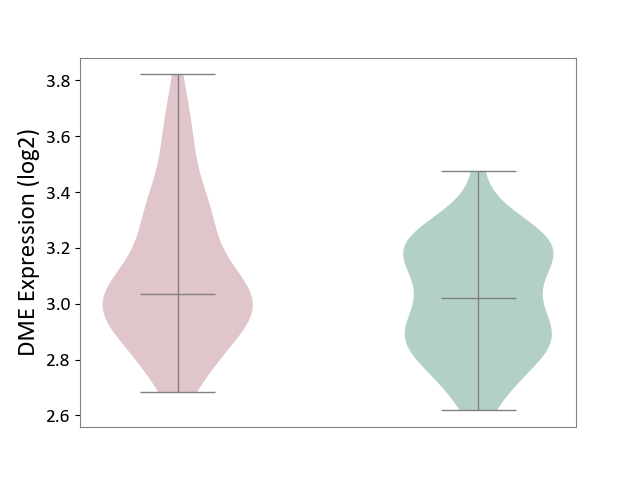
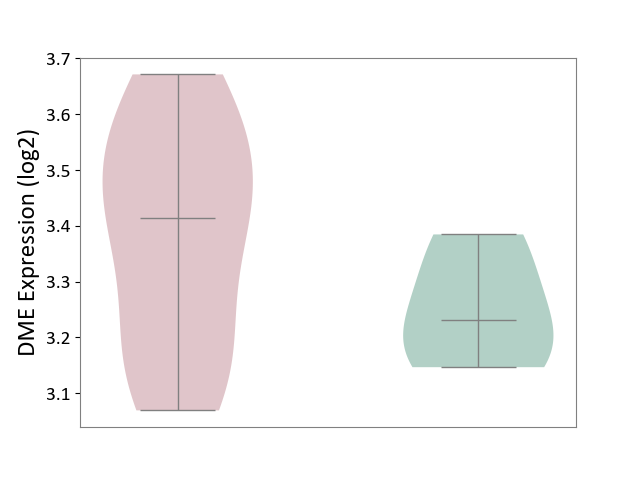
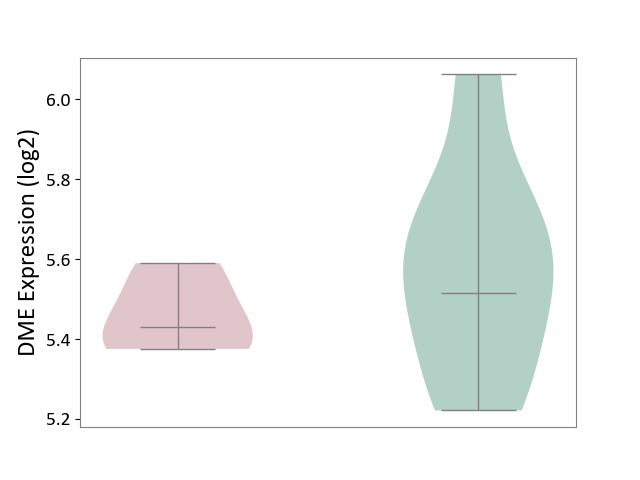
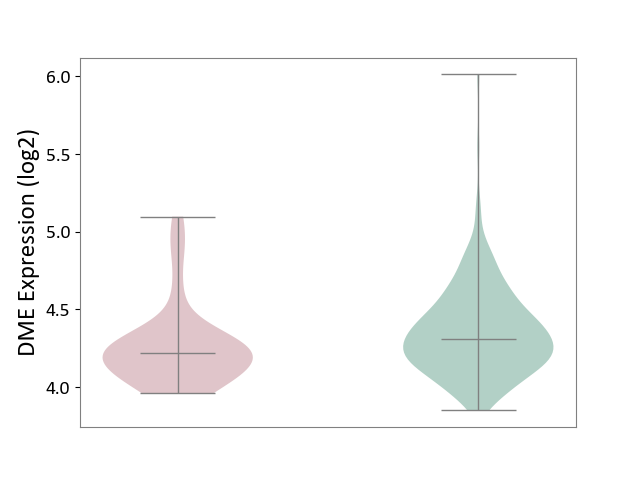
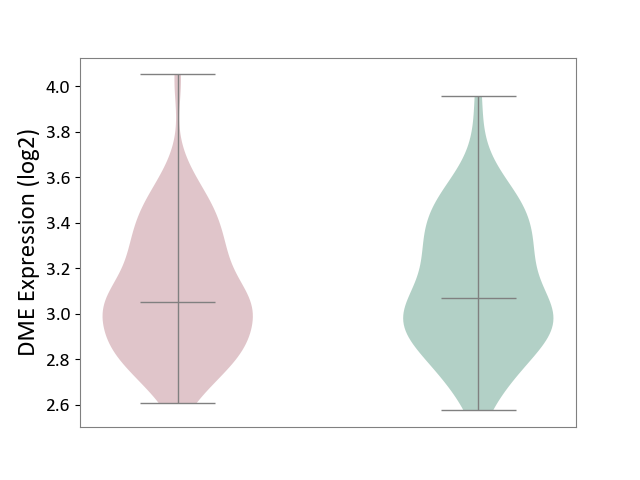
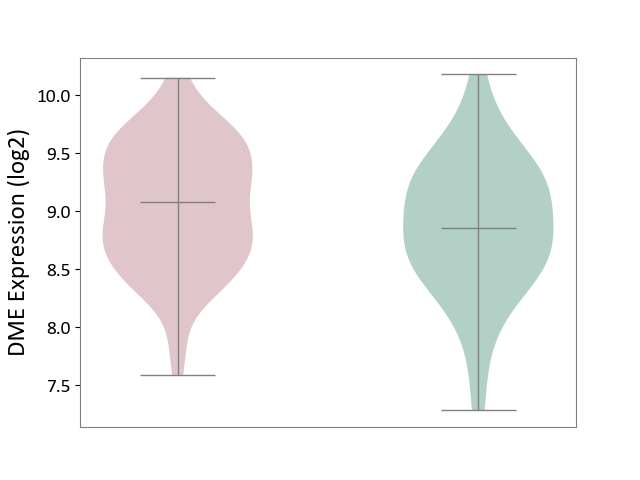
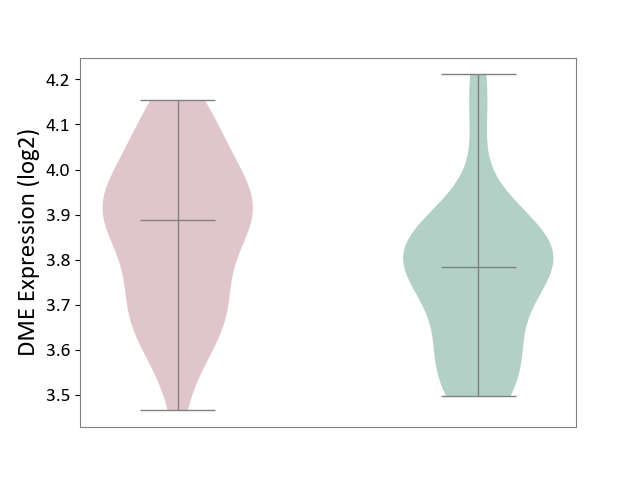
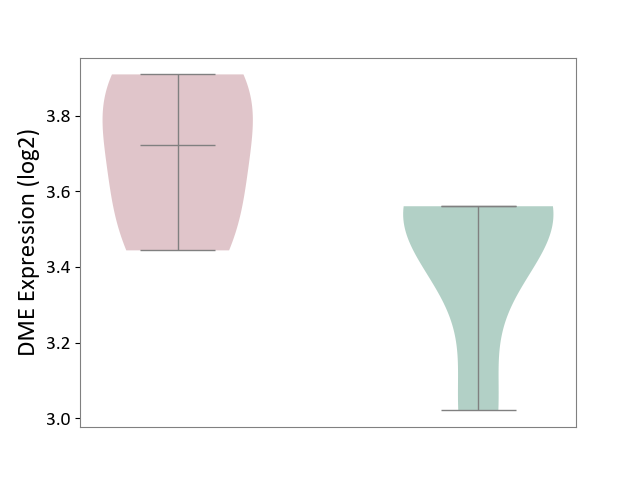
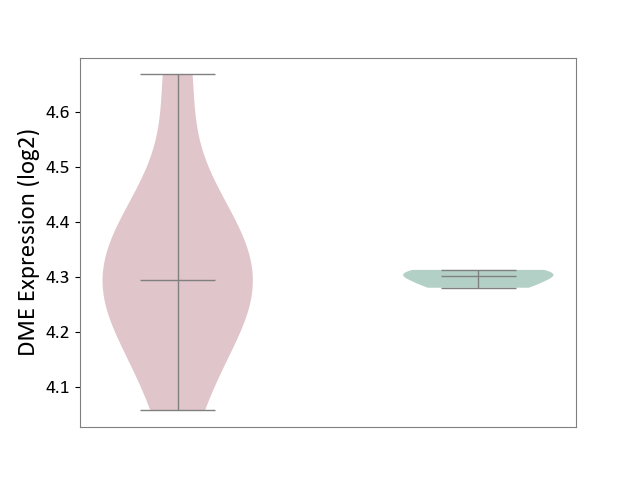
| ICD-11: 1C1H | Necrotising ulcerative gingivitis | Click to Show/Hide | |||
| The Studied Tissue | Gingival tissue | ||||
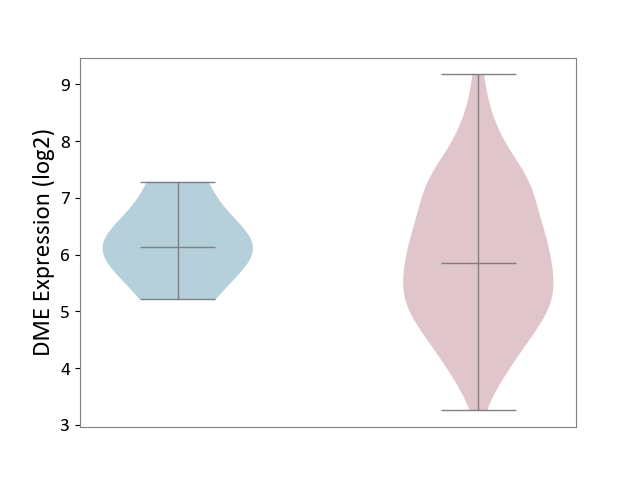
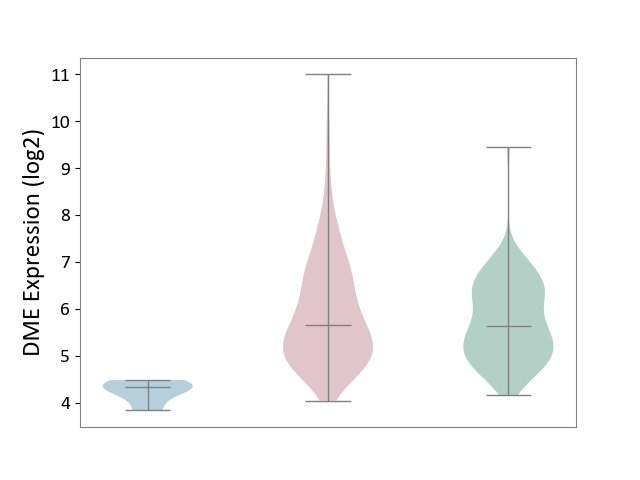
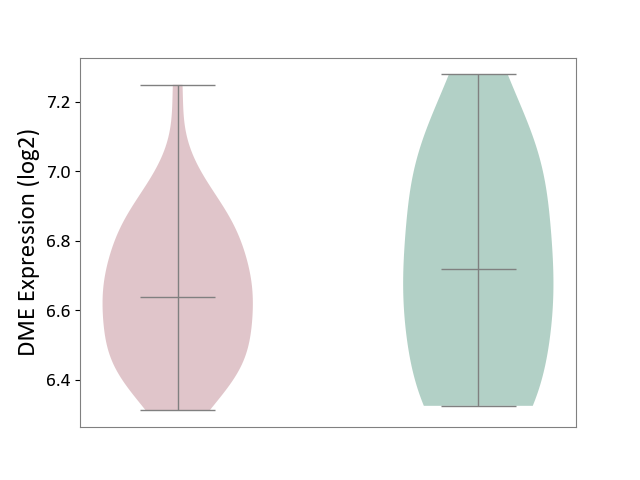
| The Specified Disease | Bacterial infection of gingival [ICD-11:1C1H] | ||||
| The Expression Level of Disease Section Compare with the Healthy Individual Tissue | p-value: 1.43E-10; Fold-change: 8.52E-01; Z-score: 1.19E+00 | ||||
|
DME expression in the diseased tissue of patients
DME expression in the normal tissue of healthy individuals
|
|||||
| Violin Diagram of DME Disease-specific Protein Abundances |
|
Click to View the Clearer Original Diagram | |||
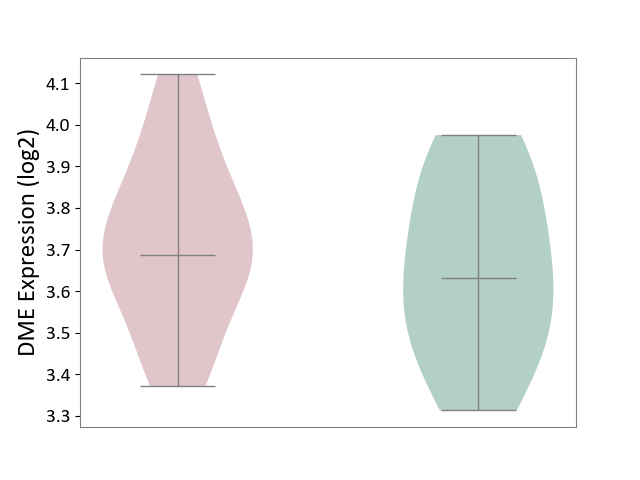
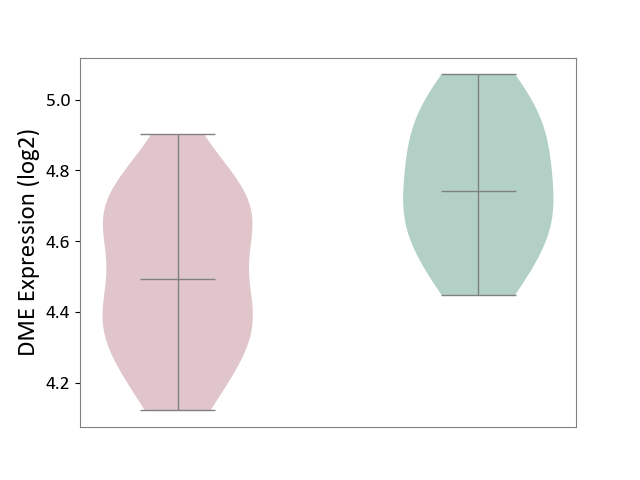
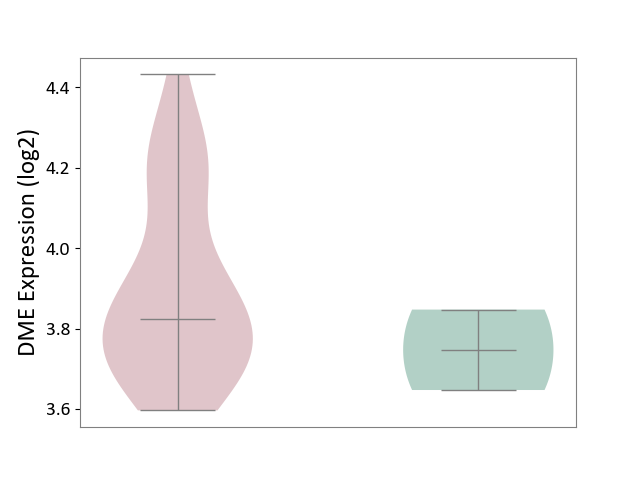
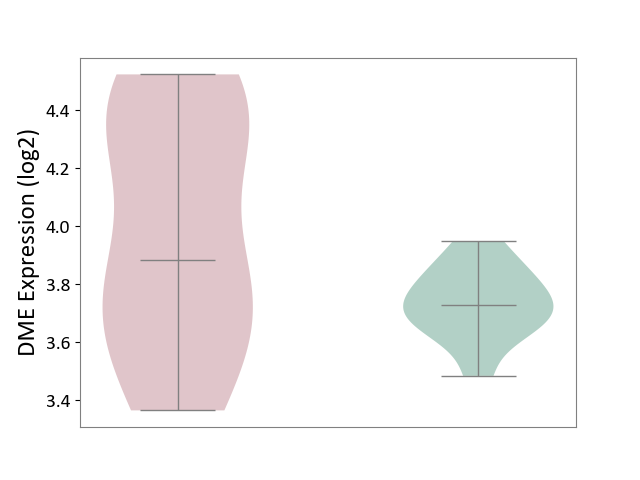
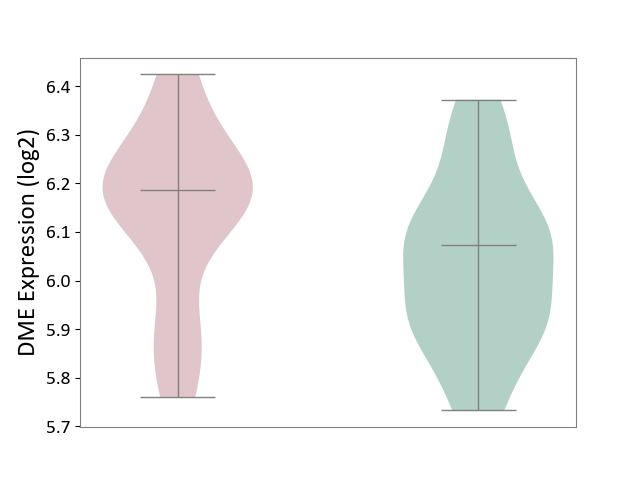
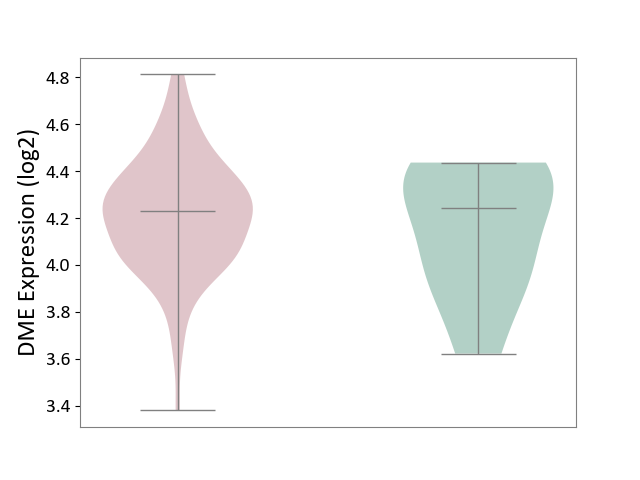
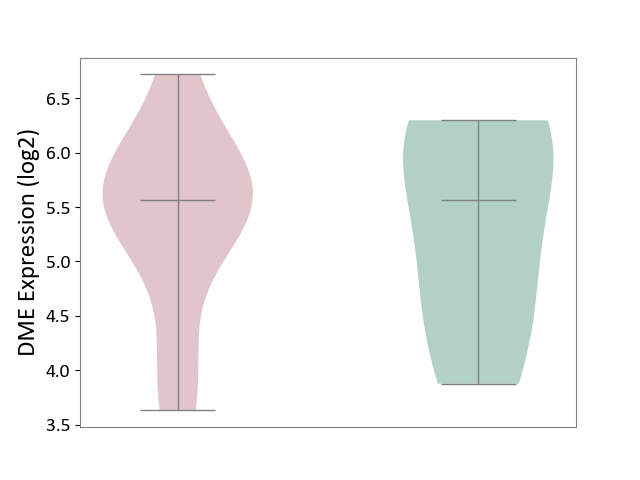
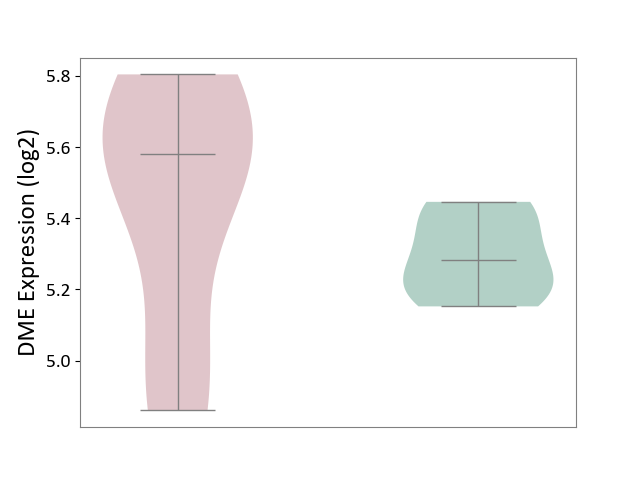
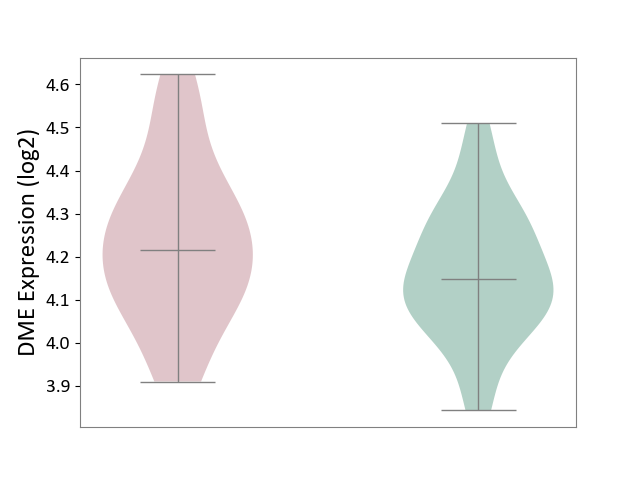
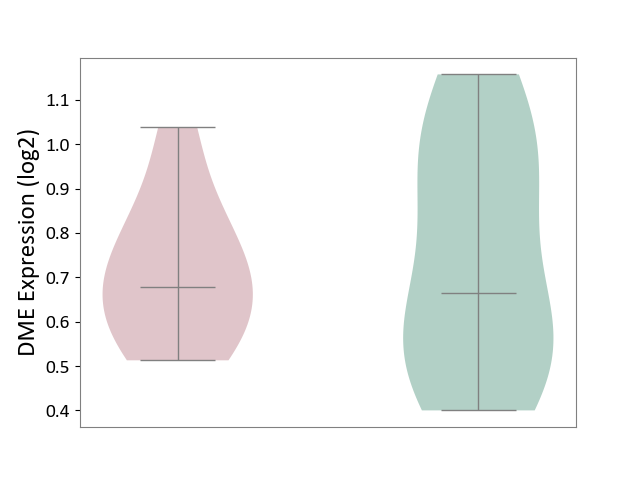
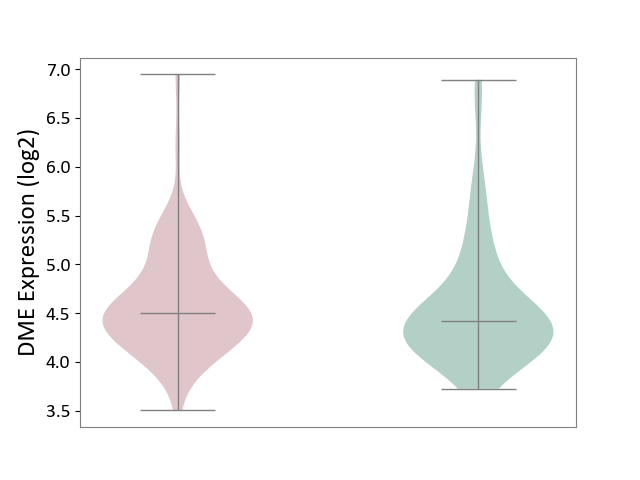
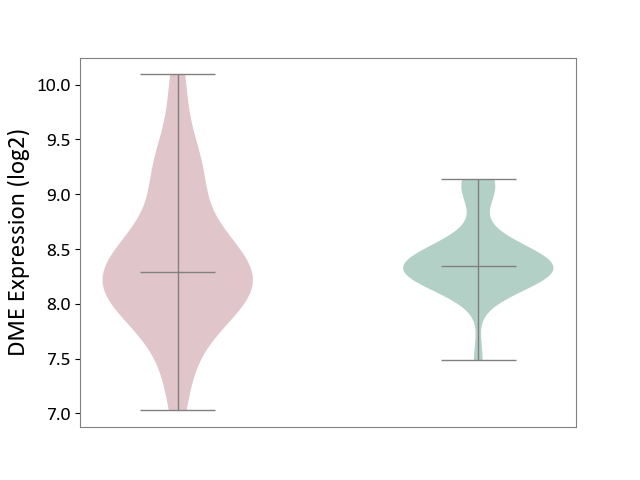
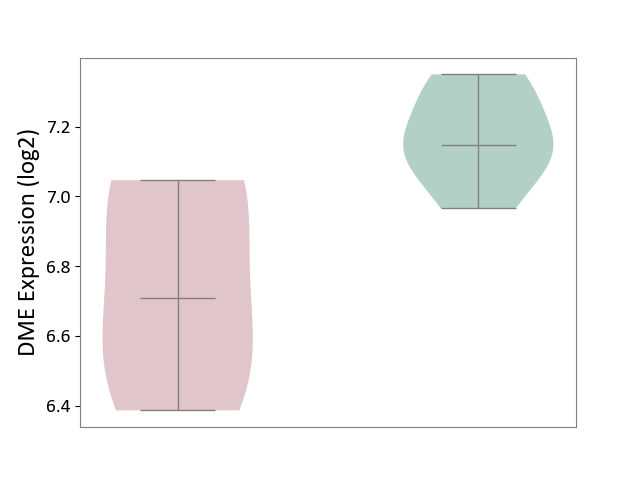
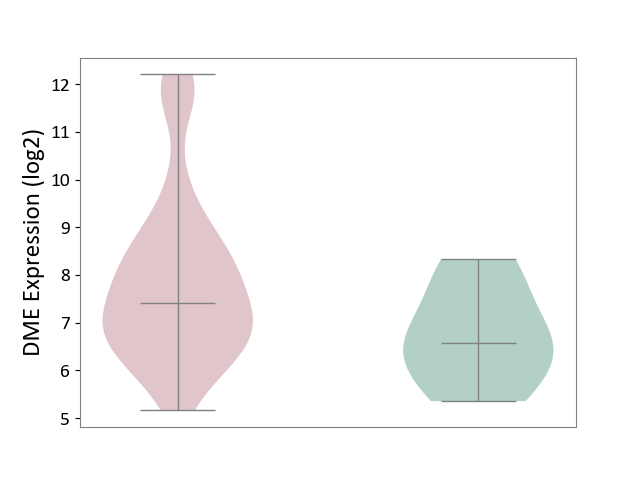
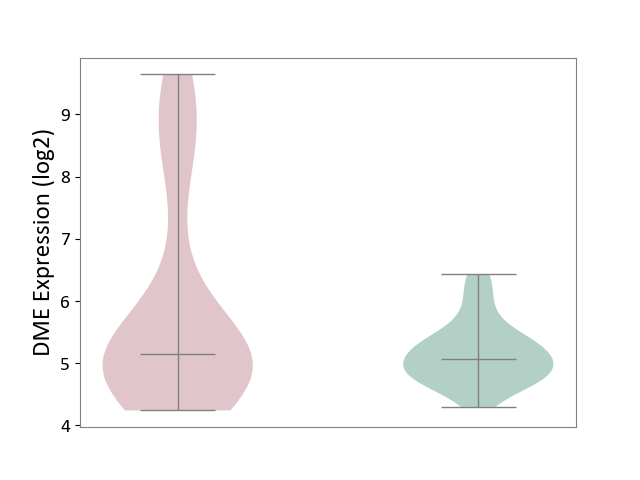
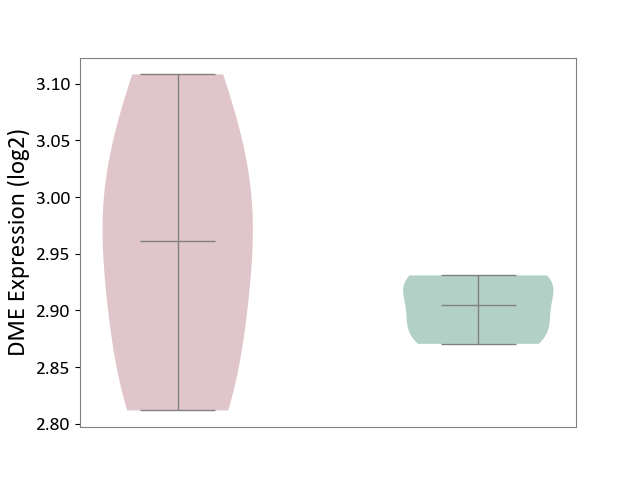
| ICD-11: 1E30 | Influenza | Click to Show/Hide | |||
| The Studied Tissue | Whole blood | ||||
| The Specified Disease | Influenza [ICD-11:1E30] | ||||
| The Expression Level of Disease Section Compare with the Healthy Individual Tissue | p-value: 3.58E-01; Fold-change: 3.81E-02; Z-score: 1.90E-01 | ||||
|
DME expression in the diseased tissue of patients
DME expression in the normal tissue of healthy individuals
|
|||||
| Violin Diagram of DME Disease-specific Protein Abundances |
|
Click to View the Clearer Original Diagram | |||
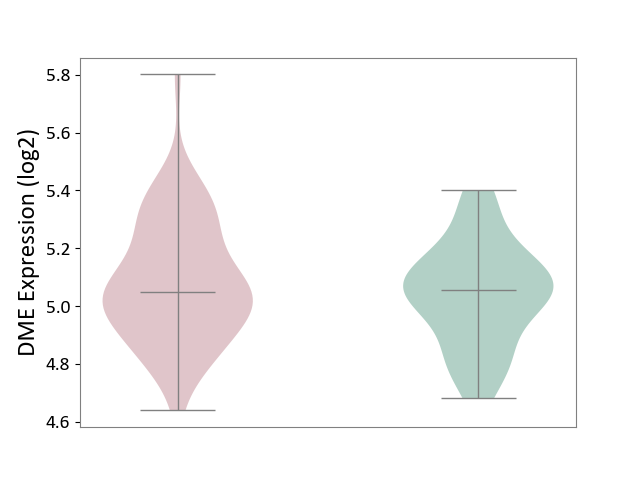
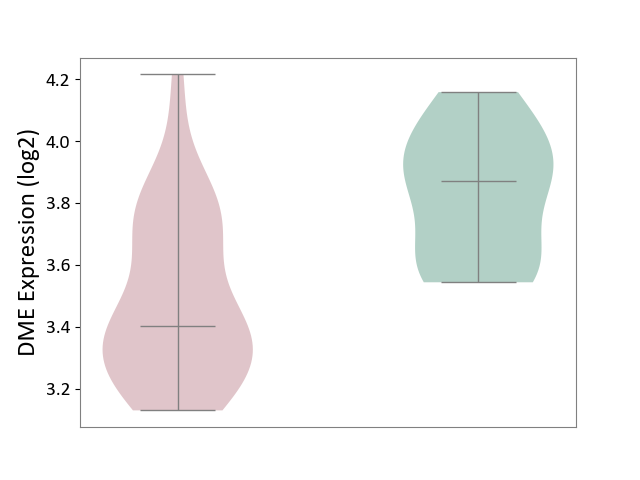
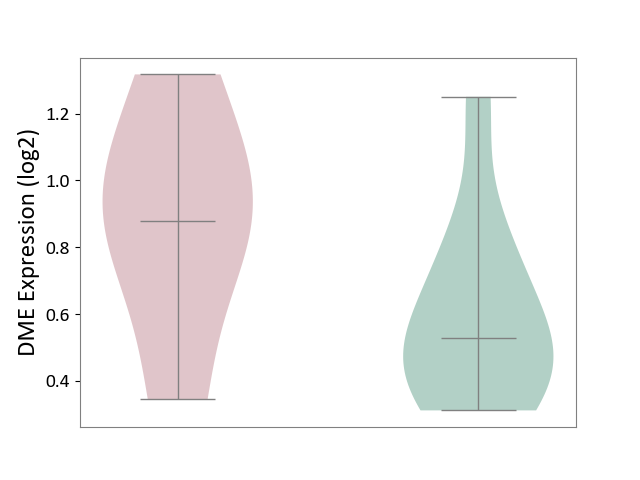
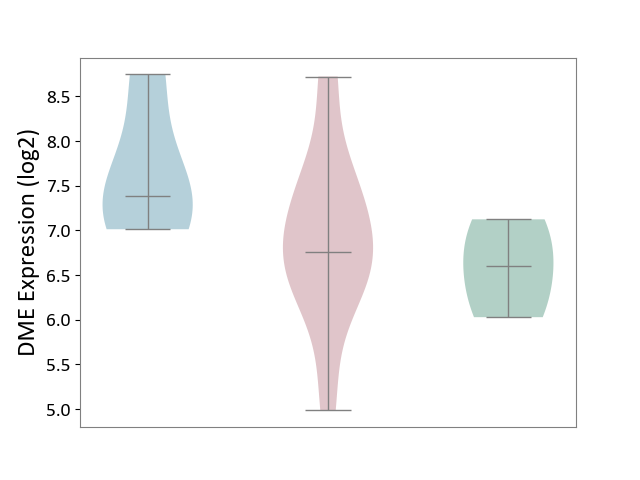
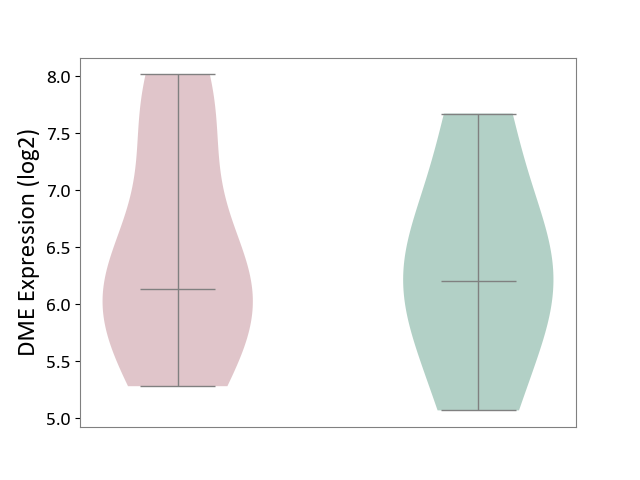
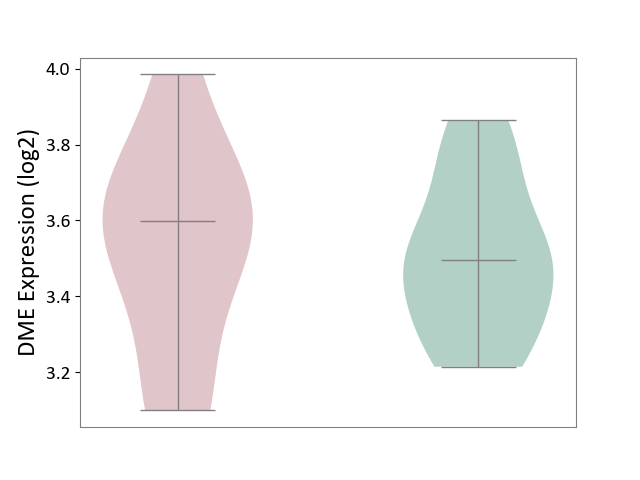
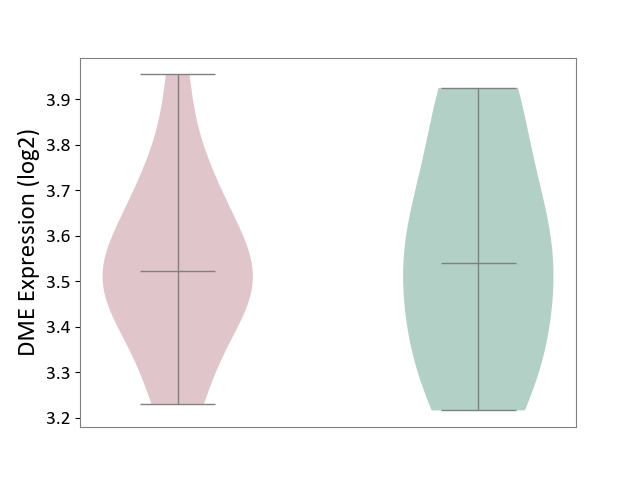
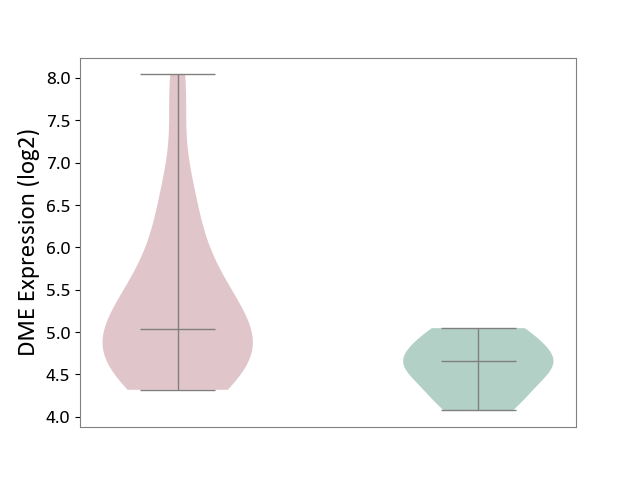
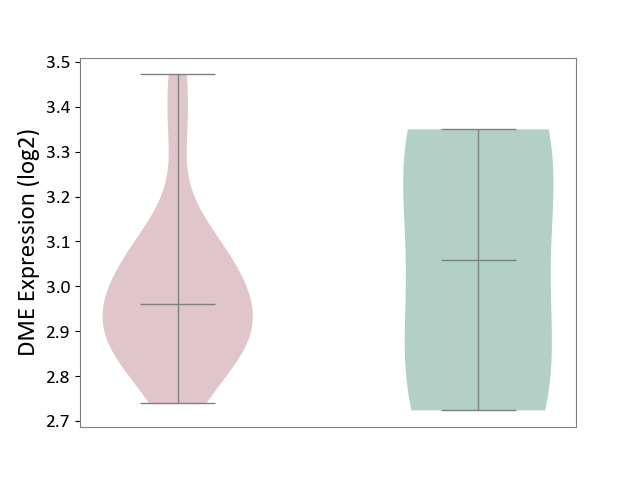
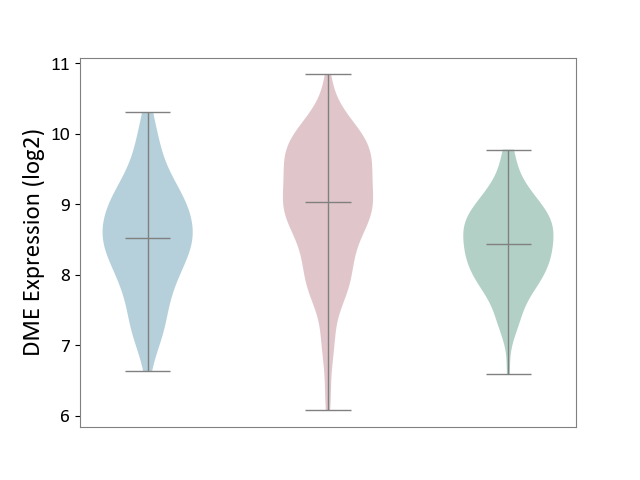
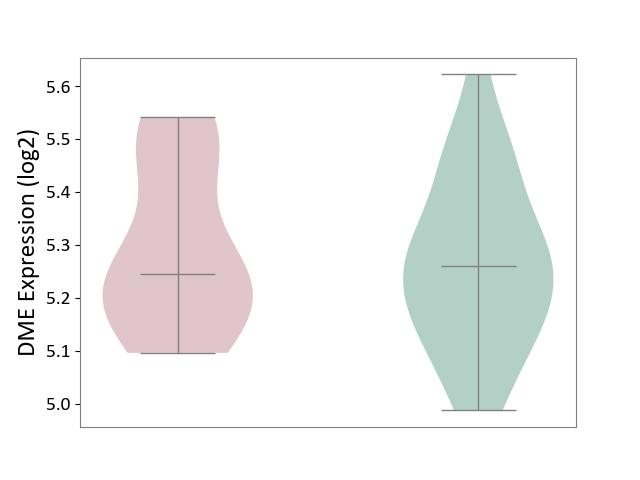
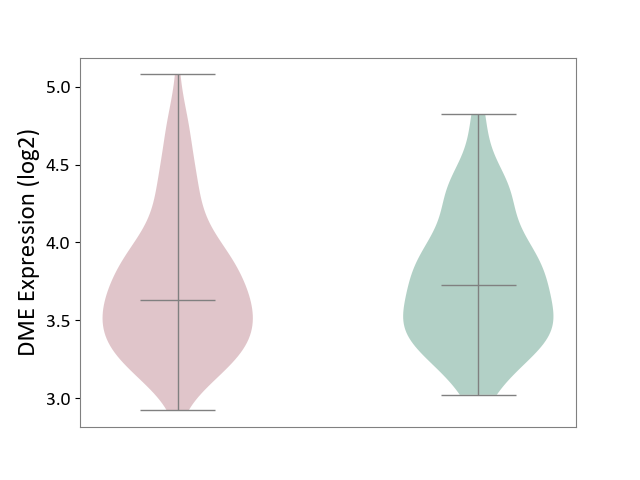
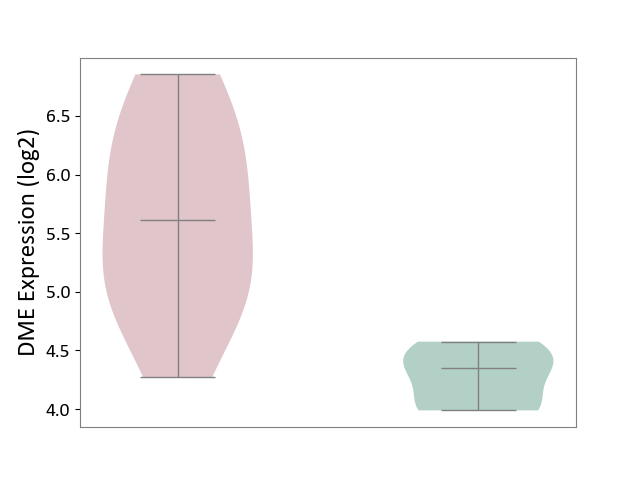
| ICD-11: 1E51 | Chronic viral hepatitis | Click to Show/Hide | |||
| The Studied Tissue | Whole blood | ||||
| The Specified Disease | Chronic hepatitis C [ICD-11:1E51.1] | ||||
| The Expression Level of Disease Section Compare with the Healthy Individual Tissue | p-value: 4.23E-01; Fold-change: 5.72E-02; Z-score: 2.65E-01 | ||||
|
DME expression in the diseased tissue of patients
DME expression in the normal tissue of healthy individuals
|
|||||
| Violin Diagram of DME Disease-specific Protein Abundances |
|
Click to View the Clearer Original Diagram | |||
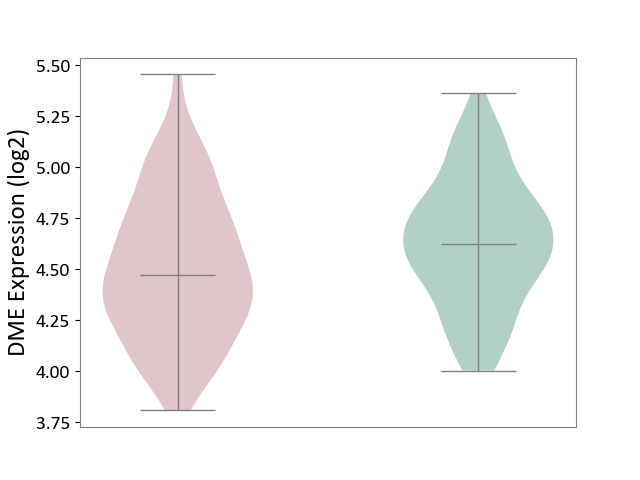
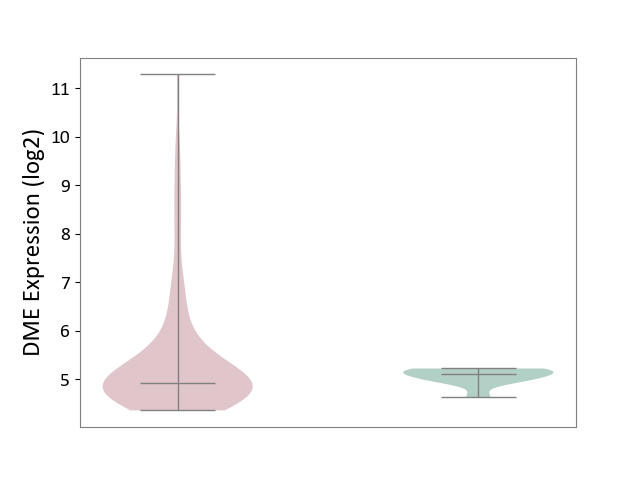
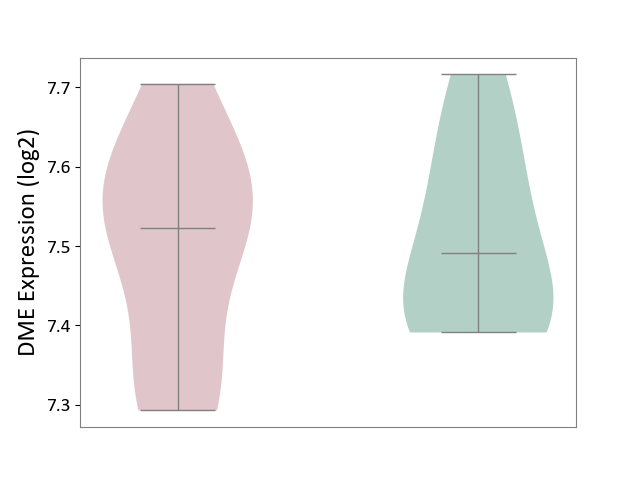
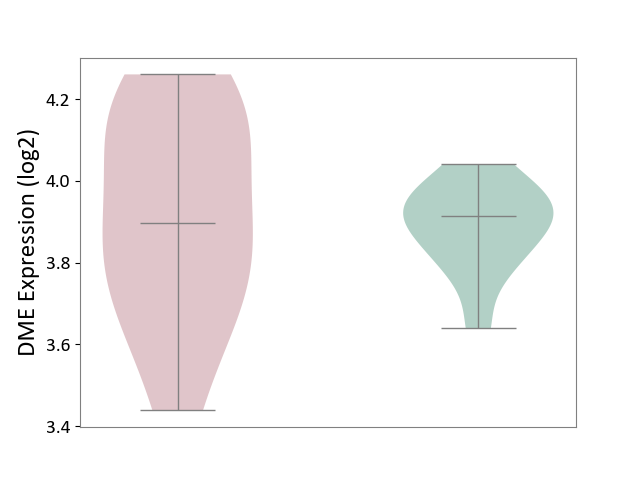
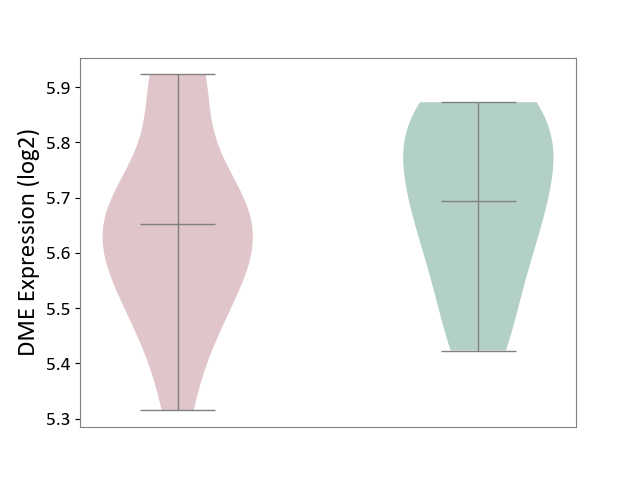
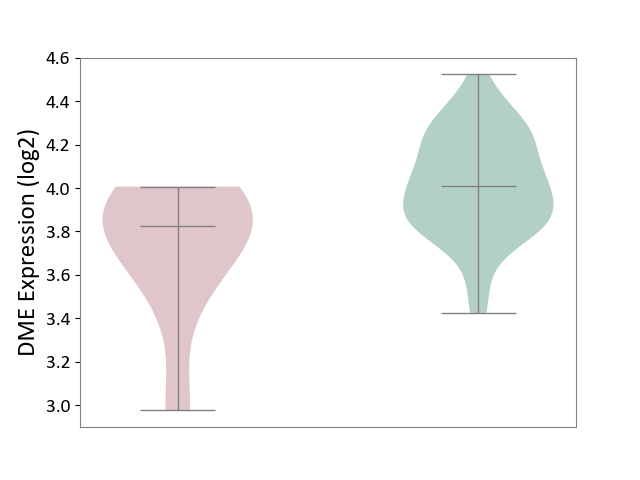
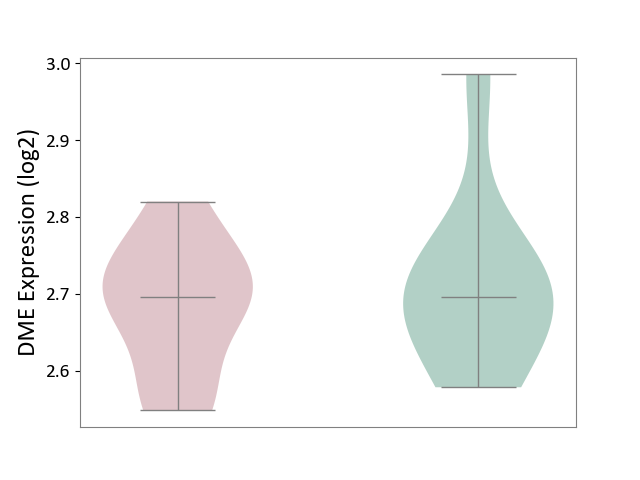
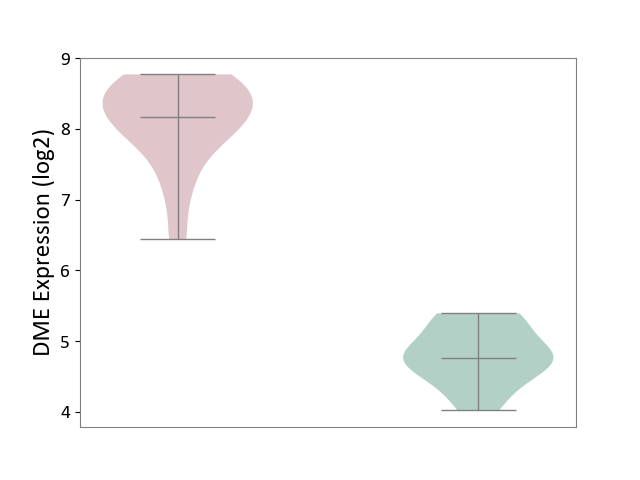
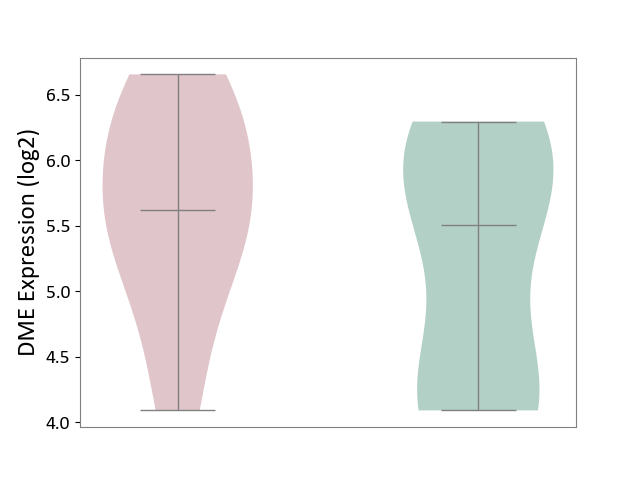
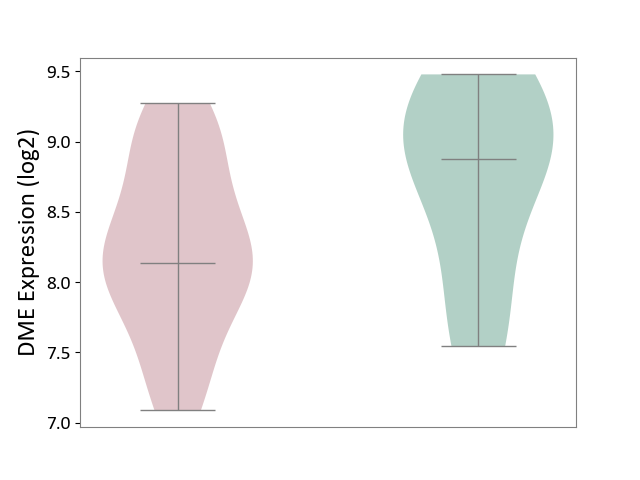
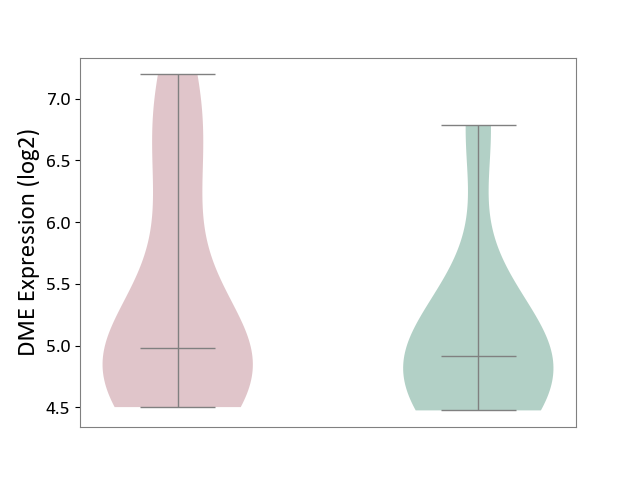
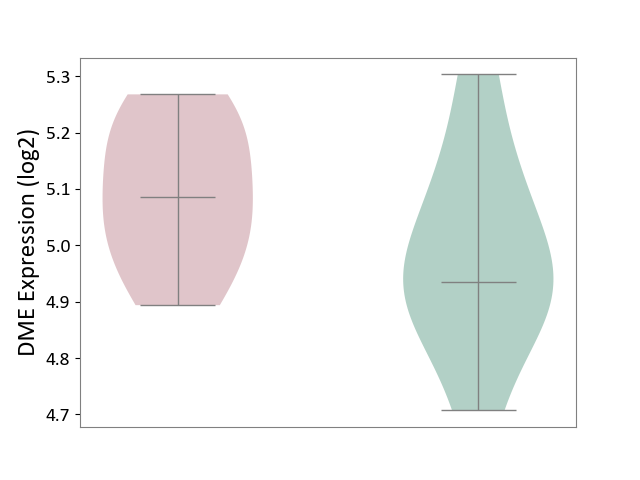
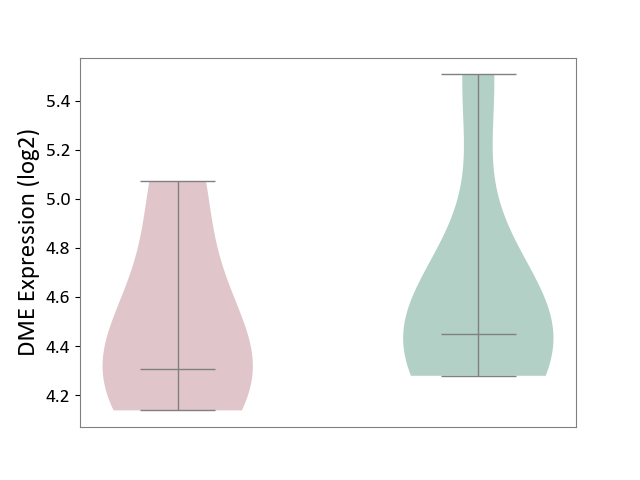
| ICD-11: 1G41 | Sepsis with septic shock | Click to Show/Hide | |||
| The Studied Tissue | Whole blood | ||||
| The Specified Disease | Sepsis with septic shock [ICD-11:1G41] | ||||
| The Expression Level of Disease Section Compare with the Healthy Individual Tissue | p-value: 1.12E-04; Fold-change: -1.40E-01; Z-score: -4.33E-01 | ||||
|
DME expression in the diseased tissue of patients
DME expression in the normal tissue of healthy individuals
|
|||||
| Violin Diagram of DME Disease-specific Protein Abundances |
|
Click to View the Clearer Original Diagram | |||
| ICD-11: CA40 | Respiratory syncytial virus infection | Click to Show/Hide | |||
| The Studied Tissue | Peripheral blood | ||||
| The Specified Disease | Pediatric respiratory syncytial virus infection [ICD-11:CA40.11] | ||||
| The Expression Level of Disease Section Compare with the Healthy Individual Tissue | p-value: 2.44E-04; Fold-change: -2.49E-01; Z-score: -1.31E+00 | ||||
|
DME expression in the diseased tissue of patients
DME expression in the normal tissue of healthy individuals
|
|||||
| Violin Diagram of DME Disease-specific Protein Abundances |
|
Click to View the Clearer Original Diagram | |||
| ICD-11: CA42 | Rhinovirus infection | Click to Show/Hide | |||
| The Studied Tissue | Nasal epithelium tissue | ||||
| The Specified Disease | Rhinovirus infection [ICD-11:CA42.1] | ||||
| The Expression Level of Disease Section Compare with the Healthy Individual Tissue | p-value: 3.15E-01; Fold-change: -8.55E-03; Z-score: -4.82E-02 | ||||
|
DME expression in the diseased tissue of patients
DME expression in the normal tissue of healthy individuals
|
|||||
| Violin Diagram of DME Disease-specific Protein Abundances |
|
Click to View the Clearer Original Diagram | |||
| ICD-11: KA60 | Neonatal sepsis | Click to Show/Hide | |||
| The Studied Tissue | Whole blood | ||||
| The Specified Disease | Neonatal sepsis [ICD-11:KA60] | ||||
| The Expression Level of Disease Section Compare with the Healthy Individual Tissue | p-value: 3.49E-03; Fold-change: -1.53E-01; Z-score: -4.89E-01 | ||||
|
DME expression in the diseased tissue of patients
DME expression in the normal tissue of healthy individuals
|
|||||
| Violin Diagram of DME Disease-specific Protein Abundances |
|
Click to View the Clearer Original Diagram | |||
| ICD Disease Classification 02 | Neoplasm | Click to Show/Hide | |||
| ICD-11: 2A00 | Brain cancer | Click to Show/Hide | |||
| The Studied Tissue | Nervous tissue | ||||
| The Specified Disease | Glioblastopma [ICD-11:2A00.00] | ||||
| The Expression Level of Disease Section Compare with the Healthy Individual Tissue | p-value: 9.96E-18; Fold-change: 1.49E-01; Z-score: 2.46E-01 | ||||
|
DME expression in the diseased tissue of patients
DME expression in the normal tissue of healthy individuals
|
|||||
| Violin Diagram of DME Disease-specific Protein Abundances |
|
Click to View the Clearer Original Diagram | |||
| The Studied Tissue | Brain stem tissue | ||||
| The Specified Disease | Glioma [ICD-11:2A00.0Y-2A00.0Z] | ||||
| The Expression Level of Disease Section Compare with the Healthy Individual Tissue | p-value: 3.44E-01; Fold-change: 7.72E-02; Z-score: 5.46E-01 | ||||
|
DME expression in the diseased tissue of patients
DME expression in the normal tissue of healthy individuals
|
|||||
| Violin Diagram of DME Disease-specific Protein Abundances |
|
Click to View the Clearer Original Diagram | |||
| The Studied Tissue | White matter tissue | ||||
| The Specified Disease | Glioma [ICD-11:2A00.0Y-2A00.0Z] | ||||
| The Expression Level of Disease Section Compare with the Healthy Individual Tissue | p-value: 2.61E-04; Fold-change: -4.70E-01; Z-score: -2.21E+00 | ||||
|
DME expression in the diseased tissue of patients
DME expression in the normal tissue of healthy individuals
|
|||||
| Violin Diagram of DME Disease-specific Protein Abundances |
|
Click to View the Clearer Original Diagram | |||
| The Studied Tissue | Brain stem tissue | ||||
| The Specified Disease | Neuroectodermal tumour [ICD-11:2A00.11] | ||||
| The Expression Level of Disease Section Compare with the Healthy Individual Tissue | p-value: 5.65E-03; Fold-change: -1.85E-01; Z-score: -1.01E+00 | ||||
|
DME expression in the diseased tissue of patients
DME expression in the normal tissue of healthy individuals
|
|||||
| Violin Diagram of DME Disease-specific Protein Abundances |
|
Click to View the Clearer Original Diagram | |||
| ICD-11: 2A20 | Myeloproliferative neoplasm | Click to Show/Hide | |||
| The Studied Tissue | Whole blood | ||||
| The Specified Disease | Myelofibrosis [ICD-11:2A20.2] | ||||
| The Expression Level of Disease Section Compare with the Healthy Individual Tissue | p-value: 5.11E-02; Fold-change: 1.83E-01; Z-score: 1.06E+00 | ||||
|
DME expression in the diseased tissue of patients
DME expression in the normal tissue of healthy individuals
|
|||||
| Violin Diagram of DME Disease-specific Protein Abundances |
|
Click to View the Clearer Original Diagram | |||
| The Studied Tissue | Whole blood | ||||
| The Specified Disease | Polycythemia vera [ICD-11:2A20.4] | ||||
| The Expression Level of Disease Section Compare with the Healthy Individual Tissue | p-value: 2.64E-05; Fold-change: 1.80E-01; Z-score: 9.29E-01 | ||||
|
DME expression in the diseased tissue of patients
DME expression in the normal tissue of healthy individuals
|
|||||
| Violin Diagram of DME Disease-specific Protein Abundances |
|
Click to View the Clearer Original Diagram | |||
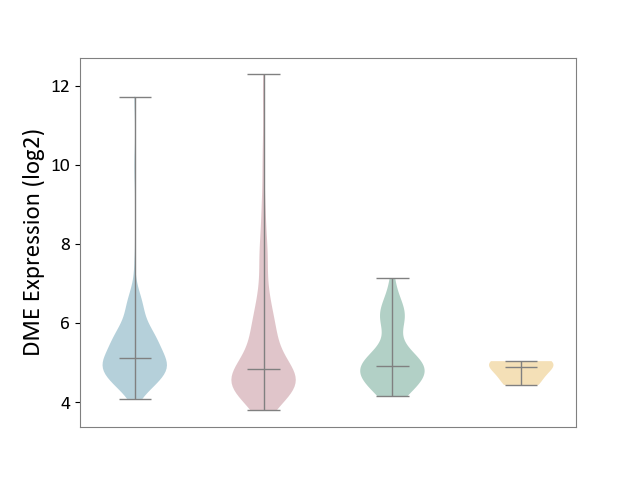
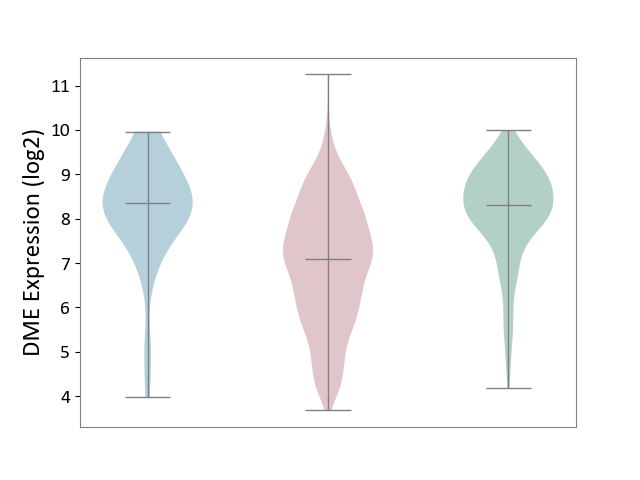
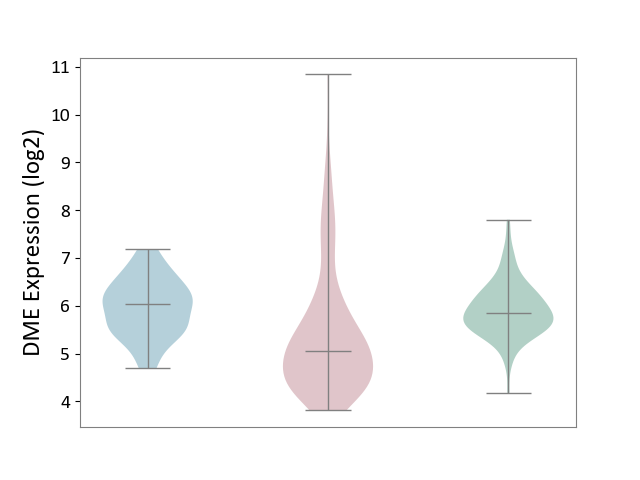
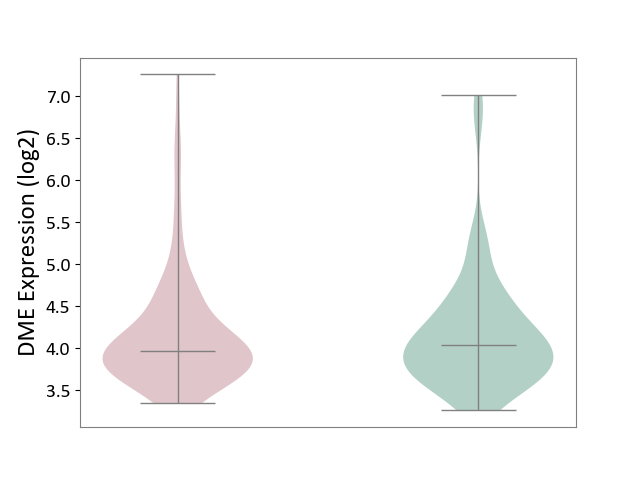
| ICD-11: 2A36 | Myelodysplastic syndrome | Click to Show/Hide | |||
| The Studied Tissue | Bone marrow | ||||
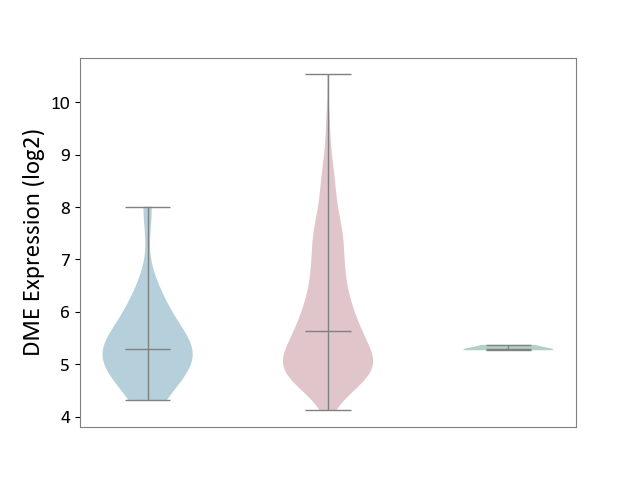
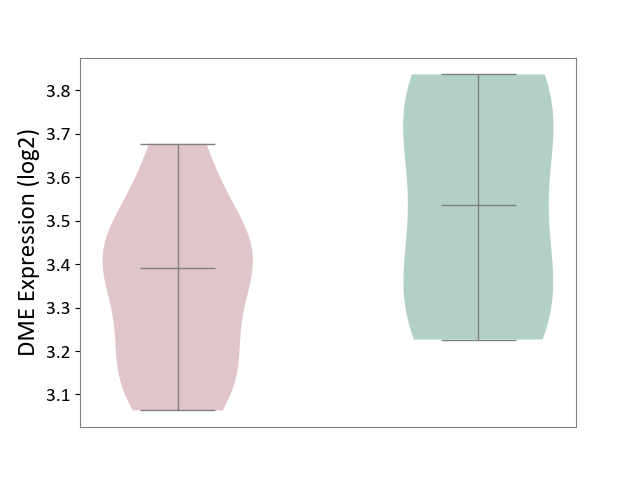
| The Specified Disease | Myelodysplastic syndrome [ICD-11:2A36-2A3Z] | ||||
| The Expression Level of Disease Section Compare with the Healthy Individual Tissue | p-value: 3.77E-03; Fold-change: 1.12E-01; Z-score: 4.42E-01 | ||||
| The Expression Level of Disease Section Compare with the Adjacent Tissue | p-value: 3.80E-01; Fold-change: -6.46E-02; Z-score: -3.22E-01 | ||||
|
DME expression in the diseased tissue of patients
DME expression in the normal tissue adjacent to the diseased tissue of patients
DME expression in the normal tissue of healthy individuals
|
|||||
| Violin Diagram of DME Disease-specific Protein Abundances |
|
Click to View the Clearer Original Diagram | |||
| ICD-11: 2A81 | Diffuse large B-cell lymphoma | Click to Show/Hide | |||
| The Studied Tissue | Tonsil tissue | ||||
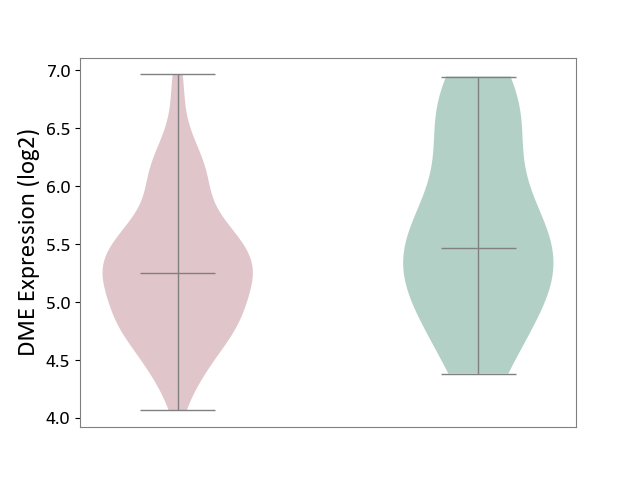
| The Specified Disease | Diffuse large B-cell lymphoma [ICD-11:2A81] | ||||
| The Expression Level of Disease Section Compare with the Healthy Individual Tissue | p-value: 3.19E-01; Fold-change: 3.98E-02; Z-score: 3.01E-01 | ||||
|
DME expression in the diseased tissue of patients
DME expression in the normal tissue of healthy individuals
|
|||||
| Violin Diagram of DME Disease-specific Protein Abundances |
|
Click to View the Clearer Original Diagram | |||
| ICD-11: 2A83 | Plasma cell neoplasm | Click to Show/Hide | |||
| The Studied Tissue | Peripheral blood | ||||
| The Specified Disease | Multiple myeloma [ICD-11:2A83.1] | ||||
| The Expression Level of Disease Section Compare with the Healthy Individual Tissue | p-value: 1.62E-01; Fold-change: 1.65E-01; Z-score: 1.34E+00 | ||||
|
DME expression in the diseased tissue of patients
DME expression in the normal tissue of healthy individuals
|
|||||
| Violin Diagram of DME Disease-specific Protein Abundances |
|
Click to View the Clearer Original Diagram | |||
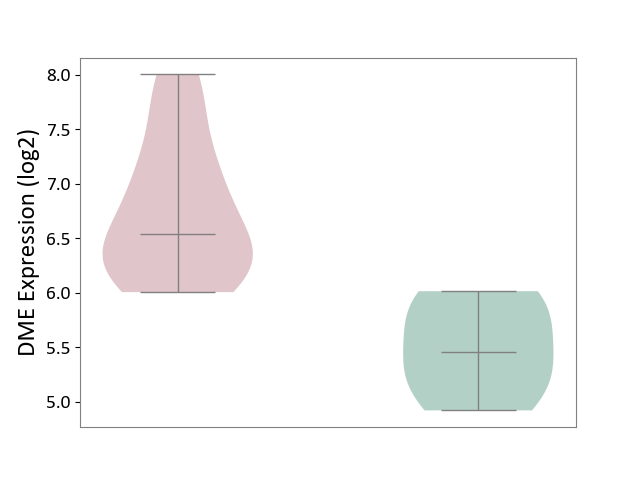
| The Studied Tissue | Bone marrow | ||||
| The Specified Disease | Multiple myeloma [ICD-11:2A83.1] | ||||
| The Expression Level of Disease Section Compare with the Healthy Individual Tissue | p-value: 1.91E-04; Fold-change: -6.62E-01; Z-score: -2.34E+00 | ||||
|
DME expression in the diseased tissue of patients
DME expression in the normal tissue of healthy individuals
|
|||||
| Violin Diagram of DME Disease-specific Protein Abundances |
|
Click to View the Clearer Original Diagram | |||
| ICD-11: 2B33 | Leukaemia | Click to Show/Hide | |||
| The Studied Tissue | Bone marrow | ||||
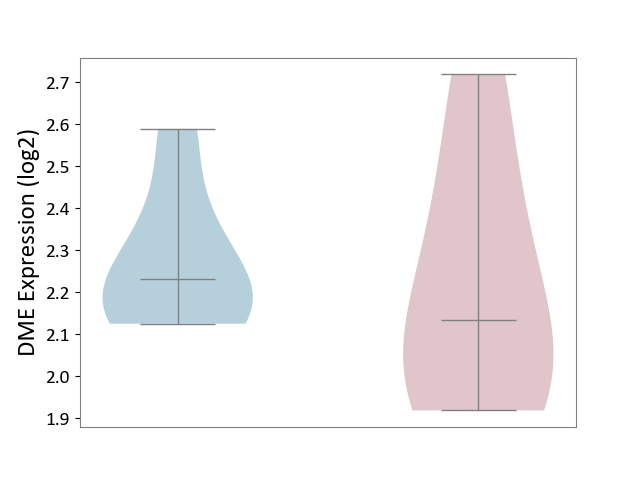
| The Specified Disease | Acute myelocytic leukaemia [ICD-11:2B33.1] | ||||
| The Expression Level of Disease Section Compare with the Healthy Individual Tissue | p-value: 1.89E-01; Fold-change: -4.31E-02; Z-score: -2.18E-01 | ||||
|
DME expression in the diseased tissue of patients
DME expression in the normal tissue of healthy individuals
|
|||||
| Violin Diagram of DME Disease-specific Protein Abundances |
|
Click to View the Clearer Original Diagram | |||
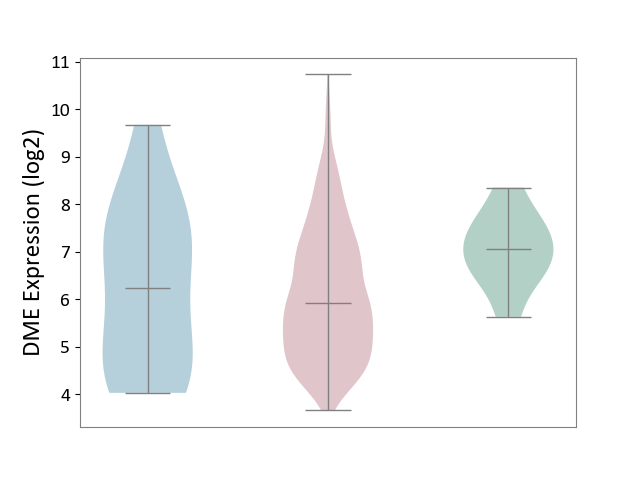
| ICD-11: 2B6E | Oral cancer | Click to Show/Hide | |||
| The Studied Tissue | Oral tissue | ||||
| The Specified Disease | Oral cancer [ICD-11:2B6E] | ||||
| The Expression Level of Disease Section Compare with the Healthy Individual Tissue | p-value: 5.32E-01; Fold-change: 2.67E-02; Z-score: 2.28E-02 | ||||
| The Expression Level of Disease Section Compare with the Adjacent Tissue | p-value: 2.52E-02; Fold-change: -2.18E-01; Z-score: -2.32E-01 | ||||
|
DME expression in the diseased tissue of patients
DME expression in the normal tissue adjacent to the diseased tissue of patients
DME expression in the normal tissue of healthy individuals
|
|||||
| Violin Diagram of DME Disease-specific Protein Abundances |
|
Click to View the Clearer Original Diagram | |||
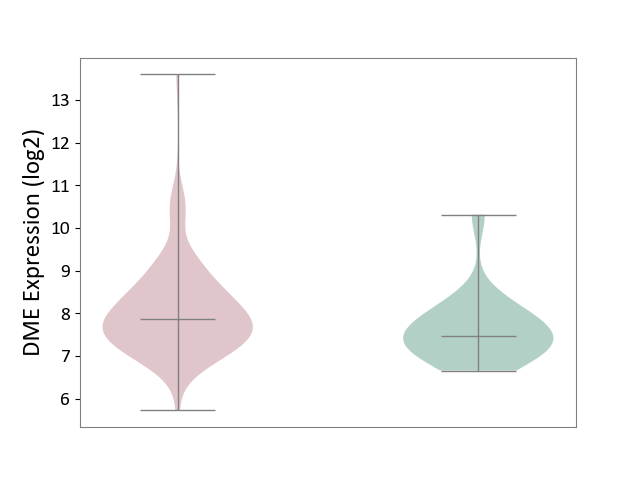
| ICD-11: 2B70 | Esophageal cancer | Click to Show/Hide | |||
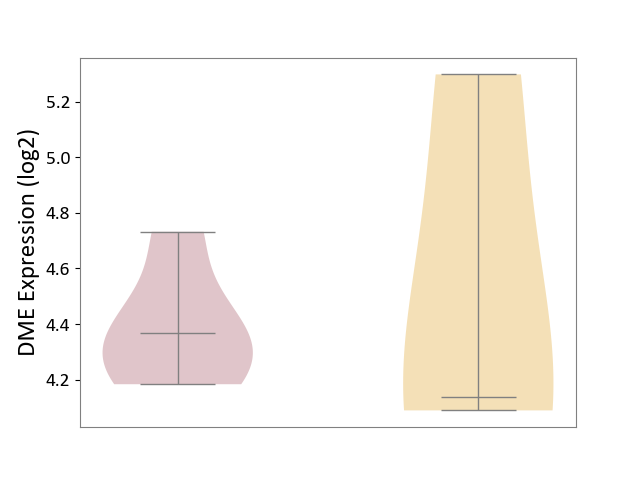
| The Studied Tissue | Esophagus | ||||
| The Specified Disease | Esophagal cancer [ICD-11:2B70] | ||||
| The Expression Level of Disease Section Compare with the Adjacent Tissue | p-value: 5.41E-01; Fold-change: -2.82E-01; Z-score: -3.83E-01 | ||||
|
DME expression in the diseased tissue of patients
DME expression in the normal tissue adjacent to the diseased tissue of patients
|
|||||
| Violin Diagram of DME Disease-specific Protein Abundances |
|
Click to View the Clearer Original Diagram | |||
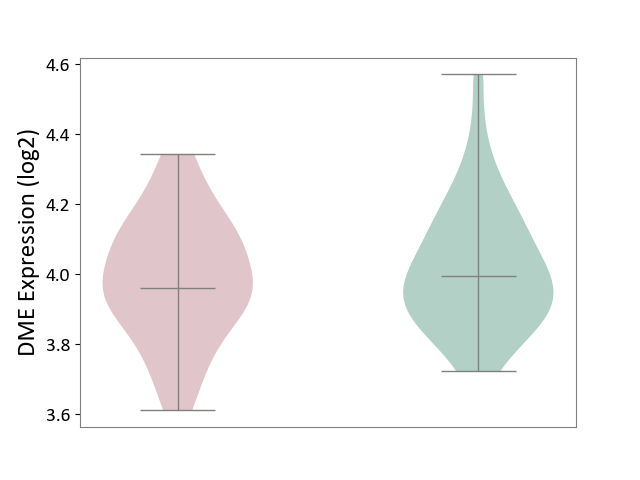
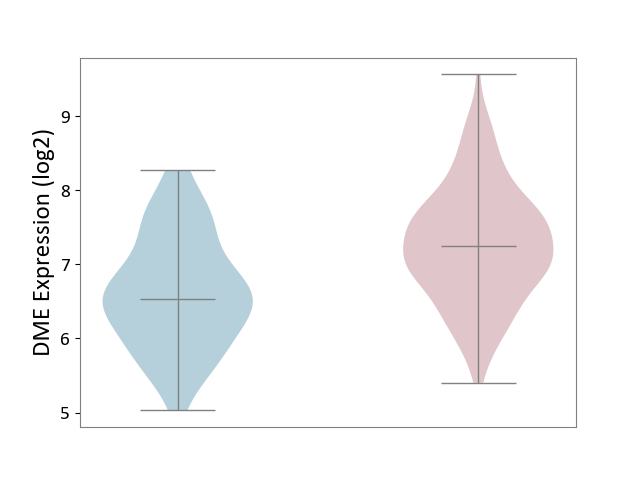
| ICD-11: 2B72 | Stomach cancer | Click to Show/Hide | |||
| The Studied Tissue | Gastric tissue | ||||
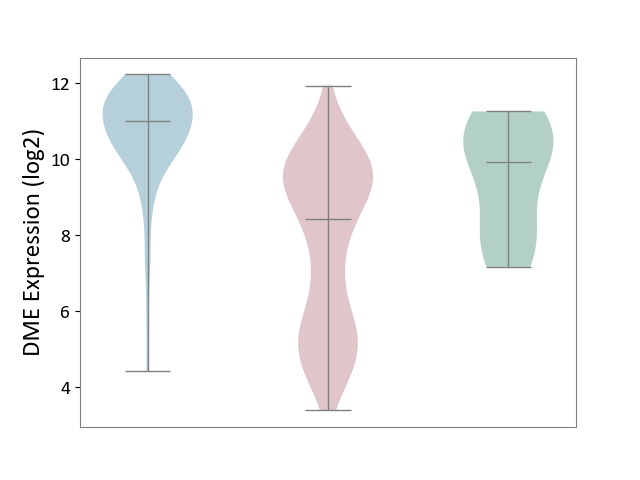
| The Specified Disease | Gastric cancer [ICD-11:2B72] | ||||
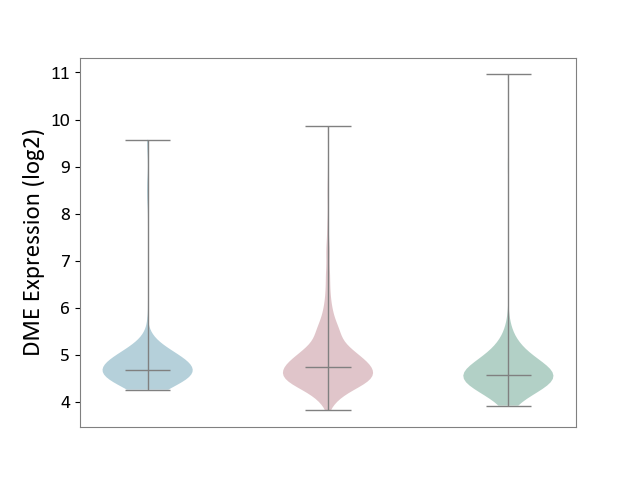
| The Expression Level of Disease Section Compare with the Healthy Individual Tissue | p-value: 8.41E-10; Fold-change: 3.53E-01; Z-score: 6.41E+00 | ||||
| The Expression Level of Disease Section Compare with the Adjacent Tissue | p-value: 1.70E-02; Fold-change: 3.43E-01; Z-score: 4.02E-01 | ||||
|
DME expression in the diseased tissue of patients
DME expression in the normal tissue adjacent to the diseased tissue of patients
DME expression in the normal tissue of healthy individuals
|
|||||
| Violin Diagram of DME Disease-specific Protein Abundances |
|
Click to View the Clearer Original Diagram | |||
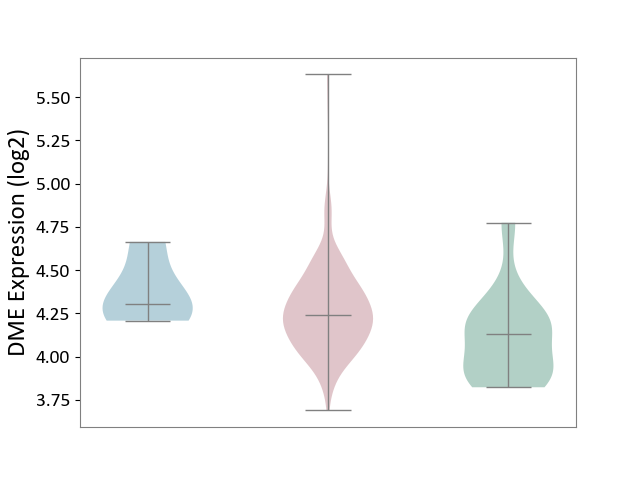
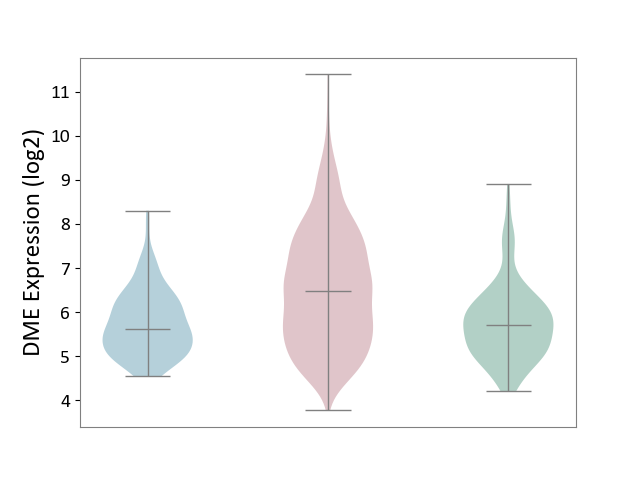
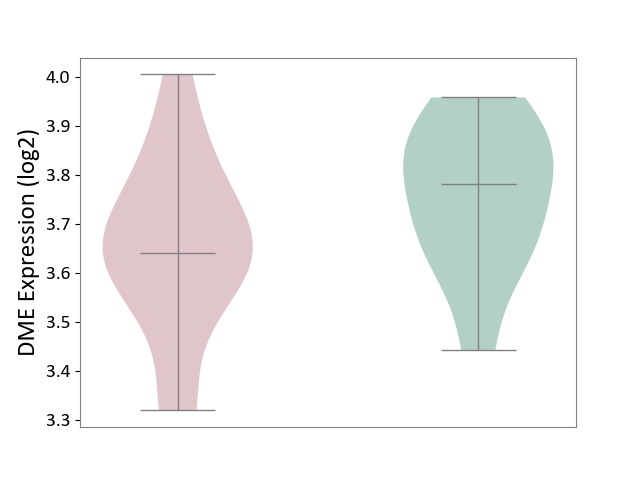
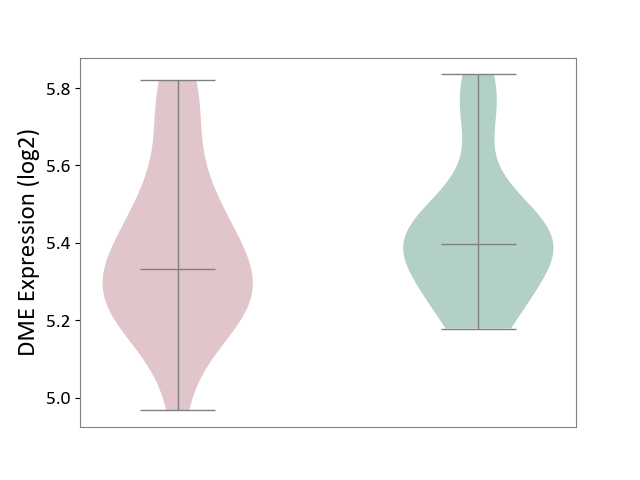
| ICD-11: 2B90 | Colon cancer | Click to Show/Hide | |||
| The Studied Tissue | Colon tissue | ||||
| The Specified Disease | Colon cancer [ICD-11:2B90] | ||||
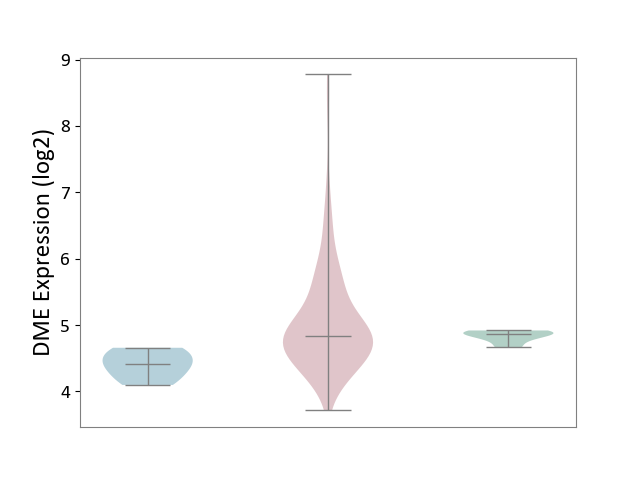
| The Expression Level of Disease Section Compare with the Healthy Individual Tissue | p-value: 8.45E-05; Fold-change: 1.82E-01; Z-score: 2.59E-01 | ||||
| The Expression Level of Disease Section Compare with the Adjacent Tissue | p-value: 1.21E-02; Fold-change: 6.73E-02; Z-score: 1.11E-01 | ||||
|
DME expression in the diseased tissue of patients
DME expression in the normal tissue adjacent to the diseased tissue of patients
DME expression in the normal tissue of healthy individuals
|
|||||
| Violin Diagram of DME Disease-specific Protein Abundances |
|
Click to View the Clearer Original Diagram | |||
| ICD-11: 2B92 | Rectal cancer | Click to Show/Hide | |||
| The Studied Tissue | Rectal colon tissue | ||||
| The Specified Disease | Rectal cancer [ICD-11:2B92] | ||||
| The Expression Level of Disease Section Compare with the Healthy Individual Tissue | p-value: 1.11E-02; Fold-change: -3.99E-02; Z-score: -4.17E-01 | ||||
| The Expression Level of Disease Section Compare with the Adjacent Tissue | p-value: 6.18E-05; Fold-change: 4.11E-01; Z-score: 1.92E+00 | ||||
|
DME expression in the diseased tissue of patients
DME expression in the normal tissue adjacent to the diseased tissue of patients
DME expression in the normal tissue of healthy individuals
|
|||||
| Violin Diagram of DME Disease-specific Protein Abundances |
|
Click to View the Clearer Original Diagram | |||
| ICD-11: 2C10 | Pancreatic cancer | Click to Show/Hide | |||
| The Studied Tissue | Pancreas | ||||
| The Specified Disease | Pancreatic cancer [ICD-11:2C10] | ||||
| The Expression Level of Disease Section Compare with the Healthy Individual Tissue | p-value: 4.80E-01; Fold-change: 4.27E-01; Z-score: 4.07E-01 | ||||
| The Expression Level of Disease Section Compare with the Adjacent Tissue | p-value: 2.36E-02; Fold-change: 6.15E-01; Z-score: 4.50E-01 | ||||
|
DME expression in the diseased tissue of patients
DME expression in the normal tissue adjacent to the diseased tissue of patients
DME expression in the normal tissue of healthy individuals
|
|||||
| Violin Diagram of DME Disease-specific Protein Abundances |
|
Click to View the Clearer Original Diagram | |||
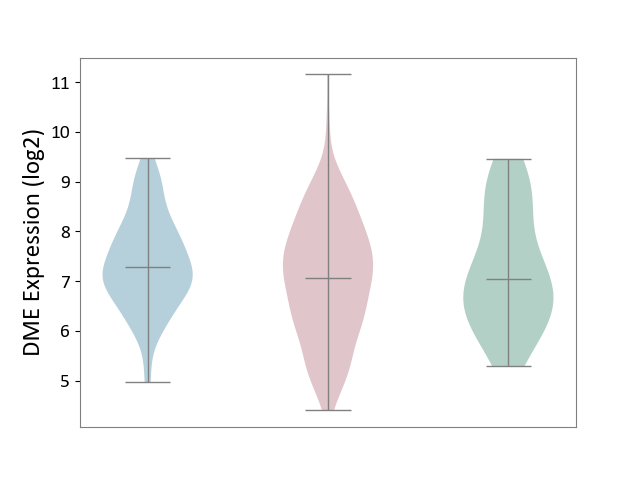
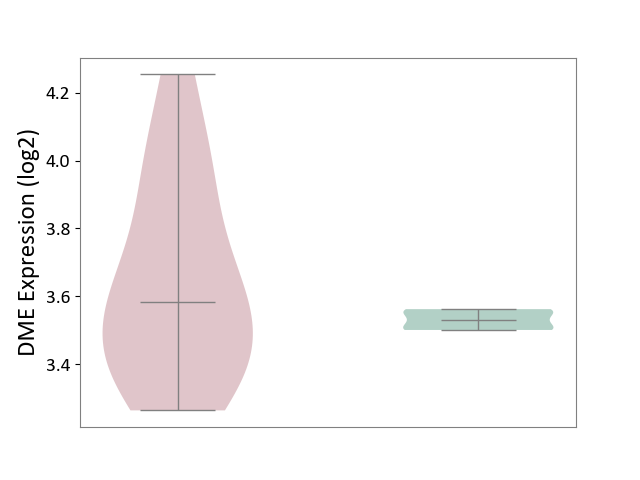
| ICD-11: 2C12 | Liver cancer | Click to Show/Hide | |||
| The Studied Tissue | Liver tissue | ||||
| The Specified Disease | Liver cancer [ICD-11:2C12.0] | ||||
| The Expression Level of Disease Section Compare with the Healthy Individual Tissue | p-value: 6.00E-02; Fold-change: -7.76E-02; Z-score: -1.02E-01 | ||||
| The Expression Level of Disease Section Compare with the Adjacent Tissue | p-value: 1.69E-01; Fold-change: -2.73E-01; Z-score: -3.13E-01 | ||||
| The Expression Level of Disease Section Compare with the Other Disease Section | p-value: 1.07E-02; Fold-change: -3.85E-02; Z-score: -1.37E-01 | ||||
|
DME expression in the diseased tissue of patients
DME expression in the normal tissue adjacent to the diseased tissue of patients
DME expression in the normal tissue of healthy individuals
DME expression in tissue other than the diseased tissue of patients
|
|||||
| Violin Diagram of DME Disease-specific Protein Abundances |
|
Click to View the Clearer Original Diagram | |||
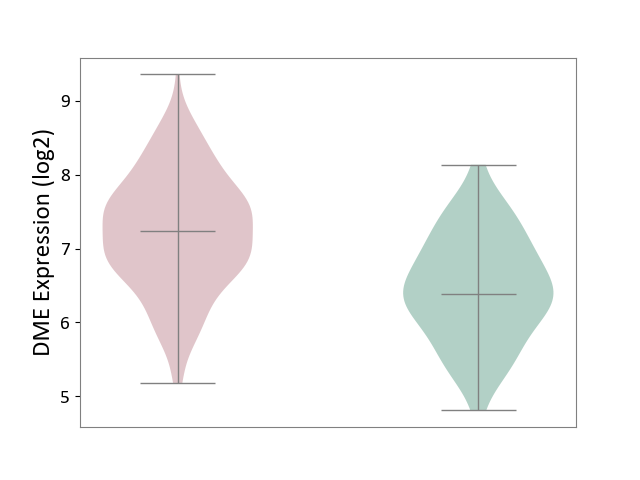
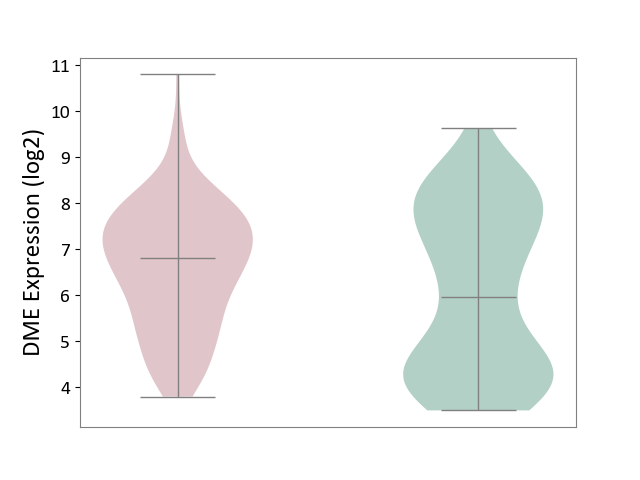
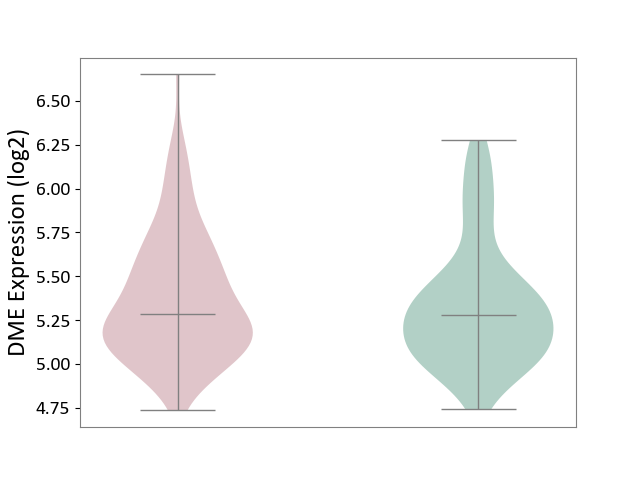
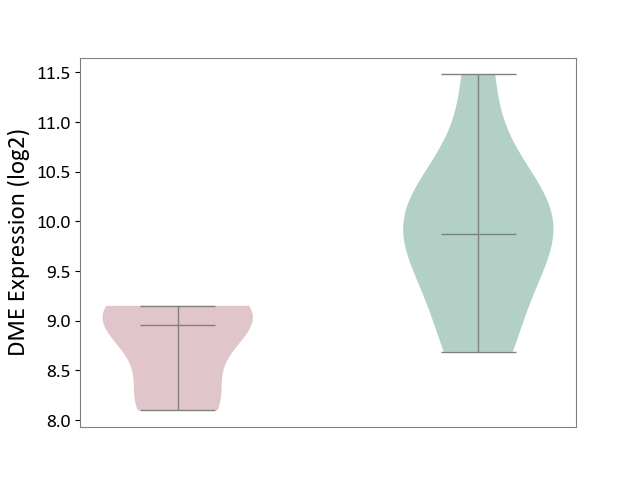
| ICD-11: 2C25 | Lung cancer | Click to Show/Hide | |||
| The Studied Tissue | Lung tissue | ||||
| The Specified Disease | Lung cancer [ICD-11:2C25] | ||||
| The Expression Level of Disease Section Compare with the Healthy Individual Tissue | p-value: 3.17E-21; Fold-change: 7.72E-01; Z-score: 8.95E-01 | ||||
| The Expression Level of Disease Section Compare with the Adjacent Tissue | p-value: 3.04E-19; Fold-change: 8.60E-01; Z-score: 1.17E+00 | ||||
|
DME expression in the diseased tissue of patients
DME expression in the normal tissue adjacent to the diseased tissue of patients
DME expression in the normal tissue of healthy individuals
|
|||||
| Violin Diagram of DME Disease-specific Protein Abundances |
|
Click to View the Clearer Original Diagram | |||
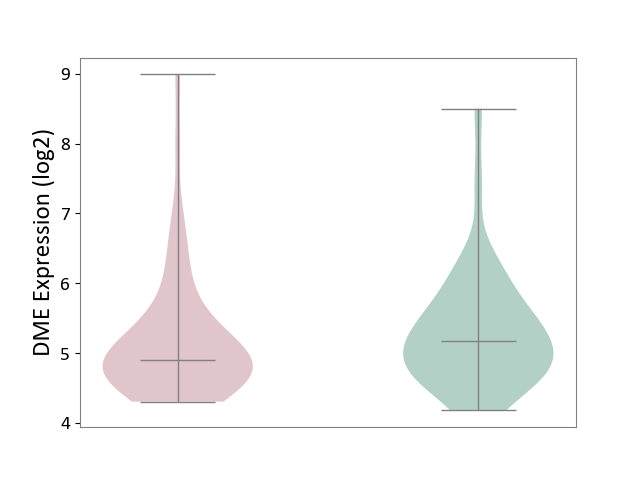
| ICD-11: 2C30 | Skin cancer | Click to Show/Hide | |||
| The Studied Tissue | Skin | ||||
| The Specified Disease | Melanoma [ICD-11:2C30] | ||||
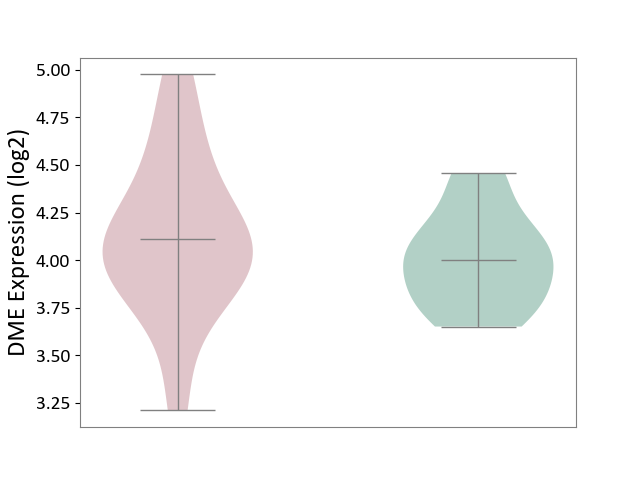
| The Expression Level of Disease Section Compare with the Healthy Individual Tissue | p-value: 6.85E-01; Fold-change: -1.68E-01; Z-score: -1.17E-01 | ||||
|
DME expression in the diseased tissue of patients
DME expression in the normal tissue of healthy individuals
|
|||||
| Violin Diagram of DME Disease-specific Protein Abundances |
|
Click to View the Clearer Original Diagram | |||
| The Studied Tissue | Skin | ||||
| The Specified Disease | Skin cancer [ICD-11:2C30-2C3Z] | ||||
| The Expression Level of Disease Section Compare with the Healthy Individual Tissue | p-value: 1.60E-17; Fold-change: -8.69E-01; Z-score: -1.14E+00 | ||||
| The Expression Level of Disease Section Compare with the Adjacent Tissue | p-value: 1.72E-21; Fold-change: -9.58E-01; Z-score: -1.29E+00 | ||||
|
DME expression in the diseased tissue of patients
DME expression in the normal tissue adjacent to the diseased tissue of patients
DME expression in the normal tissue of healthy individuals
|
|||||
| Violin Diagram of DME Disease-specific Protein Abundances |
|
Click to View the Clearer Original Diagram | |||
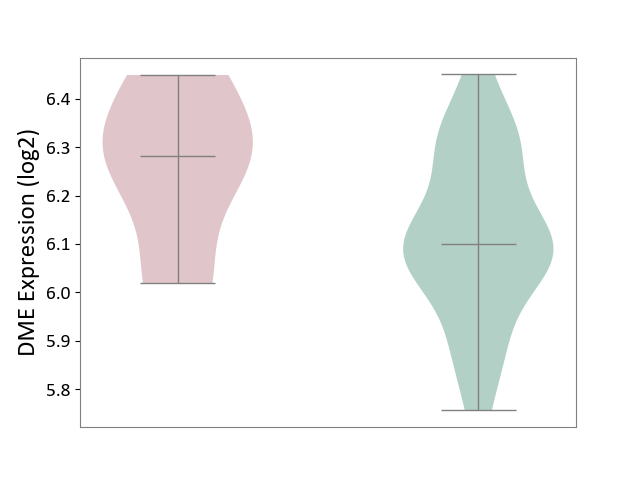
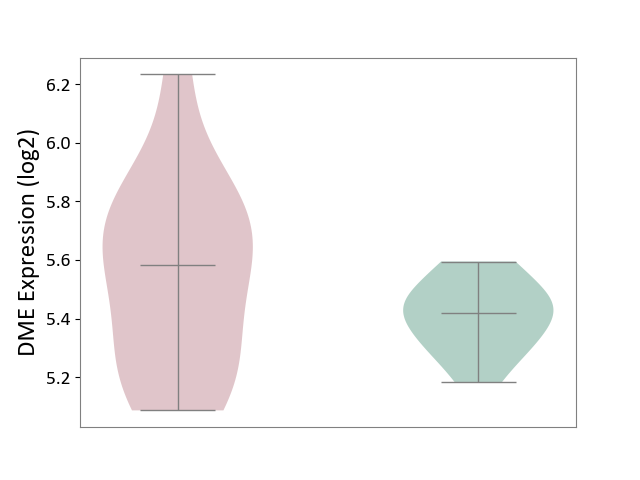
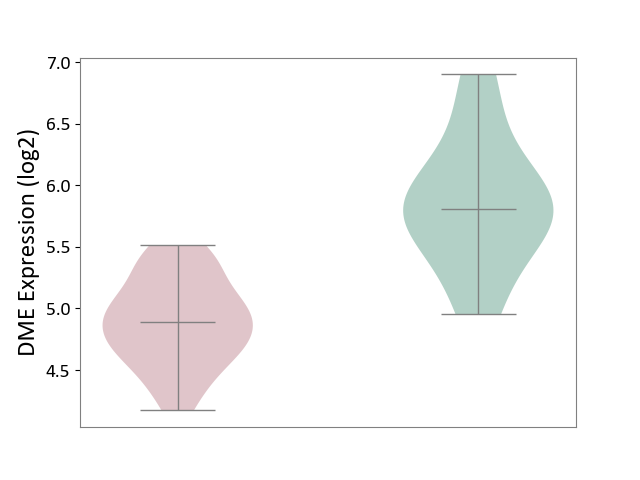
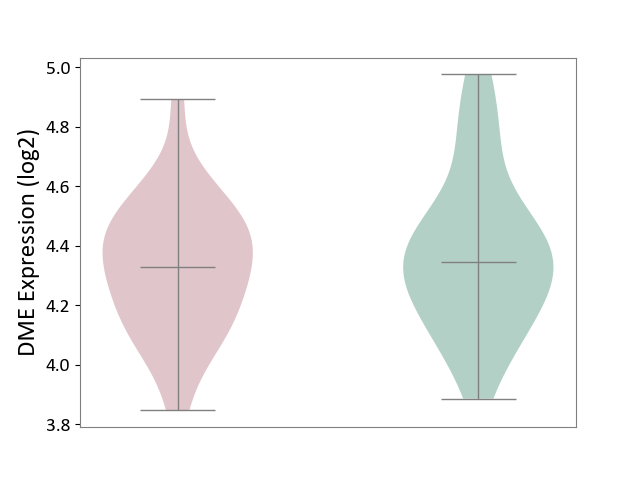
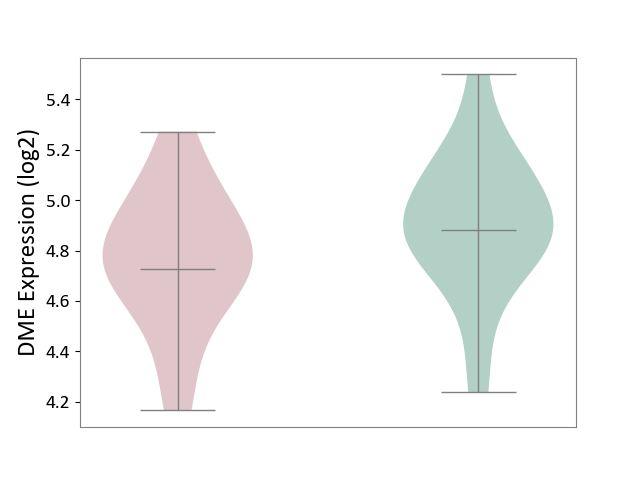
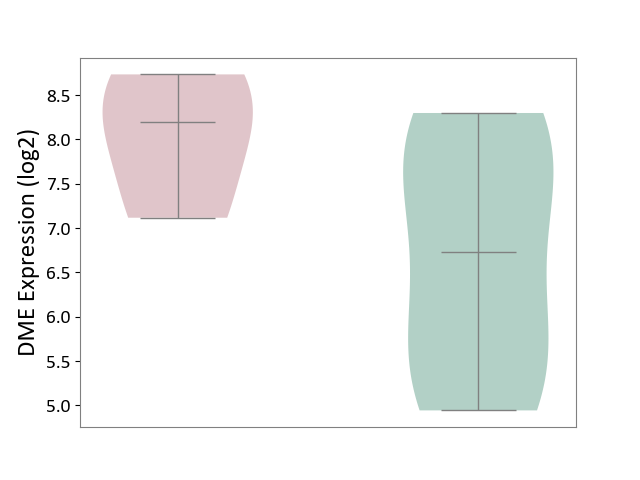
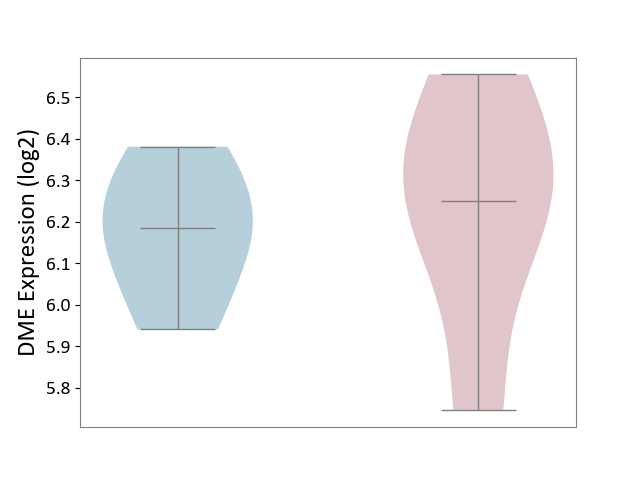
| ICD-11: 2C6Z | Breast cancer | Click to Show/Hide | |||
| The Studied Tissue | Breast tissue | ||||
| The Specified Disease | Breast cancer [ICD-11:2C60-2C6Z] | ||||
| The Expression Level of Disease Section Compare with the Healthy Individual Tissue | p-value: 1.20E-43; Fold-change: -1.22E+00; Z-score: -1.12E+00 | ||||
| The Expression Level of Disease Section Compare with the Adjacent Tissue | p-value: 9.95E-10; Fold-change: -1.27E+00; Z-score: -1.09E+00 | ||||
|
DME expression in the diseased tissue of patients
DME expression in the normal tissue adjacent to the diseased tissue of patients
DME expression in the normal tissue of healthy individuals
|
|||||
| Violin Diagram of DME Disease-specific Protein Abundances |
|
Click to View the Clearer Original Diagram | |||
| ICD-11: 2C73 | Ovarian cancer | Click to Show/Hide | |||
| The Studied Tissue | Ovarian tissue | ||||
| The Specified Disease | Ovarian cancer [ICD-11:2C73] | ||||
| The Expression Level of Disease Section Compare with the Healthy Individual Tissue | p-value: 6.66E-03; Fold-change: -1.14E+00; Z-score: -1.46E+00 | ||||
| The Expression Level of Disease Section Compare with the Adjacent Tissue | p-value: 7.70E-01; Fold-change: -3.29E-01; Z-score: -1.86E-01 | ||||
|
DME expression in the diseased tissue of patients
DME expression in the normal tissue adjacent to the diseased tissue of patients
DME expression in the normal tissue of healthy individuals
|
|||||
| Violin Diagram of DME Disease-specific Protein Abundances |
|
Click to View the Clearer Original Diagram | |||
| ICD-11: 2C77 | Cervical cancer | Click to Show/Hide | |||
| The Studied Tissue | Cervical tissue | ||||
| The Specified Disease | Cervical cancer [ICD-11:2C77] | ||||
| The Expression Level of Disease Section Compare with the Healthy Individual Tissue | p-value: 5.37E-02; Fold-change: 4.11E-01; Z-score: 5.05E-01 | ||||
|
DME expression in the diseased tissue of patients
DME expression in the normal tissue of healthy individuals
|
|||||
| Violin Diagram of DME Disease-specific Protein Abundances |
|
Click to View the Clearer Original Diagram | |||
| ICD-11: 2C78 | Uterine cancer | Click to Show/Hide | |||
| The Studied Tissue | Endometrium tissue | ||||
| The Specified Disease | Uterine cancer [ICD-11:2C78] | ||||
| The Expression Level of Disease Section Compare with the Healthy Individual Tissue | p-value: 5.62E-02; Fold-change: 2.60E-02; Z-score: 3.04E-02 | ||||
| The Expression Level of Disease Section Compare with the Adjacent Tissue | p-value: 3.51E-06; Fold-change: 1.32E+00; Z-score: 5.26E+00 | ||||
|
DME expression in the diseased tissue of patients
DME expression in the normal tissue adjacent to the diseased tissue of patients
DME expression in the normal tissue of healthy individuals
|
|||||
| Violin Diagram of DME Disease-specific Protein Abundances |
|
Click to View the Clearer Original Diagram | |||
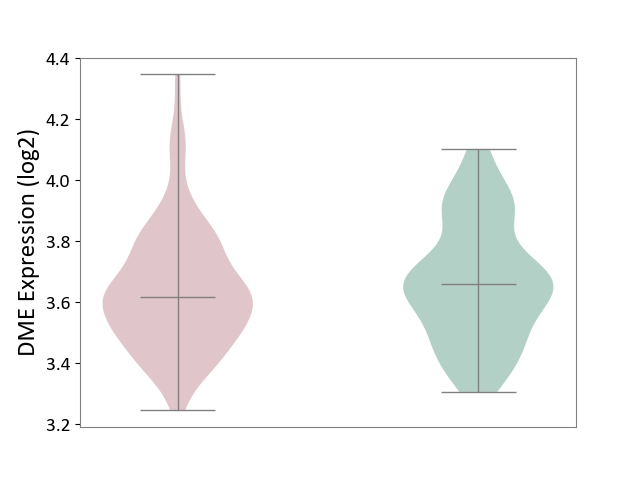
| ICD-11: 2C82 | Prostate cancer | Click to Show/Hide | |||
| The Studied Tissue | Prostate | ||||
| The Specified Disease | Prostate cancer [ICD-11:2C82] | ||||
| The Expression Level of Disease Section Compare with the Healthy Individual Tissue | p-value: 7.08E-02; Fold-change: -2.16E-01; Z-score: -2.82E-01 | ||||
|
DME expression in the diseased tissue of patients
DME expression in the normal tissue of healthy individuals
|
|||||
| Violin Diagram of DME Disease-specific Protein Abundances |
|
Click to View the Clearer Original Diagram | |||
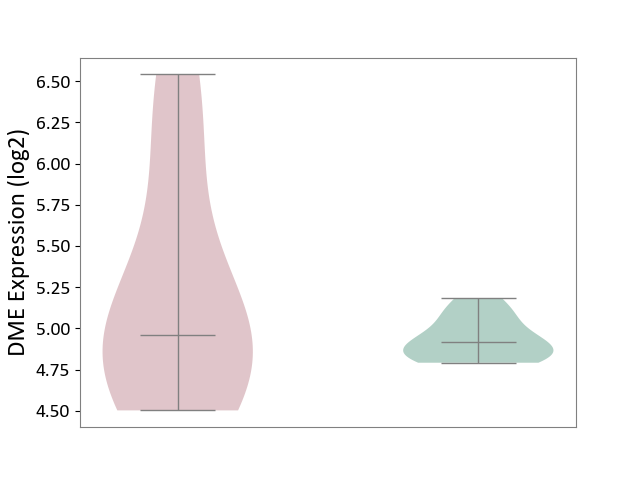
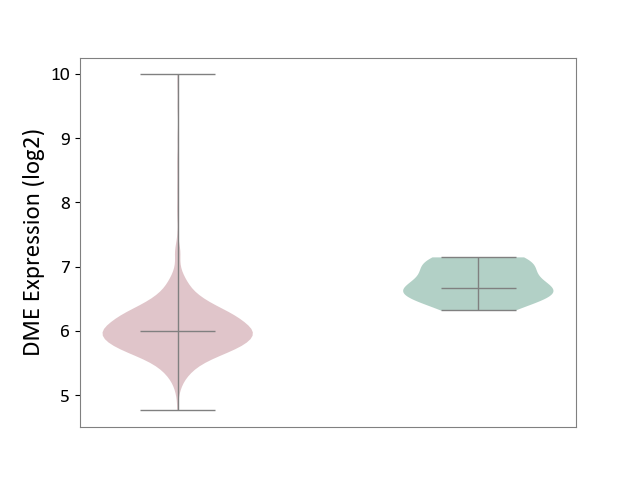
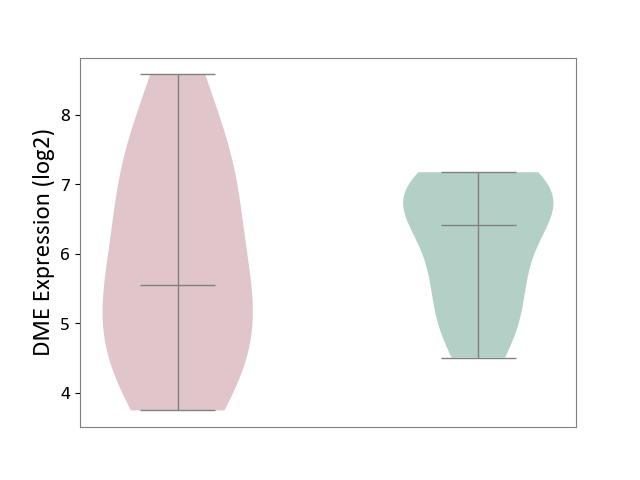
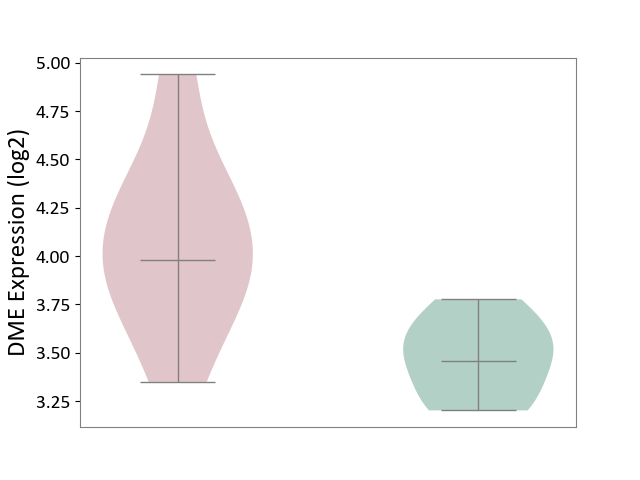
| ICD-11: 2C90 | Renal cancer | Click to Show/Hide | |||
| The Studied Tissue | Kidney | ||||
| The Specified Disease | Renal cancer [ICD-11:2C90-2C91] | ||||
| The Expression Level of Disease Section Compare with the Healthy Individual Tissue | p-value: 2.76E-03; Fold-change: -1.50E+00; Z-score: -1.01E+00 | ||||
| The Expression Level of Disease Section Compare with the Adjacent Tissue | p-value: 8.39E-29; Fold-change: -2.57E+00; Z-score: -1.84E+00 | ||||
|
DME expression in the diseased tissue of patients
DME expression in the normal tissue adjacent to the diseased tissue of patients
DME expression in the normal tissue of healthy individuals
|
|||||
| Violin Diagram of DME Disease-specific Protein Abundances |
|
Click to View the Clearer Original Diagram | |||
| ICD-11: 2C92 | Ureter cancer | Click to Show/Hide | |||
| The Studied Tissue | Urothelium | ||||
| The Specified Disease | Ureter cancer [ICD-11:2C92] | ||||
| The Expression Level of Disease Section Compare with the Healthy Individual Tissue | p-value: 2.88E-01; Fold-change: 1.06E-01; Z-score: 4.23E-01 | ||||
|
DME expression in the diseased tissue of patients
DME expression in the normal tissue of healthy individuals
|
|||||
| Violin Diagram of DME Disease-specific Protein Abundances |
|
Click to View the Clearer Original Diagram | |||
| ICD-11: 2C94 | Bladder cancer | Click to Show/Hide | |||
| The Studied Tissue | Bladder tissue | ||||
| The Specified Disease | Bladder cancer [ICD-11:2C94] | ||||
| The Expression Level of Disease Section Compare with the Healthy Individual Tissue | p-value: 1.14E-04; Fold-change: 1.05E+00; Z-score: 2.25E+00 | ||||
|
DME expression in the diseased tissue of patients
DME expression in the normal tissue of healthy individuals
|
|||||
| Violin Diagram of DME Disease-specific Protein Abundances |
|
Click to View the Clearer Original Diagram | |||
| ICD-11: 2D02 | Retinal cancer | Click to Show/Hide | |||
| The Studied Tissue | Uvea | ||||
| The Specified Disease | Retinoblastoma [ICD-11:2D02.2] | ||||
| The Expression Level of Disease Section Compare with the Healthy Individual Tissue | p-value: 5.48E-02; Fold-change: 1.55E-01; Z-score: 1.25E+00 | ||||
|
DME expression in the diseased tissue of patients
DME expression in the normal tissue of healthy individuals
|
|||||
| Violin Diagram of DME Disease-specific Protein Abundances |
|
Click to View the Clearer Original Diagram | |||
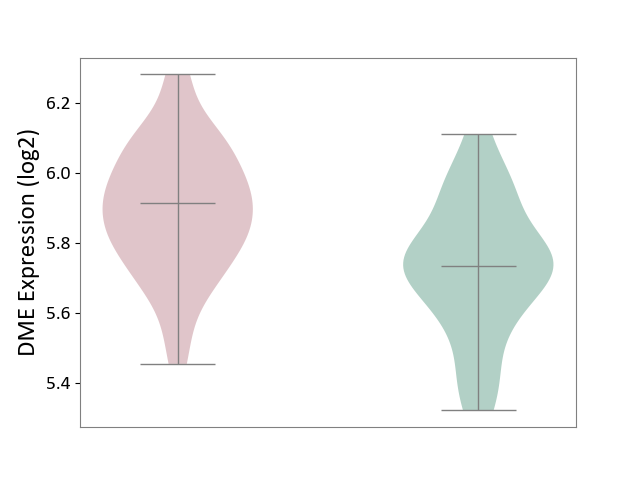
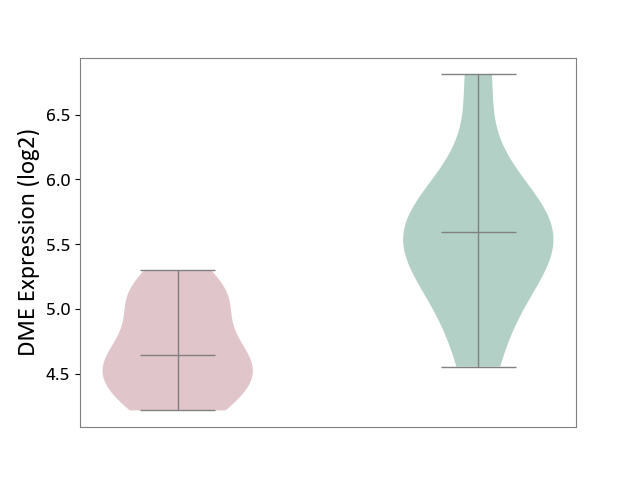
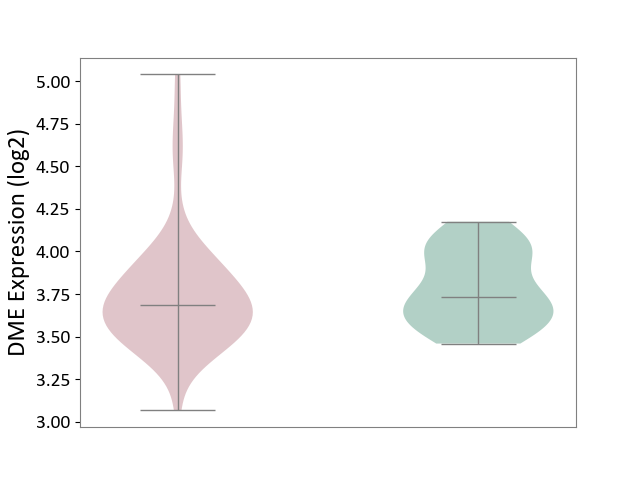
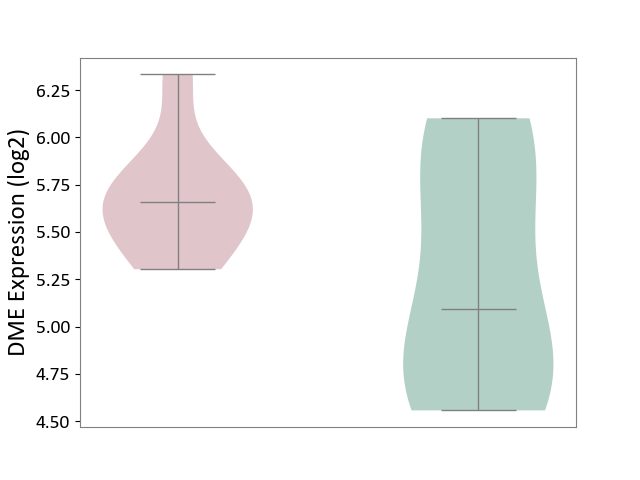
| ICD-11: 2D10 | Thyroid cancer | Click to Show/Hide | |||
| The Studied Tissue | Thyroid | ||||
| The Specified Disease | Thyroid cancer [ICD-11:2D10] | ||||
| The Expression Level of Disease Section Compare with the Healthy Individual Tissue | p-value: 2.16E-08; Fold-change: -8.00E-01; Z-score: -1.40E+00 | ||||
| The Expression Level of Disease Section Compare with the Adjacent Tissue | p-value: 3.92E-06; Fold-change: -9.91E-01; Z-score: -1.63E+00 | ||||
|
DME expression in the diseased tissue of patients
DME expression in the normal tissue adjacent to the diseased tissue of patients
DME expression in the normal tissue of healthy individuals
|
|||||
| Violin Diagram of DME Disease-specific Protein Abundances |
|
Click to View the Clearer Original Diagram | |||
| ICD-11: 2D11 | Adrenal cancer | Click to Show/Hide | |||
| The Studied Tissue | Adrenal cortex | ||||
| The Specified Disease | Adrenocortical carcinoma [ICD-11:2D11.Z] | ||||
| The Expression Level of Disease Section Compare with the Other Disease Section | p-value: 2.24E-04; Fold-change: -1.32E+00; Z-score: -1.45E+00 | ||||
|
DME expression in the diseased tissue of patients
DME expression in tissue other than the diseased tissue of patients
|
|||||
| Violin Diagram of DME Disease-specific Protein Abundances |
|
Click to View the Clearer Original Diagram | |||
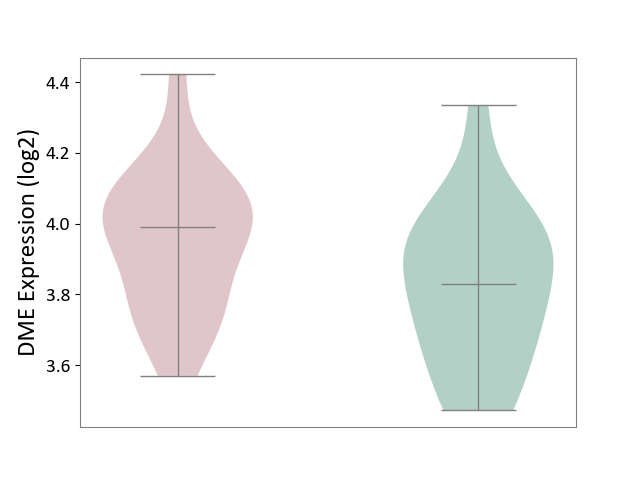
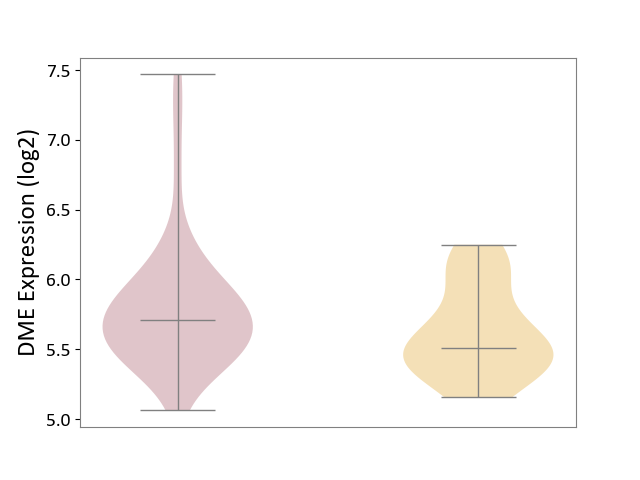
| ICD-11: 2D12 | Endocrine gland neoplasm | Click to Show/Hide | |||
| The Studied Tissue | Pituitary tissue | ||||
| The Specified Disease | Pituitary cancer [ICD-11:2D12] | ||||
| The Expression Level of Disease Section Compare with the Healthy Individual Tissue | p-value: 8.96E-05; Fold-change: -9.18E-01; Z-score: -1.72E+00 | ||||
|
DME expression in the diseased tissue of patients
DME expression in the normal tissue of healthy individuals
|
|||||
| Violin Diagram of DME Disease-specific Protein Abundances |
|
Click to View the Clearer Original Diagram | |||
| The Studied Tissue | Pituitary tissue | ||||
| The Specified Disease | Pituitary gonadotrope tumour [ICD-11:2D12] | ||||
| The Expression Level of Disease Section Compare with the Healthy Individual Tissue | p-value: 2.75E-03; Fold-change: -9.53E-01; Z-score: -1.56E+00 | ||||
|
DME expression in the diseased tissue of patients
DME expression in the normal tissue of healthy individuals
|
|||||
| Violin Diagram of DME Disease-specific Protein Abundances |
|
Click to View the Clearer Original Diagram | |||
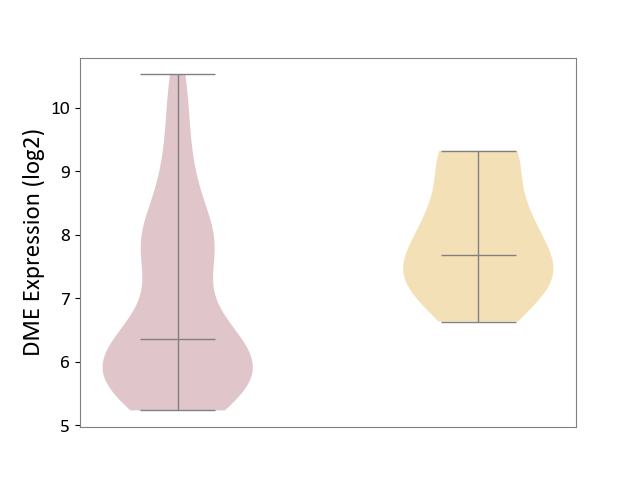
| ICD-11: 2D42 | Head and neck cancer | Click to Show/Hide | |||
| The Studied Tissue | Head and neck tissue | ||||
| The Specified Disease | Head and neck cancer [ICD-11:2D42] | ||||
| The Expression Level of Disease Section Compare with the Healthy Individual Tissue | p-value: 1.59E-02; Fold-change: 8.45E-01; Z-score: 4.66E-01 | ||||
|
DME expression in the diseased tissue of patients
DME expression in the normal tissue of healthy individuals
|
|||||
| Violin Diagram of DME Disease-specific Protein Abundances |
|
Click to View the Clearer Original Diagram | |||
| ICD Disease Classification 03 | Blood/blood-forming organ disease | Click to Show/Hide | |||
| ICD-11: 3A51 | Sickle cell disorder | Click to Show/Hide | |||
| The Studied Tissue | Peripheral blood | ||||
| The Specified Disease | Sickle cell disease [ICD-11:3A51.0-3A51.3] | ||||
| The Expression Level of Disease Section Compare with the Healthy Individual Tissue | p-value: 1.27E-01; Fold-change: -1.40E-01; Z-score: -9.19E-01 | ||||
|
DME expression in the diseased tissue of patients
DME expression in the normal tissue of healthy individuals
|
|||||
| Violin Diagram of DME Disease-specific Protein Abundances |
|
Click to View the Clearer Original Diagram | |||
| ICD-11: 3A70 | Aplastic anaemia | Click to Show/Hide | |||
| The Studied Tissue | Bone marrow | ||||
| The Specified Disease | Shwachman-Diamond syndrome [ICD-11:3A70.0] | ||||
| The Expression Level of Disease Section Compare with the Healthy Individual Tissue | p-value: 4.58E-01; Fold-change: -7.54E-02; Z-score: -1.63E-01 | ||||
|
DME expression in the diseased tissue of patients
DME expression in the normal tissue of healthy individuals
|
|||||
| Violin Diagram of DME Disease-specific Protein Abundances |
|
Click to View the Clearer Original Diagram | |||
| ICD-11: 3B63 | Thrombocytosis | Click to Show/Hide | |||
| The Studied Tissue | Whole blood | ||||
| The Specified Disease | Thrombocythemia [ICD-11:3B63] | ||||
| The Expression Level of Disease Section Compare with the Healthy Individual Tissue | p-value: 2.32E-02; Fold-change: 1.15E-01; Z-score: 6.61E-01 | ||||
|
DME expression in the diseased tissue of patients
DME expression in the normal tissue of healthy individuals
|
|||||
| Violin Diagram of DME Disease-specific Protein Abundances |
|
Click to View the Clearer Original Diagram | |||
| ICD-11: 3B64 | Thrombocytopenia | Click to Show/Hide | |||
| The Studied Tissue | Whole blood | ||||
| The Specified Disease | Thrombocytopenia [ICD-11:3B64] | ||||
| The Expression Level of Disease Section Compare with the Healthy Individual Tissue | p-value: 1.66E-01; Fold-change: 3.50E-01; Z-score: 1.24E+00 | ||||
|
DME expression in the diseased tissue of patients
DME expression in the normal tissue of healthy individuals
|
|||||
| Violin Diagram of DME Disease-specific Protein Abundances |
|
Click to View the Clearer Original Diagram | |||
| ICD Disease Classification 04 | Immune system disease | Click to Show/Hide | |||
| ICD-11: 4A00 | Immunodeficiency | Click to Show/Hide | |||
| The Studied Tissue | Peripheral blood | ||||
| The Specified Disease | Immunodeficiency [ICD-11:4A00-4A20] | ||||
| The Expression Level of Disease Section Compare with the Healthy Individual Tissue | p-value: 8.84E-01; Fold-change: 3.21E-02; Z-score: 2.72E-01 | ||||
|
DME expression in the diseased tissue of patients
DME expression in the normal tissue of healthy individuals
|
|||||
| Violin Diagram of DME Disease-specific Protein Abundances |
|
Click to View the Clearer Original Diagram | |||
| ICD-11: 4A40 | Lupus erythematosus | Click to Show/Hide | |||
| The Studied Tissue | Whole blood | ||||
| The Specified Disease | Lupus erythematosus [ICD-11:4A40] | ||||
| The Expression Level of Disease Section Compare with the Healthy Individual Tissue | p-value: 3.78E-01; Fold-change: -3.88E-03; Z-score: -1.05E-02 | ||||
|
DME expression in the diseased tissue of patients
DME expression in the normal tissue of healthy individuals
|
|||||
| Violin Diagram of DME Disease-specific Protein Abundances |
|
Click to View the Clearer Original Diagram | |||
| ICD-11: 4A42 | Systemic sclerosis | Click to Show/Hide | |||
| The Studied Tissue | Whole blood | ||||
| The Specified Disease | Scleroderma [ICD-11:4A42.Z] | ||||
| The Expression Level of Disease Section Compare with the Healthy Individual Tissue | p-value: 5.23E-01; Fold-change: -1.35E-02; Z-score: -4.76E-02 | ||||
|
DME expression in the diseased tissue of patients
DME expression in the normal tissue of healthy individuals
|
|||||
| Violin Diagram of DME Disease-specific Protein Abundances |
|
Click to View the Clearer Original Diagram | |||
| ICD-11: 4A43 | Systemic autoimmune disease | Click to Show/Hide | |||
| The Studied Tissue | Salivary gland tissue | ||||
| The Specified Disease | Sjogren's syndrome [ICD-11:4A43.2] | ||||
| The Expression Level of Disease Section Compare with the Healthy Individual Tissue | p-value: 4.38E-01; Fold-change: 1.46E-01; Z-score: 2.67E-01 | ||||
| The Expression Level of Disease Section Compare with the Adjacent Tissue | p-value: 1.61E-01; Fold-change: -6.31E-01; Z-score: -8.25E-01 | ||||
|
DME expression in the diseased tissue of patients
DME expression in the normal tissue adjacent to the diseased tissue of patients
DME expression in the normal tissue of healthy individuals
|
|||||
| Violin Diagram of DME Disease-specific Protein Abundances |
|
Click to View the Clearer Original Diagram | |||
| ICD-11: 4A62 | Behcet disease | Click to Show/Hide | |||
| The Studied Tissue | Peripheral blood | ||||
| The Specified Disease | Behcet's disease [ICD-11:4A62] | ||||
| The Expression Level of Disease Section Compare with the Healthy Individual Tissue | p-value: 7.70E-01; Fold-change: -1.64E-02; Z-score: -1.50E-01 | ||||
|
DME expression in the diseased tissue of patients
DME expression in the normal tissue of healthy individuals
|
|||||
| Violin Diagram of DME Disease-specific Protein Abundances |
|
Click to View the Clearer Original Diagram | |||
| ICD-11: 4B04 | Monocyte count disorder | Click to Show/Hide | |||
| The Studied Tissue | Whole blood | ||||
| The Specified Disease | Autosomal dominant monocytopenia [ICD-11:4B04] | ||||
| The Expression Level of Disease Section Compare with the Healthy Individual Tissue | p-value: 9.88E-01; Fold-change: 9.39E-03; Z-score: 5.98E-02 | ||||
|
DME expression in the diseased tissue of patients
DME expression in the normal tissue of healthy individuals
|
|||||
| Violin Diagram of DME Disease-specific Protein Abundances |
|
Click to View the Clearer Original Diagram | |||
| ICD Disease Classification 05 | Endocrine/nutritional/metabolic disease | Click to Show/Hide | |||
| ICD-11: 5A11 | Type 2 diabetes mellitus | Click to Show/Hide | |||
| The Studied Tissue | Omental adipose tissue | ||||
| The Specified Disease | Obesity related type 2 diabetes [ICD-11:5A11] | ||||
| The Expression Level of Disease Section Compare with the Healthy Individual Tissue | p-value: 9.28E-01; Fold-change: 1.08E-03; Z-score: 1.09E-03 | ||||
|
DME expression in the diseased tissue of patients
DME expression in the normal tissue of healthy individuals
|
|||||
| Violin Diagram of DME Disease-specific Protein Abundances |
|
Click to View the Clearer Original Diagram | |||
| The Studied Tissue | Liver tissue | ||||
| The Specified Disease | Type 2 diabetes [ICD-11:5A11] | ||||
| The Expression Level of Disease Section Compare with the Healthy Individual Tissue | p-value: 8.04E-01; Fold-change: -7.27E-02; Z-score: -7.70E-02 | ||||
|
DME expression in the diseased tissue of patients
DME expression in the normal tissue of healthy individuals
|
|||||
| Violin Diagram of DME Disease-specific Protein Abundances |
|
Click to View the Clearer Original Diagram | |||
| ICD-11: 5A80 | Ovarian dysfunction | Click to Show/Hide | |||
| The Studied Tissue | Vastus lateralis muscle | ||||
| The Specified Disease | Polycystic ovary syndrome [ICD-11:5A80.1] | ||||
| The Expression Level of Disease Section Compare with the Healthy Individual Tissue | p-value: 4.04E-01; Fold-change: -4.19E-02; Z-score: -2.80E-01 | ||||
|
DME expression in the diseased tissue of patients
DME expression in the normal tissue of healthy individuals
|
|||||
| Violin Diagram of DME Disease-specific Protein Abundances |
|
Click to View the Clearer Original Diagram | |||
| ICD-11: 5C51 | Inborn carbohydrate metabolism disorder | Click to Show/Hide | |||
| The Studied Tissue | Biceps muscle | ||||
| The Specified Disease | Pompe disease [ICD-11:5C51.3] | ||||
| The Expression Level of Disease Section Compare with the Healthy Individual Tissue | p-value: 1.37E-06; Fold-change: 1.73E+00; Z-score: 4.27E+00 | ||||
|
DME expression in the diseased tissue of patients
DME expression in the normal tissue of healthy individuals
|
|||||
| Violin Diagram of DME Disease-specific Protein Abundances |
|
Click to View the Clearer Original Diagram | |||
| ICD-11: 5C56 | Lysosomal disease | Click to Show/Hide | |||
| The Studied Tissue | Whole blood | ||||
| The Specified Disease | Batten disease [ICD-11:5C56.1] | ||||
| The Expression Level of Disease Section Compare with the Healthy Individual Tissue | p-value: 3.48E-01; Fold-change: 2.98E-01; Z-score: 2.54E+00 | ||||
|
DME expression in the diseased tissue of patients
DME expression in the normal tissue of healthy individuals
|
|||||
| Violin Diagram of DME Disease-specific Protein Abundances |
|
Click to View the Clearer Original Diagram | |||
| ICD-11: 5C80 | Hyperlipoproteinaemia | Click to Show/Hide | |||
| The Studied Tissue | Peripheral blood | ||||
| The Specified Disease | Familial hypercholesterolemia [ICD-11:5C80.00] | ||||
| The Expression Level of Disease Section Compare with the Healthy Individual Tissue | p-value: 8.42E-01; Fold-change: 1.05E-01; Z-score: 5.08E-01 | ||||
|
DME expression in the diseased tissue of patients
DME expression in the normal tissue of healthy individuals
|
|||||
| Violin Diagram of DME Disease-specific Protein Abundances |
|
Click to View the Clearer Original Diagram | |||
| The Studied Tissue | Whole blood | ||||
| The Specified Disease | Familial hypercholesterolemia [ICD-11:5C80.00] | ||||
| The Expression Level of Disease Section Compare with the Healthy Individual Tissue | p-value: 2.91E-02; Fold-change: -1.85E-01; Z-score: -7.78E-01 | ||||
|
DME expression in the diseased tissue of patients
DME expression in the normal tissue of healthy individuals
|
|||||
| Violin Diagram of DME Disease-specific Protein Abundances |
|
Click to View the Clearer Original Diagram | |||
| ICD Disease Classification 06 | Mental/behavioural/neurodevelopmental disorder | Click to Show/Hide | |||
| ICD-11: 6A02 | Autism spectrum disorder | Click to Show/Hide | |||
| The Studied Tissue | Whole blood | ||||
| The Specified Disease | Autism [ICD-11:6A02] | ||||
| The Expression Level of Disease Section Compare with the Healthy Individual Tissue | p-value: 4.47E-01; Fold-change: -1.75E-02; Z-score: -6.69E-02 | ||||
|
DME expression in the diseased tissue of patients
DME expression in the normal tissue of healthy individuals
|
|||||
| Violin Diagram of DME Disease-specific Protein Abundances |
|
Click to View the Clearer Original Diagram | |||
| ICD-11: 6A20 | Schizophrenia | Click to Show/Hide | |||
| The Studied Tissue | Prefrontal cortex | ||||
| The Specified Disease | Schizophrenia [ICD-11:6A20] | ||||
| The Expression Level of Disease Section Compare with the Healthy Individual Tissue | p-value: 3.39E-01; Fold-change: 8.45E-03; Z-score: 2.42E-02 | ||||
|
DME expression in the diseased tissue of patients
DME expression in the normal tissue of healthy individuals
|
|||||
| Violin Diagram of DME Disease-specific Protein Abundances |
|
Click to View the Clearer Original Diagram | |||
| The Studied Tissue | Superior temporal cortex | ||||
| The Specified Disease | Schizophrenia [ICD-11:6A20] | ||||
| The Expression Level of Disease Section Compare with the Healthy Individual Tissue | p-value: 4.47E-01; Fold-change: -6.32E-02; Z-score: -3.49E-01 | ||||
|
DME expression in the diseased tissue of patients
DME expression in the normal tissue of healthy individuals
|
|||||
| Violin Diagram of DME Disease-specific Protein Abundances |
|
Click to View the Clearer Original Diagram | |||
| ICD-11: 6A60 | Bipolar disorder | Click to Show/Hide | |||
| The Studied Tissue | Prefrontal cortex | ||||
| The Specified Disease | Bipolar disorder [ICD-11:6A60-6A6Z] | ||||
| The Expression Level of Disease Section Compare with the Healthy Individual Tissue | p-value: 4.78E-01; Fold-change: -3.35E-02; Z-score: -1.84E-01 | ||||
|
DME expression in the diseased tissue of patients
DME expression in the normal tissue of healthy individuals
|
|||||
| Violin Diagram of DME Disease-specific Protein Abundances |
|
Click to View the Clearer Original Diagram | |||
| ICD-11: 6A70 | Depressive disorder | Click to Show/Hide | |||
| The Studied Tissue | Whole blood | ||||
| The Specified Disease | Major depressive disorder [ICD-11:6A70-6A7Z] | ||||
| The Expression Level of Disease Section Compare with the Healthy Individual Tissue | p-value: 2.79E-02; Fold-change: 1.40E-02; Z-score: 6.93E-02 | ||||
|
DME expression in the diseased tissue of patients
DME expression in the normal tissue of healthy individuals
|
|||||
| Violin Diagram of DME Disease-specific Protein Abundances |
|
Click to View the Clearer Original Diagram | |||
| The Studied Tissue | Hippocampus | ||||
| The Specified Disease | Major depressive disorder [ICD-11:6A70-6A7Z] | ||||
| The Expression Level of Disease Section Compare with the Healthy Individual Tissue | p-value: 9.33E-02; Fold-change: 6.69E-02; Z-score: 4.37E-01 | ||||
|
DME expression in the diseased tissue of patients
DME expression in the normal tissue of healthy individuals
|
|||||
| Violin Diagram of DME Disease-specific Protein Abundances |
|
Click to View the Clearer Original Diagram | |||
| ICD Disease Classification 08 | Nervous system disease | Click to Show/Hide | |||
| ICD-11: 8A00 | Parkinsonism | Click to Show/Hide | |||
| The Studied Tissue | Substantia nigra tissue | ||||
| The Specified Disease | Parkinson's disease [ICD-11:8A00.0] | ||||
| The Expression Level of Disease Section Compare with the Healthy Individual Tissue | p-value: 7.97E-01; Fold-change: -1.77E-02; Z-score: -7.19E-02 | ||||
|
DME expression in the diseased tissue of patients
DME expression in the normal tissue of healthy individuals
|
|||||
| Violin Diagram of DME Disease-specific Protein Abundances |
|
Click to View the Clearer Original Diagram | |||
| ICD-11: 8A01 | Choreiform disorder | Click to Show/Hide | |||
| The Studied Tissue | Whole blood | ||||
| The Specified Disease | Huntington's disease [ICD-11:8A01.10] | ||||
| The Expression Level of Disease Section Compare with the Healthy Individual Tissue | p-value: 5.82E-01; Fold-change: 0.00E+00; Z-score: 0.00E+00 | ||||
|
DME expression in the diseased tissue of patients
DME expression in the normal tissue of healthy individuals
|
|||||
| Violin Diagram of DME Disease-specific Protein Abundances |
|
Click to View the Clearer Original Diagram | |||
| ICD-11: 8A20 | Alzheimer disease | Click to Show/Hide | |||
| The Studied Tissue | Entorhinal cortex | ||||
| The Specified Disease | Alzheimer's disease [ICD-11:8A20] | ||||
| The Expression Level of Disease Section Compare with the Healthy Individual Tissue | p-value: 8.10E-02; Fold-change: -4.35E-02; Z-score: -1.89E-01 | ||||
|
DME expression in the diseased tissue of patients
DME expression in the normal tissue of healthy individuals
|
|||||
| Violin Diagram of DME Disease-specific Protein Abundances |

|
Click to View the Clearer Original Diagram | |||
| ICD-11: 8A2Y | Neurocognitive impairment | Click to Show/Hide | |||
| The Studied Tissue | White matter tissue | ||||
| The Specified Disease | HIV-associated neurocognitive impairment [ICD-11:8A2Y-8A2Z] | ||||
| The Expression Level of Disease Section Compare with the Healthy Individual Tissue | p-value: 3.45E-01; Fold-change: -7.95E-02; Z-score: -2.61E-01 | ||||
|
DME expression in the diseased tissue of patients
DME expression in the normal tissue of healthy individuals
|
|||||
| Violin Diagram of DME Disease-specific Protein Abundances |
|
Click to View the Clearer Original Diagram | |||
| ICD-11: 8A40 | Multiple sclerosis | Click to Show/Hide | |||
| The Studied Tissue | Plasmacytoid dendritic cells | ||||
| The Specified Disease | Multiple sclerosis [ICD-11:8A40] | ||||
| The Expression Level of Disease Section Compare with the Healthy Individual Tissue | p-value: 1.46E-01; Fold-change: -1.45E-01; Z-score: -5.59E-01 | ||||
|
DME expression in the diseased tissue of patients
DME expression in the normal tissue of healthy individuals
|
|||||
| Violin Diagram of DME Disease-specific Protein Abundances |
|
Click to View the Clearer Original Diagram | |||
| The Studied Tissue | Spinal cord | ||||
| The Specified Disease | Multiple sclerosis [ICD-11:8A40] | ||||
| The Expression Level of Disease Section Compare with the Adjacent Tissue | p-value: 6.54E-01; Fold-change: -9.82E-02; Z-score: -5.81E-01 | ||||
|
DME expression in the diseased tissue of patients
DME expression in the normal tissue adjacent to the diseased tissue of patients
|
|||||
| Violin Diagram of DME Disease-specific Protein Abundances |
|
Click to View the Clearer Original Diagram | |||
| ICD-11: 8A60 | Epilepsy | Click to Show/Hide | |||
| The Studied Tissue | Peritumoral cortex tissue | ||||
| The Specified Disease | Epilepsy [ICD-11:8A60-8A6Z] | ||||
| The Expression Level of Disease Section Compare with the Other Disease Section | p-value: 7.79E-01; Fold-change: 2.30E-01; Z-score: 3.36E-01 | ||||
|
DME expression in the diseased tissue of patients
DME expression in tissue other than the diseased tissue of patients
|
|||||
| Violin Diagram of DME Disease-specific Protein Abundances |
|
Click to View the Clearer Original Diagram | |||
| The Studied Tissue | Whole blood | ||||
| The Specified Disease | Seizure [ICD-11:8A60-8A6Z] | ||||
| The Expression Level of Disease Section Compare with the Healthy Individual Tissue | p-value: 1.76E-01; Fold-change: -1.54E-01; Z-score: -5.36E-01 | ||||
|
DME expression in the diseased tissue of patients
DME expression in the normal tissue of healthy individuals
|
|||||
| Violin Diagram of DME Disease-specific Protein Abundances |
|
Click to View the Clearer Original Diagram | |||
| ICD-11: 8B01 | Subarachnoid haemorrhage | Click to Show/Hide | |||
| The Studied Tissue | Intracranial artery | ||||
| The Specified Disease | Intracranial aneurysm [ICD-11:8B01.0] | ||||
| The Expression Level of Disease Section Compare with the Healthy Individual Tissue | p-value: 5.72E-01; Fold-change: -8.72E-01; Z-score: -9.81E-01 | ||||
|
DME expression in the diseased tissue of patients
DME expression in the normal tissue of healthy individuals
|
|||||
| Violin Diagram of DME Disease-specific Protein Abundances |
|
Click to View the Clearer Original Diagram | |||
| ICD-11: 8B11 | Cerebral ischaemic stroke | Click to Show/Hide | |||
| The Studied Tissue | Whole blood | ||||
| The Specified Disease | Cardioembolic stroke [ICD-11:8B11.20] | ||||
| The Expression Level of Disease Section Compare with the Healthy Individual Tissue | p-value: 4.74E-01; Fold-change: -5.06E-02; Z-score: -2.31E-01 | ||||
|
DME expression in the diseased tissue of patients
DME expression in the normal tissue of healthy individuals
|
|||||
| Violin Diagram of DME Disease-specific Protein Abundances |
|
Click to View the Clearer Original Diagram | |||
| The Studied Tissue | Peripheral blood | ||||
| The Specified Disease | Ischemic stroke [ICD-11:8B11] | ||||
| The Expression Level of Disease Section Compare with the Healthy Individual Tissue | p-value: 6.59E-02; Fold-change: 1.61E-01; Z-score: 7.16E-01 | ||||
|
DME expression in the diseased tissue of patients
DME expression in the normal tissue of healthy individuals
|
|||||
| Violin Diagram of DME Disease-specific Protein Abundances |
|
Click to View the Clearer Original Diagram | |||
| ICD-11: 8B60 | Motor neuron disease | Click to Show/Hide | |||
| The Studied Tissue | Skin | ||||
| The Specified Disease | Lateral sclerosis [ICD-11:8B60.4] | ||||
| The Expression Level of Disease Section Compare with the Healthy Individual Tissue | p-value: 1.19E-01; Fold-change: 1.82E-01; Z-score: 1.71E+00 | ||||
|
DME expression in the diseased tissue of patients
DME expression in the normal tissue of healthy individuals
|
|||||
| Violin Diagram of DME Disease-specific Protein Abundances |
|
Click to View the Clearer Original Diagram | |||
| The Studied Tissue | Cervical spinal cord | ||||
| The Specified Disease | Lateral sclerosis [ICD-11:8B60.4] | ||||
| The Expression Level of Disease Section Compare with the Healthy Individual Tissue | p-value: 7.69E-01; Fold-change: 1.40E-02; Z-score: 5.26E-02 | ||||
|
DME expression in the diseased tissue of patients
DME expression in the normal tissue of healthy individuals
|
|||||
| Violin Diagram of DME Disease-specific Protein Abundances |
|
Click to View the Clearer Original Diagram | |||
| ICD-11: 8C70 | Muscular dystrophy | Click to Show/Hide | |||
| The Studied Tissue | Muscle tissue | ||||
| The Specified Disease | Myopathy [ICD-11:8C70.6] | ||||
| The Expression Level of Disease Section Compare with the Healthy Individual Tissue | p-value: 9.10E-04; Fold-change: 3.79E-01; Z-score: 1.13E+00 | ||||
|
DME expression in the diseased tissue of patients
DME expression in the normal tissue of healthy individuals
|
|||||
| Violin Diagram of DME Disease-specific Protein Abundances |
|
Click to View the Clearer Original Diagram | |||
| ICD-11: 8C75 | Distal myopathy | Click to Show/Hide | |||
| The Studied Tissue | Muscle tissue | ||||
| The Specified Disease | Tibial muscular dystrophy [ICD-11:8C75] | ||||
| The Expression Level of Disease Section Compare with the Healthy Individual Tissue | p-value: 2.14E-16; Fold-change: 3.41E+00; Z-score: 8.17E+00 | ||||
|
DME expression in the diseased tissue of patients
DME expression in the normal tissue of healthy individuals
|
|||||
| Violin Diagram of DME Disease-specific Protein Abundances |
|
Click to View the Clearer Original Diagram | |||
| ICD Disease Classification 09 | Visual system disease | Click to Show/Hide | |||
| ICD-11: 9A96 | Anterior uveitis | Click to Show/Hide | |||
| The Studied Tissue | Peripheral monocyte | ||||
| The Specified Disease | Autoimmune uveitis [ICD-11:9A96] | ||||
| The Expression Level of Disease Section Compare with the Healthy Individual Tissue | p-value: 1.75E-01; Fold-change: -8.54E-02; Z-score: -3.24E-01 | ||||
|
DME expression in the diseased tissue of patients
DME expression in the normal tissue of healthy individuals
|
|||||
| Violin Diagram of DME Disease-specific Protein Abundances |
|
Click to View the Clearer Original Diagram | |||
| ICD Disease Classification 11 | Circulatory system disease | Click to Show/Hide | |||
| ICD-11: BA41 | Myocardial infarction | Click to Show/Hide | |||
| The Studied Tissue | Peripheral blood | ||||
| The Specified Disease | Myocardial infarction [ICD-11:BA41-BA50] | ||||
| The Expression Level of Disease Section Compare with the Healthy Individual Tissue | p-value: 5.58E-01; Fold-change: 8.79E-02; Z-score: 1.43E-01 | ||||
|
DME expression in the diseased tissue of patients
DME expression in the normal tissue of healthy individuals
|
|||||
| Violin Diagram of DME Disease-specific Protein Abundances |
|
Click to View the Clearer Original Diagram | |||
| ICD-11: BA80 | Coronary artery disease | Click to Show/Hide | |||
| The Studied Tissue | Peripheral blood | ||||
| The Specified Disease | Coronary artery disease [ICD-11:BA80-BA8Z] | ||||
| The Expression Level of Disease Section Compare with the Healthy Individual Tissue | p-value: 7.31E-01; Fold-change: -9.76E-02; Z-score: -3.14E-01 | ||||
|
DME expression in the diseased tissue of patients
DME expression in the normal tissue of healthy individuals
|
|||||
| Violin Diagram of DME Disease-specific Protein Abundances |
|
Click to View the Clearer Original Diagram | |||
| ICD-11: BB70 | Aortic valve stenosis | Click to Show/Hide | |||
| The Studied Tissue | Calcified aortic valve | ||||
| The Specified Disease | Aortic stenosis [ICD-11:BB70] | ||||
| The Expression Level of Disease Section Compare with the Healthy Individual Tissue | p-value: 3.10E-01; Fold-change: 1.14E-01; Z-score: 1.20E-01 | ||||
|
DME expression in the diseased tissue of patients
DME expression in the normal tissue of healthy individuals
|
|||||
| Violin Diagram of DME Disease-specific Protein Abundances |
|
Click to View the Clearer Original Diagram | |||
| ICD Disease Classification 12 | Respiratory system disease | Click to Show/Hide | |||
| ICD-11: 7A40 | Central sleep apnoea | Click to Show/Hide | |||
| The Studied Tissue | Hyperplastic tonsil | ||||
| The Specified Disease | Apnea [ICD-11:7A40] | ||||
| The Expression Level of Disease Section Compare with the Healthy Individual Tissue | p-value: 1.02E-01; Fold-change: 1.46E+00; Z-score: 1.07E+00 | ||||
|
DME expression in the diseased tissue of patients
DME expression in the normal tissue of healthy individuals
|
|||||
| Violin Diagram of DME Disease-specific Protein Abundances |
|
Click to View the Clearer Original Diagram | |||
| ICD-11: CA08 | Vasomotor or allergic rhinitis | Click to Show/Hide | |||
| The Studied Tissue | Peripheral blood | ||||
| The Specified Disease | Olive pollen allergy [ICD-11:CA08.00] | ||||
| The Expression Level of Disease Section Compare with the Healthy Individual Tissue | p-value: 1.74E-01; Fold-change: 5.47E-02; Z-score: 1.59E+00 | ||||
|
DME expression in the diseased tissue of patients
DME expression in the normal tissue of healthy individuals
|
|||||
| Violin Diagram of DME Disease-specific Protein Abundances |
|
Click to View the Clearer Original Diagram | |||
| ICD-11: CA0A | Chronic rhinosinusitis | Click to Show/Hide | |||
| The Studied Tissue | Sinus mucosa tissue | ||||
| The Specified Disease | Chronic rhinosinusitis [ICD-11:CA0A] | ||||
| The Expression Level of Disease Section Compare with the Healthy Individual Tissue | p-value: 5.43E-03; Fold-change: -9.23E-01; Z-score: -1.11E+00 | ||||
|
DME expression in the diseased tissue of patients
DME expression in the normal tissue of healthy individuals
|
|||||
| Violin Diagram of DME Disease-specific Protein Abundances |
|
Click to View the Clearer Original Diagram | |||
| ICD-11: CA22 | Chronic obstructive pulmonary disease | Click to Show/Hide | |||
| The Studied Tissue | Lung tissue | ||||
| The Specified Disease | Chronic obstructive pulmonary disease [ICD-11:CA22] | ||||
| The Expression Level of Disease Section Compare with the Healthy Individual Tissue | p-value: 4.66E-01; Fold-change: -2.71E-01; Z-score: -3.23E-01 | ||||
|
DME expression in the diseased tissue of patients
DME expression in the normal tissue of healthy individuals
|
|||||
| Violin Diagram of DME Disease-specific Protein Abundances |
|
Click to View the Clearer Original Diagram | |||
| The Studied Tissue | Small airway epithelium | ||||
| The Specified Disease | Chronic obstructive pulmonary disease [ICD-11:CA22] | ||||
| The Expression Level of Disease Section Compare with the Healthy Individual Tissue | p-value: 2.75E-02; Fold-change: -8.84E-02; Z-score: -3.04E-01 | ||||
|
DME expression in the diseased tissue of patients
DME expression in the normal tissue of healthy individuals
|
|||||
| Violin Diagram of DME Disease-specific Protein Abundances |
|
Click to View the Clearer Original Diagram | |||
| ICD-11: CA23 | Asthma | Click to Show/Hide | |||
| The Studied Tissue | Nasal and bronchial airway | ||||
| The Specified Disease | Asthma [ICD-11:CA23] | ||||
| The Expression Level of Disease Section Compare with the Healthy Individual Tissue | p-value: 8.93E-01; Fold-change: -7.60E-02; Z-score: -1.09E-01 | ||||
|
DME expression in the diseased tissue of patients
DME expression in the normal tissue of healthy individuals
|
|||||
| Violin Diagram of DME Disease-specific Protein Abundances |
|
Click to View the Clearer Original Diagram | |||
| ICD-11: CB03 | Idiopathic interstitial pneumonitis | Click to Show/Hide | |||
| The Studied Tissue | Lung tissue | ||||
| The Specified Disease | Idiopathic pulmonary fibrosis [ICD-11:CB03.4] | ||||
| The Expression Level of Disease Section Compare with the Healthy Individual Tissue | p-value: 7.05E-04; Fold-change: 1.08E+00; Z-score: 2.40E+00 | ||||
|
DME expression in the diseased tissue of patients
DME expression in the normal tissue of healthy individuals
|
|||||
| Violin Diagram of DME Disease-specific Protein Abundances |
|
Click to View the Clearer Original Diagram | |||
| ICD Disease Classification 13 | Digestive system disease | Click to Show/Hide | |||
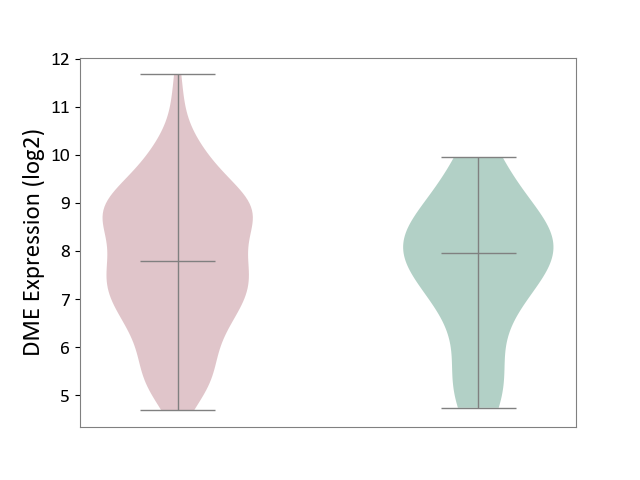
| ICD-11: DA0C | Periodontal disease | Click to Show/Hide | |||
| The Studied Tissue | Gingival tissue | ||||
| The Specified Disease | Periodontal disease [ICD-11:DA0C] | ||||
| The Expression Level of Disease Section Compare with the Adjacent Tissue | p-value: 2.47E-07; Fold-change: 7.14E-01; Z-score: 9.51E-01 | ||||
|
DME expression in the diseased tissue of patients
DME expression in the normal tissue adjacent to the diseased tissue of patients
|
|||||
| Violin Diagram of DME Disease-specific Protein Abundances |
|
Click to View the Clearer Original Diagram | |||
| ICD-11: DA42 | Gastritis | Click to Show/Hide | |||
| The Studied Tissue | Gastric antrum tissue | ||||
| The Specified Disease | Eosinophilic gastritis [ICD-11:DA42.2] | ||||
| The Expression Level of Disease Section Compare with the Adjacent Tissue | p-value: 7.46E-01; Fold-change: 6.67E-02; Z-score: 3.99E-01 | ||||
|
DME expression in the diseased tissue of patients
DME expression in the normal tissue adjacent to the diseased tissue of patients
|
|||||
| Violin Diagram of DME Disease-specific Protein Abundances |
|
Click to View the Clearer Original Diagram | |||
| ICD-11: DB92 | Non-alcoholic fatty liver disease | Click to Show/Hide | |||
| The Studied Tissue | Liver tissue | ||||
| The Specified Disease | Non-alcoholic fatty liver disease [ICD-11:DB92] | ||||
| The Expression Level of Disease Section Compare with the Healthy Individual Tissue | p-value: 5.13E-03; Fold-change: 5.22E-01; Z-score: 2.51E+00 | ||||
|
DME expression in the diseased tissue of patients
DME expression in the normal tissue of healthy individuals
|
|||||
| Violin Diagram of DME Disease-specific Protein Abundances |
|
Click to View the Clearer Original Diagram | |||
| ICD-11: DB99 | Hepatic failure | Click to Show/Hide | |||
| The Studied Tissue | Liver tissue | ||||
| The Specified Disease | Liver failure [ICD-11:DB99.7-DB99.8] | ||||
| The Expression Level of Disease Section Compare with the Healthy Individual Tissue | p-value: 1.29E-01; Fold-change: 5.68E-01; Z-score: 8.92E-01 | ||||
|
DME expression in the diseased tissue of patients
DME expression in the normal tissue of healthy individuals
|
|||||
| Violin Diagram of DME Disease-specific Protein Abundances |
|
Click to View the Clearer Original Diagram | |||
| ICD-11: DD71 | Ulcerative colitis | Click to Show/Hide | |||
| The Studied Tissue | Colon mucosal tissue | ||||
| The Specified Disease | Ulcerative colitis [ICD-11:DD71] | ||||
| The Expression Level of Disease Section Compare with the Adjacent Tissue | p-value: 1.15E-01; Fold-change: 1.98E-01; Z-score: 6.11E-01 | ||||
|
DME expression in the diseased tissue of patients
DME expression in tissue other than the diseased tissue of patients
|
|||||
| Violin Diagram of DME Disease-specific Protein Abundances |
|
Click to View the Clearer Original Diagram | |||
| ICD-11: DD91 | Irritable bowel syndrome | Click to Show/Hide | |||
| The Studied Tissue | Rectal colon tissue | ||||
| The Specified Disease | Irritable bowel syndrome [ICD-11:DD91.0] | ||||
| The Expression Level of Disease Section Compare with the Healthy Individual Tissue | p-value: 4.44E-01; Fold-change: -1.81E-02; Z-score: -6.24E-02 | ||||
|
DME expression in the diseased tissue of patients
DME expression in the normal tissue of healthy individuals
|
|||||
| Violin Diagram of DME Disease-specific Protein Abundances |
|
Click to View the Clearer Original Diagram | |||
| ICD Disease Classification 14 | Skin disease | Click to Show/Hide | |||
| ICD-11: EA80 | Atopic eczema | Click to Show/Hide | |||
| The Studied Tissue | Skin | ||||
| The Specified Disease | Atopic dermatitis [ICD-11:EA80] | ||||
| The Expression Level of Disease Section Compare with the Healthy Individual Tissue | p-value: 9.17E-01; Fold-change: -5.61E-02; Z-score: -1.60E-01 | ||||
|
DME expression in the diseased tissue of patients
DME expression in the normal tissue of healthy individuals
|
|||||
| Violin Diagram of DME Disease-specific Protein Abundances |
|
Click to View the Clearer Original Diagram | |||
| ICD-11: EA90 | Psoriasis | Click to Show/Hide | |||
| The Studied Tissue | Skin | ||||
| The Specified Disease | Psoriasis [ICD-11:EA90] | ||||
| The Expression Level of Disease Section Compare with the Healthy Individual Tissue | p-value: 2.56E-09; Fold-change: 6.04E-01; Z-score: 9.96E-01 | ||||
| The Expression Level of Disease Section Compare with the Adjacent Tissue | p-value: 3.54E-05; Fold-change: 5.10E-01; Z-score: 6.42E-01 | ||||
|
DME expression in the diseased tissue of patients
DME expression in the normal tissue adjacent to the diseased tissue of patients
DME expression in the normal tissue of healthy individuals
|
|||||
| Violin Diagram of DME Disease-specific Protein Abundances |
|
Click to View the Clearer Original Diagram | |||
| ICD-11: ED63 | Acquired hypomelanotic disorder | Click to Show/Hide | |||
| The Studied Tissue | Skin | ||||
| The Specified Disease | Vitiligo [ICD-11:ED63.0] | ||||
| The Expression Level of Disease Section Compare with the Healthy Individual Tissue | p-value: 1.18E-01; Fold-change: -7.39E-01; Z-score: -1.07E+00 | ||||
|
DME expression in the diseased tissue of patients
DME expression in the normal tissue of healthy individuals
|
|||||
| Violin Diagram of DME Disease-specific Protein Abundances |
|
Click to View the Clearer Original Diagram | |||
| ICD-11: ED70 | Alopecia or hair loss | Click to Show/Hide | |||
| The Studied Tissue | Skin from scalp | ||||
| The Specified Disease | Alopecia [ICD-11:ED70] | ||||
| The Expression Level of Disease Section Compare with the Healthy Individual Tissue | p-value: 1.36E-01; Fold-change: 2.25E-01; Z-score: 3.82E-01 | ||||
|
DME expression in the diseased tissue of patients
DME expression in the normal tissue of healthy individuals
|
|||||
| Violin Diagram of DME Disease-specific Protein Abundances |
|
Click to View the Clearer Original Diagram | |||
| ICD-11: EK0Z | Contact dermatitis | Click to Show/Hide | |||
| The Studied Tissue | Skin | ||||
| The Specified Disease | Sensitive skin [ICD-11:EK0Z] | ||||
| The Expression Level of Disease Section Compare with the Healthy Individual Tissue | p-value: 3.01E-02; Fold-change: -4.40E-01; Z-score: -3.19E+00 | ||||
|
DME expression in the diseased tissue of patients
DME expression in the normal tissue of healthy individuals
|
|||||
| Violin Diagram of DME Disease-specific Protein Abundances |
|
Click to View the Clearer Original Diagram | |||
| ICD Disease Classification 15 | Musculoskeletal system/connective tissue disease | Click to Show/Hide | |||
| ICD-11: FA00 | Osteoarthritis | Click to Show/Hide | |||
| The Studied Tissue | Peripheral blood | ||||
| The Specified Disease | Arthropathy [ICD-11:FA00-FA5Z] | ||||
| The Expression Level of Disease Section Compare with the Healthy Individual Tissue | p-value: 6.00E-01; Fold-change: -1.44E-02; Z-score: -9.01E-02 | ||||
|
DME expression in the diseased tissue of patients
DME expression in the normal tissue of healthy individuals
|
|||||
| Violin Diagram of DME Disease-specific Protein Abundances |
|
Click to View the Clearer Original Diagram | |||
| The Studied Tissue | Synovial tissue | ||||
| The Specified Disease | Osteoarthritis [ICD-11:FA00-FA0Z] | ||||
| The Expression Level of Disease Section Compare with the Healthy Individual Tissue | p-value: 4.17E-01; Fold-change: 6.86E-02; Z-score: 9.23E-02 | ||||
|
DME expression in the diseased tissue of patients
DME expression in the normal tissue of healthy individuals
|
|||||
| Violin Diagram of DME Disease-specific Protein Abundances |
|
Click to View the Clearer Original Diagram | |||
| ICD-11: FA20 | Rheumatoid arthritis | Click to Show/Hide | |||
| The Studied Tissue | Peripheral blood | ||||
| The Specified Disease | Childhood onset rheumatic disease [ICD-11:FA20.Z] | ||||
| The Expression Level of Disease Section Compare with the Healthy Individual Tissue | p-value: 2.16E-02; Fold-change: 1.04E-01; Z-score: 6.07E-01 | ||||
|
DME expression in the diseased tissue of patients
DME expression in the normal tissue of healthy individuals
|
|||||
| Violin Diagram of DME Disease-specific Protein Abundances |
|
Click to View the Clearer Original Diagram | |||
| The Studied Tissue | Synovial tissue | ||||
| The Specified Disease | Rheumatoid arthritis [ICD-11:FA20] | ||||
| The Expression Level of Disease Section Compare with the Healthy Individual Tissue | p-value: 3.00E-02; Fold-change: 8.47E-01; Z-score: 8.08E-01 | ||||
|
DME expression in the diseased tissue of patients
DME expression in the normal tissue of healthy individuals
|
|||||
| Violin Diagram of DME Disease-specific Protein Abundances |
|
Click to View the Clearer Original Diagram | |||
| ICD-11: FA24 | Juvenile idiopathic arthritis | Click to Show/Hide | |||
| The Studied Tissue | Peripheral blood | ||||
| The Specified Disease | Juvenile idiopathic arthritis [ICD-11:FA24] | ||||
| The Expression Level of Disease Section Compare with the Healthy Individual Tissue | p-value: 6.08E-01; Fold-change: -9.70E-02; Z-score: -2.35E-01 | ||||
|
DME expression in the diseased tissue of patients
DME expression in the normal tissue of healthy individuals
|
|||||
| Violin Diagram of DME Disease-specific Protein Abundances |
|
Click to View the Clearer Original Diagram | |||
| ICD-11: FA92 | Inflammatory spondyloarthritis | Click to Show/Hide | |||
| The Studied Tissue | Pheripheral blood | ||||
| The Specified Disease | Ankylosing spondylitis [ICD-11:FA92.0Z] | ||||
| The Expression Level of Disease Section Compare with the Healthy Individual Tissue | p-value: 1.67E-01; Fold-change: 1.51E-01; Z-score: 8.76E-01 | ||||
|
DME expression in the diseased tissue of patients
DME expression in the normal tissue of healthy individuals
|
|||||
| Violin Diagram of DME Disease-specific Protein Abundances |
|
Click to View the Clearer Original Diagram | |||
| ICD-11: FB83 | Low bone mass disorder | Click to Show/Hide | |||
| The Studied Tissue | Bone marrow | ||||
| The Specified Disease | Osteoporosis [ICD-11:FB83.1] | ||||
| The Expression Level of Disease Section Compare with the Healthy Individual Tissue | p-value: 1.21E-01; Fold-change: 1.62E-01; Z-score: 6.89E-01 | ||||
|
DME expression in the diseased tissue of patients
DME expression in the normal tissue of healthy individuals
|
|||||
| Violin Diagram of DME Disease-specific Protein Abundances |
|
Click to View the Clearer Original Diagram | |||
| ICD Disease Classification 16 | Genitourinary system disease | Click to Show/Hide | |||
| ICD-11: GA10 | Endometriosis | Click to Show/Hide | |||
| The Studied Tissue | Endometrium tissue | ||||
| The Specified Disease | Endometriosis [ICD-11:GA10] | ||||
| The Expression Level of Disease Section Compare with the Healthy Individual Tissue | p-value: 9.74E-03; Fold-change: 8.27E-02; Z-score: 1.64E-01 | ||||
|
DME expression in the diseased tissue of patients
DME expression in the normal tissue of healthy individuals
|
|||||
| Violin Diagram of DME Disease-specific Protein Abundances |
|
Click to View the Clearer Original Diagram | |||
| ICD-11: GC00 | Cystitis | Click to Show/Hide | |||
| The Studied Tissue | Bladder tissue | ||||
| The Specified Disease | Interstitial cystitis [ICD-11:GC00.3] | ||||
| The Expression Level of Disease Section Compare with the Healthy Individual Tissue | p-value: 5.10E-04; Fold-change: 1.26E+00; Z-score: 4.79E+00 | ||||
|
DME expression in the diseased tissue of patients
DME expression in the normal tissue of healthy individuals
|
|||||
| Violin Diagram of DME Disease-specific Protein Abundances |
|
Click to View the Clearer Original Diagram | |||
| ICD Disease Classification 19 | Condition originating in perinatal period | Click to Show/Hide | |||
| ICD-11: KA21 | Short gestation disorder | Click to Show/Hide | |||
| The Studied Tissue | Myometrium | ||||
| The Specified Disease | Preterm birth [ICD-11:KA21.4Z] | ||||
| The Expression Level of Disease Section Compare with the Healthy Individual Tissue | p-value: 6.27E-01; Fold-change: -1.44E-01; Z-score: -3.20E-01 | ||||
|
DME expression in the diseased tissue of patients
DME expression in the normal tissue of healthy individuals
|
|||||
| Violin Diagram of DME Disease-specific Protein Abundances |
|
Click to View the Clearer Original Diagram | |||
| ICD Disease Classification 20 | Developmental anomaly | Click to Show/Hide | |||
| ICD-11: LD2C | Overgrowth syndrome | Click to Show/Hide | |||
| The Studied Tissue | Adipose tissue | ||||
| The Specified Disease | Simpson golabi behmel syndrome [ICD-11:LD2C] | ||||
| The Expression Level of Disease Section Compare with the Healthy Individual Tissue | p-value: 7.54E-01; Fold-change: -7.89E-03; Z-score: -4.79E-01 | ||||
|
DME expression in the diseased tissue of patients
DME expression in the normal tissue of healthy individuals
|
|||||
| Violin Diagram of DME Disease-specific Protein Abundances |
|
Click to View the Clearer Original Diagram | |||
| ICD-11: LD2D | Phakomatoses/hamartoneoplastic syndrome | Click to Show/Hide | |||
| The Studied Tissue | Perituberal tissue | ||||
| The Specified Disease | Tuberous sclerosis complex [ICD-11:LD2D.2] | ||||
| The Expression Level of Disease Section Compare with the Healthy Individual Tissue | p-value: 3.13E-01; Fold-change: 5.66E-02; Z-score: 1.97E+00 | ||||
|
DME expression in the diseased tissue of patients
DME expression in the normal tissue of healthy individuals
|
|||||
| Violin Diagram of DME Disease-specific Protein Abundances |
|
Click to View the Clearer Original Diagram | |||
| References | |||||
|---|---|---|---|---|---|
| 1 | Endoxifen and other metabolites of tamoxifen inhibit human hydroxysteroid sulfotransferase 2A1 (hSULT2A1) Drug Metab Dispos. 2014 Nov;42(11):1843-50. doi: 10.1124/dmd.114.059709. | ||||
| 2 | Identification of human cytochrome P450 and flavin-containing monooxygenase enzymes involved in the metabolism of lorcaserin, a novel selective human 5-hydroxytryptamine 2C agonist. Drug Metab Dispos. 2012 Apr;40(4):761-71. | ||||
| 3 | Effects of olopatadine, a new antiallergic agent, on human liver microsomal cytochrome P450 activities Drug Metab Dispos. 2002 Dec;30(12):1504-11. doi: 10.1124/dmd.30.12.1504. | ||||
| 4 | Pharmacokinetics of vandetanib: three phase I studies in healthy subjects Clin Ther. 2012 Jan;34(1):221-37. doi: 10.1016/j.clinthera.2011.11.011. | ||||
| 5 | Estimation of FMO3 Ontogeny by Mechanistic Population Pharmacokinetic Modelling of Risdiplam and Its Impact on Drug-Drug Interactions in Children | ||||
| 6 | PubChem:Risdiplam | ||||
| 7 | Pharmacokinetics of single and multiple escalating doses of dapoxetine in healthy volunteers. Clinical Pharmacology Therapeutics, 2004, 75(2):P32. | ||||
| 8 | The muscarinic receptor antagonist propiverine exhibits (1)-adrenoceptor antagonism in human prostate and porcine trigonum | ||||
| 9 | In vitro hepatic metabolism of cediranib, a potent vascular endothelial growth factor tyrosine kinase inhibitor: interspecies comparison and human enzymology. Drug Metab Dispos. 2010 Oct;38(10):1688-97. | ||||
| 10 | Metabolism and Disposition of a Novel Selective 7 Neuronal Acetylcholine Receptor Agonist ABT-126 in Humans: Characterization of the Major Roles for Flavin-Containing Monooxygenases and UDP-Glucuronosyl Transferase 1A4 and 2B10 in Catalysis | ||||
| 11 | Metabolic map and bioactivation of the anti-tumour drug noscapine | ||||
| 12 | Metabolism and disposition of the dipeptidyl peptidase IV inhibitor teneligliptin in humans | ||||
| 13 | Development of a liquid chromatography/tandem-mass spectrometry assay for the simultaneous determination of teneligliptin and its active metabolite teneligliptin sulfoxide in human plasma | ||||
| 14 | In vitro metabolism of 7 neuronal nicotinic receptor agonist AZD0328 and enzyme identification for its N-oxide metabolite | ||||
| 15 | S-oxidation of (+)-cis-3,5-dimethyl-2-(3-pyridyl)-thiazolidin-4-one hydrochloride by rat hepatic flavin-containing monooxygenase 1 expressed in yeast | ||||
| 16 | Benzydamine N-oxygenation as an index for flavin-containing monooxygenase activity and benzydamine N-demethylation by cytochrome P450 enzymes in liver microsomes from rats, dogs, monkeys, and humans | ||||
| 17 | Human plasma metabolic profiles of benzydamine, a flavin-containing monooxygenase probe substrate, simulated with pharmacokinetic data from control and humanized-liver mice | ||||
| 18 | In vitro metabolism studies of nomifensine monooxygenation pathways: metabolite identification, reaction phenotyping, and bioactivation mechanism | ||||
| 19 | Pharmacokinetics, metabolism, and excretion of the antiviral drug arbidol in humans | ||||
| 20 | Genetic toxicology and toxicokinetics of arecoline and related areca nut compounds: an updated review | ||||
| 21 | Identification of human drug-metabolizing enzymes involved in the metabolism of SNI-2011. Biol Pharm Bull. 2001 Nov;24(11):1263-6. | ||||
| 22 | Metabolism and pharmacokinetics of the anti-tuberculosis drug ethionamide in a flavin-containing monooxygenase null mouse Pharmaceuticals (Basel). 2012;5(11):1147-59. doi: 10.3390/ph5111147. | ||||
| 23 | The metabolism of ethionamide and its sulphoxide J Pharm Pharmacol. 1967 Jan;19(1):1-9. doi: 10.1111/j.2042-7158.1967.tb07986.x. | ||||
| 24 | U. S. FDA Label -Olopatadine | ||||
| 25 | (+)-cis-3,5-dimethyl-2-(3-pyridyl) thiazolidin-4-one hydrochloride (SM-12502) as a novel substrate for cytochrome P450 2A6 in human liver microsomes | ||||
| 26 | A new deleted allele in the human cytochrome P450 2A6 (CYP2A6) gene found in individuals showing poor metabolic capacity to coumarin and (+)-cis-3,5-dimethyl-2-(3-pyridyl)thiazolidin-4-one hydrochloride (SM-12502) | ||||
| 27 | Endoxifen and other metabolites of tamoxifen inhibit human hydroxysteroid sulfotransferase 2A1 (hSULT2A1). Drug Metab Dispos. 2014 Nov;42(11):1843-50. | ||||
| 28 | The tamoxifen dilemma. Carcinogenesis. 1999 Jul;20(7):1153-60. | ||||
| 29 | Oxidation of tamoxifen by human flavin-containing monooxygenase (FMO) 1 and FMO3 to tamoxifen-N-oxide and its novel reduction back to tamoxifen by human cytochromes P450 and hemoglobin Drug Metab Dispos. 2005 Oct;33(10):1446-52. doi: 10.1124/dmd.104.000802. | ||||
| 30 | Identification of Human Enzymes Oxidizing the Anti-Thyroid-Cancer Drug Vandetanib and Explanation of the High Efficiency of Cytochrome P450 3A4 in its Oxidation Int J Mol Sci. 2019 Jul 10;20(14):3392. doi: 10.3390/ijms20143392. | ||||
If you find any error in data or bug in web service, please kindly report it to Dr. Yin and Dr. Li.