

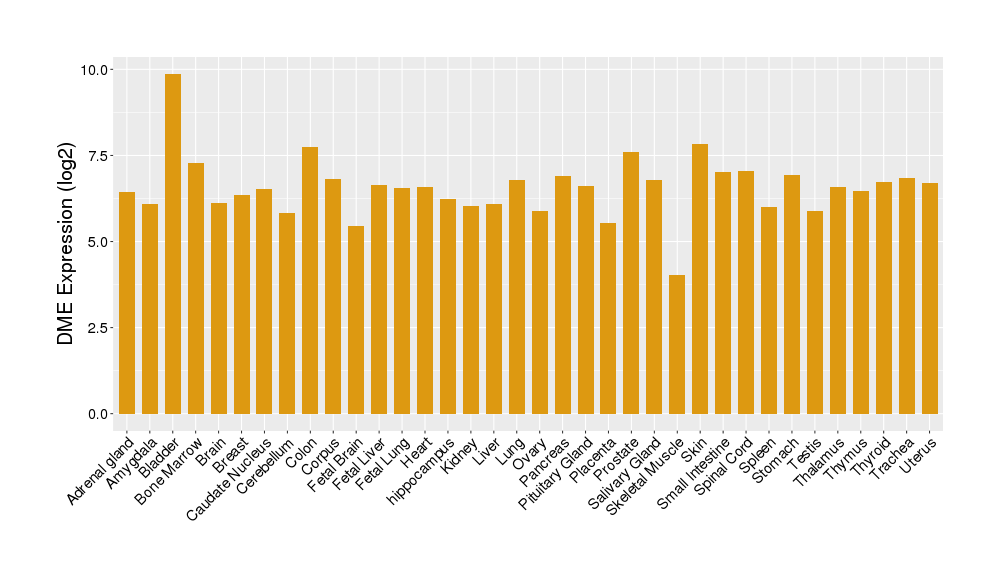
Details of Drug-Metabolizing Enzyme (DME)
| Full List of Drug(s) Metabolized by This DME | |||||
|---|---|---|---|---|---|
| Drugs Approved by FDA | Click to Show/Hide the Full List of Drugs: 26 Drugs | ||||
Thalidomide |
Drug Info | Approved | Breast cancer | ICD11: 2C60 | [1] |
Dronabinol |
Drug Info | Approved | Anorexia nervosa | ICD11: 6B80 | [1] |
Dronabinol |
Drug Info | Approved | Anorexia nervosa | ICD11: 6B80 | [1], [2] |
Rosiglitazone |
Drug Info | Approved | Diabetes mellitus | ICD11: 5A10 | [1] |
Imatinib mesylate |
Drug Info | Approved | Chronic myelogenous leukaemia | ICD11: 2A20 | [1] |
Ifosfamide |
Drug Info | Approved | Lung cancer | ICD11: 2C25 | [1] |
Ifosfamide |
Drug Info | Approved | Lung cancer | ICD11: 2C25 | [3] |
Irbesartan |
Drug Info | Approved | Essential hypertension | ICD11: BA00 | [1] |
Terbinafine hydrochloride |
Drug Info | Approved | Pityriasis versicolor | ICD11: 1F2D | [1] |
Valproic acid |
Drug Info | Approved | Epilepsy | ICD11: 8A60 | [1] |
Pioglitazone hydrochloride |
Drug Info | Approved | Diabetes mellitus | ICD11: 5A10 | [1] |
Trabectedin |
Drug Info | Approved | Leiomyosarcoma | ICD11: 2B58 | [1] |
Carvedilol |
Drug Info | Approved | Congestive heart failure | ICD11: BD10 | [4] |
Diazepam |
Drug Info | Approved | Epilepsy | ICD11: 8A60 | [1] |
Nateglinide |
Drug Info | Approved | Diabetes mellitus | ICD11: 5A10 | [1] |
Rofecoxib |
Drug Info | Approved | Rheumatoid arthritis | ICD11: FA20 | [1] |
Zileuton |
Drug Info | Approved | Asthma | ICD11: CA23 | [1] |
Diphenhydramine |
Drug Info | Approved | Meniere disease | ICD11: AB31 | [1] |
Sulfamethoxazole |
Drug Info | Approved | Infectious cystitis | ICD11: GC00 | [1] |
Zafirlukast |
Drug Info | Approved | Asthma | ICD11: CA23 | [1] |
Candesartan cilexetil |
Drug Info | Approved | Essential hypertension | ICD11: BA00 | [1] |
Etoposide |
Drug Info | Approved | Lung cancer | ICD11: 2C25 | [5] |
Voriconazole |
Drug Info | Approved | Candidiasis | ICD11: 1F23 | [1] |
Dapsone |
Drug Info | Approved | Pneumocystis pneumonia | ICD11: CA40 | [1] |
Eletriptan hydrobromide |
Drug Info | Approved | Migraine | ICD11: 8A80 | [1] |
Nortriptyline hydrochloride |
Drug Info | Approved | Depression | ICD11: 6A71 | [1] |
| Drugs in Phase 4 Clinical Trial | Click to Show/Hide the Full List of Drugs: 5 Drugs | ||||
Ketobemidone |
Drug Info | Phase 4 | Anaesthesia | ICD11: 8E22 | [6] |
Aceclofenac |
Drug Info | Phase 4 | Rheumatoid arthritis | ICD11: FA20 | [7] |
Gamma-linolenic acid |
Drug Info | Phase 4 | Neurodermatitis | ICD11: EA83 | [8] |
Zaltoprofen |
Drug Info | Phase 4 | Anaesthesia | ICD11: 8E22 | [1] |
Zopiclone |
Drug Info | Phase 4 | Insomnia | ICD11: 7A00 | [1] |
| Drugs in Phase 3 Clinical Trial | Click to Show/Hide the Full List of Drugs: 1 Drugs | ||||
SC-411 |
Drug Info | Phase 3 | Alzheimer disease | ICD11: 8A20 | [8] |
| Discontinued/withdrawn Drugs | Click to Show/Hide the Full List of Drugs: 1 Drugs | ||||
ABT-001 |
Drug Info | Discontinued | Asthma | ICD11: CA23 | [1] |
| Preclinical/investigative Agents | Click to Show/Hide the Full List of Drugs: 7 Drugs | ||||
VA-10872 |
Drug Info | Preclinical | Anaesthesia | ICD11: 8E22 | [1] |
Arachidonic acid |
Drug Info | Investigative | Discovery agent | ICD: N.A. | [9] |
BML3-C01 |
Drug Info | Investigative | Discovery agent | ICD: N.A. | [8] |
Eicosadienoic acid |
Drug Info | Investigative | Discovery agent | ICD: N.A. | [8] |
Icosatrienoic acid |
Drug Info | Investigative | Discovery agent | ICD: N.A. | [8] |
Alpha-linolenic acid |
Drug Info | Investigative | Discovery agent | ICD: N.A. | [8] |
Icosapentum |
Drug Info | Investigative | Discovery agent | ICD: N.A. | [8] |
| Experimental Enzyme Kinetic Data of Drugs | Click to Show/Hide the Full List of Drugs: 8 Drugs | ||||
Gamma-linolenic acid |
Drug Info | Phase 4 | Neurodermatitis | Km = 0.0048 microM | [8] |
SC-411 |
Drug Info | Phase 3 | Alzheimer disease | Km = 0.0011 microM | [8] |
Arachidonic acid |
Drug Info | Investigative | Discovery agent | Km = 0.0017 microM | [8] |
BML3-C01 |
Drug Info | Investigative | Discovery agent | Km = 0.0027 microM | [8] |
Eicosadienoic acid |
Drug Info | Investigative | Discovery agent | Km = 0.0052 microM | [8] |
Icosatrienoic acid |
Drug Info | Investigative | Discovery agent | Km = 0.002 microM | [8] |
Alpha-linolenic acid |
Drug Info | Investigative | Discovery agent | Km = 0.0031 microM | [8] |
Icosapentum |
Drug Info | Investigative | Discovery agent | Km = 0.0012 microM | [8] |
| Tissue/Disease-Specific Protein Abundances of This DME | |||||
|---|---|---|---|---|---|
| Tissue-specific Protein Abundances in Healthy Individuals | Click to Show/Hide | ||||
|
|||||
| ICD Disease Classification 01 | Infectious/parasitic disease | Click to Show/Hide | |||
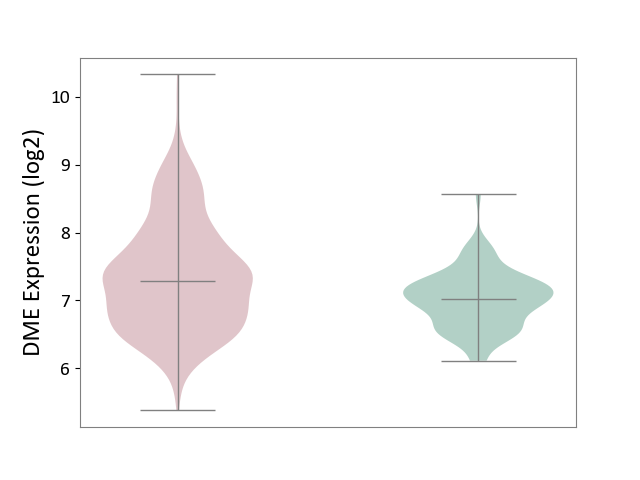
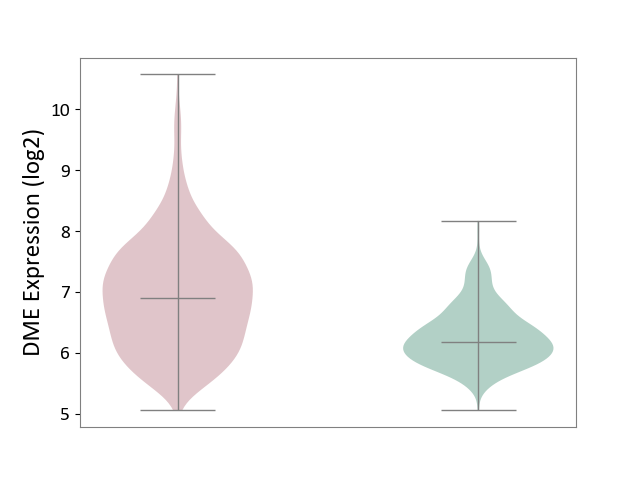
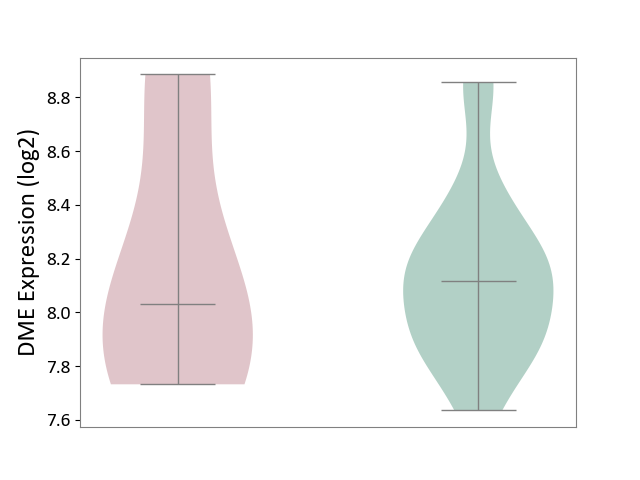
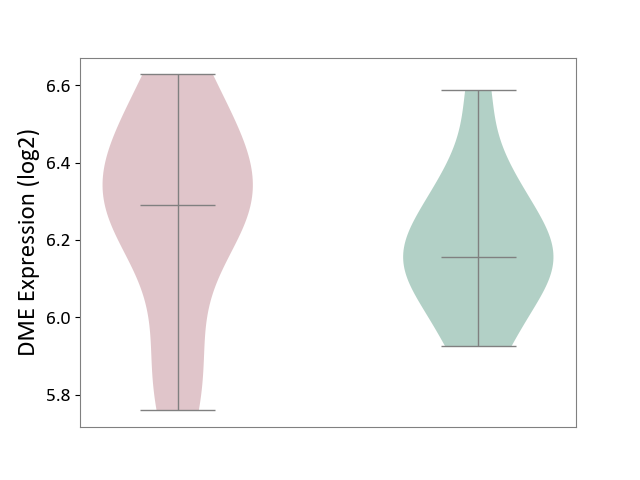
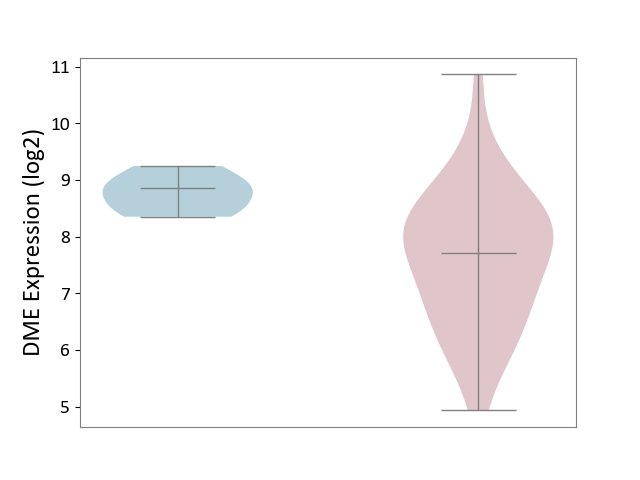
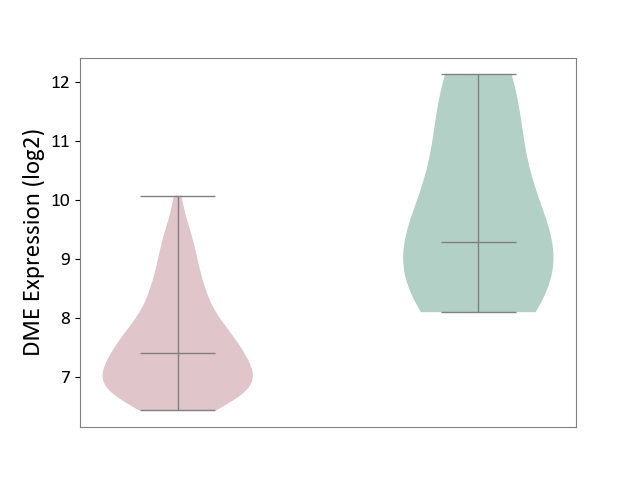
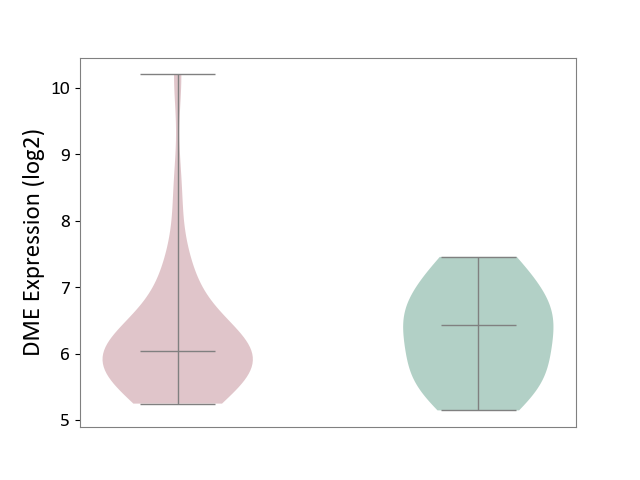
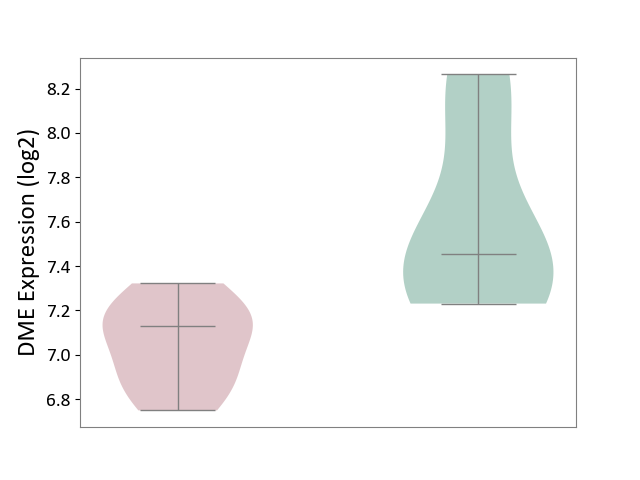
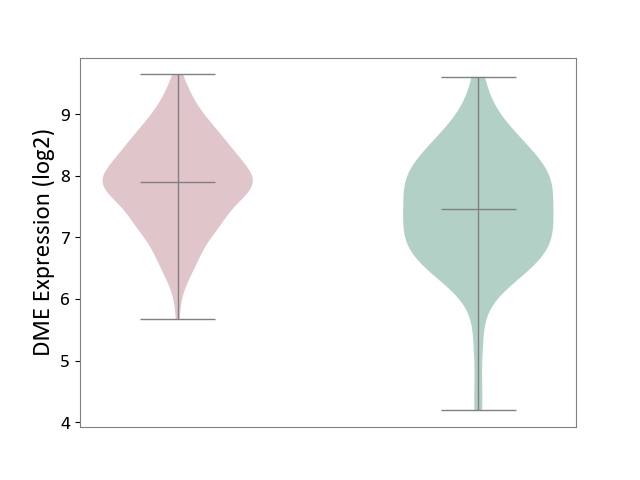
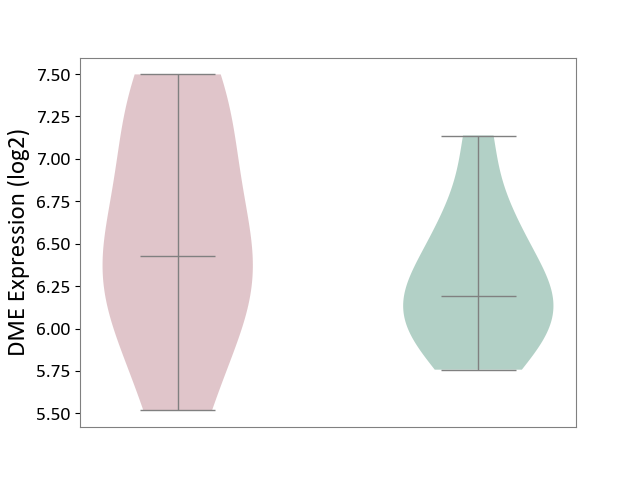
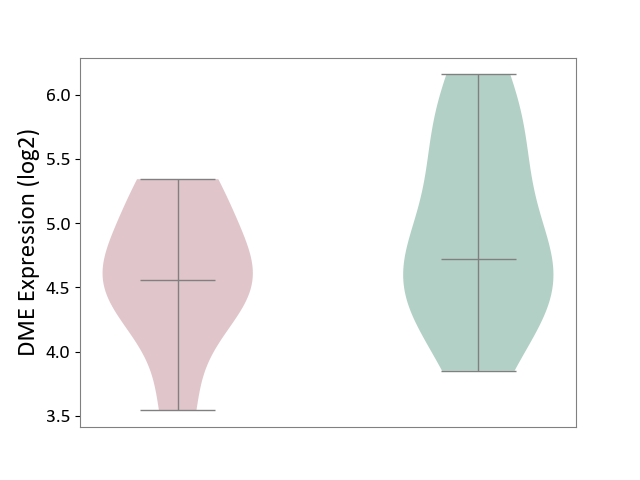
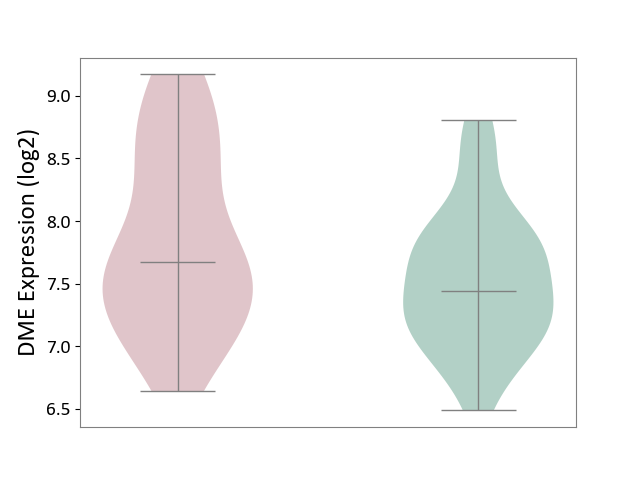
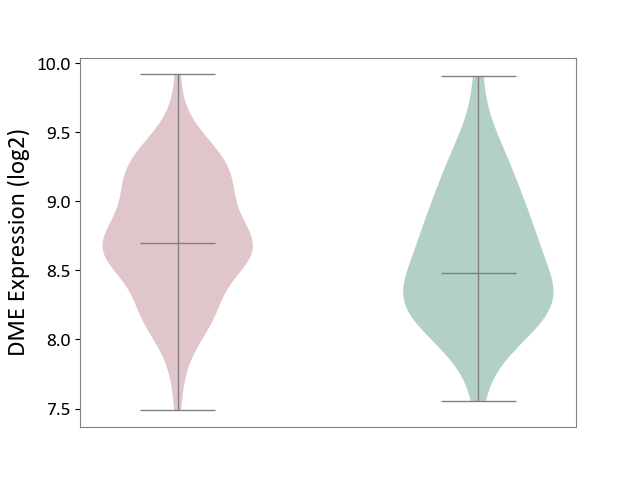
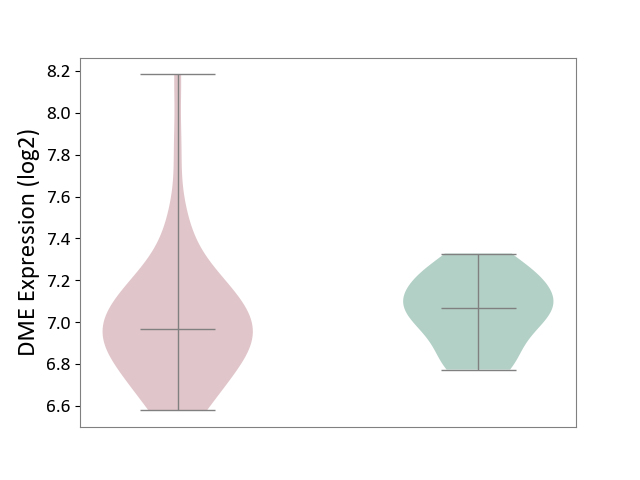
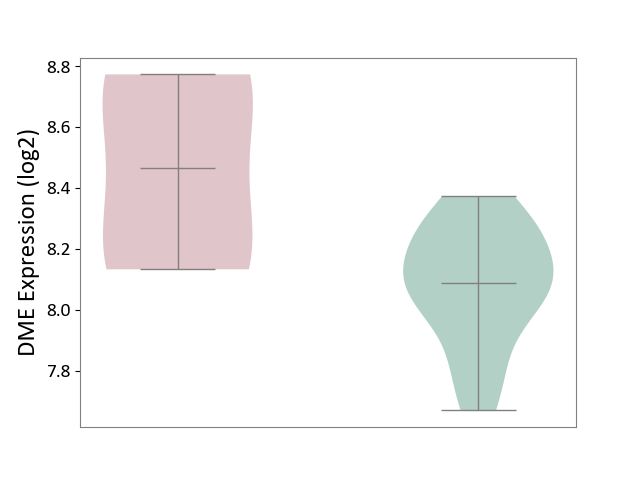
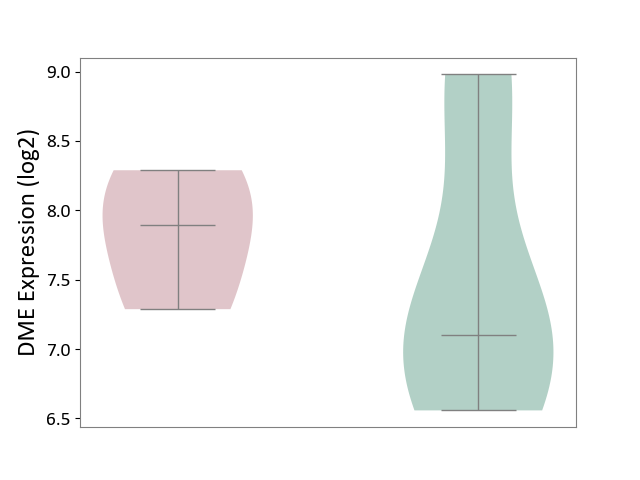
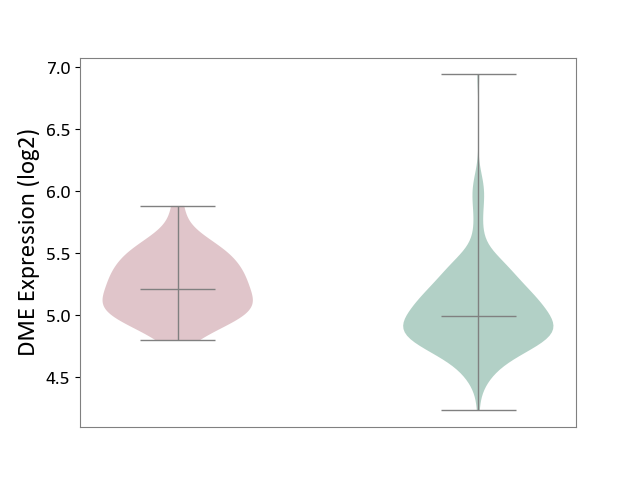
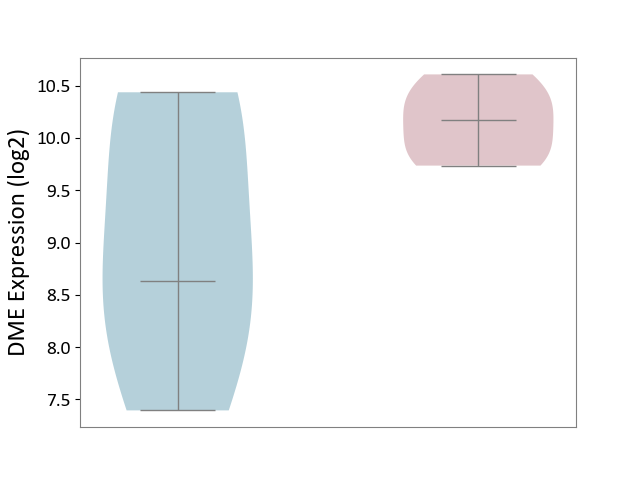
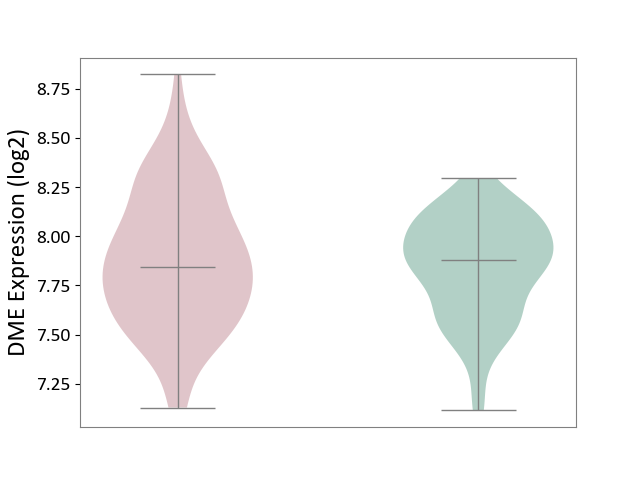
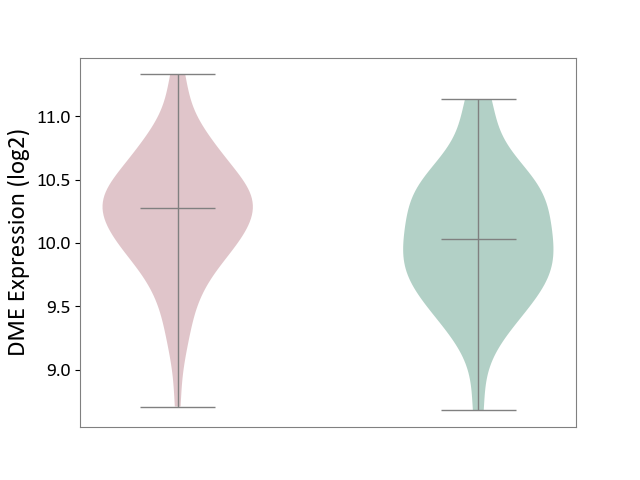
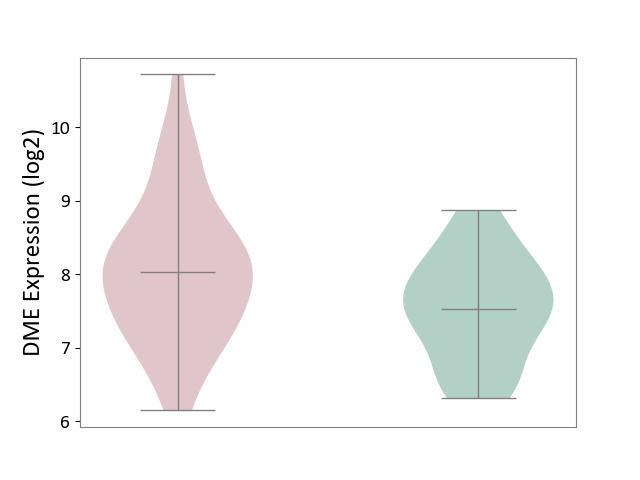
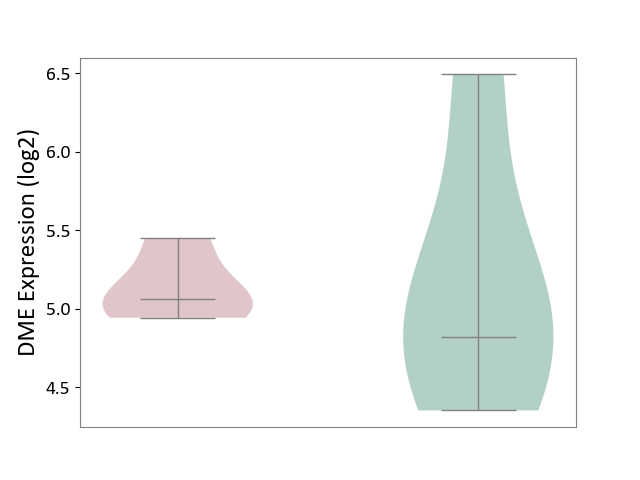
| ICD-11: 1C1H | Necrotising ulcerative gingivitis | Click to Show/Hide | |||
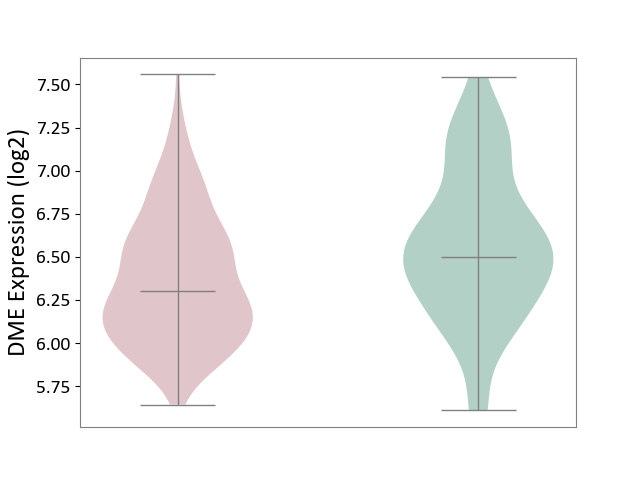
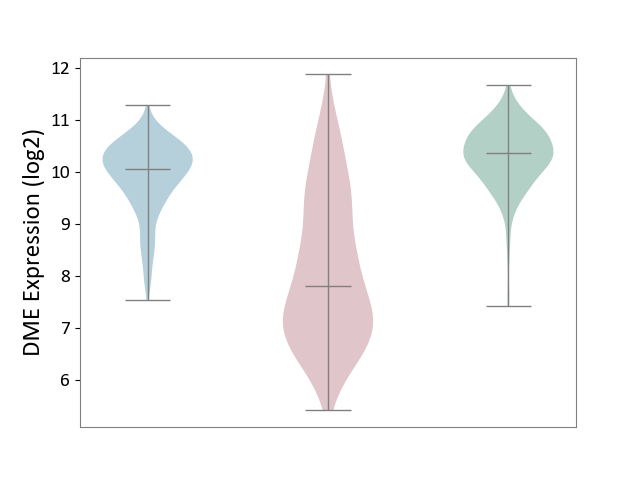
| The Studied Tissue | Gingival tissue | ||||
| The Specified Disease | Bacterial infection of gingival [ICD-11:1C1H] | ||||
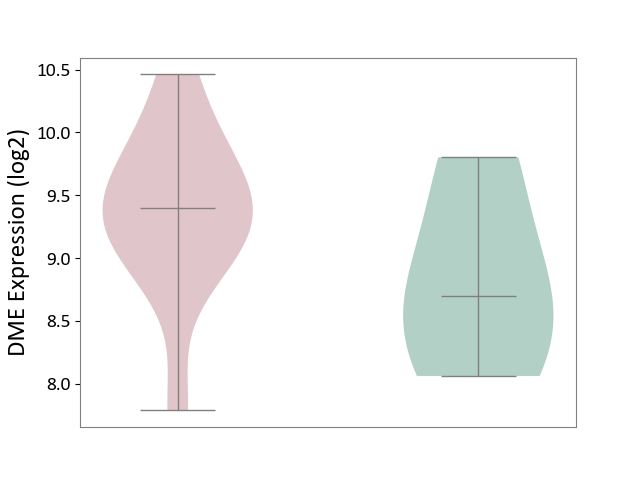
| The Expression Level of Disease Section Compare with the Healthy Individual Tissue | p-value: 2.03E-03; Fold-change: -1.94E-01; Z-score: -4.45E-01 | ||||
|
DME expression in the diseased tissue of patients
DME expression in the normal tissue of healthy individuals
|
|||||
| Violin Diagram of DME Disease-specific Protein Abundances |
|
Click to View the Clearer Original Diagram | |||
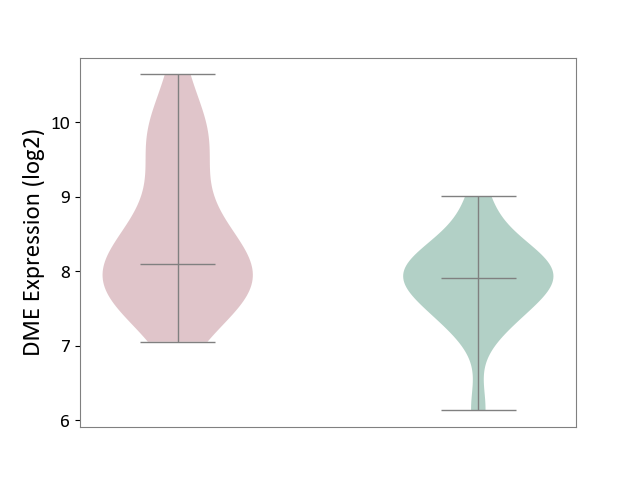
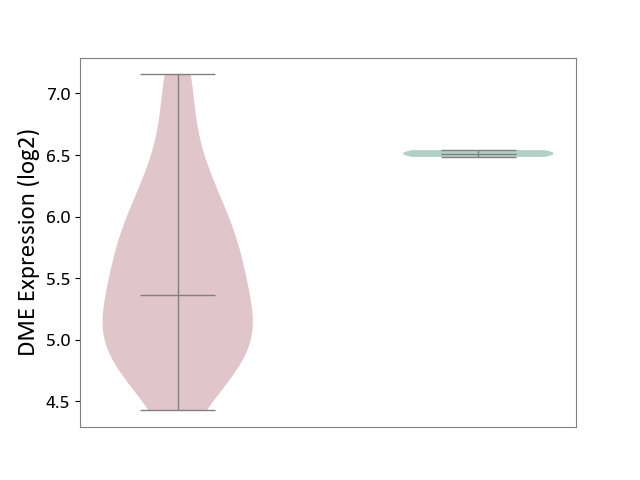
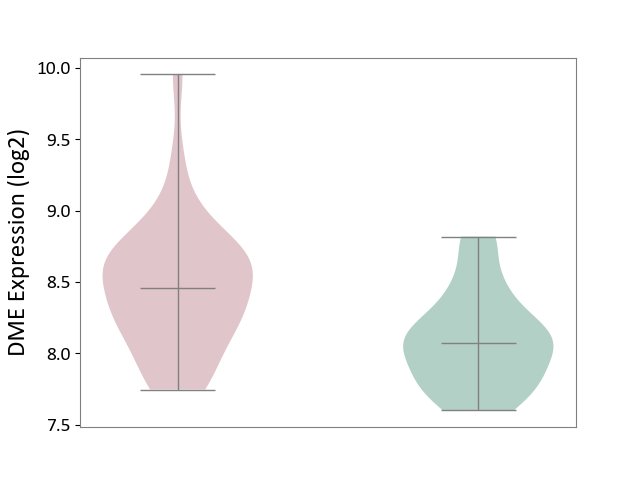
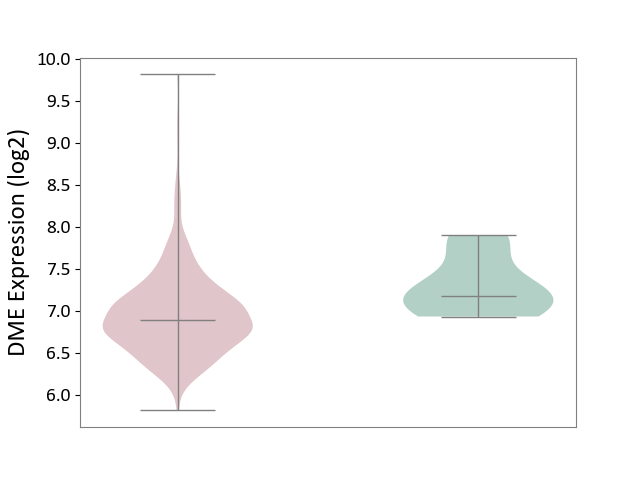
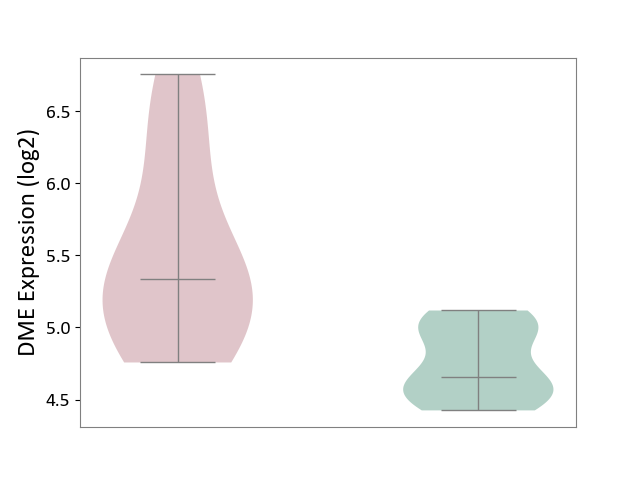
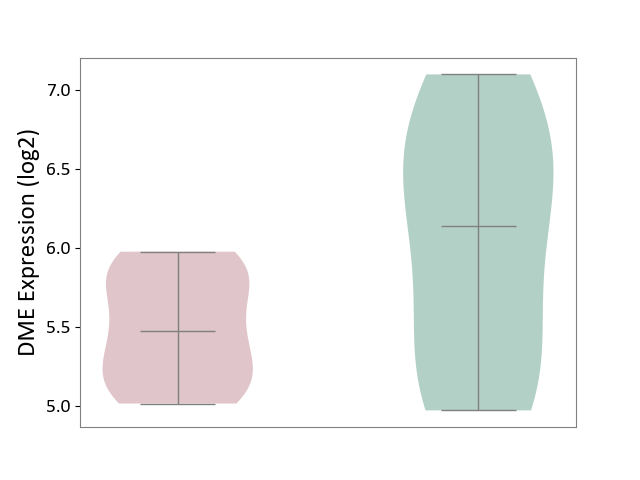
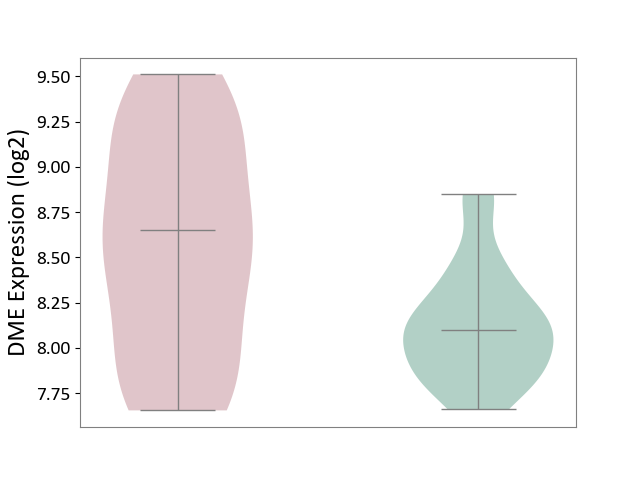
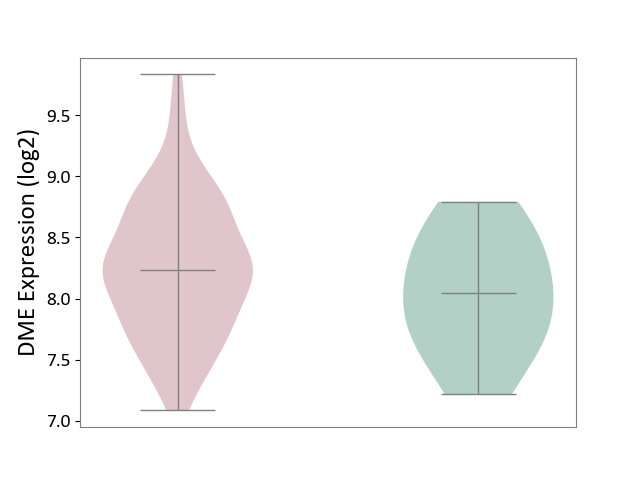
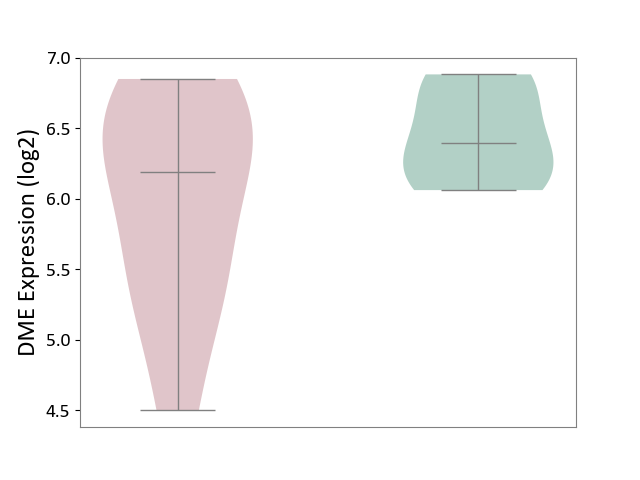
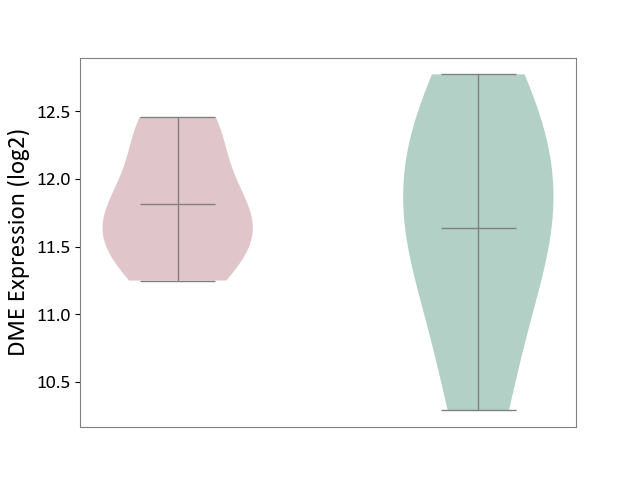
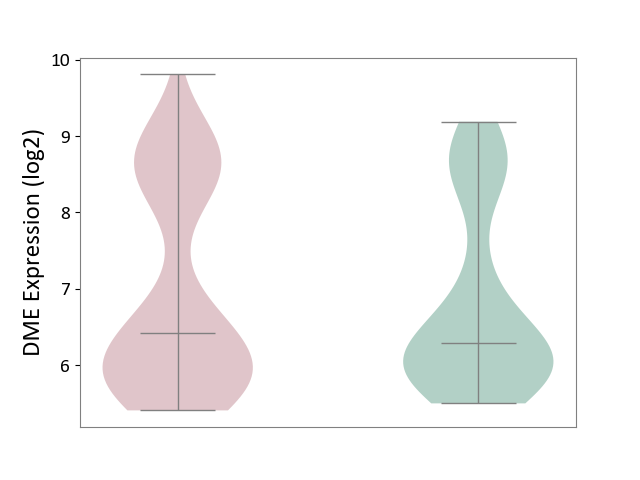
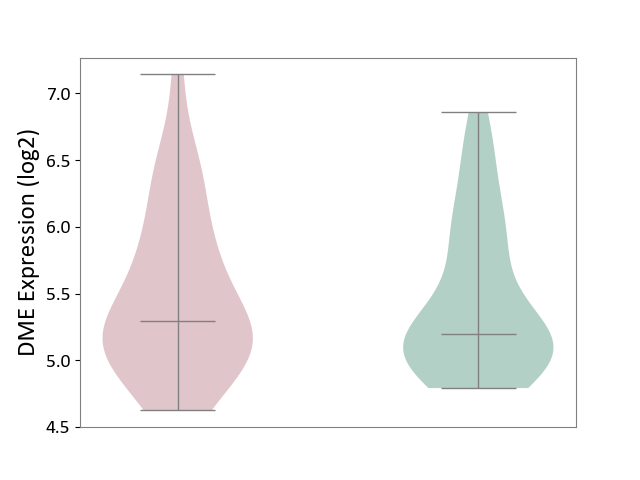
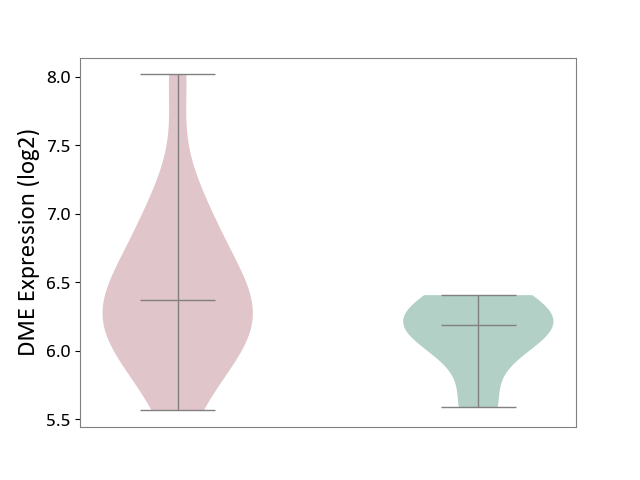
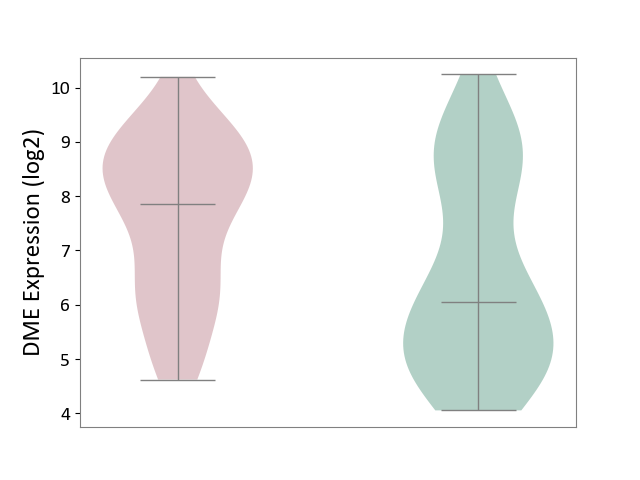
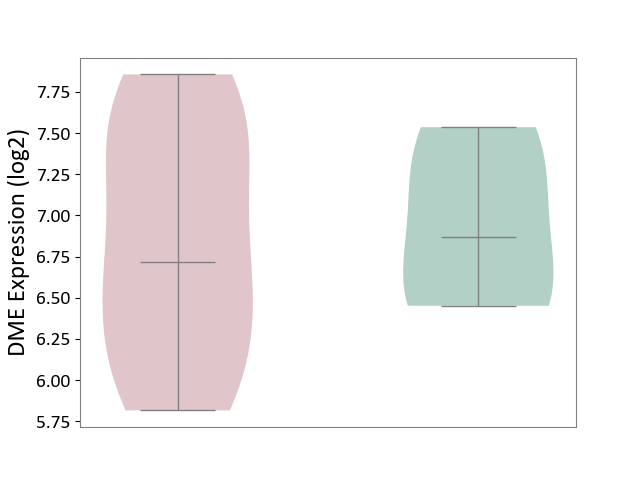
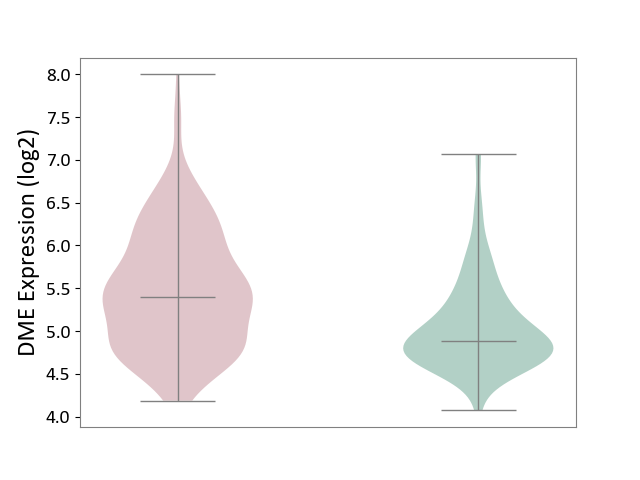
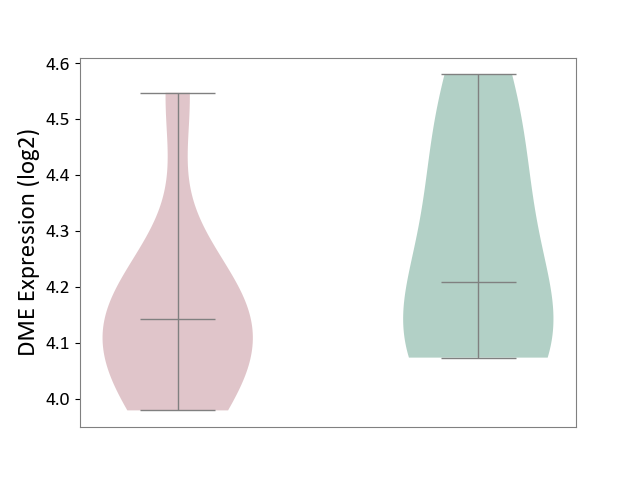
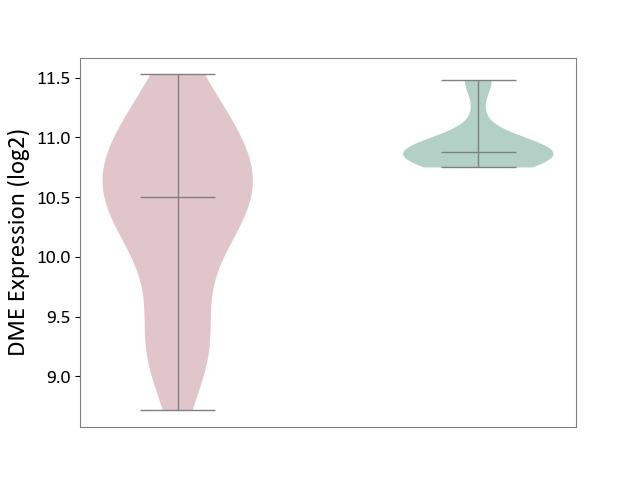
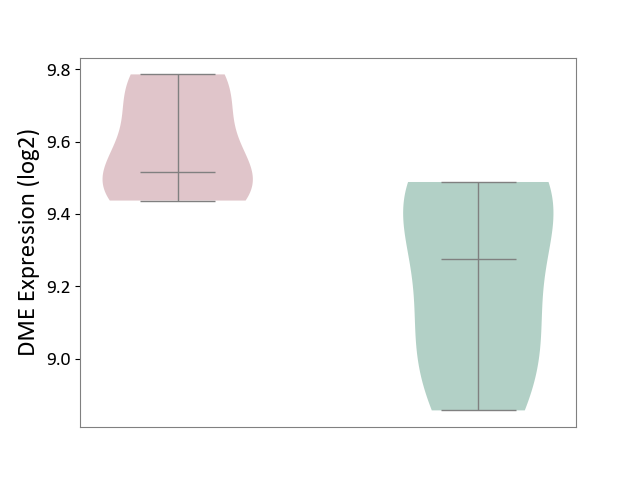
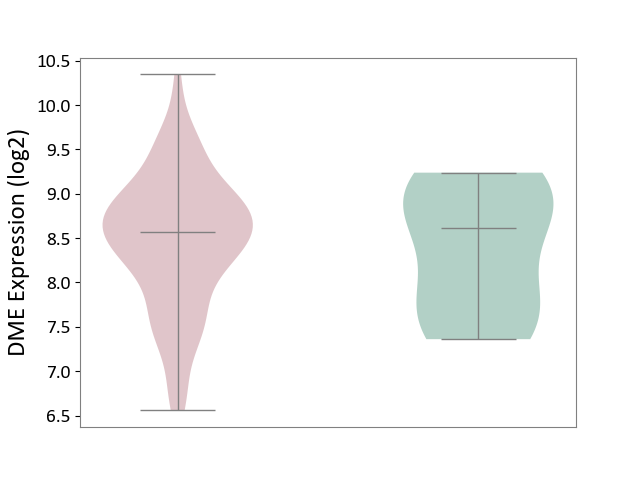
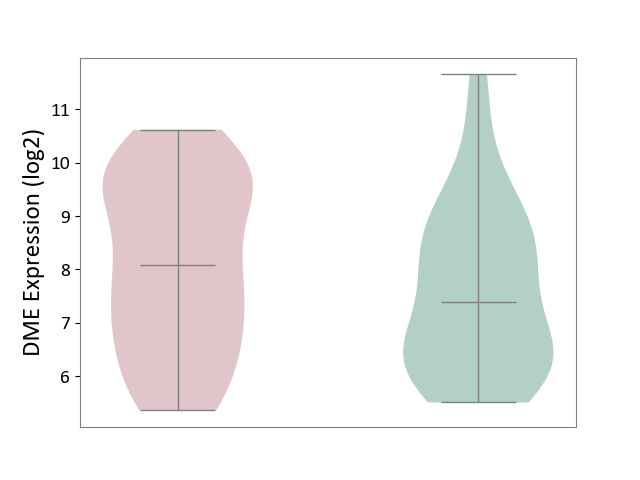
| ICD-11: 1E30 | Influenza | Click to Show/Hide | |||
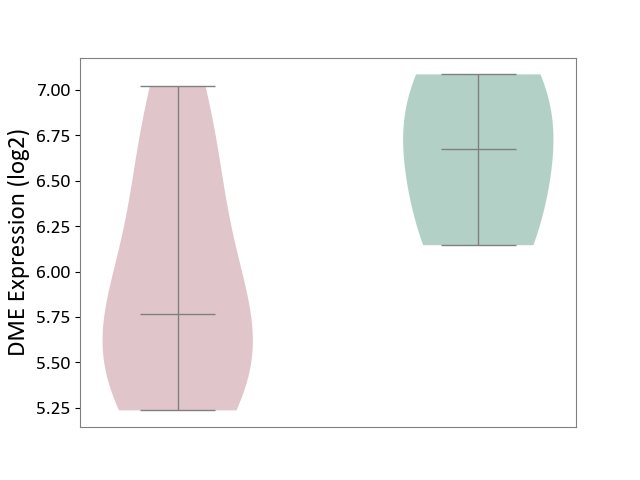
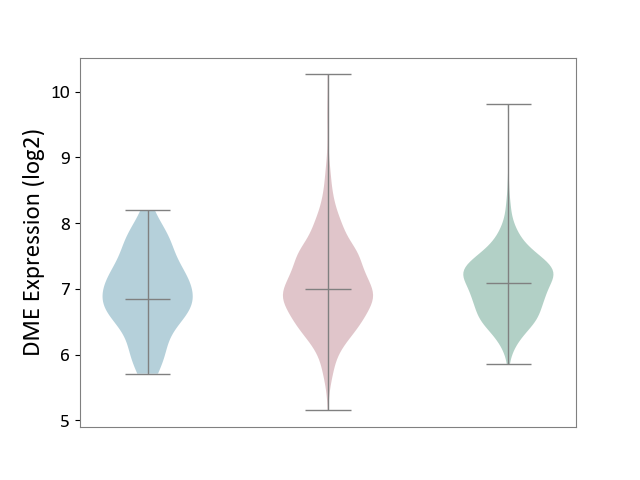
| The Studied Tissue | Whole blood | ||||
| The Specified Disease | Influenza [ICD-11:1E30] | ||||
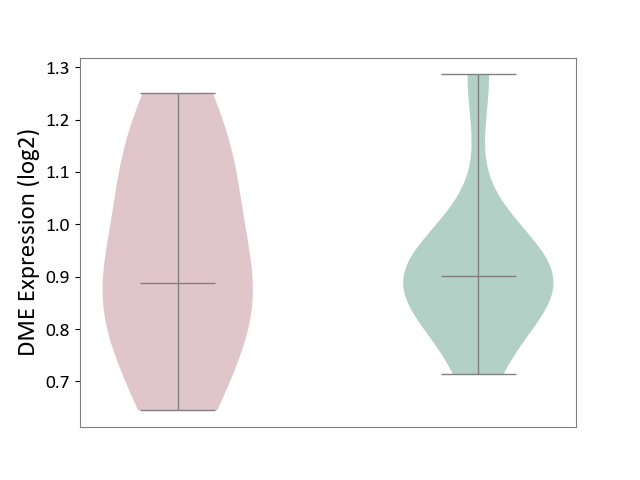
| The Expression Level of Disease Section Compare with the Healthy Individual Tissue | p-value: 9.98E-02; Fold-change: -9.07E-01; Z-score: -1.93E+00 | ||||
|
DME expression in the diseased tissue of patients
DME expression in the normal tissue of healthy individuals
|
|||||
| Violin Diagram of DME Disease-specific Protein Abundances |
|
Click to View the Clearer Original Diagram | |||
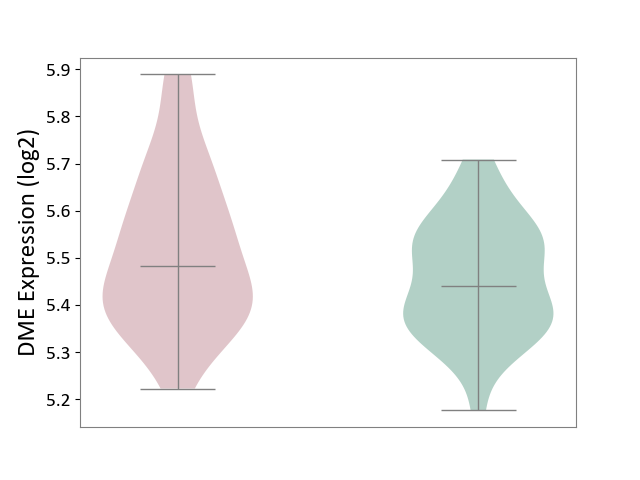
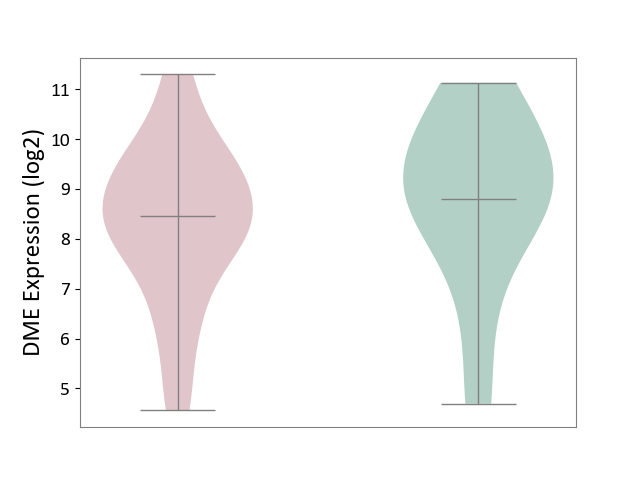
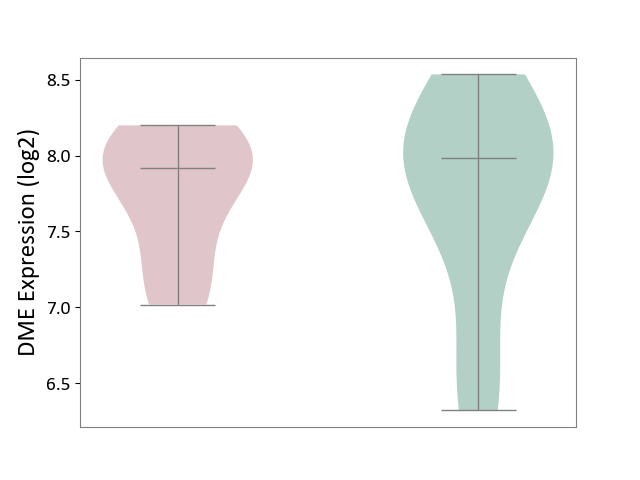
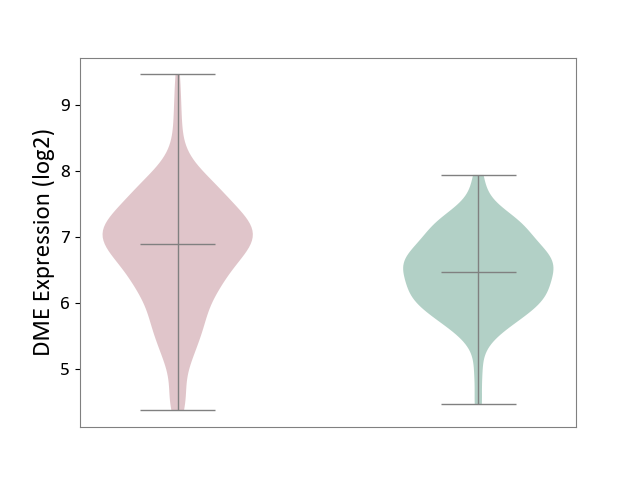
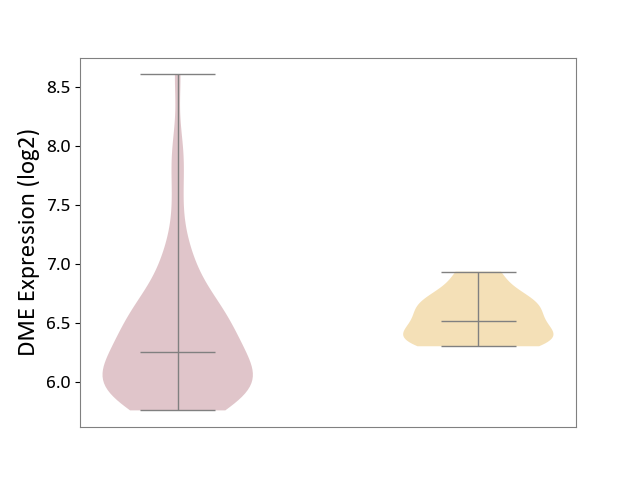
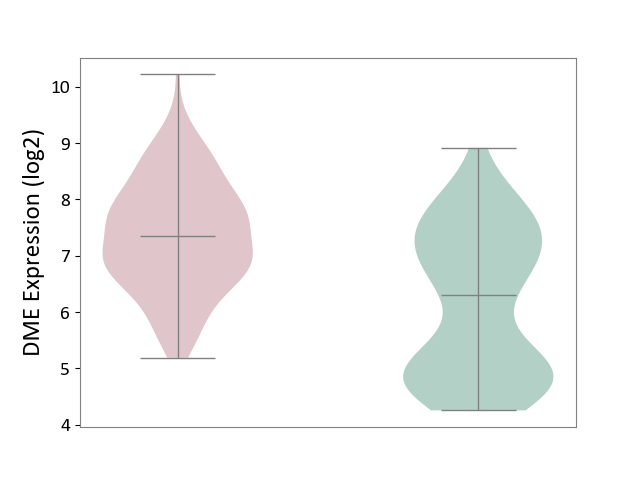
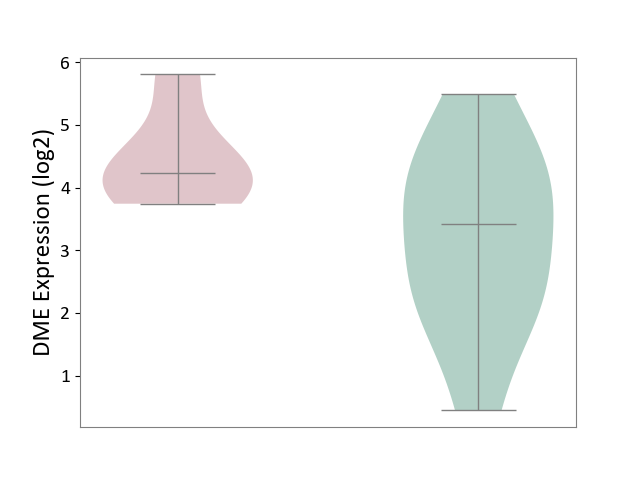
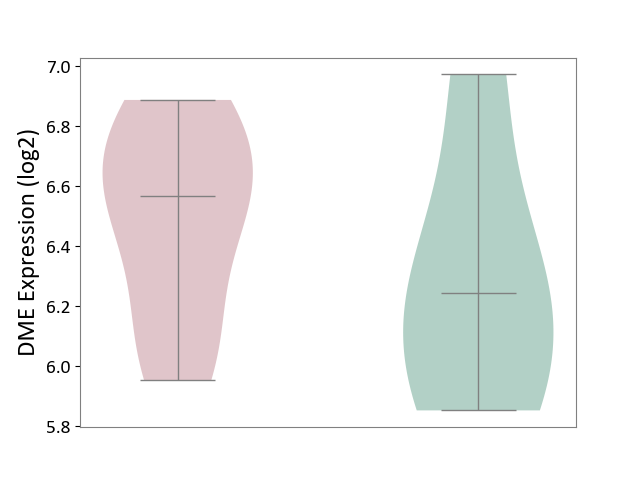
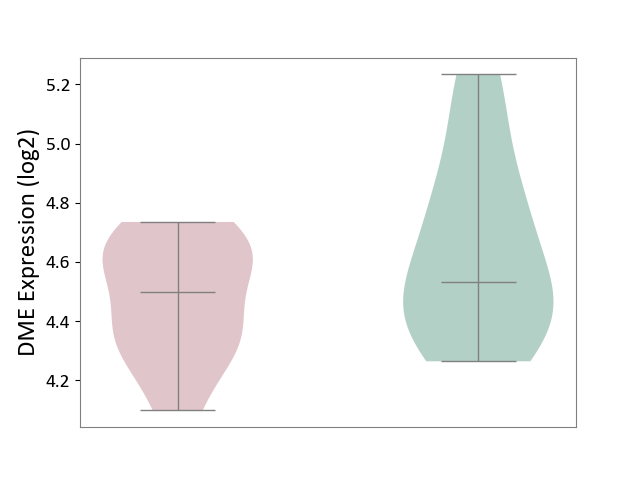
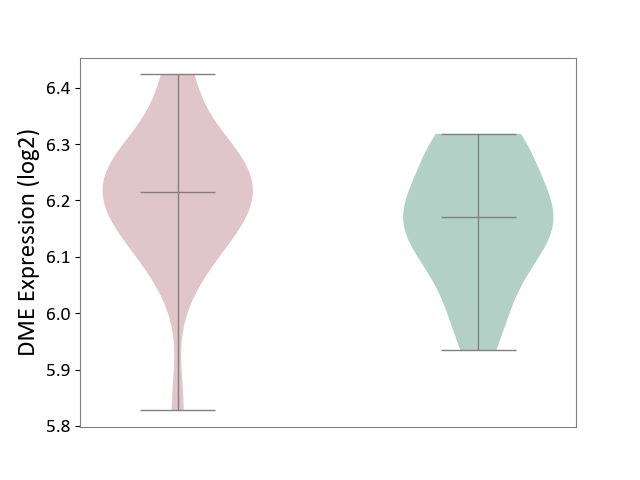
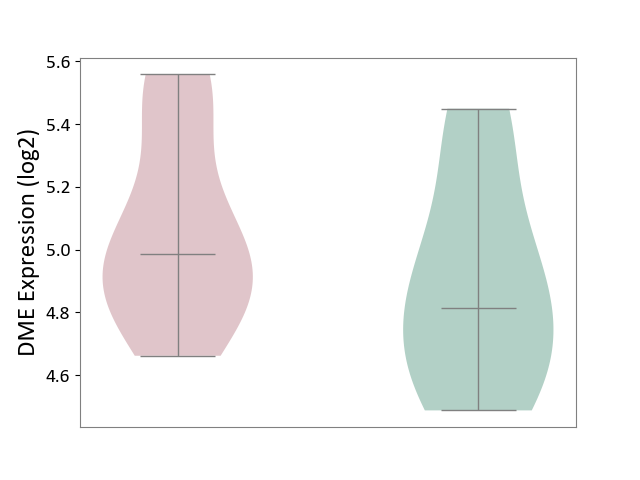
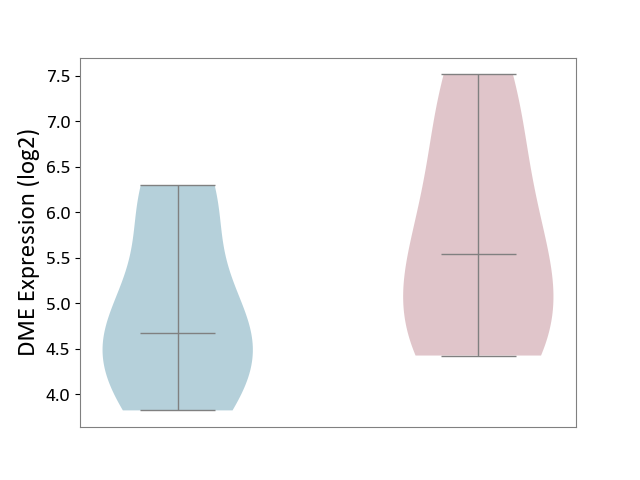
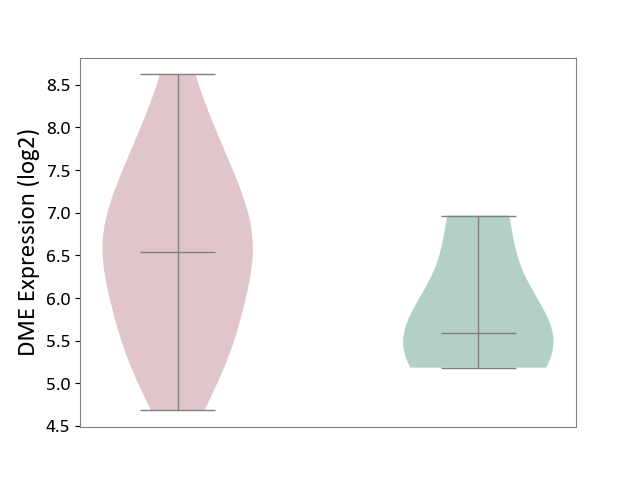
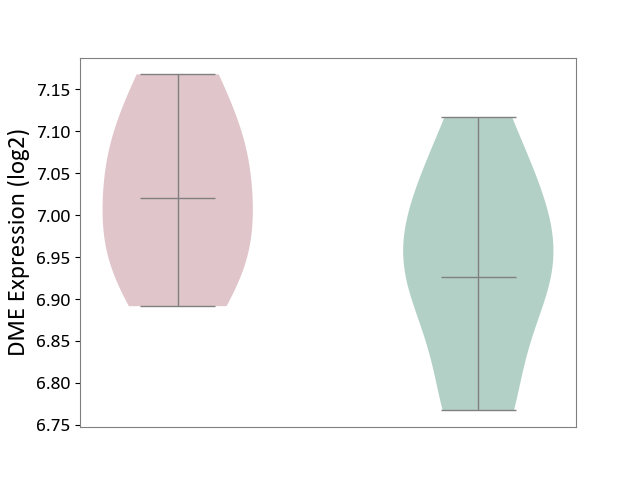
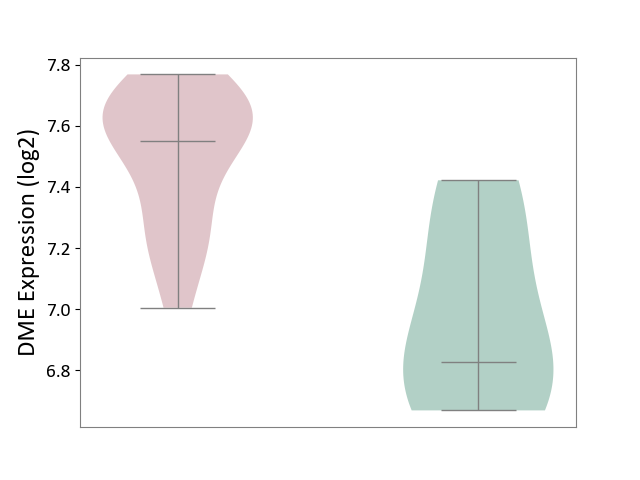
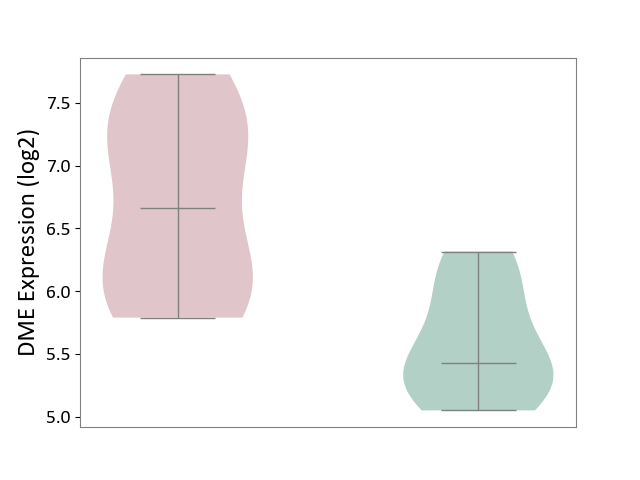
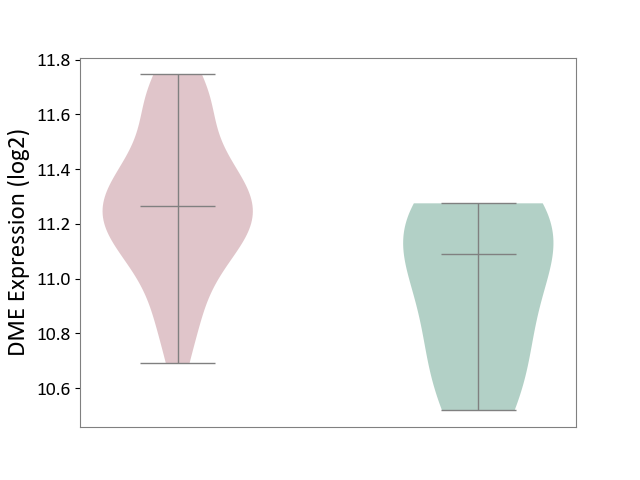
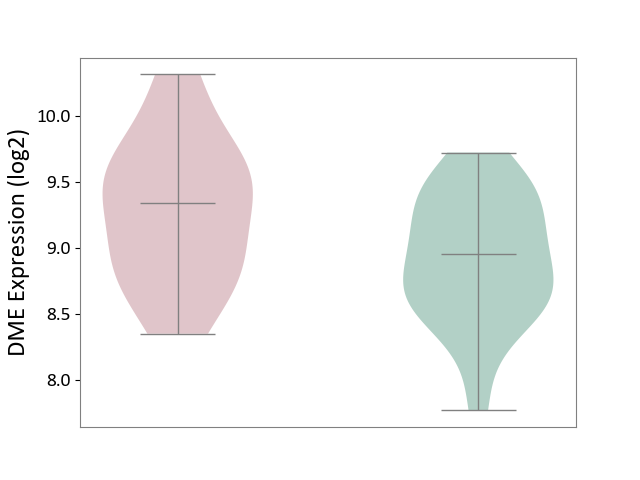
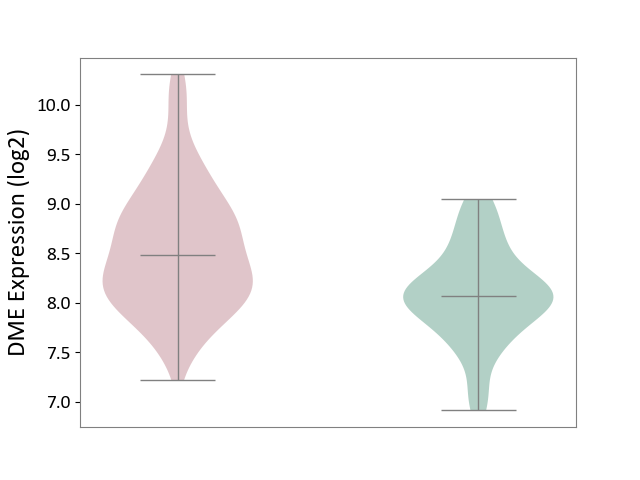
| ICD-11: 1E51 | Chronic viral hepatitis | Click to Show/Hide | |||
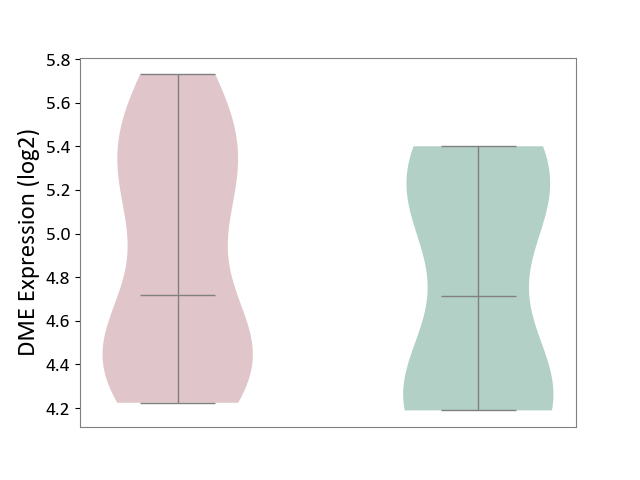
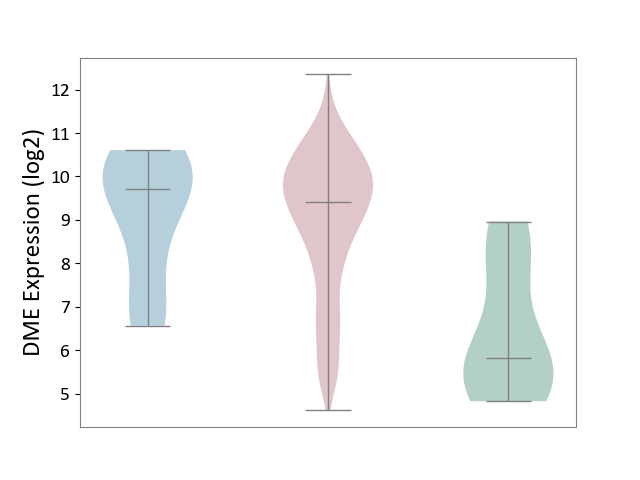
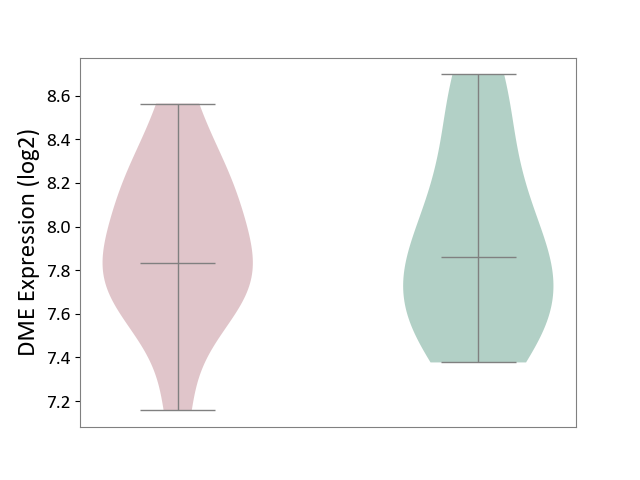
| The Studied Tissue | Whole blood | ||||
| The Specified Disease | Chronic hepatitis C [ICD-11:1E51.1] | ||||
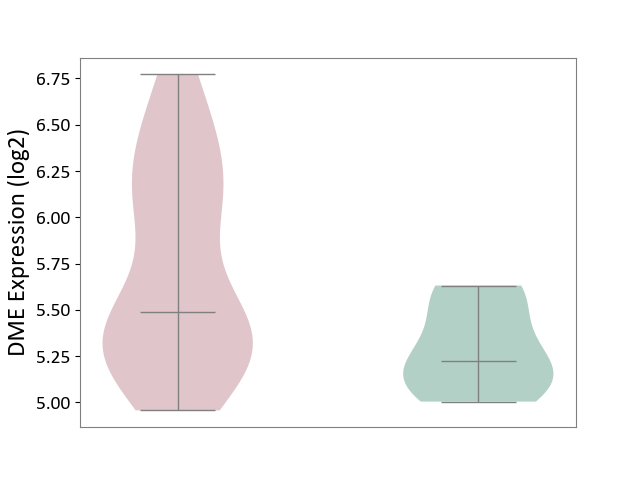
| The Expression Level of Disease Section Compare with the Healthy Individual Tissue | p-value: 5.16E-01; Fold-change: 6.87E-03; Z-score: 1.28E-02 | ||||
|
DME expression in the diseased tissue of patients
DME expression in the normal tissue of healthy individuals
|
|||||
| Violin Diagram of DME Disease-specific Protein Abundances |
|
Click to View the Clearer Original Diagram | |||
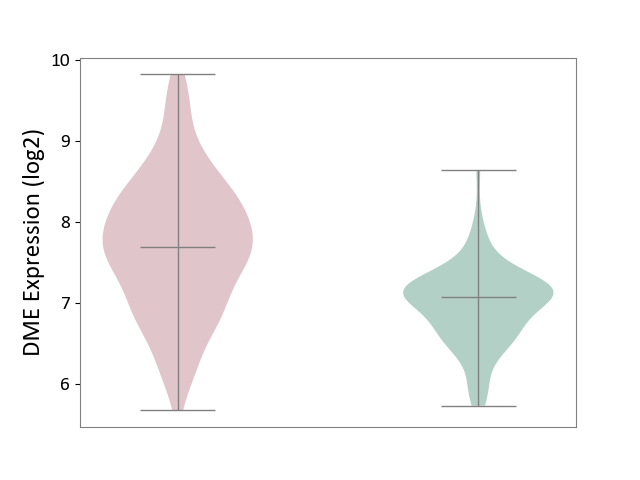
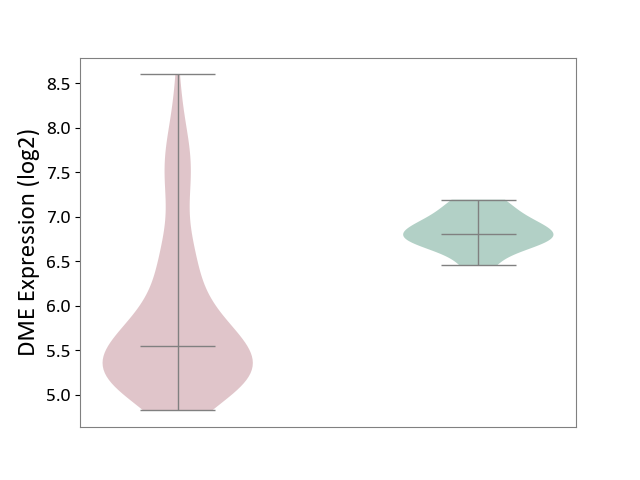
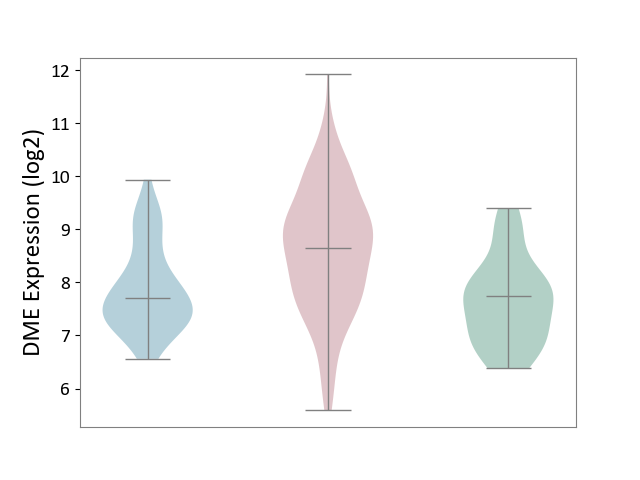
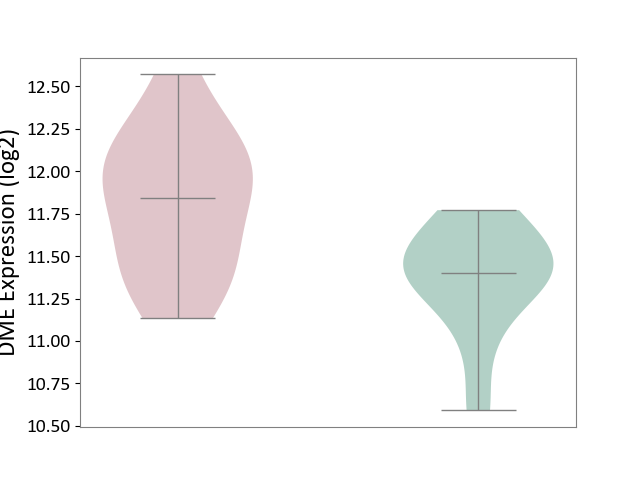
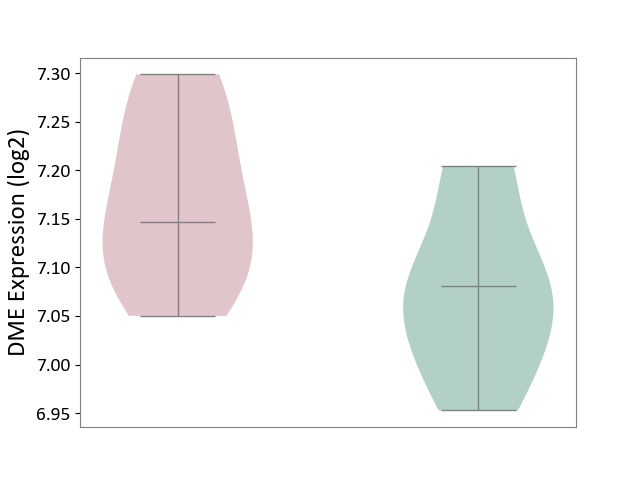
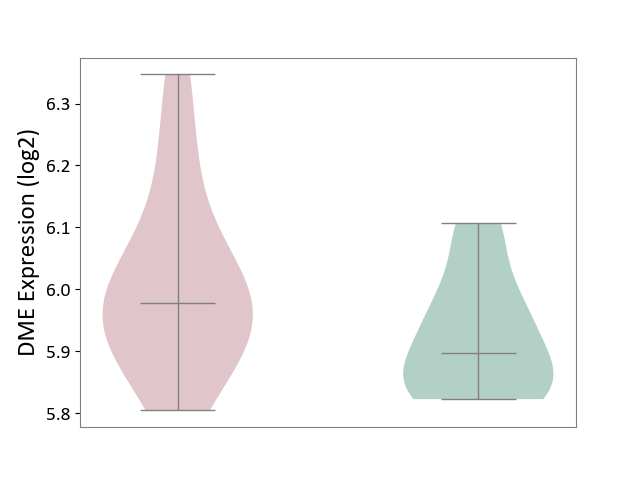
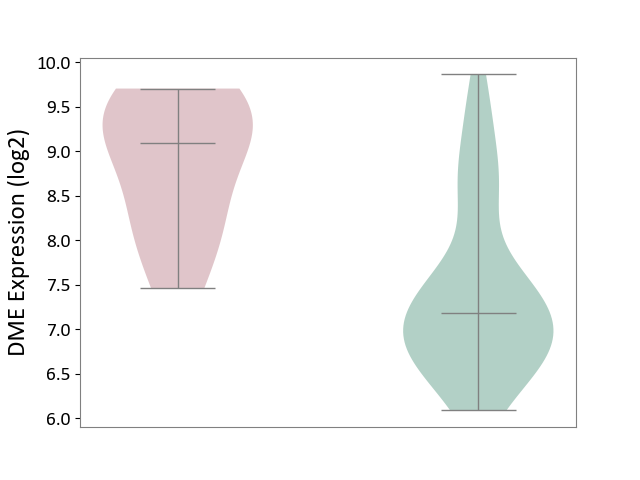
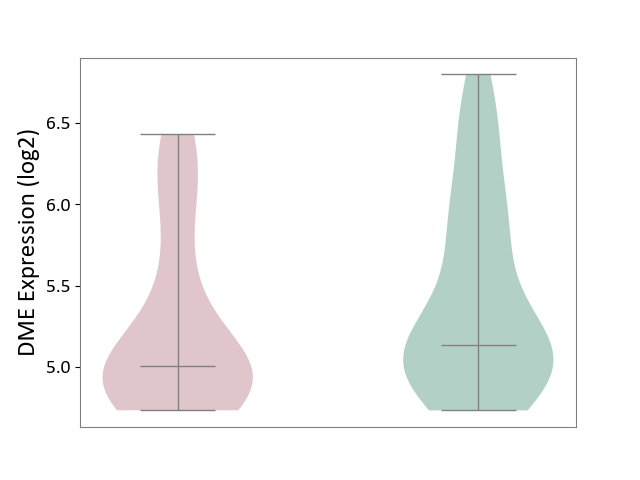
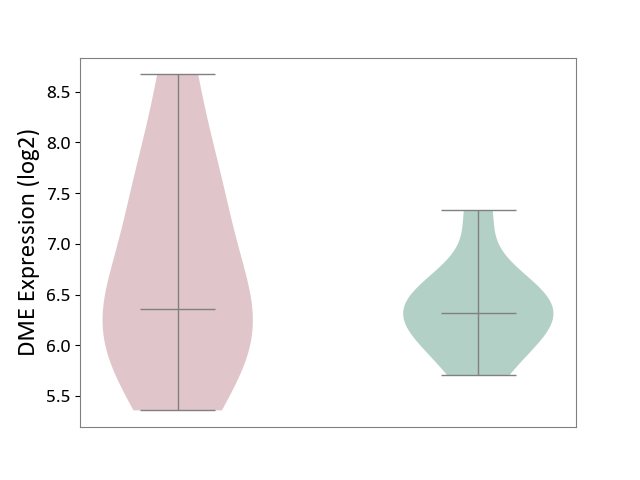
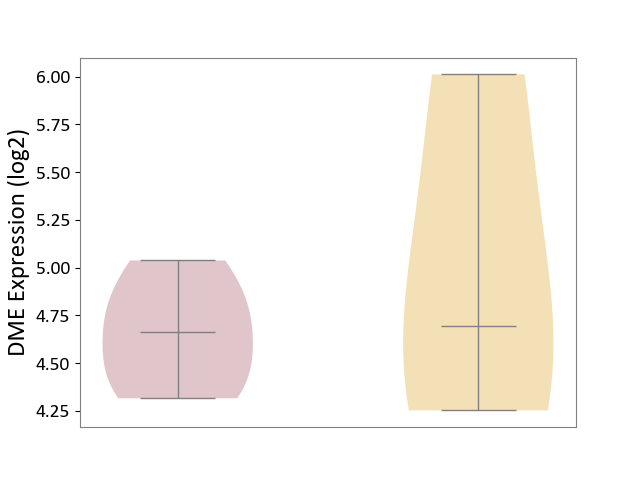
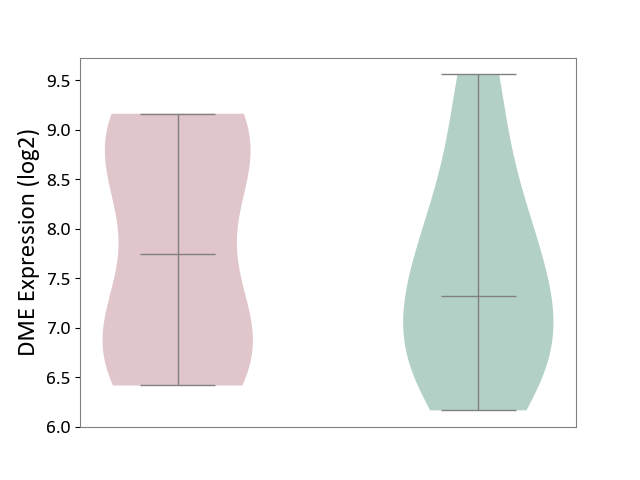
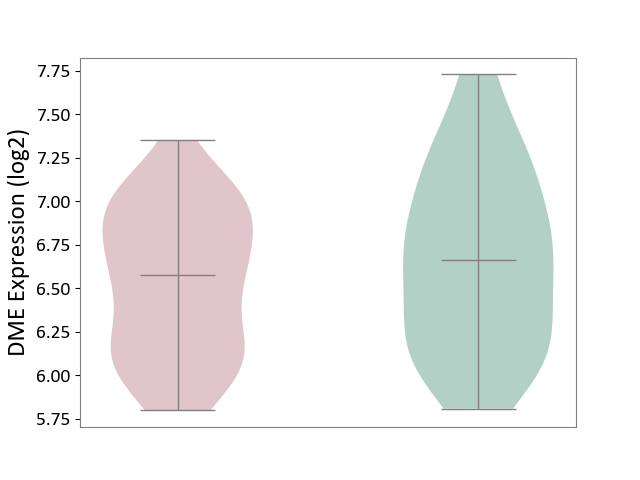
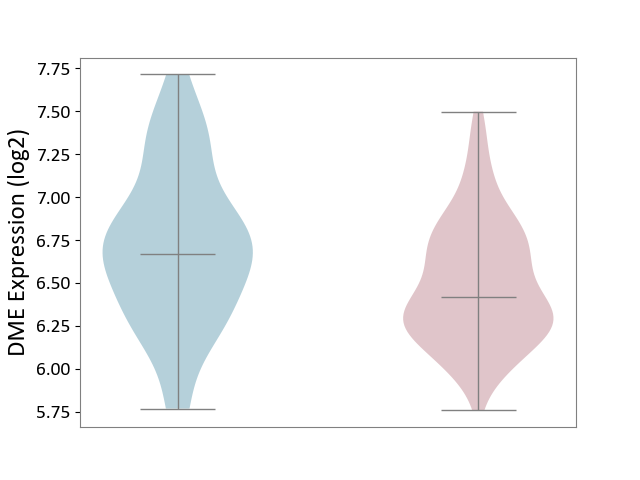
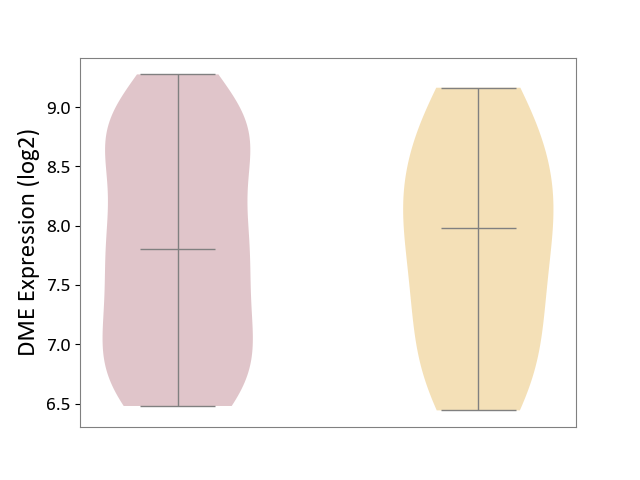
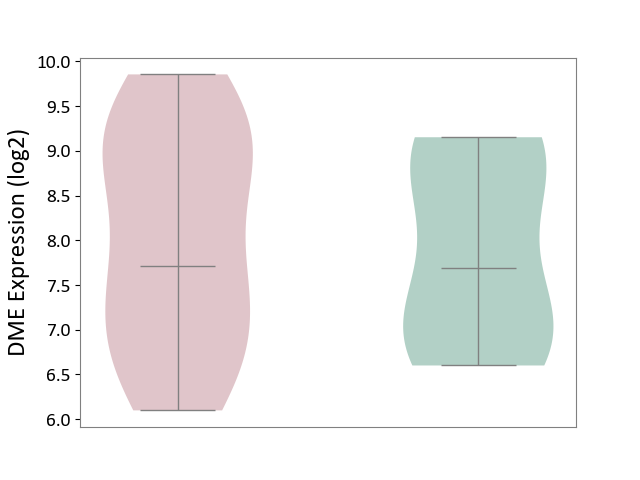
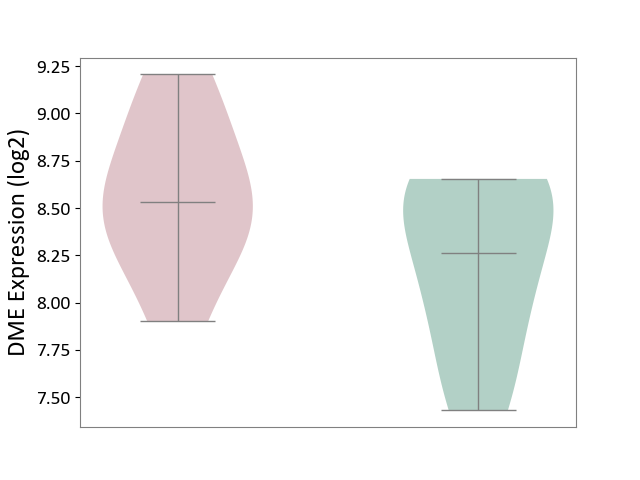
| ICD-11: 1G41 | Sepsis with septic shock | Click to Show/Hide | |||
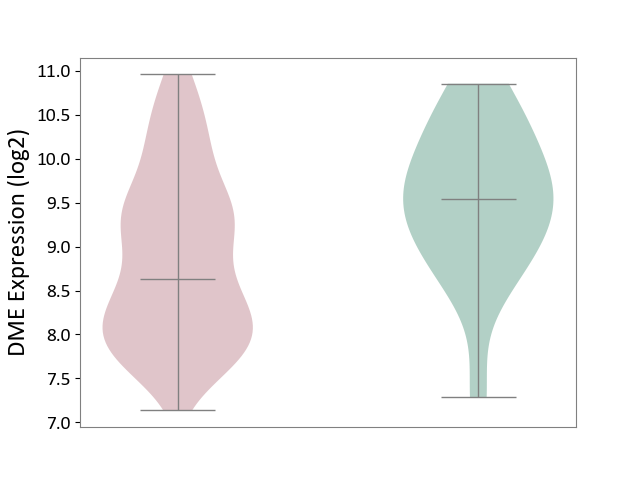
| The Studied Tissue | Whole blood | ||||
| The Specified Disease | Sepsis with septic shock [ICD-11:1G41] | ||||
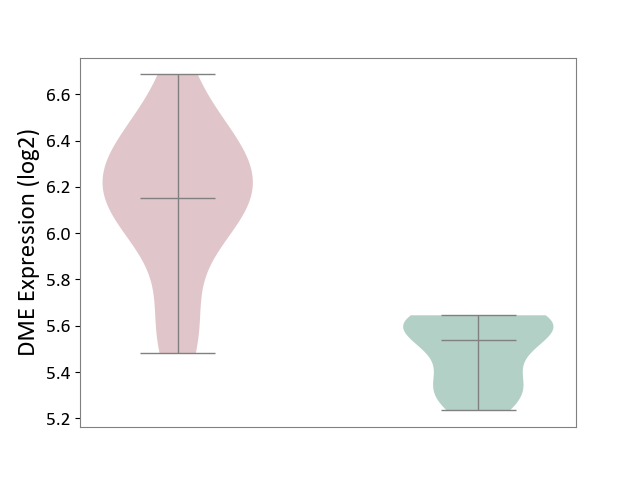
| The Expression Level of Disease Section Compare with the Healthy Individual Tissue | p-value: 5.73E-12; Fold-change: 2.65E-01; Z-score: 6.23E-01 | ||||
|
DME expression in the diseased tissue of patients
DME expression in the normal tissue of healthy individuals
|
|||||
| Violin Diagram of DME Disease-specific Protein Abundances |
|
Click to View the Clearer Original Diagram | |||
| ICD-11: CA40 | Respiratory syncytial virus infection | Click to Show/Hide | |||
| The Studied Tissue | Peripheral blood | ||||
| The Specified Disease | Pediatric respiratory syncytial virus infection [ICD-11:CA40.11] | ||||
| The Expression Level of Disease Section Compare with the Healthy Individual Tissue | p-value: 1.40E-02; Fold-change: 1.83E-01; Z-score: 2.94E-01 | ||||
|
DME expression in the diseased tissue of patients
DME expression in the normal tissue of healthy individuals
|
|||||
| Violin Diagram of DME Disease-specific Protein Abundances |
|
Click to View the Clearer Original Diagram | |||
| ICD-11: CA42 | Rhinovirus infection | Click to Show/Hide | |||
| The Studied Tissue | Nasal epithelium tissue | ||||
| The Specified Disease | Rhinovirus infection [ICD-11:CA42.1] | ||||
| The Expression Level of Disease Section Compare with the Healthy Individual Tissue | p-value: 6.31E-02; Fold-change: 4.23E-02; Z-score: 3.47E-01 | ||||
|
DME expression in the diseased tissue of patients
DME expression in the normal tissue of healthy individuals
|
|||||
| Violin Diagram of DME Disease-specific Protein Abundances |
|
Click to View the Clearer Original Diagram | |||
| ICD-11: KA60 | Neonatal sepsis | Click to Show/Hide | |||
| The Studied Tissue | Whole blood | ||||
| The Specified Disease | Neonatal sepsis [ICD-11:KA60] | ||||
| The Expression Level of Disease Section Compare with the Healthy Individual Tissue | p-value: 1.95E-16; Fold-change: 6.27E-01; Z-score: 1.29E+00 | ||||
|
DME expression in the diseased tissue of patients
DME expression in the normal tissue of healthy individuals
|
|||||
| Violin Diagram of DME Disease-specific Protein Abundances |
|
Click to View the Clearer Original Diagram | |||
| ICD Disease Classification 02 | Neoplasm | Click to Show/Hide | |||
| ICD-11: 2A00 | Brain cancer | Click to Show/Hide | |||
| The Studied Tissue | Nervous tissue | ||||
| The Specified Disease | Glioblastopma [ICD-11:2A00.00] | ||||
| The Expression Level of Disease Section Compare with the Healthy Individual Tissue | p-value: 1.72E-63; Fold-change: 7.14E-01; Z-score: 1.48E+00 | ||||
|
DME expression in the diseased tissue of patients
DME expression in the normal tissue of healthy individuals
|
|||||
| Violin Diagram of DME Disease-specific Protein Abundances |
|
Click to View the Clearer Original Diagram | |||
| The Studied Tissue | Brain stem tissue | ||||
| The Specified Disease | Glioma [ICD-11:2A00.0Y-2A00.0Z] | ||||
| The Expression Level of Disease Section Compare with the Healthy Individual Tissue | p-value: 2.54E-09; Fold-change: -1.15E+00; Z-score: -2.94E+01 | ||||
|
DME expression in the diseased tissue of patients
DME expression in the normal tissue of healthy individuals
|
|||||
| Violin Diagram of DME Disease-specific Protein Abundances |
|
Click to View the Clearer Original Diagram | |||
| The Studied Tissue | White matter tissue | ||||
| The Specified Disease | Glioma [ICD-11:2A00.0Y-2A00.0Z] | ||||
| The Expression Level of Disease Section Compare with the Healthy Individual Tissue | p-value: 4.59E-01; Fold-change: -3.48E-01; Z-score: -1.94E-01 | ||||
|
DME expression in the diseased tissue of patients
DME expression in the normal tissue of healthy individuals
|
|||||
| Violin Diagram of DME Disease-specific Protein Abundances |
|
Click to View the Clearer Original Diagram | |||
| The Studied Tissue | Brain stem tissue | ||||
| The Specified Disease | Neuroectodermal tumour [ICD-11:2A00.11] | ||||
| The Expression Level of Disease Section Compare with the Healthy Individual Tissue | p-value: 3.17E-12; Fold-change: -1.26E+00; Z-score: -5.98E+00 | ||||
|
DME expression in the diseased tissue of patients
DME expression in the normal tissue of healthy individuals
|
|||||
| Violin Diagram of DME Disease-specific Protein Abundances |
|
Click to View the Clearer Original Diagram | |||
| ICD-11: 2A20 | Myeloproliferative neoplasm | Click to Show/Hide | |||
| The Studied Tissue | Whole blood | ||||
| The Specified Disease | Myelofibrosis [ICD-11:2A20.2] | ||||
| The Expression Level of Disease Section Compare with the Healthy Individual Tissue | p-value: 8.38E-01; Fold-change: -8.65E-02; Z-score: -2.75E-01 | ||||
|
DME expression in the diseased tissue of patients
DME expression in the normal tissue of healthy individuals
|
|||||
| Violin Diagram of DME Disease-specific Protein Abundances |
|
Click to View the Clearer Original Diagram | |||
| The Studied Tissue | Whole blood | ||||
| The Specified Disease | Polycythemia vera [ICD-11:2A20.4] | ||||
| The Expression Level of Disease Section Compare with the Healthy Individual Tissue | p-value: 1.79E-06; Fold-change: 3.88E-01; Z-score: 1.16E+00 | ||||
|
DME expression in the diseased tissue of patients
DME expression in the normal tissue of healthy individuals
|
|||||
| Violin Diagram of DME Disease-specific Protein Abundances |
|
Click to View the Clearer Original Diagram | |||
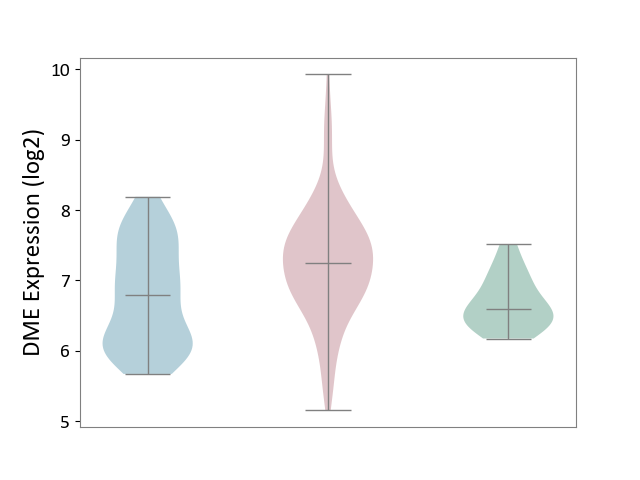
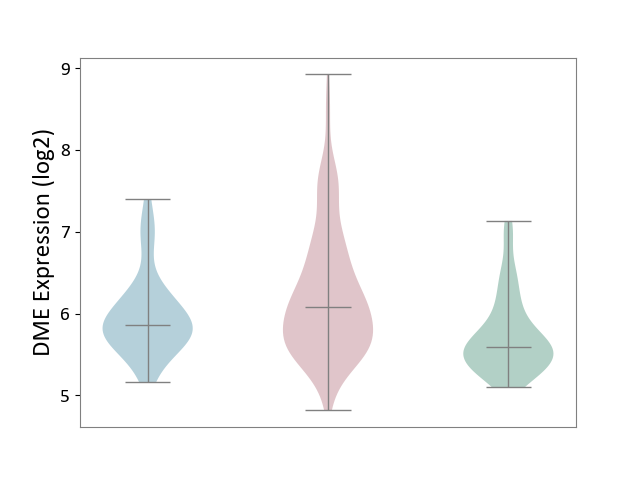
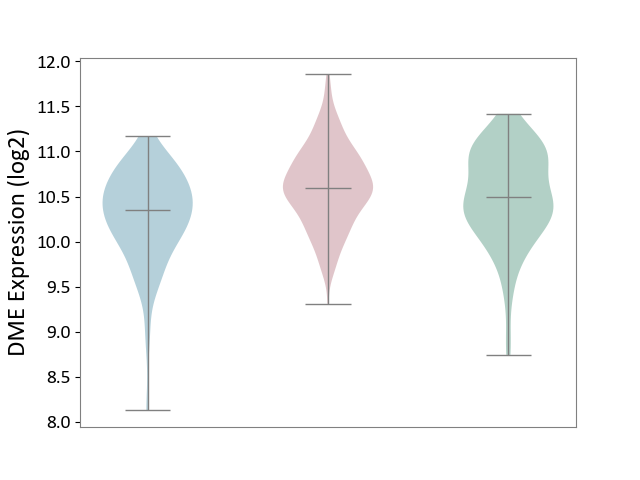
| ICD-11: 2A36 | Myelodysplastic syndrome | Click to Show/Hide | |||
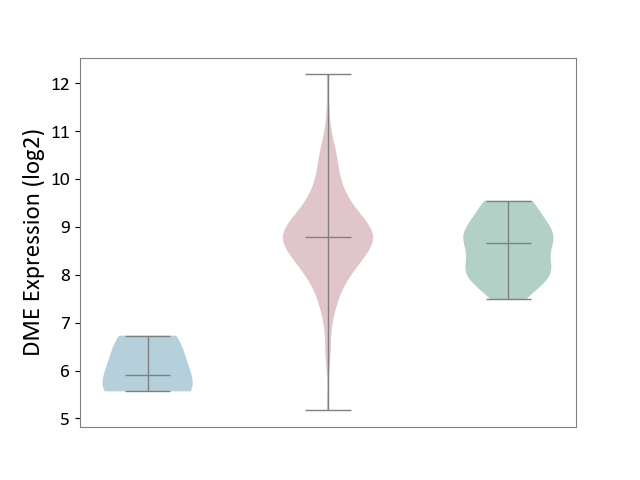
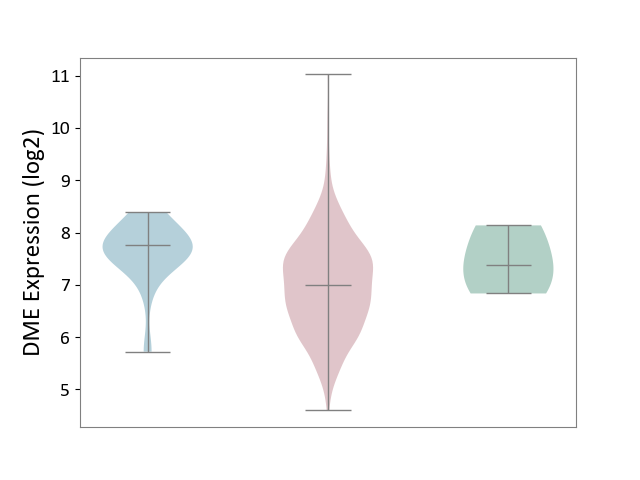
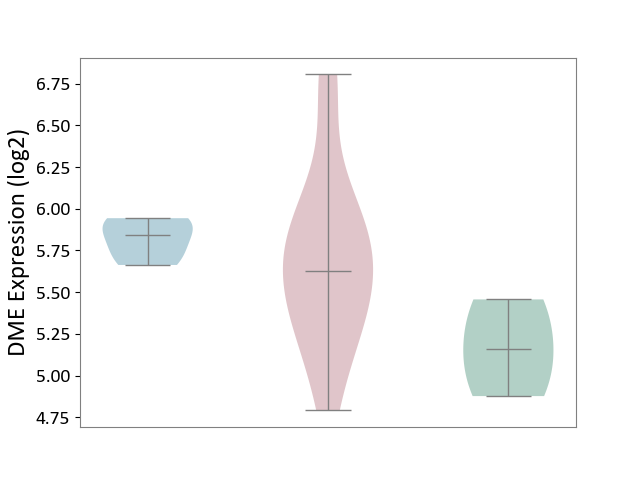
| The Studied Tissue | Bone marrow | ||||
| The Specified Disease | Myelodysplastic syndrome [ICD-11:2A36-2A3Z] | ||||
| The Expression Level of Disease Section Compare with the Healthy Individual Tissue | p-value: 6.17E-02; Fold-change: 1.24E-01; Z-score: 2.01E-01 | ||||
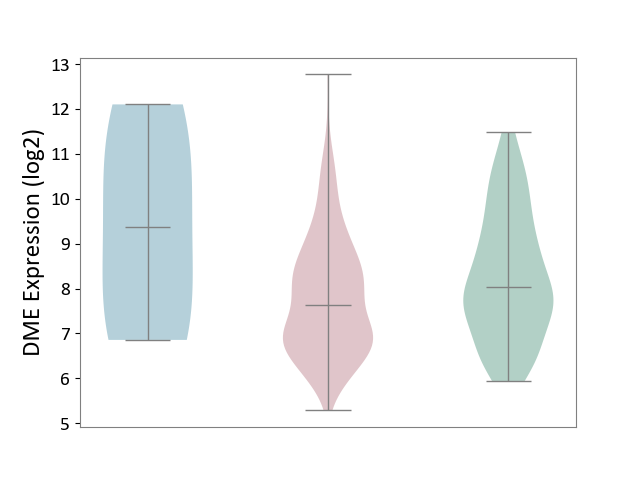
| The Expression Level of Disease Section Compare with the Adjacent Tissue | p-value: 1.58E-03; Fold-change: 2.89E+00; Z-score: 5.16E+00 | ||||
|
DME expression in the diseased tissue of patients
DME expression in the normal tissue adjacent to the diseased tissue of patients
DME expression in the normal tissue of healthy individuals
|
|||||
| Violin Diagram of DME Disease-specific Protein Abundances |
|
Click to View the Clearer Original Diagram | |||
| ICD-11: 2A81 | Diffuse large B-cell lymphoma | Click to Show/Hide | |||
| The Studied Tissue | Tonsil tissue | ||||
| The Specified Disease | Diffuse large B-cell lymphoma [ICD-11:2A81] | ||||
| The Expression Level of Disease Section Compare with the Healthy Individual Tissue | p-value: 9.45E-01; Fold-change: -6.62E-02; Z-score: -9.47E-02 | ||||
|
DME expression in the diseased tissue of patients
DME expression in the normal tissue of healthy individuals
|
|||||
| Violin Diagram of DME Disease-specific Protein Abundances |
|
Click to View the Clearer Original Diagram | |||
| ICD-11: 2A83 | Plasma cell neoplasm | Click to Show/Hide | |||
| The Studied Tissue | Peripheral blood | ||||
| The Specified Disease | Multiple myeloma [ICD-11:2A83.1] | ||||
| The Expression Level of Disease Section Compare with the Healthy Individual Tissue | p-value: 3.72E-01; Fold-change: 1.33E-01; Z-score: 7.30E-01 | ||||
|
DME expression in the diseased tissue of patients
DME expression in the normal tissue of healthy individuals
|
|||||
| Violin Diagram of DME Disease-specific Protein Abundances |
|
Click to View the Clearer Original Diagram | |||
| The Studied Tissue | Bone marrow | ||||
| The Specified Disease | Multiple myeloma [ICD-11:2A83.1] | ||||
| The Expression Level of Disease Section Compare with the Healthy Individual Tissue | p-value: 2.87E-02; Fold-change: -2.83E-01; Z-score: -7.80E-01 | ||||
|
DME expression in the diseased tissue of patients
DME expression in the normal tissue of healthy individuals
|
|||||
| Violin Diagram of DME Disease-specific Protein Abundances |
|
Click to View the Clearer Original Diagram | |||
| ICD-11: 2B33 | Leukaemia | Click to Show/Hide | |||
| The Studied Tissue | Bone marrow | ||||
| The Specified Disease | Acute myelocytic leukaemia [ICD-11:2B33.1] | ||||
| The Expression Level of Disease Section Compare with the Healthy Individual Tissue | p-value: 1.43E-05; Fold-change: 4.18E-01; Z-score: 6.74E-01 | ||||
|
DME expression in the diseased tissue of patients
DME expression in the normal tissue of healthy individuals
|
|||||
| Violin Diagram of DME Disease-specific Protein Abundances |
|
Click to View the Clearer Original Diagram | |||
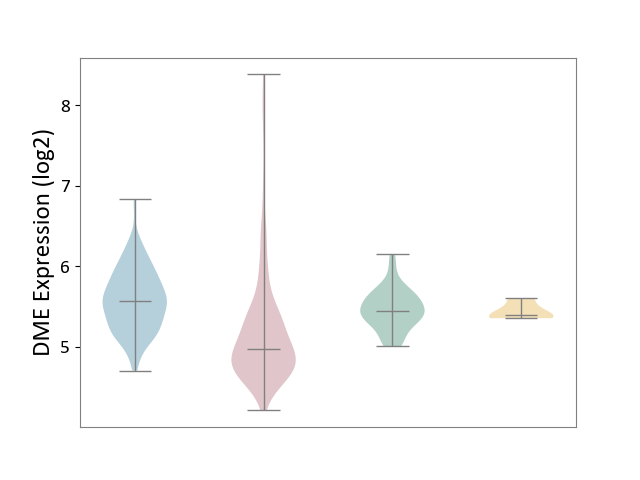
| ICD-11: 2B6E | Oral cancer | Click to Show/Hide | |||
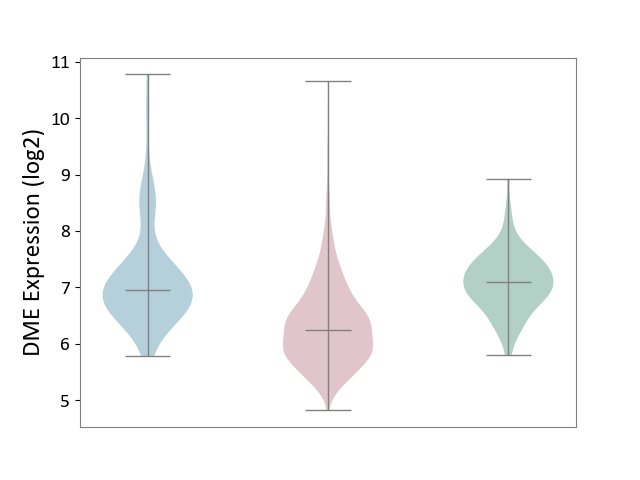
| The Studied Tissue | Oral tissue | ||||
| The Specified Disease | Oral cancer [ICD-11:2B6E] | ||||
| The Expression Level of Disease Section Compare with the Healthy Individual Tissue | p-value: 1.72E-06; Fold-change: 8.99E-01; Z-score: 1.12E+00 | ||||
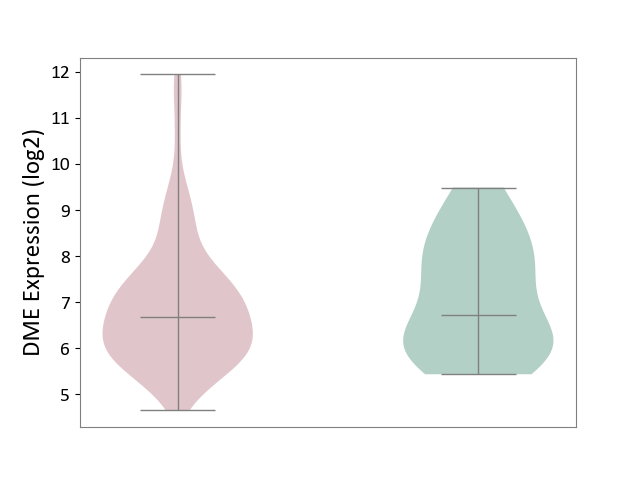
| The Expression Level of Disease Section Compare with the Adjacent Tissue | p-value: 1.87E-09; Fold-change: 9.43E-01; Z-score: 1.18E+00 | ||||
|
DME expression in the diseased tissue of patients
DME expression in the normal tissue adjacent to the diseased tissue of patients
DME expression in the normal tissue of healthy individuals
|
|||||
| Violin Diagram of DME Disease-specific Protein Abundances |
|
Click to View the Clearer Original Diagram | |||
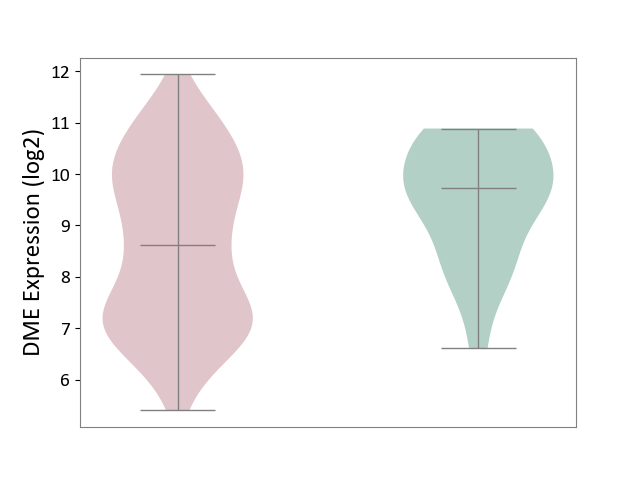
| ICD-11: 2B70 | Esophageal cancer | Click to Show/Hide | |||
| The Studied Tissue | Esophagus | ||||
| The Specified Disease | Esophagal cancer [ICD-11:2B70] | ||||
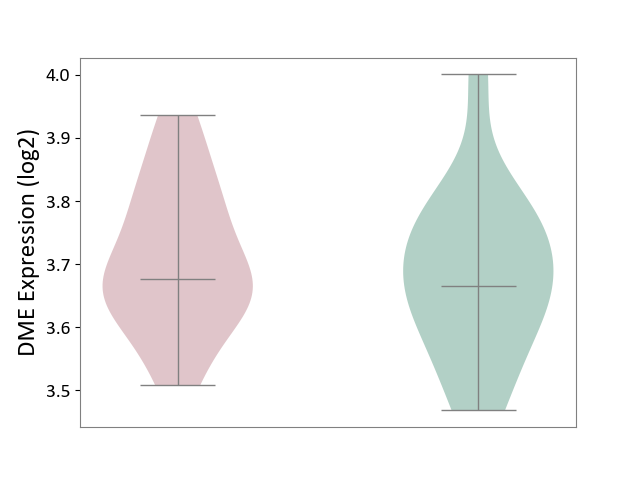
| The Expression Level of Disease Section Compare with the Adjacent Tissue | p-value: 1.86E-04; Fold-change: -1.14E+00; Z-score: -3.27E+00 | ||||
|
DME expression in the diseased tissue of patients
DME expression in the normal tissue adjacent to the diseased tissue of patients
|
|||||
| Violin Diagram of DME Disease-specific Protein Abundances |
|
Click to View the Clearer Original Diagram | |||
| ICD-11: 2B72 | Stomach cancer | Click to Show/Hide | |||
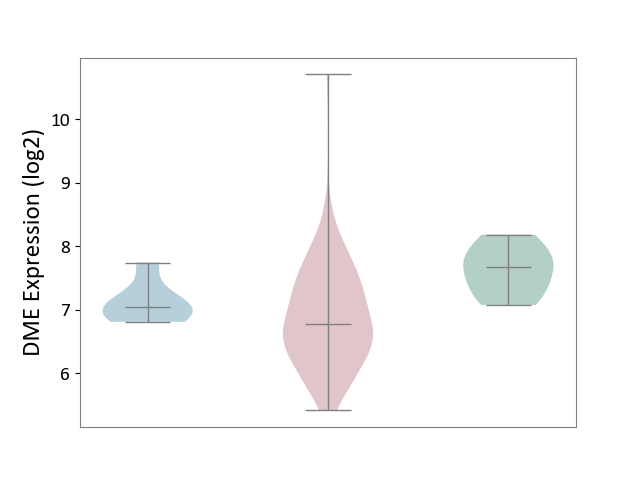
| The Studied Tissue | Gastric tissue | ||||
| The Specified Disease | Gastric cancer [ICD-11:2B72] | ||||
| The Expression Level of Disease Section Compare with the Healthy Individual Tissue | p-value: 3.42E-01; Fold-change: -3.96E-01; Z-score: -6.06E-01 | ||||
| The Expression Level of Disease Section Compare with the Adjacent Tissue | p-value: 4.86E-04; Fold-change: -7.71E-01; Z-score: -1.28E+00 | ||||
|
DME expression in the diseased tissue of patients
DME expression in the normal tissue adjacent to the diseased tissue of patients
DME expression in the normal tissue of healthy individuals
|
|||||
| Violin Diagram of DME Disease-specific Protein Abundances |
|
Click to View the Clearer Original Diagram | |||
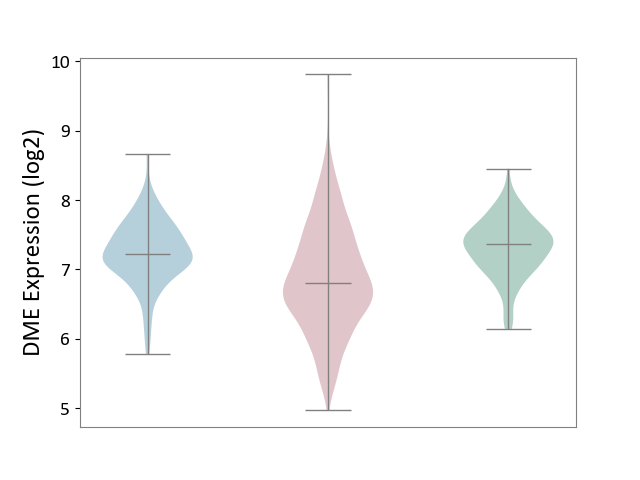
| ICD-11: 2B90 | Colon cancer | Click to Show/Hide | |||
| The Studied Tissue | Colon tissue | ||||
| The Specified Disease | Colon cancer [ICD-11:2B90] | ||||
| The Expression Level of Disease Section Compare with the Healthy Individual Tissue | p-value: 1.24E-37; Fold-change: -8.46E-01; Z-score: -1.61E+00 | ||||
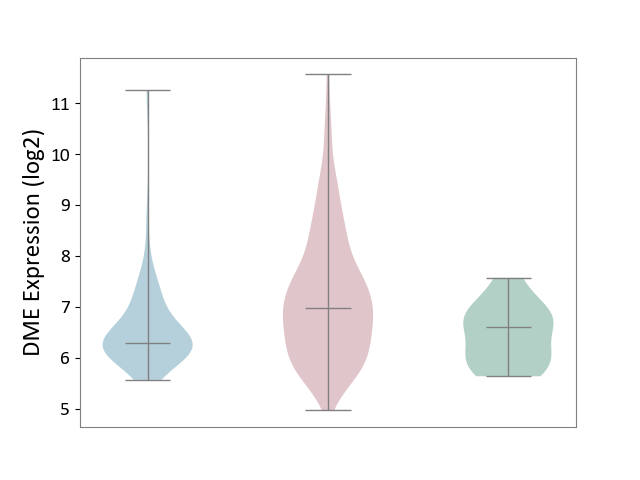
| The Expression Level of Disease Section Compare with the Adjacent Tissue | p-value: 5.22E-18; Fold-change: -7.05E-01; Z-score: -8.13E-01 | ||||
|
DME expression in the diseased tissue of patients
DME expression in the normal tissue adjacent to the diseased tissue of patients
DME expression in the normal tissue of healthy individuals
|
|||||
| Violin Diagram of DME Disease-specific Protein Abundances |
|
Click to View the Clearer Original Diagram | |||
| ICD-11: 2B92 | Rectal cancer | Click to Show/Hide | |||
| The Studied Tissue | Rectal colon tissue | ||||
| The Specified Disease | Rectal cancer [ICD-11:2B92] | ||||
| The Expression Level of Disease Section Compare with the Healthy Individual Tissue | p-value: 4.06E-03; Fold-change: -9.04E-01; Z-score: -2.26E+00 | ||||
| The Expression Level of Disease Section Compare with the Adjacent Tissue | p-value: 1.91E-01; Fold-change: -2.77E-01; Z-score: -8.20E-01 | ||||
|
DME expression in the diseased tissue of patients
DME expression in the normal tissue adjacent to the diseased tissue of patients
DME expression in the normal tissue of healthy individuals
|
|||||
| Violin Diagram of DME Disease-specific Protein Abundances |
|
Click to View the Clearer Original Diagram | |||
| ICD-11: 2C10 | Pancreatic cancer | Click to Show/Hide | |||
| The Studied Tissue | Pancreas | ||||
| The Specified Disease | Pancreatic cancer [ICD-11:2C10] | ||||
| The Expression Level of Disease Section Compare with the Healthy Individual Tissue | p-value: 1.81E-05; Fold-change: 6.59E-01; Z-score: 1.75E+00 | ||||
| The Expression Level of Disease Section Compare with the Adjacent Tissue | p-value: 5.17E-05; Fold-change: 4.59E-01; Z-score: 6.34E-01 | ||||
|
DME expression in the diseased tissue of patients
DME expression in the normal tissue adjacent to the diseased tissue of patients
DME expression in the normal tissue of healthy individuals
|
|||||
| Violin Diagram of DME Disease-specific Protein Abundances |
|
Click to View the Clearer Original Diagram | |||
| ICD-11: 2C12 | Liver cancer | Click to Show/Hide | |||
| The Studied Tissue | Liver tissue | ||||
| The Specified Disease | Liver cancer [ICD-11:2C12.0] | ||||
| The Expression Level of Disease Section Compare with the Healthy Individual Tissue | p-value: 2.45E-08; Fold-change: -4.69E-01; Z-score: -1.88E+00 | ||||
| The Expression Level of Disease Section Compare with the Adjacent Tissue | p-value: 5.33E-21; Fold-change: -5.96E-01; Z-score: -1.56E+00 | ||||
| The Expression Level of Disease Section Compare with the Other Disease Section | p-value: 8.49E-03; Fold-change: -4.11E-01; Z-score: -3.58E+00 | ||||
|
DME expression in the diseased tissue of patients
DME expression in the normal tissue adjacent to the diseased tissue of patients
DME expression in the normal tissue of healthy individuals
DME expression in tissue other than the diseased tissue of patients
|
|||||
| Violin Diagram of DME Disease-specific Protein Abundances |
|
Click to View the Clearer Original Diagram | |||
| ICD-11: 2C25 | Lung cancer | Click to Show/Hide | |||
| The Studied Tissue | Lung tissue | ||||
| The Specified Disease | Lung cancer [ICD-11:2C25] | ||||
| The Expression Level of Disease Section Compare with the Healthy Individual Tissue | p-value: 2.29E-28; Fold-change: -5.62E-01; Z-score: -1.35E+00 | ||||
| The Expression Level of Disease Section Compare with the Adjacent Tissue | p-value: 1.41E-13; Fold-change: -4.18E-01; Z-score: -9.14E-01 | ||||
|
DME expression in the diseased tissue of patients
DME expression in the normal tissue adjacent to the diseased tissue of patients
DME expression in the normal tissue of healthy individuals
|
|||||
| Violin Diagram of DME Disease-specific Protein Abundances |
|
Click to View the Clearer Original Diagram | |||
| ICD-11: 2C30 | Skin cancer | Click to Show/Hide | |||
| The Studied Tissue | Skin | ||||
| The Specified Disease | Melanoma [ICD-11:2C30] | ||||
| The Expression Level of Disease Section Compare with the Healthy Individual Tissue | p-value: 2.96E-03; Fold-change: -1.12E+00; Z-score: -9.55E-01 | ||||
|
DME expression in the diseased tissue of patients
DME expression in the normal tissue of healthy individuals
|
|||||
| Violin Diagram of DME Disease-specific Protein Abundances |
|
Click to View the Clearer Original Diagram | |||
| The Studied Tissue | Skin | ||||
| The Specified Disease | Skin cancer [ICD-11:2C30-2C3Z] | ||||
| The Expression Level of Disease Section Compare with the Healthy Individual Tissue | p-value: 2.54E-99; Fold-change: -2.57E+00; Z-score: -4.16E+00 | ||||
| The Expression Level of Disease Section Compare with the Adjacent Tissue | p-value: 2.14E-69; Fold-change: -2.26E+00; Z-score: -3.24E+00 | ||||
|
DME expression in the diseased tissue of patients
DME expression in the normal tissue adjacent to the diseased tissue of patients
DME expression in the normal tissue of healthy individuals
|
|||||
| Violin Diagram of DME Disease-specific Protein Abundances |
|
Click to View the Clearer Original Diagram | |||
| ICD-11: 2C6Z | Breast cancer | Click to Show/Hide | |||
| The Studied Tissue | Breast tissue | ||||
| The Specified Disease | Breast cancer [ICD-11:2C60-2C6Z] | ||||
| The Expression Level of Disease Section Compare with the Healthy Individual Tissue | p-value: 9.97E-01; Fold-change: -9.62E-02; Z-score: -1.94E-01 | ||||
| The Expression Level of Disease Section Compare with the Adjacent Tissue | p-value: 1.03E-01; Fold-change: 1.50E-01; Z-score: 2.52E-01 | ||||
|
DME expression in the diseased tissue of patients
DME expression in the normal tissue adjacent to the diseased tissue of patients
DME expression in the normal tissue of healthy individuals
|
|||||
| Violin Diagram of DME Disease-specific Protein Abundances |
|
Click to View the Clearer Original Diagram | |||
| ICD-11: 2C73 | Ovarian cancer | Click to Show/Hide | |||
| The Studied Tissue | Ovarian tissue | ||||
| The Specified Disease | Ovarian cancer [ICD-11:2C73] | ||||
| The Expression Level of Disease Section Compare with the Healthy Individual Tissue | p-value: 1.07E-03; Fold-change: 3.59E+00; Z-score: 2.32E+00 | ||||
| The Expression Level of Disease Section Compare with the Adjacent Tissue | p-value: 7.66E-01; Fold-change: -3.12E-01; Z-score: -2.13E-01 | ||||
|
DME expression in the diseased tissue of patients
DME expression in the normal tissue adjacent to the diseased tissue of patients
DME expression in the normal tissue of healthy individuals
|
|||||
| Violin Diagram of DME Disease-specific Protein Abundances |
|
Click to View the Clearer Original Diagram | |||
| ICD-11: 2C77 | Cervical cancer | Click to Show/Hide | |||
| The Studied Tissue | Cervical tissue | ||||
| The Specified Disease | Cervical cancer [ICD-11:2C77] | ||||
| The Expression Level of Disease Section Compare with the Healthy Individual Tissue | p-value: 6.69E-03; Fold-change: -9.05E-01; Z-score: -1.05E+00 | ||||
|
DME expression in the diseased tissue of patients
DME expression in the normal tissue of healthy individuals
|
|||||
| Violin Diagram of DME Disease-specific Protein Abundances |
|
Click to View the Clearer Original Diagram | |||
| ICD-11: 2C78 | Uterine cancer | Click to Show/Hide | |||
| The Studied Tissue | Endometrium tissue | ||||
| The Specified Disease | Uterine cancer [ICD-11:2C78] | ||||
| The Expression Level of Disease Section Compare with the Healthy Individual Tissue | p-value: 2.10E-03; Fold-change: -3.85E-01; Z-score: -2.74E-01 | ||||
| The Expression Level of Disease Section Compare with the Adjacent Tissue | p-value: 2.05E-01; Fold-change: -1.73E+00; Z-score: -7.62E-01 | ||||
|
DME expression in the diseased tissue of patients
DME expression in the normal tissue adjacent to the diseased tissue of patients
DME expression in the normal tissue of healthy individuals
|
|||||
| Violin Diagram of DME Disease-specific Protein Abundances |
|
Click to View the Clearer Original Diagram | |||
| ICD-11: 2C82 | Prostate cancer | Click to Show/Hide | |||
| The Studied Tissue | Prostate | ||||
| The Specified Disease | Prostate cancer [ICD-11:2C82] | ||||
| The Expression Level of Disease Section Compare with the Healthy Individual Tissue | p-value: 4.46E-01; Fold-change: -5.00E-02; Z-score: -3.97E-02 | ||||
|
DME expression in the diseased tissue of patients
DME expression in the normal tissue of healthy individuals
|
|||||
| Violin Diagram of DME Disease-specific Protein Abundances |
|
Click to View the Clearer Original Diagram | |||
| ICD-11: 2C90 | Renal cancer | Click to Show/Hide | |||
| The Studied Tissue | Kidney | ||||
| The Specified Disease | Renal cancer [ICD-11:2C90-2C91] | ||||
| The Expression Level of Disease Section Compare with the Healthy Individual Tissue | p-value: 2.36E-03; Fold-change: 3.80E-01; Z-score: 6.29E-01 | ||||
| The Expression Level of Disease Section Compare with the Adjacent Tissue | p-value: 3.90E-07; Fold-change: 6.79E-01; Z-score: 8.32E-01 | ||||
|
DME expression in the diseased tissue of patients
DME expression in the normal tissue adjacent to the diseased tissue of patients
DME expression in the normal tissue of healthy individuals
|
|||||
| Violin Diagram of DME Disease-specific Protein Abundances |
|
Click to View the Clearer Original Diagram | |||
| ICD-11: 2C92 | Ureter cancer | Click to Show/Hide | |||
| The Studied Tissue | Urothelium | ||||
| The Specified Disease | Ureter cancer [ICD-11:2C92] | ||||
| The Expression Level of Disease Section Compare with the Healthy Individual Tissue | p-value: 5.77E-01; Fold-change: 1.18E-02; Z-score: 8.93E-02 | ||||
|
DME expression in the diseased tissue of patients
DME expression in the normal tissue of healthy individuals
|
|||||
| Violin Diagram of DME Disease-specific Protein Abundances |
|
Click to View the Clearer Original Diagram | |||
| ICD-11: 2C94 | Bladder cancer | Click to Show/Hide | |||
| The Studied Tissue | Bladder tissue | ||||
| The Specified Disease | Bladder cancer [ICD-11:2C94] | ||||
| The Expression Level of Disease Section Compare with the Healthy Individual Tissue | p-value: 7.05E-03; Fold-change: -1.89E+00; Z-score: -1.28E+00 | ||||
|
DME expression in the diseased tissue of patients
DME expression in the normal tissue of healthy individuals
|
|||||
| Violin Diagram of DME Disease-specific Protein Abundances |
|
Click to View the Clearer Original Diagram | |||
| ICD-11: 2D02 | Retinal cancer | Click to Show/Hide | |||
| The Studied Tissue | Uvea | ||||
| The Specified Disease | Retinoblastoma [ICD-11:2D02.2] | ||||
| The Expression Level of Disease Section Compare with the Healthy Individual Tissue | p-value: 8.66E-04; Fold-change: 6.83E-01; Z-score: 2.70E+00 | ||||
|
DME expression in the diseased tissue of patients
DME expression in the normal tissue of healthy individuals
|
|||||
| Violin Diagram of DME Disease-specific Protein Abundances |
|
Click to View the Clearer Original Diagram | |||
| ICD-11: 2D10 | Thyroid cancer | Click to Show/Hide | |||
| The Studied Tissue | Thyroid | ||||
| The Specified Disease | Thyroid cancer [ICD-11:2D10] | ||||
| The Expression Level of Disease Section Compare with the Healthy Individual Tissue | p-value: 1.39E-12; Fold-change: 4.87E-01; Z-score: 1.04E+00 | ||||
| The Expression Level of Disease Section Compare with the Adjacent Tissue | p-value: 7.05E-03; Fold-change: 2.13E-01; Z-score: 4.37E-01 | ||||
|
DME expression in the diseased tissue of patients
DME expression in the normal tissue adjacent to the diseased tissue of patients
DME expression in the normal tissue of healthy individuals
|
|||||
| Violin Diagram of DME Disease-specific Protein Abundances |
|
Click to View the Clearer Original Diagram | |||
| ICD-11: 2D11 | Adrenal cancer | Click to Show/Hide | |||
| The Studied Tissue | Adrenal cortex | ||||
| The Specified Disease | Adrenocortical carcinoma [ICD-11:2D11.Z] | ||||
| The Expression Level of Disease Section Compare with the Other Disease Section | p-value: 3.43E-02; Fold-change: -2.70E-01; Z-score: -1.33E+00 | ||||
|
DME expression in the diseased tissue of patients
DME expression in tissue other than the diseased tissue of patients
|
|||||
| Violin Diagram of DME Disease-specific Protein Abundances |
|
Click to View the Clearer Original Diagram | |||
| ICD-11: 2D12 | Endocrine gland neoplasm | Click to Show/Hide | |||
| The Studied Tissue | Pituitary tissue | ||||
| The Specified Disease | Pituitary cancer [ICD-11:2D12] | ||||
| The Expression Level of Disease Section Compare with the Healthy Individual Tissue | p-value: 8.83E-01; Fold-change: -3.81E-01; Z-score: -5.18E-01 | ||||
|
DME expression in the diseased tissue of patients
DME expression in the normal tissue of healthy individuals
|
|||||
| Violin Diagram of DME Disease-specific Protein Abundances |
|
Click to View the Clearer Original Diagram | |||
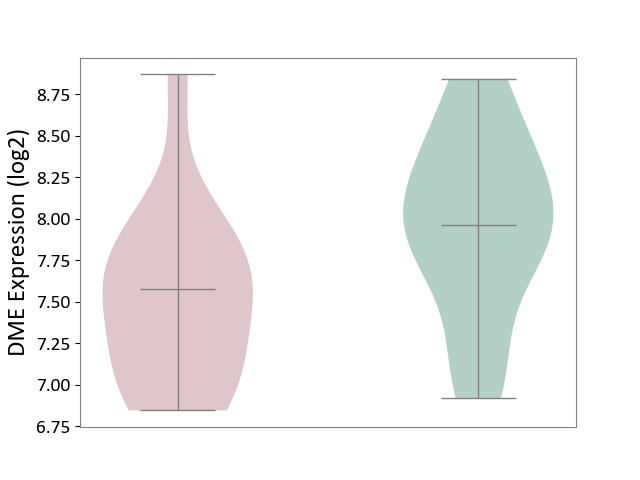
| The Studied Tissue | Pituitary tissue | ||||
| The Specified Disease | Pituitary gonadotrope tumour [ICD-11:2D12] | ||||
| The Expression Level of Disease Section Compare with the Healthy Individual Tissue | p-value: 7.70E-02; Fold-change: -6.66E-01; Z-score: -8.56E-01 | ||||
|
DME expression in the diseased tissue of patients
DME expression in the normal tissue of healthy individuals
|
|||||
| Violin Diagram of DME Disease-specific Protein Abundances |
|
Click to View the Clearer Original Diagram | |||
| ICD-11: 2D42 | Head and neck cancer | Click to Show/Hide | |||
| The Studied Tissue | Head and neck tissue | ||||
| The Specified Disease | Head and neck cancer [ICD-11:2D42] | ||||
| The Expression Level of Disease Section Compare with the Healthy Individual Tissue | p-value: 6.06E-12; Fold-change: 1.05E+00; Z-score: 7.98E-01 | ||||
|
DME expression in the diseased tissue of patients
DME expression in the normal tissue of healthy individuals
|
|||||
| Violin Diagram of DME Disease-specific Protein Abundances |
|
Click to View the Clearer Original Diagram | |||
| ICD Disease Classification 03 | Blood/blood-forming organ disease | Click to Show/Hide | |||
| ICD-11: 3A51 | Sickle cell disorder | Click to Show/Hide | |||
| The Studied Tissue | Peripheral blood | ||||
| The Specified Disease | Sickle cell disease [ICD-11:3A51.0-3A51.3] | ||||
| The Expression Level of Disease Section Compare with the Healthy Individual Tissue | p-value: 5.55E-03; Fold-change: 4.44E-01; Z-score: 1.35E+00 | ||||
|
DME expression in the diseased tissue of patients
DME expression in the normal tissue of healthy individuals
|
|||||
| Violin Diagram of DME Disease-specific Protein Abundances |
|
Click to View the Clearer Original Diagram | |||
| ICD-11: 3A70 | Aplastic anaemia | Click to Show/Hide | |||
| The Studied Tissue | Bone marrow | ||||
| The Specified Disease | Shwachman-Diamond syndrome [ICD-11:3A70.0] | ||||
| The Expression Level of Disease Section Compare with the Healthy Individual Tissue | p-value: 1.24E-02; Fold-change: -3.26E-01; Z-score: -7.78E-01 | ||||
|
DME expression in the diseased tissue of patients
DME expression in the normal tissue of healthy individuals
|
|||||
| Violin Diagram of DME Disease-specific Protein Abundances |
|
Click to View the Clearer Original Diagram | |||
| ICD-11: 3B63 | Thrombocytosis | Click to Show/Hide | |||
| The Studied Tissue | Whole blood | ||||
| The Specified Disease | Thrombocythemia [ICD-11:3B63] | ||||
| The Expression Level of Disease Section Compare with the Healthy Individual Tissue | p-value: 1.94E-03; Fold-change: 5.49E-01; Z-score: 1.74E+00 | ||||
|
DME expression in the diseased tissue of patients
DME expression in the normal tissue of healthy individuals
|
|||||
| Violin Diagram of DME Disease-specific Protein Abundances |
|
Click to View the Clearer Original Diagram | |||
| ICD-11: 3B64 | Thrombocytopenia | Click to Show/Hide | |||
| The Studied Tissue | Whole blood | ||||
| The Specified Disease | Thrombocytopenia [ICD-11:3B64] | ||||
| The Expression Level of Disease Section Compare with the Healthy Individual Tissue | p-value: 5.27E-02; Fold-change: 8.16E-01; Z-score: 5.49E-01 | ||||
|
DME expression in the diseased tissue of patients
DME expression in the normal tissue of healthy individuals
|
|||||
| Violin Diagram of DME Disease-specific Protein Abundances |
|
Click to View the Clearer Original Diagram | |||
| ICD Disease Classification 04 | Immune system disease | Click to Show/Hide | |||
| ICD-11: 4A00 | Immunodeficiency | Click to Show/Hide | |||
| The Studied Tissue | Peripheral blood | ||||
| The Specified Disease | Immunodeficiency [ICD-11:4A00-4A20] | ||||
| The Expression Level of Disease Section Compare with the Healthy Individual Tissue | p-value: 2.56E-02; Fold-change: 6.56E-02; Z-score: 7.65E-01 | ||||
|
DME expression in the diseased tissue of patients
DME expression in the normal tissue of healthy individuals
|
|||||
| Violin Diagram of DME Disease-specific Protein Abundances |
|
Click to View the Clearer Original Diagram | |||
| ICD-11: 4A40 | Lupus erythematosus | Click to Show/Hide | |||
| The Studied Tissue | Whole blood | ||||
| The Specified Disease | Lupus erythematosus [ICD-11:4A40] | ||||
| The Expression Level of Disease Section Compare with the Healthy Individual Tissue | p-value: 1.46E-05; Fold-change: 4.28E-01; Z-score: 4.47E-01 | ||||
|
DME expression in the diseased tissue of patients
DME expression in the normal tissue of healthy individuals
|
|||||
| Violin Diagram of DME Disease-specific Protein Abundances |
|
Click to View the Clearer Original Diagram | |||
| ICD-11: 4A42 | Systemic sclerosis | Click to Show/Hide | |||
| The Studied Tissue | Whole blood | ||||
| The Specified Disease | Scleroderma [ICD-11:4A42.Z] | ||||
| The Expression Level of Disease Section Compare with the Healthy Individual Tissue | p-value: 2.48E-01; Fold-change: 1.88E-01; Z-score: 3.76E-01 | ||||
|
DME expression in the diseased tissue of patients
DME expression in the normal tissue of healthy individuals
|
|||||
| Violin Diagram of DME Disease-specific Protein Abundances |
|
Click to View the Clearer Original Diagram | |||
| ICD-11: 4A43 | Systemic autoimmune disease | Click to Show/Hide | |||
| The Studied Tissue | Salivary gland tissue | ||||
| The Specified Disease | Sjogren's syndrome [ICD-11:4A43.2] | ||||
| The Expression Level of Disease Section Compare with the Healthy Individual Tissue | p-value: 5.62E-02; Fold-change: 4.69E-01; Z-score: 1.62E+00 | ||||
| The Expression Level of Disease Section Compare with the Adjacent Tissue | p-value: 3.49E-01; Fold-change: -2.12E-01; Z-score: -1.65E+00 | ||||
|
DME expression in the diseased tissue of patients
DME expression in the normal tissue adjacent to the diseased tissue of patients
DME expression in the normal tissue of healthy individuals
|
|||||
| Violin Diagram of DME Disease-specific Protein Abundances |
|
Click to View the Clearer Original Diagram | |||
| ICD-11: 4A62 | Behcet disease | Click to Show/Hide | |||
| The Studied Tissue | Peripheral blood | ||||
| The Specified Disease | Behcet's disease [ICD-11:4A62] | ||||
| The Expression Level of Disease Section Compare with the Healthy Individual Tissue | p-value: 8.88E-01; Fold-change: -2.70E-02; Z-score: -6.39E-02 | ||||
|
DME expression in the diseased tissue of patients
DME expression in the normal tissue of healthy individuals
|
|||||
| Violin Diagram of DME Disease-specific Protein Abundances |
|
Click to View the Clearer Original Diagram | |||
| ICD-11: 4B04 | Monocyte count disorder | Click to Show/Hide | |||
| The Studied Tissue | Whole blood | ||||
| The Specified Disease | Autosomal dominant monocytopenia [ICD-11:4B04] | ||||
| The Expression Level of Disease Section Compare with the Healthy Individual Tissue | p-value: 3.28E-01; Fold-change: 2.30E-01; Z-score: 5.74E-01 | ||||
|
DME expression in the diseased tissue of patients
DME expression in the normal tissue of healthy individuals
|
|||||
| Violin Diagram of DME Disease-specific Protein Abundances |
|
Click to View the Clearer Original Diagram | |||
| ICD Disease Classification 05 | Endocrine/nutritional/metabolic disease | Click to Show/Hide | |||
| ICD-11: 5A11 | Type 2 diabetes mellitus | Click to Show/Hide | |||
| The Studied Tissue | Omental adipose tissue | ||||
| The Specified Disease | Obesity related type 2 diabetes [ICD-11:5A11] | ||||
| The Expression Level of Disease Section Compare with the Healthy Individual Tissue | p-value: 1.16E-01; Fold-change: -2.08E-01; Z-score: -5.93E-01 | ||||
|
DME expression in the diseased tissue of patients
DME expression in the normal tissue of healthy individuals
|
|||||
| Violin Diagram of DME Disease-specific Protein Abundances |
|
Click to View the Clearer Original Diagram | |||
| The Studied Tissue | Liver tissue | ||||
| The Specified Disease | Type 2 diabetes [ICD-11:5A11] | ||||
| The Expression Level of Disease Section Compare with the Healthy Individual Tissue | p-value: 3.77E-01; Fold-change: 3.23E-01; Z-score: 7.35E-01 | ||||
|
DME expression in the diseased tissue of patients
DME expression in the normal tissue of healthy individuals
|
|||||
| Violin Diagram of DME Disease-specific Protein Abundances |
|
Click to View the Clearer Original Diagram | |||
| ICD-11: 5A80 | Ovarian dysfunction | Click to Show/Hide | |||
| The Studied Tissue | Vastus lateralis muscle | ||||
| The Specified Disease | Polycystic ovary syndrome [ICD-11:5A80.1] | ||||
| The Expression Level of Disease Section Compare with the Healthy Individual Tissue | p-value: 6.05E-02; Fold-change: 8.15E-02; Z-score: 8.50E-01 | ||||
|
DME expression in the diseased tissue of patients
DME expression in the normal tissue of healthy individuals
|
|||||
| Violin Diagram of DME Disease-specific Protein Abundances |
|
Click to View the Clearer Original Diagram | |||
| ICD-11: 5C51 | Inborn carbohydrate metabolism disorder | Click to Show/Hide | |||
| The Studied Tissue | Biceps muscle | ||||
| The Specified Disease | Pompe disease [ICD-11:5C51.3] | ||||
| The Expression Level of Disease Section Compare with the Healthy Individual Tissue | p-value: 2.82E-01; Fold-change: -1.65E-01; Z-score: -2.27E-01 | ||||
|
DME expression in the diseased tissue of patients
DME expression in the normal tissue of healthy individuals
|
|||||
| Violin Diagram of DME Disease-specific Protein Abundances |
|
Click to View the Clearer Original Diagram | |||
| ICD-11: 5C56 | Lysosomal disease | Click to Show/Hide | |||
| The Studied Tissue | Whole blood | ||||
| The Specified Disease | Batten disease [ICD-11:5C56.1] | ||||
| The Expression Level of Disease Section Compare with the Healthy Individual Tissue | p-value: 6.89E-01; Fold-change: 1.82E-01; Z-score: 2.17E-01 | ||||
|
DME expression in the diseased tissue of patients
DME expression in the normal tissue of healthy individuals
|
|||||
| Violin Diagram of DME Disease-specific Protein Abundances |
|
Click to View the Clearer Original Diagram | |||
| ICD-11: 5C80 | Hyperlipoproteinaemia | Click to Show/Hide | |||
| The Studied Tissue | Peripheral blood | ||||
| The Specified Disease | Familial hypercholesterolemia [ICD-11:5C80.00] | ||||
| The Expression Level of Disease Section Compare with the Healthy Individual Tissue | p-value: 1.39E-01; Fold-change: -3.44E-02; Z-score: -1.13E-01 | ||||
|
DME expression in the diseased tissue of patients
DME expression in the normal tissue of healthy individuals
|
|||||
| Violin Diagram of DME Disease-specific Protein Abundances |
|
Click to View the Clearer Original Diagram | |||
| The Studied Tissue | Whole blood | ||||
| The Specified Disease | Familial hypercholesterolemia [ICD-11:5C80.00] | ||||
| The Expression Level of Disease Section Compare with the Healthy Individual Tissue | p-value: 2.71E-04; Fold-change: 1.92E+00; Z-score: 2.05E+00 | ||||
|
DME expression in the diseased tissue of patients
DME expression in the normal tissue of healthy individuals
|
|||||
| Violin Diagram of DME Disease-specific Protein Abundances |
|
Click to View the Clearer Original Diagram | |||
| ICD Disease Classification 06 | Mental/behavioural/neurodevelopmental disorder | Click to Show/Hide | |||
| ICD-11: 6A02 | Autism spectrum disorder | Click to Show/Hide | |||
| The Studied Tissue | Whole blood | ||||
| The Specified Disease | Autism [ICD-11:6A02] | ||||
| The Expression Level of Disease Section Compare with the Healthy Individual Tissue | p-value: 6.65E-02; Fold-change: 2.29E-01; Z-score: 4.16E-01 | ||||
|
DME expression in the diseased tissue of patients
DME expression in the normal tissue of healthy individuals
|
|||||
| Violin Diagram of DME Disease-specific Protein Abundances |
|
Click to View the Clearer Original Diagram | |||
| ICD-11: 6A20 | Schizophrenia | Click to Show/Hide | |||
| The Studied Tissue | Prefrontal cortex | ||||
| The Specified Disease | Schizophrenia [ICD-11:6A20] | ||||
| The Expression Level of Disease Section Compare with the Healthy Individual Tissue | p-value: 3.26E-01; Fold-change: 1.33E-01; Z-score: 1.12E-01 | ||||
|
DME expression in the diseased tissue of patients
DME expression in the normal tissue of healthy individuals
|
|||||
| Violin Diagram of DME Disease-specific Protein Abundances |
|
Click to View the Clearer Original Diagram | |||
| The Studied Tissue | Superior temporal cortex | ||||
| The Specified Disease | Schizophrenia [ICD-11:6A20] | ||||
| The Expression Level of Disease Section Compare with the Healthy Individual Tissue | p-value: 2.34E-01; Fold-change: 4.46E-02; Z-score: 4.03E-01 | ||||
|
DME expression in the diseased tissue of patients
DME expression in the normal tissue of healthy individuals
|
|||||
| Violin Diagram of DME Disease-specific Protein Abundances |
|
Click to View the Clearer Original Diagram | |||
| ICD-11: 6A60 | Bipolar disorder | Click to Show/Hide | |||
| The Studied Tissue | Prefrontal cortex | ||||
| The Specified Disease | Bipolar disorder [ICD-11:6A60-6A6Z] | ||||
| The Expression Level of Disease Section Compare with the Healthy Individual Tissue | p-value: 1.89E-01; Fold-change: -1.32E-01; Z-score: -2.24E-01 | ||||
|
DME expression in the diseased tissue of patients
DME expression in the normal tissue of healthy individuals
|
|||||
| Violin Diagram of DME Disease-specific Protein Abundances |
|
Click to View the Clearer Original Diagram | |||
| ICD-11: 6A70 | Depressive disorder | Click to Show/Hide | |||
| The Studied Tissue | Whole blood | ||||
| The Specified Disease | Major depressive disorder [ICD-11:6A70-6A7Z] | ||||
| The Expression Level of Disease Section Compare with the Healthy Individual Tissue | p-value: 8.64E-02; Fold-change: 2.18E-01; Z-score: 4.45E-01 | ||||
|
DME expression in the diseased tissue of patients
DME expression in the normal tissue of healthy individuals
|
|||||
| Violin Diagram of DME Disease-specific Protein Abundances |
|
Click to View the Clearer Original Diagram | |||
| The Studied Tissue | Hippocampus | ||||
| The Specified Disease | Major depressive disorder [ICD-11:6A70-6A7Z] | ||||
| The Expression Level of Disease Section Compare with the Healthy Individual Tissue | p-value: 7.89E-01; Fold-change: 9.78E-02; Z-score: 1.72E-01 | ||||
|
DME expression in the diseased tissue of patients
DME expression in the normal tissue of healthy individuals
|
|||||
| Violin Diagram of DME Disease-specific Protein Abundances |
|
Click to View the Clearer Original Diagram | |||
| ICD Disease Classification 08 | Nervous system disease | Click to Show/Hide | |||
| ICD-11: 8A00 | Parkinsonism | Click to Show/Hide | |||
| The Studied Tissue | Substantia nigra tissue | ||||
| The Specified Disease | Parkinson's disease [ICD-11:8A00.0] | ||||
| The Expression Level of Disease Section Compare with the Healthy Individual Tissue | p-value: 2.19E-01; Fold-change: 1.72E-01; Z-score: 5.16E-01 | ||||
|
DME expression in the diseased tissue of patients
DME expression in the normal tissue of healthy individuals
|
|||||
| Violin Diagram of DME Disease-specific Protein Abundances |
|
Click to View the Clearer Original Diagram | |||
| ICD-11: 8A01 | Choreiform disorder | Click to Show/Hide | |||
| The Studied Tissue | Whole blood | ||||
| The Specified Disease | Huntington's disease [ICD-11:8A01.10] | ||||
| The Expression Level of Disease Section Compare with the Healthy Individual Tissue | p-value: 3.48E-01; Fold-change: 4.02E-02; Z-score: 8.75E-02 | ||||
|
DME expression in the diseased tissue of patients
DME expression in the normal tissue of healthy individuals
|
|||||
| Violin Diagram of DME Disease-specific Protein Abundances |
|
Click to View the Clearer Original Diagram | |||
| ICD-11: 8A20 | Alzheimer disease | Click to Show/Hide | |||
| The Studied Tissue | Entorhinal cortex | ||||
| The Specified Disease | Alzheimer's disease [ICD-11:8A20] | ||||
| The Expression Level of Disease Section Compare with the Healthy Individual Tissue | p-value: 3.97E-03; Fold-change: 1.56E-01; Z-score: 4.33E-01 | ||||
|
DME expression in the diseased tissue of patients
DME expression in the normal tissue of healthy individuals
|
|||||
| Violin Diagram of DME Disease-specific Protein Abundances |

|
Click to View the Clearer Original Diagram | |||
| ICD-11: 8A2Y | Neurocognitive impairment | Click to Show/Hide | |||
| The Studied Tissue | White matter tissue | ||||
| The Specified Disease | HIV-associated neurocognitive impairment [ICD-11:8A2Y-8A2Z] | ||||
| The Expression Level of Disease Section Compare with the Healthy Individual Tissue | p-value: 4.53E-01; Fold-change: -1.03E-01; Z-score: -6.11E-01 | ||||
|
DME expression in the diseased tissue of patients
DME expression in the normal tissue of healthy individuals
|
|||||
| Violin Diagram of DME Disease-specific Protein Abundances |
|
Click to View the Clearer Original Diagram | |||
| ICD-11: 8A40 | Multiple sclerosis | Click to Show/Hide | |||
| The Studied Tissue | Plasmacytoid dendritic cells | ||||
| The Specified Disease | Multiple sclerosis [ICD-11:8A40] | ||||
| The Expression Level of Disease Section Compare with the Healthy Individual Tissue | p-value: 9.00E-02; Fold-change: 1.81E-01; Z-score: 6.37E-01 | ||||
|
DME expression in the diseased tissue of patients
DME expression in the normal tissue of healthy individuals
|
|||||
| Violin Diagram of DME Disease-specific Protein Abundances |
|
Click to View the Clearer Original Diagram | |||
| The Studied Tissue | Spinal cord | ||||
| The Specified Disease | Multiple sclerosis [ICD-11:8A40] | ||||
| The Expression Level of Disease Section Compare with the Adjacent Tissue | p-value: 1.99E-01; Fold-change: 8.70E-01; Z-score: 9.33E-01 | ||||
|
DME expression in the diseased tissue of patients
DME expression in the normal tissue adjacent to the diseased tissue of patients
|
|||||
| Violin Diagram of DME Disease-specific Protein Abundances |
|
Click to View the Clearer Original Diagram | |||
| ICD-11: 8A60 | Epilepsy | Click to Show/Hide | |||
| The Studied Tissue | Peritumoral cortex tissue | ||||
| The Specified Disease | Epilepsy [ICD-11:8A60-8A6Z] | ||||
| The Expression Level of Disease Section Compare with the Other Disease Section | p-value: 5.91E-01; Fold-change: -3.15E-02; Z-score: -3.44E-02 | ||||
|
DME expression in the diseased tissue of patients
DME expression in tissue other than the diseased tissue of patients
|
|||||
| Violin Diagram of DME Disease-specific Protein Abundances |
|
Click to View the Clearer Original Diagram | |||
| The Studied Tissue | Whole blood | ||||
| The Specified Disease | Seizure [ICD-11:8A60-8A6Z] | ||||
| The Expression Level of Disease Section Compare with the Healthy Individual Tissue | p-value: 2.73E-02; Fold-change: -3.80E-01; Z-score: -6.89E-01 | ||||
|
DME expression in the diseased tissue of patients
DME expression in the normal tissue of healthy individuals
|
|||||
| Violin Diagram of DME Disease-specific Protein Abundances |
|
Click to View the Clearer Original Diagram | |||
| ICD-11: 8B01 | Subarachnoid haemorrhage | Click to Show/Hide | |||
| The Studied Tissue | Intracranial artery | ||||
| The Specified Disease | Intracranial aneurysm [ICD-11:8B01.0] | ||||
| The Expression Level of Disease Section Compare with the Healthy Individual Tissue | p-value: 6.28E-05; Fold-change: 1.18E+00; Z-score: 2.10E+00 | ||||
|
DME expression in the diseased tissue of patients
DME expression in the normal tissue of healthy individuals
|
|||||
| Violin Diagram of DME Disease-specific Protein Abundances |
|
Click to View the Clearer Original Diagram | |||
| ICD-11: 8B11 | Cerebral ischaemic stroke | Click to Show/Hide | |||
| The Studied Tissue | Whole blood | ||||
| The Specified Disease | Cardioembolic stroke [ICD-11:8B11.20] | ||||
| The Expression Level of Disease Section Compare with the Healthy Individual Tissue | p-value: 3.86E-01; Fold-change: -2.04E-01; Z-score: -4.61E-01 | ||||
|
DME expression in the diseased tissue of patients
DME expression in the normal tissue of healthy individuals
|
|||||
| Violin Diagram of DME Disease-specific Protein Abundances |
|
Click to View the Clearer Original Diagram | |||
| The Studied Tissue | Peripheral blood | ||||
| The Specified Disease | Ischemic stroke [ICD-11:8B11] | ||||
| The Expression Level of Disease Section Compare with the Healthy Individual Tissue | p-value: 2.89E-01; Fold-change: 1.83E-01; Z-score: 3.08E-01 | ||||
|
DME expression in the diseased tissue of patients
DME expression in the normal tissue of healthy individuals
|
|||||
| Violin Diagram of DME Disease-specific Protein Abundances |
|
Click to View the Clearer Original Diagram | |||
| ICD-11: 8B60 | Motor neuron disease | Click to Show/Hide | |||
| The Studied Tissue | Skin | ||||
| The Specified Disease | Lateral sclerosis [ICD-11:8B60.4] | ||||
| The Expression Level of Disease Section Compare with the Healthy Individual Tissue | p-value: 2.46E-01; Fold-change: 7.05E-01; Z-score: 9.44E-01 | ||||
|
DME expression in the diseased tissue of patients
DME expression in the normal tissue of healthy individuals
|
|||||
| Violin Diagram of DME Disease-specific Protein Abundances |
|
Click to View the Clearer Original Diagram | |||
| The Studied Tissue | Cervical spinal cord | ||||
| The Specified Disease | Lateral sclerosis [ICD-11:8B60.4] | ||||
| The Expression Level of Disease Section Compare with the Healthy Individual Tissue | p-value: 8.19E-01; Fold-change: -1.40E-02; Z-score: -9.21E-02 | ||||
|
DME expression in the diseased tissue of patients
DME expression in the normal tissue of healthy individuals
|
|||||
| Violin Diagram of DME Disease-specific Protein Abundances |
|
Click to View the Clearer Original Diagram | |||
| ICD-11: 8C70 | Muscular dystrophy | Click to Show/Hide | |||
| The Studied Tissue | Muscle tissue | ||||
| The Specified Disease | Myopathy [ICD-11:8C70.6] | ||||
| The Expression Level of Disease Section Compare with the Healthy Individual Tissue | p-value: 3.14E-03; Fold-change: 2.65E-01; Z-score: 1.10E+00 | ||||
|
DME expression in the diseased tissue of patients
DME expression in the normal tissue of healthy individuals
|
|||||
| Violin Diagram of DME Disease-specific Protein Abundances |
|
Click to View the Clearer Original Diagram | |||
| ICD-11: 8C75 | Distal myopathy | Click to Show/Hide | |||
| The Studied Tissue | Muscle tissue | ||||
| The Specified Disease | Tibial muscular dystrophy [ICD-11:8C75] | ||||
| The Expression Level of Disease Section Compare with the Healthy Individual Tissue | p-value: 1.18E-07; Fold-change: 6.15E-01; Z-score: 4.12E+00 | ||||
|
DME expression in the diseased tissue of patients
DME expression in the normal tissue of healthy individuals
|
|||||
| Violin Diagram of DME Disease-specific Protein Abundances |
|
Click to View the Clearer Original Diagram | |||
| ICD Disease Classification 09 | Visual system disease | Click to Show/Hide | |||
| ICD-11: 9A96 | Anterior uveitis | Click to Show/Hide | |||
| The Studied Tissue | Peripheral monocyte | ||||
| The Specified Disease | Autoimmune uveitis [ICD-11:9A96] | ||||
| The Expression Level of Disease Section Compare with the Healthy Individual Tissue | p-value: 1.10E-01; Fold-change: 3.78E-01; Z-score: 1.92E+00 | ||||
|
DME expression in the diseased tissue of patients
DME expression in the normal tissue of healthy individuals
|
|||||
| Violin Diagram of DME Disease-specific Protein Abundances |
|
Click to View the Clearer Original Diagram | |||
| ICD Disease Classification 11 | Circulatory system disease | Click to Show/Hide | |||
| ICD-11: BA41 | Myocardial infarction | Click to Show/Hide | |||
| The Studied Tissue | Peripheral blood | ||||
| The Specified Disease | Myocardial infarction [ICD-11:BA41-BA50] | ||||
| The Expression Level of Disease Section Compare with the Healthy Individual Tissue | p-value: 5.95E-04; Fold-change: 1.79E+00; Z-score: 9.84E-01 | ||||
|
DME expression in the diseased tissue of patients
DME expression in the normal tissue of healthy individuals
|
|||||
| Violin Diagram of DME Disease-specific Protein Abundances |
|
Click to View the Clearer Original Diagram | |||
| ICD-11: BA80 | Coronary artery disease | Click to Show/Hide | |||
| The Studied Tissue | Peripheral blood | ||||
| The Specified Disease | Coronary artery disease [ICD-11:BA80-BA8Z] | ||||
| The Expression Level of Disease Section Compare with the Healthy Individual Tissue | p-value: 1.88E-01; Fold-change: 9.39E-01; Z-score: 1.19E+00 | ||||
|
DME expression in the diseased tissue of patients
DME expression in the normal tissue of healthy individuals
|
|||||
| Violin Diagram of DME Disease-specific Protein Abundances |
|
Click to View the Clearer Original Diagram | |||
| ICD-11: BB70 | Aortic valve stenosis | Click to Show/Hide | |||
| The Studied Tissue | Calcified aortic valve | ||||
| The Specified Disease | Aortic stenosis [ICD-11:BB70] | ||||
| The Expression Level of Disease Section Compare with the Healthy Individual Tissue | p-value: 5.42E-01; Fold-change: 4.22E-01; Z-score: 4.02E-01 | ||||
|
DME expression in the diseased tissue of patients
DME expression in the normal tissue of healthy individuals
|
|||||
| Violin Diagram of DME Disease-specific Protein Abundances |
|
Click to View the Clearer Original Diagram | |||
| ICD Disease Classification 12 | Respiratory system disease | Click to Show/Hide | |||
| ICD-11: 7A40 | Central sleep apnoea | Click to Show/Hide | |||
| The Studied Tissue | Hyperplastic tonsil | ||||
| The Specified Disease | Apnea [ICD-11:7A40] | ||||
| The Expression Level of Disease Section Compare with the Healthy Individual Tissue | p-value: 5.40E-01; Fold-change: 7.90E-01; Z-score: 7.97E-01 | ||||
|
DME expression in the diseased tissue of patients
DME expression in the normal tissue of healthy individuals
|
|||||
| Violin Diagram of DME Disease-specific Protein Abundances |
|
Click to View the Clearer Original Diagram | |||
| ICD-11: CA08 | Vasomotor or allergic rhinitis | Click to Show/Hide | |||
| The Studied Tissue | Peripheral blood | ||||
| The Specified Disease | Olive pollen allergy [ICD-11:CA08.00] | ||||
| The Expression Level of Disease Section Compare with the Healthy Individual Tissue | p-value: 7.93E-01; Fold-change: -1.56E-01; Z-score: -2.98E-01 | ||||
|
DME expression in the diseased tissue of patients
DME expression in the normal tissue of healthy individuals
|
|||||
| Violin Diagram of DME Disease-specific Protein Abundances |
|
Click to View the Clearer Original Diagram | |||
| ICD-11: CA0A | Chronic rhinosinusitis | Click to Show/Hide | |||
| The Studied Tissue | Sinus mucosa tissue | ||||
| The Specified Disease | Chronic rhinosinusitis [ICD-11:CA0A] | ||||
| The Expression Level of Disease Section Compare with the Healthy Individual Tissue | p-value: 1.58E-01; Fold-change: 9.51E-02; Z-score: 8.30E-01 | ||||
|
DME expression in the diseased tissue of patients
DME expression in the normal tissue of healthy individuals
|
|||||
| Violin Diagram of DME Disease-specific Protein Abundances |
|
Click to View the Clearer Original Diagram | |||
| ICD-11: CA22 | Chronic obstructive pulmonary disease | Click to Show/Hide | |||
| The Studied Tissue | Lung tissue | ||||
| The Specified Disease | Chronic obstructive pulmonary disease [ICD-11:CA22] | ||||
| The Expression Level of Disease Section Compare with the Healthy Individual Tissue | p-value: 2.04E-01; Fold-change: -8.41E-02; Z-score: -1.63E-01 | ||||
|
DME expression in the diseased tissue of patients
DME expression in the normal tissue of healthy individuals
|
|||||
| Violin Diagram of DME Disease-specific Protein Abundances |
|
Click to View the Clearer Original Diagram | |||
| The Studied Tissue | Small airway epithelium | ||||
| The Specified Disease | Chronic obstructive pulmonary disease [ICD-11:CA22] | ||||
| The Expression Level of Disease Section Compare with the Healthy Individual Tissue | p-value: 8.46E-05; Fold-change: 2.14E-01; Z-score: 6.23E-01 | ||||
|
DME expression in the diseased tissue of patients
DME expression in the normal tissue of healthy individuals
|
|||||
| Violin Diagram of DME Disease-specific Protein Abundances |
|
Click to View the Clearer Original Diagram | |||
| ICD-11: CA23 | Asthma | Click to Show/Hide | |||
| The Studied Tissue | Nasal and bronchial airway | ||||
| The Specified Disease | Asthma [ICD-11:CA23] | ||||
| The Expression Level of Disease Section Compare with the Healthy Individual Tissue | p-value: 5.11E-09; Fold-change: 5.07E-01; Z-score: 9.56E-01 | ||||
|
DME expression in the diseased tissue of patients
DME expression in the normal tissue of healthy individuals
|
|||||
| Violin Diagram of DME Disease-specific Protein Abundances |
|
Click to View the Clearer Original Diagram | |||
| ICD-11: CB03 | Idiopathic interstitial pneumonitis | Click to Show/Hide | |||
| The Studied Tissue | Lung tissue | ||||
| The Specified Disease | Idiopathic pulmonary fibrosis [ICD-11:CB03.4] | ||||
| The Expression Level of Disease Section Compare with the Healthy Individual Tissue | p-value: 1.71E-02; Fold-change: 7.25E-01; Z-score: 2.30E+00 | ||||
|
DME expression in the diseased tissue of patients
DME expression in the normal tissue of healthy individuals
|
|||||
| Violin Diagram of DME Disease-specific Protein Abundances |
|
Click to View the Clearer Original Diagram | |||
| ICD Disease Classification 13 | Digestive system disease | Click to Show/Hide | |||
| ICD-11: DA0C | Periodontal disease | Click to Show/Hide | |||
| The Studied Tissue | Gingival tissue | ||||
| The Specified Disease | Periodontal disease [ICD-11:DA0C] | ||||
| The Expression Level of Disease Section Compare with the Adjacent Tissue | p-value: 1.41E-03; Fold-change: -2.52E-01; Z-score: -5.57E-01 | ||||
|
DME expression in the diseased tissue of patients
DME expression in the normal tissue adjacent to the diseased tissue of patients
|
|||||
| Violin Diagram of DME Disease-specific Protein Abundances |
|
Click to View the Clearer Original Diagram | |||
| ICD-11: DA42 | Gastritis | Click to Show/Hide | |||
| The Studied Tissue | Gastric antrum tissue | ||||
| The Specified Disease | Eosinophilic gastritis [ICD-11:DA42.2] | ||||
| The Expression Level of Disease Section Compare with the Adjacent Tissue | p-value: 1.19E-01; Fold-change: 1.53E+00; Z-score: 1.22E+00 | ||||
|
DME expression in the diseased tissue of patients
DME expression in the normal tissue adjacent to the diseased tissue of patients
|
|||||
| Violin Diagram of DME Disease-specific Protein Abundances |
|
Click to View the Clearer Original Diagram | |||
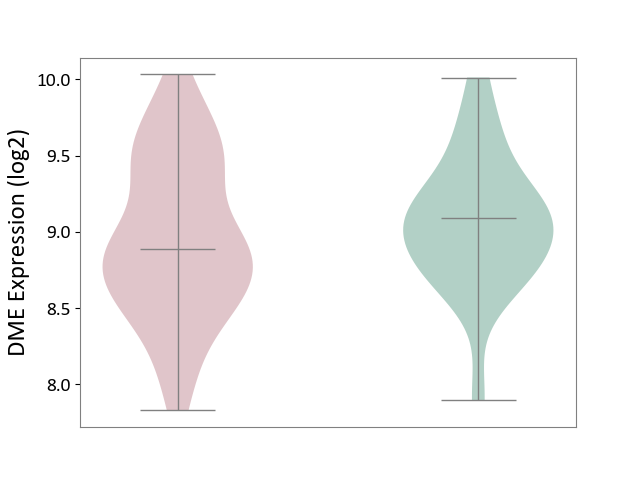
| ICD-11: DB92 | Non-alcoholic fatty liver disease | Click to Show/Hide | |||
| The Studied Tissue | Liver tissue | ||||
| The Specified Disease | Non-alcoholic fatty liver disease [ICD-11:DB92] | ||||
| The Expression Level of Disease Section Compare with the Healthy Individual Tissue | p-value: 2.71E-01; Fold-change: -6.56E-02; Z-score: -3.30E-01 | ||||
|
DME expression in the diseased tissue of patients
DME expression in the normal tissue of healthy individuals
|
|||||
| Violin Diagram of DME Disease-specific Protein Abundances |
|
Click to View the Clearer Original Diagram | |||
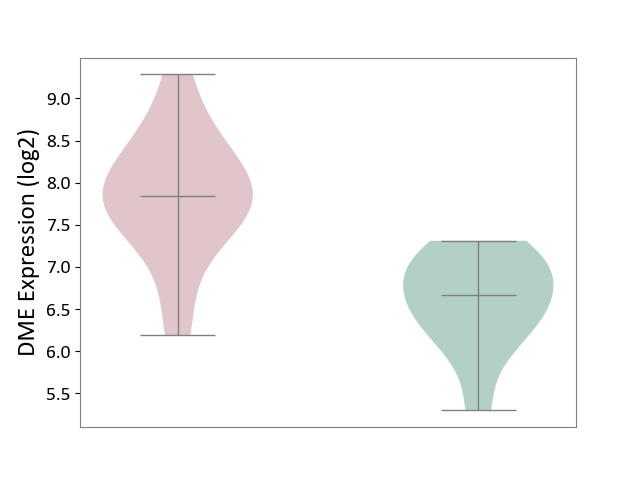
| ICD-11: DB99 | Hepatic failure | Click to Show/Hide | |||
| The Studied Tissue | Liver tissue | ||||
| The Specified Disease | Liver failure [ICD-11:DB99.7-DB99.8] | ||||
| The Expression Level of Disease Section Compare with the Healthy Individual Tissue | p-value: 3.79E-03; Fold-change: 1.24E+00; Z-score: 2.72E+00 | ||||
|
DME expression in the diseased tissue of patients
DME expression in the normal tissue of healthy individuals
|
|||||
| Violin Diagram of DME Disease-specific Protein Abundances |
|
Click to View the Clearer Original Diagram | |||
| ICD-11: DD71 | Ulcerative colitis | Click to Show/Hide | |||
| The Studied Tissue | Colon mucosal tissue | ||||
| The Specified Disease | Ulcerative colitis [ICD-11:DD71] | ||||
| The Expression Level of Disease Section Compare with the Adjacent Tissue | p-value: 9.12E-01; Fold-change: -1.79E-01; Z-score: -2.05E-01 | ||||
|
DME expression in the diseased tissue of patients
DME expression in tissue other than the diseased tissue of patients
|
|||||
| Violin Diagram of DME Disease-specific Protein Abundances |
|
Click to View the Clearer Original Diagram | |||
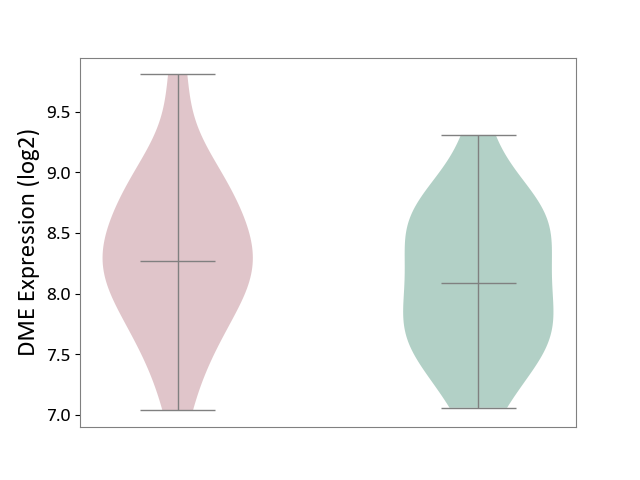
| ICD-11: DD91 | Irritable bowel syndrome | Click to Show/Hide | |||
| The Studied Tissue | Rectal colon tissue | ||||
| The Specified Disease | Irritable bowel syndrome [ICD-11:DD91.0] | ||||
| The Expression Level of Disease Section Compare with the Healthy Individual Tissue | p-value: 4.10E-01; Fold-change: -3.87E-02; Z-score: -1.51E-01 | ||||
|
DME expression in the diseased tissue of patients
DME expression in the normal tissue of healthy individuals
|
|||||
| Violin Diagram of DME Disease-specific Protein Abundances |
|
Click to View the Clearer Original Diagram | |||
| ICD Disease Classification 14 | Skin disease | Click to Show/Hide | |||
| ICD-11: EA80 | Atopic eczema | Click to Show/Hide | |||
| The Studied Tissue | Skin | ||||
| The Specified Disease | Atopic dermatitis [ICD-11:EA80] | ||||
| The Expression Level of Disease Section Compare with the Healthy Individual Tissue | p-value: 4.11E-05; Fold-change: -3.71E-01; Z-score: -1.66E+00 | ||||
|
DME expression in the diseased tissue of patients
DME expression in the normal tissue of healthy individuals
|
|||||
| Violin Diagram of DME Disease-specific Protein Abundances |
|
Click to View the Clearer Original Diagram | |||
| ICD-11: EA90 | Psoriasis | Click to Show/Hide | |||
| The Studied Tissue | Skin | ||||
| The Specified Disease | Psoriasis [ICD-11:EA90] | ||||
| The Expression Level of Disease Section Compare with the Healthy Individual Tissue | p-value: 7.86E-02; Fold-change: 1.05E-01; Z-score: 2.02E-01 | ||||
| The Expression Level of Disease Section Compare with the Adjacent Tissue | p-value: 6.56E-07; Fold-change: 2.47E-01; Z-score: 4.84E-01 | ||||
|
DME expression in the diseased tissue of patients
DME expression in the normal tissue adjacent to the diseased tissue of patients
DME expression in the normal tissue of healthy individuals
|
|||||
| Violin Diagram of DME Disease-specific Protein Abundances |
|
Click to View the Clearer Original Diagram | |||
| ICD-11: ED63 | Acquired hypomelanotic disorder | Click to Show/Hide | |||
| The Studied Tissue | Skin | ||||
| The Specified Disease | Vitiligo [ICD-11:ED63.0] | ||||
| The Expression Level of Disease Section Compare with the Healthy Individual Tissue | p-value: 3.51E-02; Fold-change: 1.75E-01; Z-score: 6.04E-01 | ||||
|
DME expression in the diseased tissue of patients
DME expression in the normal tissue of healthy individuals
|
|||||
| Violin Diagram of DME Disease-specific Protein Abundances |
|
Click to View the Clearer Original Diagram | |||
| ICD-11: ED70 | Alopecia or hair loss | Click to Show/Hide | |||
| The Studied Tissue | Skin from scalp | ||||
| The Specified Disease | Alopecia [ICD-11:ED70] | ||||
| The Expression Level of Disease Section Compare with the Healthy Individual Tissue | p-value: 5.55E-02; Fold-change: 2.50E-01; Z-score: 4.84E-01 | ||||
|
DME expression in the diseased tissue of patients
DME expression in the normal tissue of healthy individuals
|
|||||
| Violin Diagram of DME Disease-specific Protein Abundances |
|
Click to View the Clearer Original Diagram | |||
| ICD-11: EK0Z | Contact dermatitis | Click to Show/Hide | |||
| The Studied Tissue | Skin | ||||
| The Specified Disease | Sensitive skin [ICD-11:EK0Z] | ||||
| The Expression Level of Disease Section Compare with the Healthy Individual Tissue | p-value: 2.13E-02; Fold-change: 2.40E-01; Z-score: 9.13E-01 | ||||
|
DME expression in the diseased tissue of patients
DME expression in the normal tissue of healthy individuals
|
|||||
| Violin Diagram of DME Disease-specific Protein Abundances |
|
Click to View the Clearer Original Diagram | |||
| ICD Disease Classification 15 | Musculoskeletal system/connective tissue disease | Click to Show/Hide | |||
| ICD-11: FA00 | Osteoarthritis | Click to Show/Hide | |||
| The Studied Tissue | Peripheral blood | ||||
| The Specified Disease | Arthropathy [ICD-11:FA00-FA5Z] | ||||
| The Expression Level of Disease Section Compare with the Healthy Individual Tissue | p-value: 4.14E-02; Fold-change: 3.87E-01; Z-score: 8.07E-01 | ||||
|
DME expression in the diseased tissue of patients
DME expression in the normal tissue of healthy individuals
|
|||||
| Violin Diagram of DME Disease-specific Protein Abundances |
|
Click to View the Clearer Original Diagram | |||
| The Studied Tissue | Synovial tissue | ||||
| The Specified Disease | Osteoarthritis [ICD-11:FA00-FA0Z] | ||||
| The Expression Level of Disease Section Compare with the Healthy Individual Tissue | p-value: 7.89E-01; Fold-change: 2.37E-02; Z-score: 2.18E-02 | ||||
|
DME expression in the diseased tissue of patients
DME expression in the normal tissue of healthy individuals
|
|||||
| Violin Diagram of DME Disease-specific Protein Abundances |
|
Click to View the Clearer Original Diagram | |||
| ICD-11: FA20 | Rheumatoid arthritis | Click to Show/Hide | |||
| The Studied Tissue | Peripheral blood | ||||
| The Specified Disease | Childhood onset rheumatic disease [ICD-11:FA20.Z] | ||||
| The Expression Level of Disease Section Compare with the Healthy Individual Tissue | p-value: 1.32E-02; Fold-change: 5.08E-01; Z-score: 7.11E-01 | ||||
|
DME expression in the diseased tissue of patients
DME expression in the normal tissue of healthy individuals
|
|||||
| Violin Diagram of DME Disease-specific Protein Abundances |
|
Click to View the Clearer Original Diagram | |||
| The Studied Tissue | Synovial tissue | ||||
| The Specified Disease | Rheumatoid arthritis [ICD-11:FA20] | ||||
| The Expression Level of Disease Section Compare with the Healthy Individual Tissue | p-value: 7.25E-01; Fold-change: -4.31E-02; Z-score: -5.74E-02 | ||||
|
DME expression in the diseased tissue of patients
DME expression in the normal tissue of healthy individuals
|
|||||
| Violin Diagram of DME Disease-specific Protein Abundances |
|
Click to View the Clearer Original Diagram | |||
| ICD-11: FA24 | Juvenile idiopathic arthritis | Click to Show/Hide | |||
| The Studied Tissue | Peripheral blood | ||||
| The Specified Disease | Juvenile idiopathic arthritis [ICD-11:FA24] | ||||
| The Expression Level of Disease Section Compare with the Healthy Individual Tissue | p-value: 6.53E-09; Fold-change: 4.11E-01; Z-score: 8.73E-01 | ||||
|
DME expression in the diseased tissue of patients
DME expression in the normal tissue of healthy individuals
|
|||||
| Violin Diagram of DME Disease-specific Protein Abundances |
|
Click to View the Clearer Original Diagram | |||
| ICD-11: FA92 | Inflammatory spondyloarthritis | Click to Show/Hide | |||
| The Studied Tissue | Pheripheral blood | ||||
| The Specified Disease | Ankylosing spondylitis [ICD-11:FA92.0Z] | ||||
| The Expression Level of Disease Section Compare with the Healthy Individual Tissue | p-value: 1.13E-01; Fold-change: 2.70E-01; Z-score: 5.97E-01 | ||||
|
DME expression in the diseased tissue of patients
DME expression in the normal tissue of healthy individuals
|
|||||
| Violin Diagram of DME Disease-specific Protein Abundances |
|
Click to View the Clearer Original Diagram | |||
| ICD-11: FB83 | Low bone mass disorder | Click to Show/Hide | |||
| The Studied Tissue | Bone marrow | ||||
| The Specified Disease | Osteoporosis [ICD-11:FB83.1] | ||||
| The Expression Level of Disease Section Compare with the Healthy Individual Tissue | p-value: 9.61E-01; Fold-change: 2.43E-01; Z-score: 2.96E-01 | ||||
|
DME expression in the diseased tissue of patients
DME expression in the normal tissue of healthy individuals
|
|||||
| Violin Diagram of DME Disease-specific Protein Abundances |
|
Click to View the Clearer Original Diagram | |||
| ICD Disease Classification 16 | Genitourinary system disease | Click to Show/Hide | |||
| ICD-11: GA10 | Endometriosis | Click to Show/Hide | |||
| The Studied Tissue | Endometrium tissue | ||||
| The Specified Disease | Endometriosis [ICD-11:GA10] | ||||
| The Expression Level of Disease Section Compare with the Healthy Individual Tissue | p-value: 2.17E-01; Fold-change: 6.85E-01; Z-score: 4.32E-01 | ||||
|
DME expression in the diseased tissue of patients
DME expression in the normal tissue of healthy individuals
|
|||||
| Violin Diagram of DME Disease-specific Protein Abundances |
|
Click to View the Clearer Original Diagram | |||
| ICD-11: GC00 | Cystitis | Click to Show/Hide | |||
| The Studied Tissue | Bladder tissue | ||||
| The Specified Disease | Interstitial cystitis [ICD-11:GC00.3] | ||||
| The Expression Level of Disease Section Compare with the Healthy Individual Tissue | p-value: 2.79E-01; Fold-change: 1.05E+00; Z-score: 1.20E+00 | ||||
|
DME expression in the diseased tissue of patients
DME expression in the normal tissue of healthy individuals
|
|||||
| Violin Diagram of DME Disease-specific Protein Abundances |
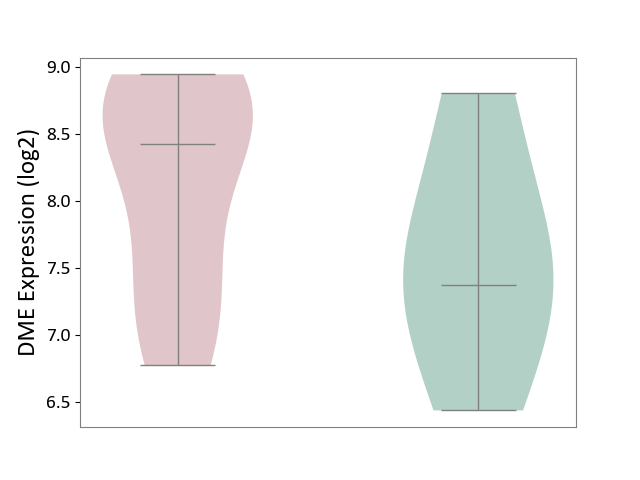
|
Click to View the Clearer Original Diagram | |||
| ICD Disease Classification 19 | Condition originating in perinatal period | Click to Show/Hide | |||
| ICD-11: KA21 | Short gestation disorder | Click to Show/Hide | |||
| The Studied Tissue | Myometrium | ||||
| The Specified Disease | Preterm birth [ICD-11:KA21.4Z] | ||||
| The Expression Level of Disease Section Compare with the Healthy Individual Tissue | p-value: 4.81E-01; Fold-change: -1.01E+00; Z-score: -8.48E-01 | ||||
|
DME expression in the diseased tissue of patients
DME expression in the normal tissue of healthy individuals
|
|||||
| Violin Diagram of DME Disease-specific Protein Abundances |
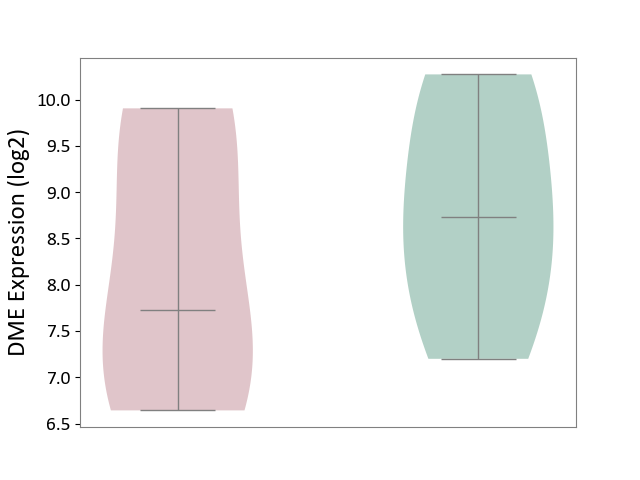
|
Click to View the Clearer Original Diagram | |||
| ICD Disease Classification 20 | Developmental anomaly | Click to Show/Hide | |||
| ICD-11: LD2C | Overgrowth syndrome | Click to Show/Hide | |||
| The Studied Tissue | Adipose tissue | ||||
| The Specified Disease | Simpson golabi behmel syndrome [ICD-11:LD2C] | ||||
| The Expression Level of Disease Section Compare with the Healthy Individual Tissue | p-value: 3.37E-01; Fold-change: 1.03E-02; Z-score: 3.76E-02 | ||||
|
DME expression in the diseased tissue of patients
DME expression in the normal tissue of healthy individuals
|
|||||
| Violin Diagram of DME Disease-specific Protein Abundances |
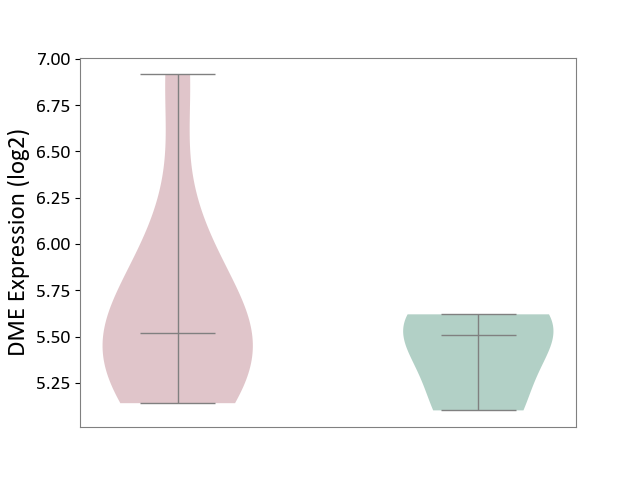
|
Click to View the Clearer Original Diagram | |||
| ICD-11: LD2D | Phakomatoses/hamartoneoplastic syndrome | Click to Show/Hide | |||
| The Studied Tissue | Perituberal tissue | ||||
| The Specified Disease | Tuberous sclerosis complex [ICD-11:LD2D.2] | ||||
| The Expression Level of Disease Section Compare with the Healthy Individual Tissue | p-value: 3.28E-02; Fold-change: 1.04E+00; Z-score: 6.58E+00 | ||||
|
DME expression in the diseased tissue of patients
DME expression in the normal tissue of healthy individuals
|
|||||
| Violin Diagram of DME Disease-specific Protein Abundances |
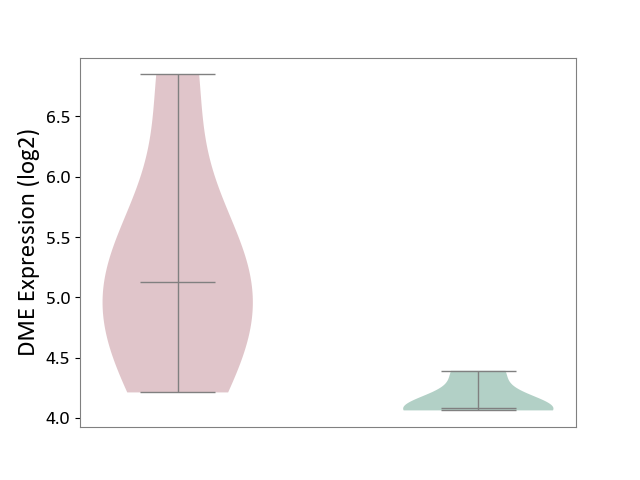
|
Click to View the Clearer Original Diagram | |||
| References | |||||
|---|---|---|---|---|---|
| 1 | Substrates, inducers, inhibitors and structure-activity relationships of human Cytochrome P450 2C9 and implications in drug development. Curr Med Chem. 2009;16(27):3480-675. | ||||
| 2 | Cannabinoid Metabolites as Inhibitors of Major Hepatic CYP450 Enzymes, with Implications for Cannabis-Drug Interactions | ||||
| 3 | The KEGG resource for deciphering the genome | ||||
| 4 | Metabolism of carvedilol in dogs, rats, and mice Drug Metab Dispos. 1998 Oct;26(10):958-69. | ||||
| 5 | Peroxidative free radical formation and O-demethylation of etoposide(VP-16) and teniposide(VM-26). Biochem Biophys Res Commun. 1986 Feb 26;135(1):215-20. | ||||
| 6 | DrugBank(Pharmacology-Metabolism)Ketobemidone hydrochloride | ||||
| 7 | DrugBank(Pharmacology-Metabolism)Aceclofenac | ||||
| 8 | Divergent cyclooxygenase responses to fatty acid structure and peroxide level in fish and mammalian prostaglandin H synthases. FASEB J. 2006 Jun;20(8):1097-108. | ||||
| 9 | Identification and functional characterization of polymorphisms in human cyclooxygenase-1 (PTGS1). Pharmacogenet Genomics. 2007 Feb;17(2):145-60. | ||||
| 10 | Role of cytochrome P450 enzymes in the bioactivation of polyunsaturated fatty acids. Biochim Biophys Acta. 2011 Jan;1814(1):210-22. | ||||
| 11 | The human UDP-glucuronosyltransferase UGT1A3 is highly selective towards N2 in the tetrazole ring of losartan, candesartan, and zolarsartan. Biochem Pharmacol. 2008 Sep 15;76(6):763-72. | ||||
| 12 | DrugBank(Pharmacology-Metabolism)Diazepam | ||||
| 13 | Pharmacokinetics of Diazepam and Its Metabolites in Urine of Chinese Participants. Drugs R D. 2022 Mar;22(1):43-50. doi: 10.1007/s40268-021-00375-y. | ||||
| 14 | Kinetic disposition of diazepam and its metabolites after intravenous administration of diazepam in the horse: Relevance for doping control. J Vet Pharmacol Ther. 2021 Sep;44(5):733-744. doi: 10.1111/jvp.12991. | ||||
| 15 | Gamma-linolenic acid, Dihommo-gamma linolenic, Eicosanoids and Inflammatory Processes | ||||
| 16 | Biotransformation of irbesartan in man Drug Metab Dispos. 1998 May;26(5):408-17. | ||||
| 17 | Quantitative determination of the urinary excretion of ketobemidone and four of its metabolites after intravenous and oral administration in man Drug Metab Dispos. 1981 Jul-Aug;9(4):376-80. | ||||
If you find any error in data or bug in web service, please kindly report it to Dr. Yin and Dr. Li.