

Details of Drug-Metabolizing Enzyme (DME)
| Full List of Drug(s) Metabolized by This DME | |||||
|---|---|---|---|---|---|
| Drugs Approved by FDA | Click to Show/Hide the Full List of Drugs: 55 Drugs | ||||
Thalidomide |
Drug Info | Approved | Breast cancer | ICD11: 2C60 | [1] |
Tamoxifen citrate |
Drug Info | Approved | Breast cancer | ICD11: 2C60 | [2] |
Nicotine |
Drug Info | Approved | Nicotine dependence | ICD11: 6C4A | [3] |
Apremilast |
Drug Info | Approved | Psoriasis vulgaris | ICD11: EA90 | [4] |
Dronabinol |
Drug Info | Approved | Anorexia nervosa | ICD11: 6B80 | [5] |
Montelukast sodium |
Drug Info | Approved | Asthma | ICD11: CA23 | [6] |
Progesterone |
Drug Info | Approved | Premature labour | ICD11: JB00 | [7] |
Lidocaine |
Drug Info | Approved | Anaesthesia | ICD11: 8E22 | [7] |
Metronidazole |
Drug Info | Approved | Amebiasis | ICD11: 1A36 | [8] |
Ifosfamide |
Drug Info | Approved | Lung cancer | ICD11: 2C25 | [9] |
Tretinoin |
Drug Info | Approved | Acne vulgaris | ICD11: ED80 | [7] |
Valproic acid |
Drug Info | Approved | Epilepsy | ICD11: 8A60 | [10] |
Halothane |
Drug Info | Approved | Anaesthesia | ICD11: 8E22 | [11] |
Cisapride |
Drug Info | Approved | Gastro-oesophageal reflux disease | ICD11: DA22 | [12] |
Lorcaserin |
Drug Info | Approved | Obesity | ICD11: 5B81 | [13] |
Nevirapine |
Drug Info | Approved | Human immunodeficiency virus infection | ICD11: 1C60 | [6] |
Norethindrone acetate |
Drug Info | Approved | Menorrhagia | ICD11: GA20 | [14] |
Belinostat |
Drug Info | Approved | Anaplastic large cell lymphoma | ICD11: 2A90 | [15] |
Cenobamate |
Drug Info | Approved | Focal seizure | ICD11: 8A68 | [16] |
Cyclophosphamide |
Drug Info | Approved | Multiple myeloma | ICD11: 2A83 | [17] |
Dexmedetomidine hydrochloride |
Drug Info | Approved | Tension headache | ICD11: 8A81 | [18] |
Efavirenz |
Drug Info | Approved | Human immunodeficiency virus infection | ICD11: 1C60 | [19] |
Flurazepam |
Drug Info | Approved | Insomnia | ICD11: 7A00 | [20] |
Azelastine |
Drug Info | Approved | Allergic rhinitis | ICD11: CA08 | [21] |
Clozapine |
Drug Info | Approved | Schizophrenia | ICD11: 6A20 | [22] |
Methimazole |
Drug Info | Approved | Thyrotoxicosis | ICD11: 5A02 | [23], [24] |
Methimazole |
Drug Info | Approved | Thyrotoxicosis | ICD11: 5A02 | [24] |
Propofol |
Drug Info | Approved | Anaesthesia | ICD11: 8E22 | [25] |
Vortioxetine hydrobromide |
Drug Info | Approved | Depression | ICD11: 6A71 | [26] |
Acetaminophen |
Drug Info | Approved | Anaesthesia | ICD11: 8E22 | [27] |
Dapagliflozin |
Drug Info | Approved | Diabetes mellitus | ICD11: 5A10 | [28] |
Deferiprone |
Drug Info | Approved | Thalassaemia | ICD11: 3A50 | [29] |
Fluorouracilo |
Drug Info | Approved | Stomach cancer | ICD11: 2B72 | [30] |
Lenvatinib |
Drug Info | Approved | Thyroid cancer | ICD11: 2D10 | [31] |
Levomethadyl acetate hydrochloride |
Drug Info | Approved | Opiate dependence | ICD11: 6C43 | [32] |
Timolol maleate |
Drug Info | Approved | Essential hypertension | ICD11: BA00 | [33] |
Zidovudine |
Drug Info | Approved | Human immunodeficiency virus infection | ICD11: 1C60 | [7] |
Arformoterol |
Drug Info | Approved | Chronic obstructive pulmonary disease | ICD11: CA22 | [34] |
Azilsartan |
Drug Info | Approved | Hypertension | ICD11: BA00-BA04 | [35], [36] |
Clofibrate |
Drug Info | Approved | Hypertriglyceridaemia | ICD11: 5C80 | [37] |
Moxidectin |
Drug Info | Approved | Onchocerciasis | ICD11: 1F6A | [38] |
Selegiline |
Drug Info | Approved | Major depressive disorder | ICD11: 6A70-6A7Z | [39] |
Selegiline hydrochloride |
Drug Info | Approved | Parkinsonism | ICD11: 8A00 | [40] |
Artesunate |
Drug Info | Approved | Malaria | ICD11: 1F40-1F45 | [41] |
Chlorzoxazone |
Drug Info | Approved | Anaesthesia | ICD11: 8E22 | [42] |
Dorzolamide hydrochloride |
Drug Info | Approved | Glaucoma | ICD11: 9C61 | [43], [44] |
Letrozole |
Drug Info | Approved | Breast cancer | ICD11: 2C60 | [45] |
Meloxicam |
Drug Info | Approved | Osteoarthritis | ICD11: FA00 | [46] |
Menthol |
Drug Info | Approved | Throat irritation | ICD11: CA0Z | [47] |
Pilocarpine |
Drug Info | Approved | Glaucoma | ICD11: 9C61 | [48] |
Sevoflurane |
Drug Info | Approved | Anaesthesia | ICD11: 8E22 | [49] |
FADROZOLE |
Drug Info | Approved | Breast cancer | ICD11: 2C60-2C6Y | [50] |
FADROZOLE |
Drug Info | Approved | Breast cancer | ICD11: 2C60-2C6Y | [50], [51] |
Methoxsalen |
Drug Info | Approved | Psoriasis vulgaris | ICD11: EA90 | [52] |
Methoxyflurane |
Drug Info | Approved | Anaesthesia | ICD11: 8E22 | [49] |
| Drugs in Phase 4 Clinical Trial | Click to Show/Hide the Full List of Drugs: 9 Drugs | ||||
Artemisinin |
Drug Info | Phase 4 | Malaria | ICD11: 1F40 | [52] |
Tegafur-uracil |
Drug Info | Phase 4 | Colon cancer | ICD11: 2B90 | [53] |
Cinnarizine |
Drug Info | Phase 4 | Haemorrhagic stroke | ICD11: 8B20 | [6] |
Medifoxamine |
Drug Info | Phase 4 | Depression | ICD11: 6A71 | [7] |
Phenacetin |
Drug Info | Phase 4 | Anaesthesia | ICD11: 8E22 | [54] |
Flunarizine |
Drug Info | Phase 4 | Schizophrenia | ICD11: 6A20 | [37] |
Flunitrazepam |
Drug Info | Phase 4 | Insomnia | ICD11: 7A00 | [55] |
Perazine |
Drug Info | Phase 4 | Cerebrovascular dementia | ICD11: 6D81 | [56] |
Tegafur |
Drug Info | Phase 4 | Colon cancer | ICD11: 2B90 | [57] |
| Drugs in Phase 3 Clinical Trial | Click to Show/Hide the Full List of Drugs: 8 Drugs | ||||
Selumetinib |
Drug Info | Phase 3 | Neurofibromatosis | ICD11: LD2D | [58] |
BMS-650032 |
Drug Info | Phase 3 | Viral hepatitis | ICD11: 1E51 | [59] |
Y-100032 |
Drug Info | Phase 3 | Multiple myeloma | ICD11: 2A83 | [60] |
HSDB-3466 |
Drug Info | Phase 3 | Psoriasis vulgaris | ICD11: EA90 | [61] |
LY-450139 |
Drug Info | Phase 3 | Alzheimer disease | ICD11: 8A20 | [62] |
BRN-1907611 |
Drug Info | Phase 3 | Inflammatory bowel disease | ICD11: DD72 | [63] |
WY-1485 |
Drug Info | Phase 3 | Haemorrhagic stroke | ICD11: 8B20 | [7] |
Montelukast |
Drug Info | Phase 3 | Asthma | ICD11: CA23 | [6] |
| Drugs in Phase 2 Clinical Trial | Click to Show/Hide the Full List of Drugs: 4 Drugs | ||||
EMD-128130 |
Drug Info | Phase 2/3 | Rett syndrome | ICD11: LD90 | [64] |
Roxatidine |
Drug Info | Phase 2 | Gastro-oesophageal reflux disease | ICD11: DA22 | [65] |
Z-4828 |
Drug Info | Phase 2 | Histiocytic sarcoma | ICD11: 2B31 | [66] |
LJPC-0118 |
Drug Info | Phase 2 | Malaria | ICD11: 1F40 | [67] |
| Drugs in Phase 1 Clinical Trial | Click to Show/Hide the Full List of Drugs: 2 Drugs | ||||
Alvespimycin hydrochloride |
Drug Info | Phase 1 | Ovarian cancer | ICD11: 2C73 | [68] |
OSI-930 |
Drug Info | Phase 1 | Solid tumour/cancer | ICD11: 2A00-2F9Z | [69] |
| Discontinued/withdrawn Drugs | Click to Show/Hide the Full List of Drugs: 1 Drugs | ||||
SM-10661 |
Drug Info | Discontinued in Phase 2 | Sepsis | ICD11: 1G40-1G41 | [70] |
| Preclinical/investigative Agents | Click to Show/Hide the Full List of Drugs: 10 Drugs | ||||
Coumarin |
Drug Info | Investigative | Discovery agent | ICD: N.A. | [71], [72] |
Flavone |
Drug Info | Investigative | Colon cancer | ICD11: 2B90 | [73] |
Flavone |
Drug Info | Investigative | Colon cancer | ICD11: 2B90 | [74] |
Cotinine |
Drug Info | Investigative | Nicotine dependence | ICD11: 6C4A | [75] |
Antipyrine |
Drug Info | Investigative | Discovery agent | ICD: N.A. | [76] |
Chloroxylenol |
Drug Info | Investigative | Pseudomonas infection | ICD11: 1G40 | [7] |
Fenthion |
Drug Info | Investigative | Discovery agent | ICD: N.A. | [77] |
Fenthion sulfoxide |
Drug Info | Investigative | Discovery agent | ICD: N.A. | [77] |
Levoverbenone |
Drug Info | Investigative | Pulmonary tuberculosis | ICD11: 1B10 | [78] |
Nicotinyl alcohol |
Drug Info | Investigative | Hypertriglyceridaemia | ICD11: 5C80 | [79] |
| Experimental Enzyme Kinetic Data of Drugs | Click to Show/Hide the Full List of Drugs: 2 Drugs | ||||
Fenthion |
Drug Info | Investigative | Discovery agent | Km = 0.0016 microM | [77] |
Fenthion sulfoxide |
Drug Info | Investigative | Discovery agent | Km = 0.018 microM | [77] |
| Tissue/Disease-Specific Protein Abundances of This DME | |||||
|---|---|---|---|---|---|
| Tissue-specific Protein Abundances in Healthy Individuals | Click to Show/Hide | ||||
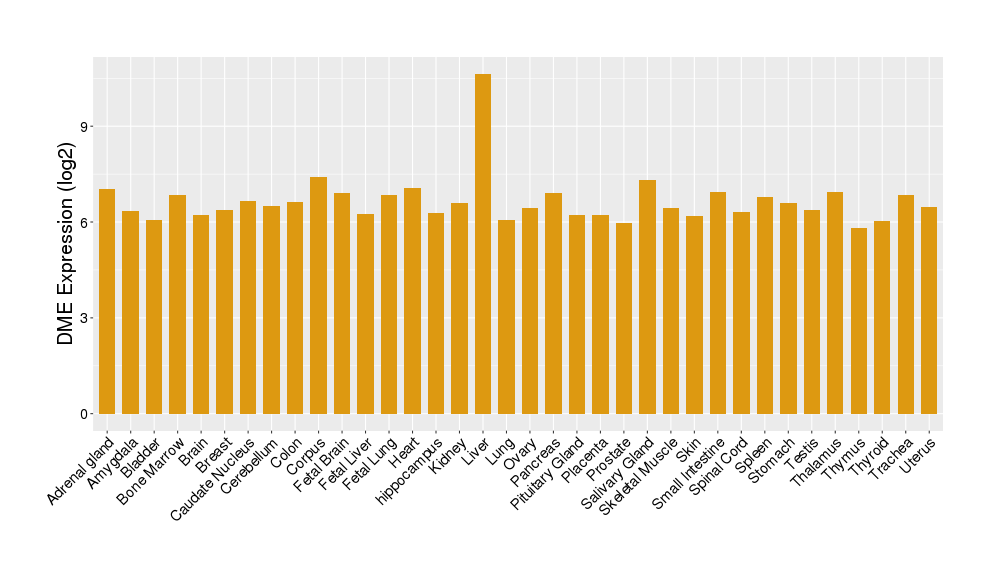
|
|||||
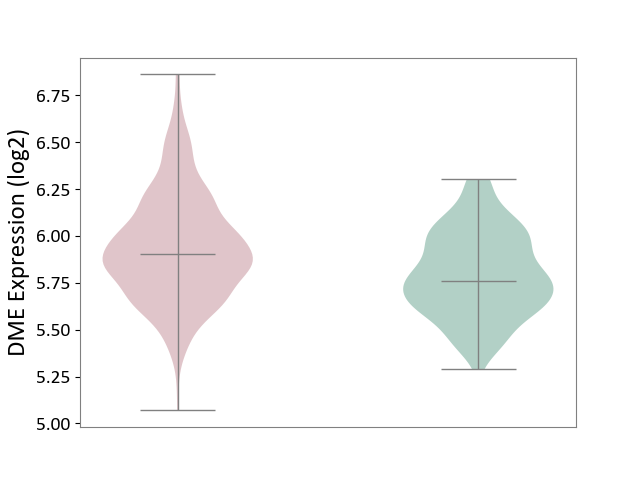
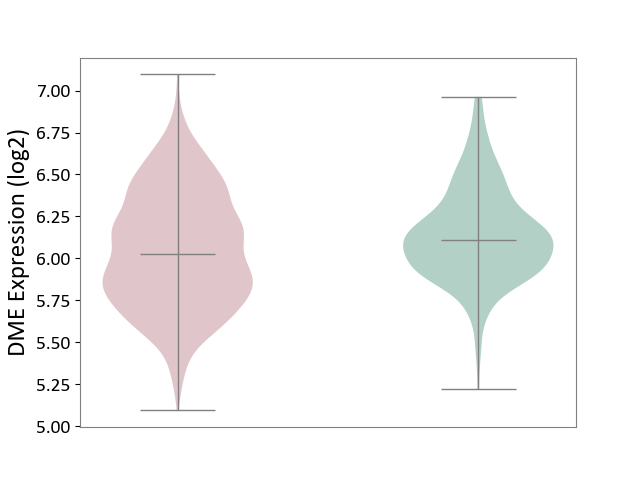
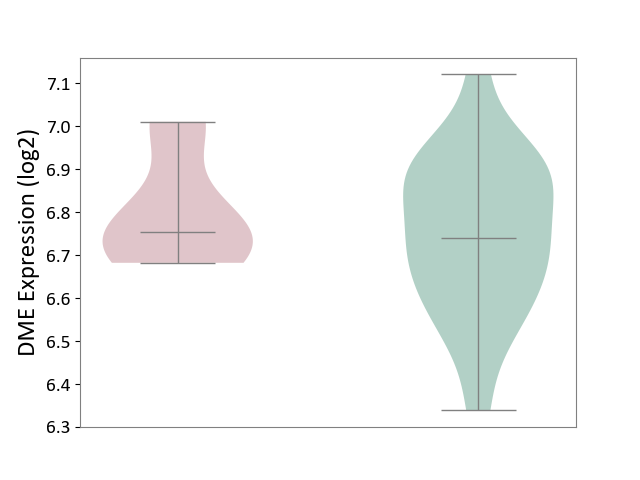
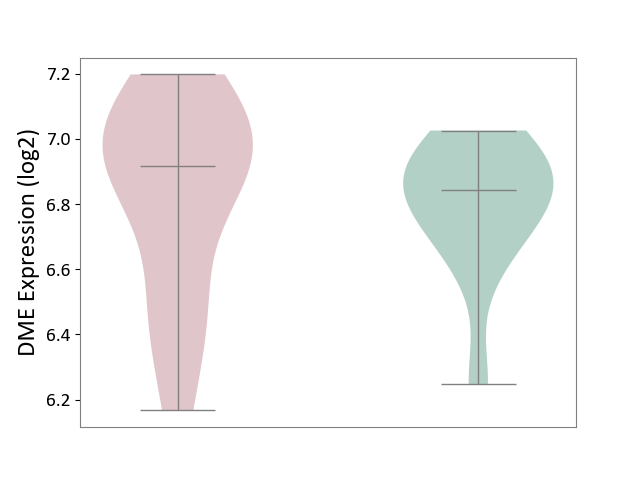
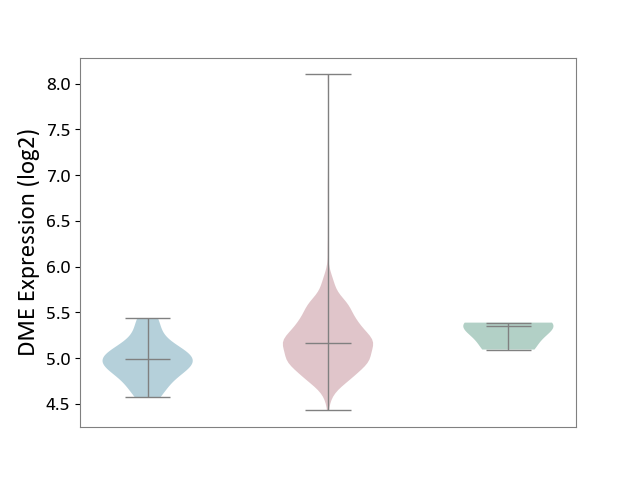
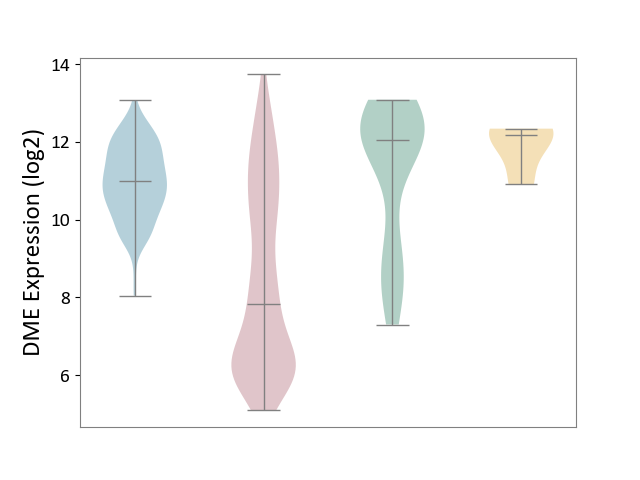
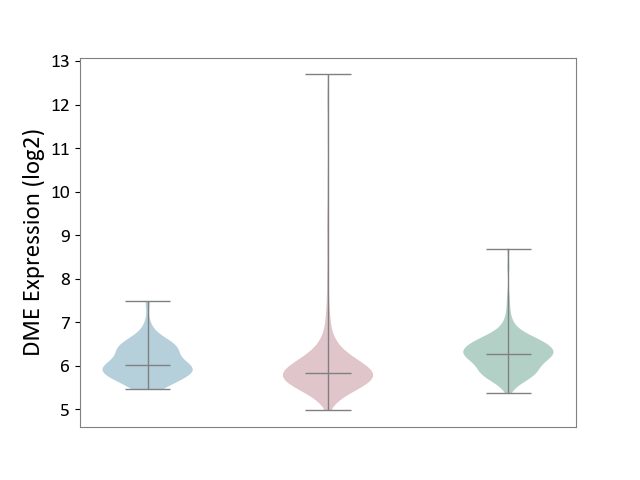
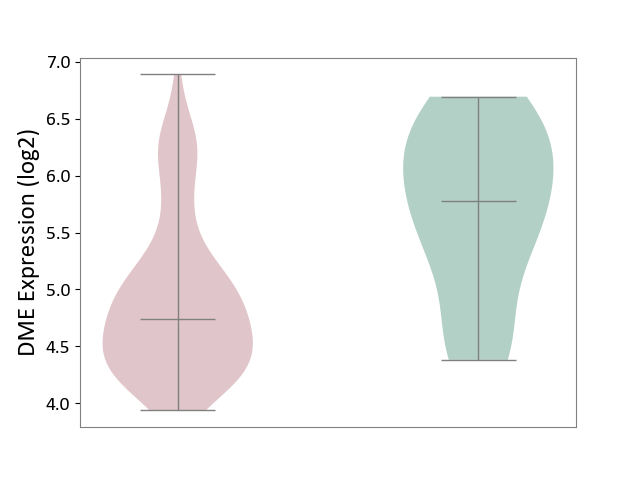
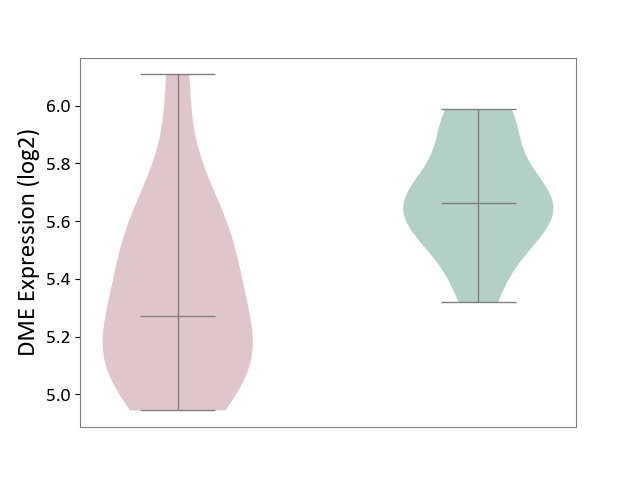
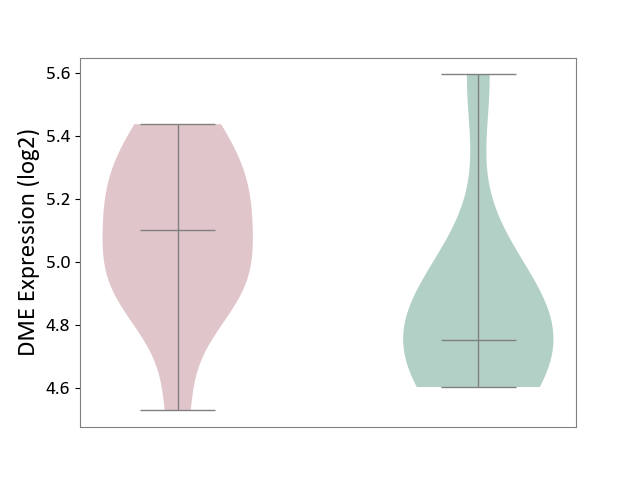
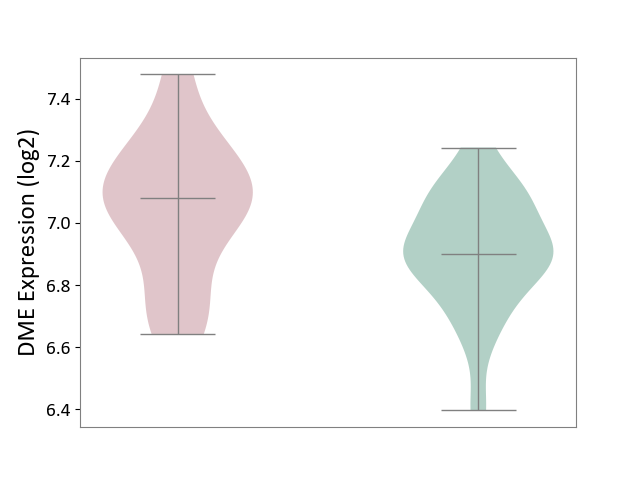
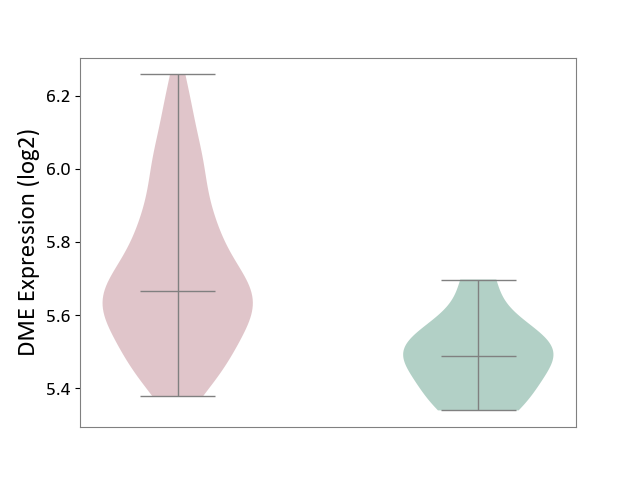
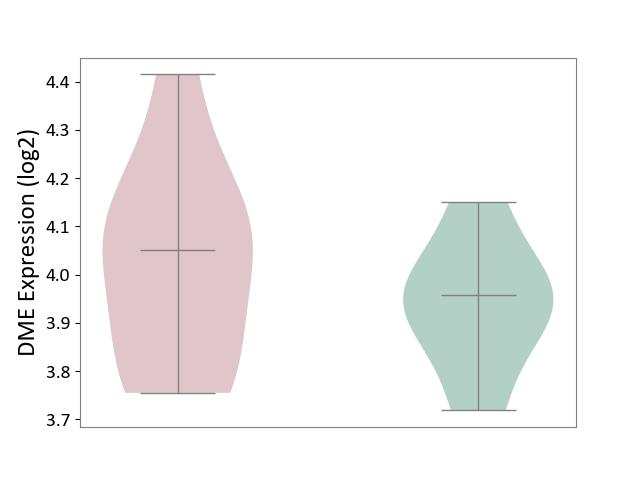
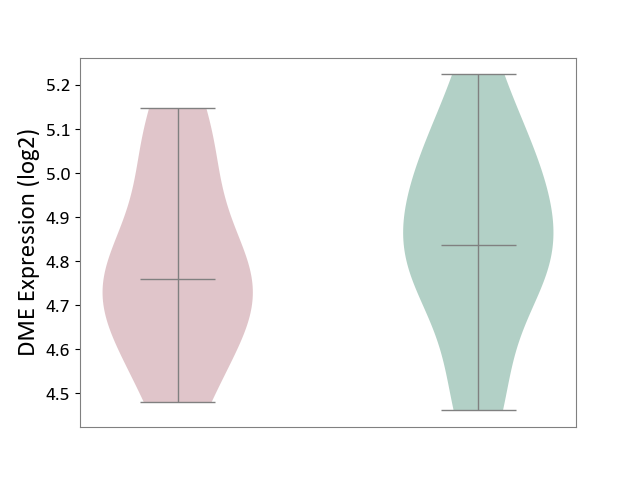
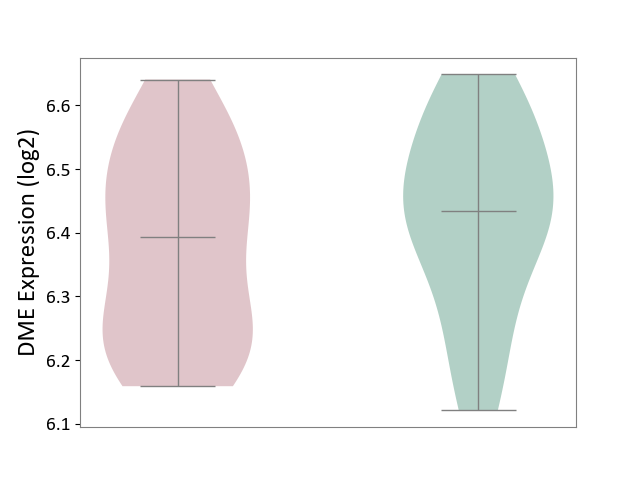
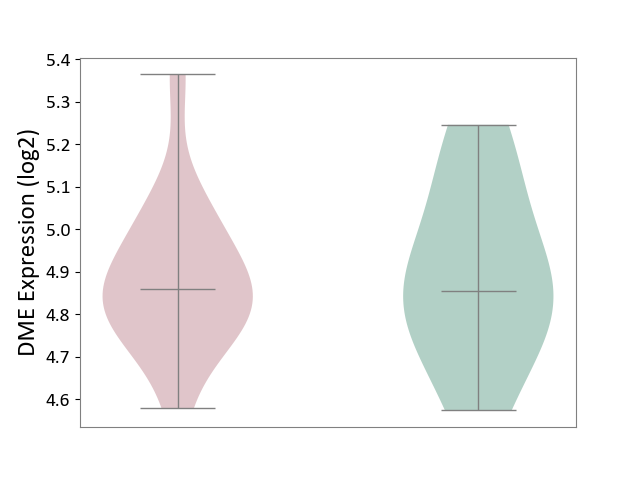
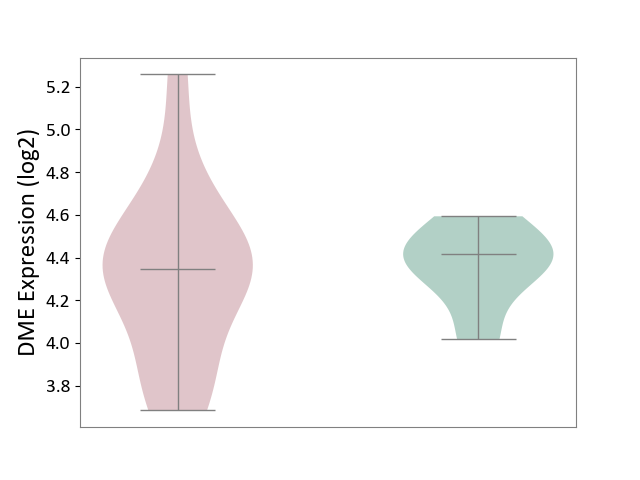
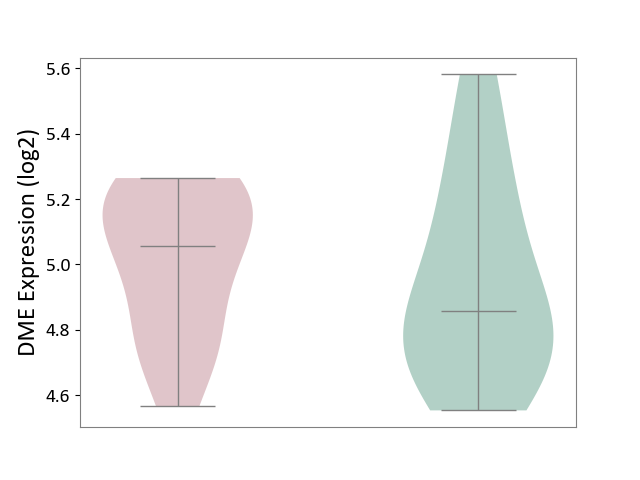
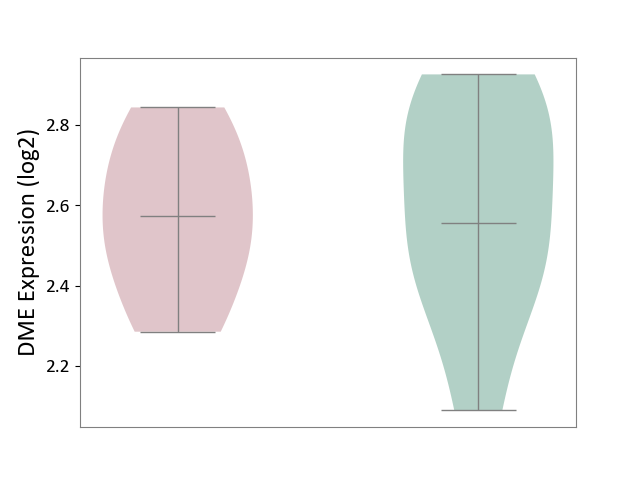
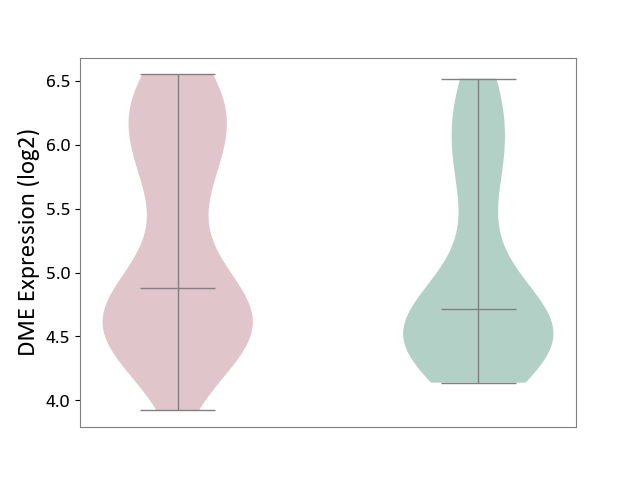
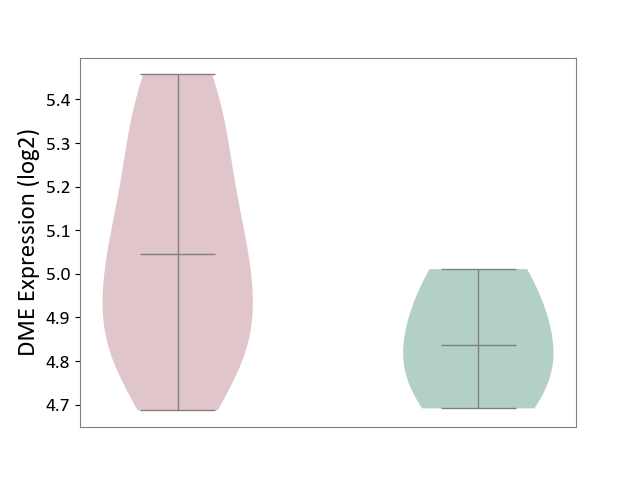
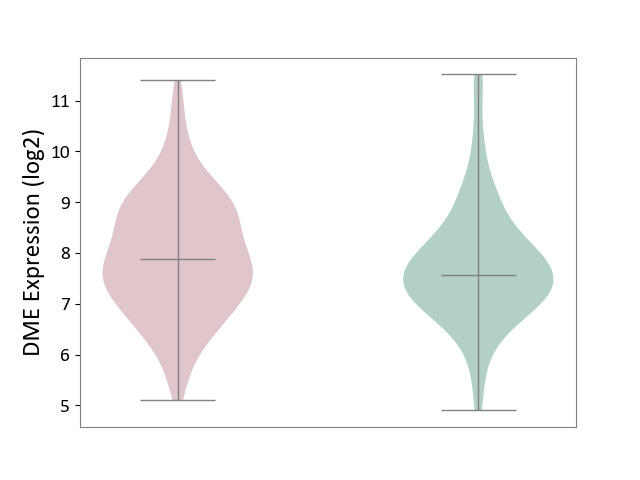
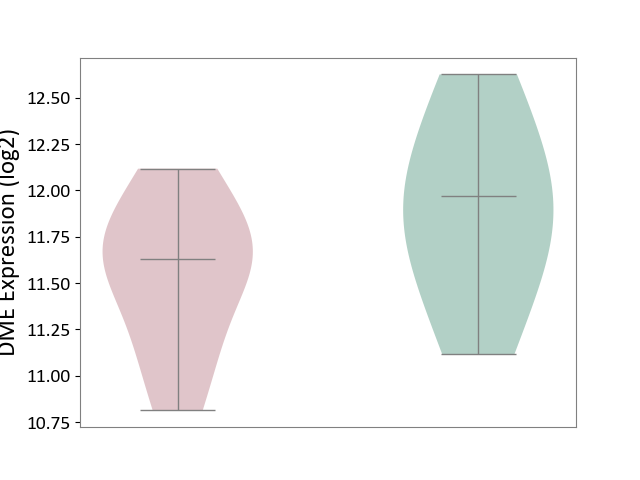
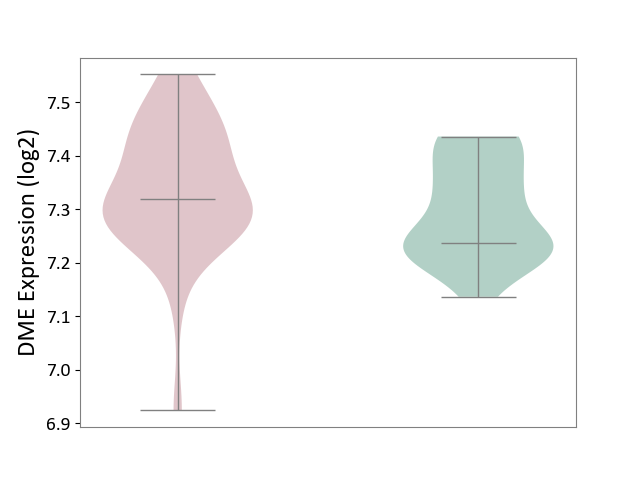
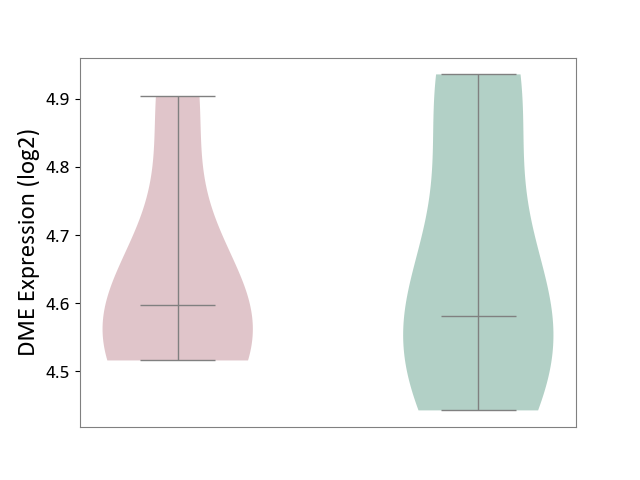
| ICD Disease Classification 01 | Infectious/parasitic disease | Click to Show/Hide | |||
| ICD-11: 1C1H | Necrotising ulcerative gingivitis | Click to Show/Hide | |||
| The Studied Tissue | Gingival tissue | ||||
| The Specified Disease | Bacterial infection of gingival [ICD-11:1C1H] | ||||
| The Expression Level of Disease Section Compare with the Healthy Individual Tissue | p-value: 2.56E-01; Fold-change: -7.44E-03; Z-score: -2.07E-02 | ||||
|
DME expression in the diseased tissue of patients
DME expression in the normal tissue of healthy individuals
|
|||||
| Violin Diagram of DME Disease-specific Protein Abundances |
|
Click to View the Clearer Original Diagram | |||
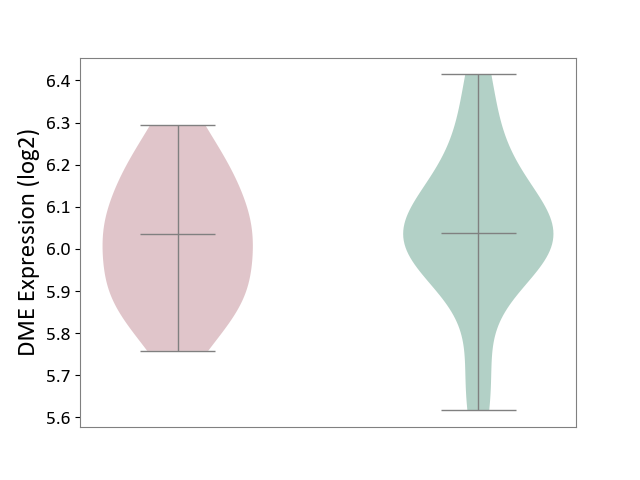
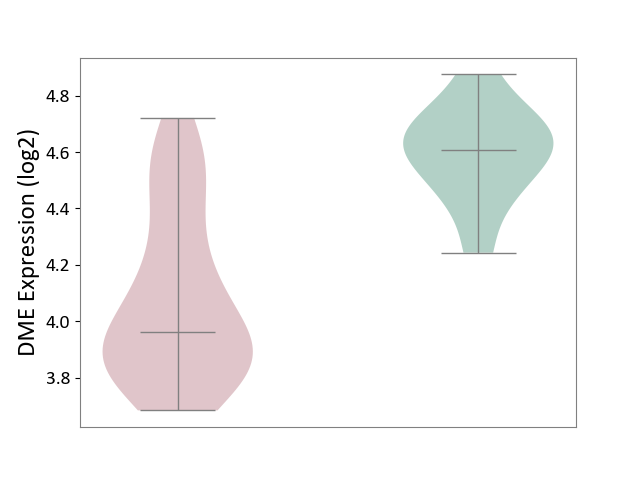
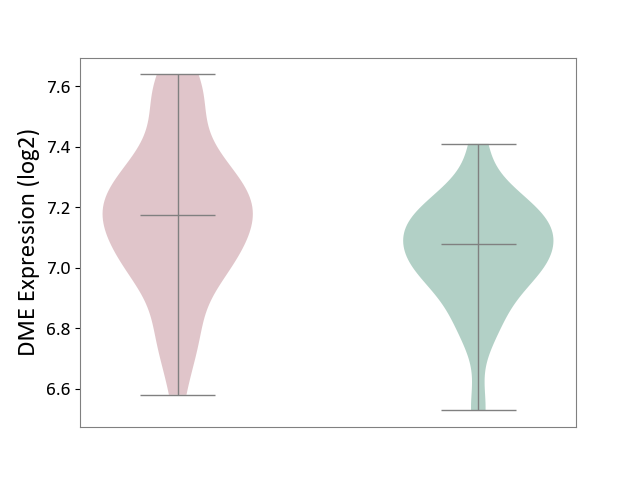
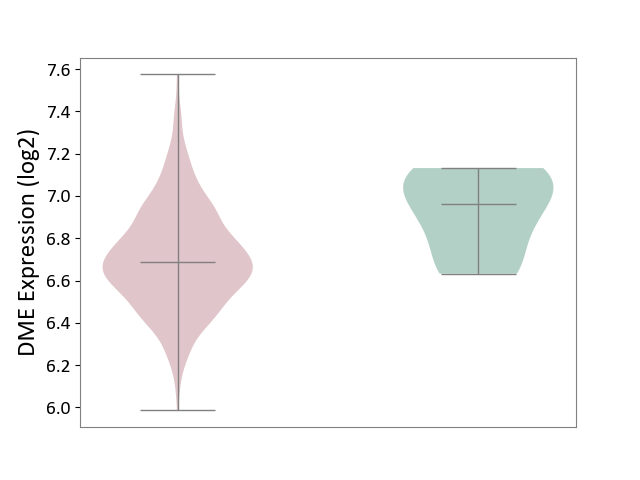
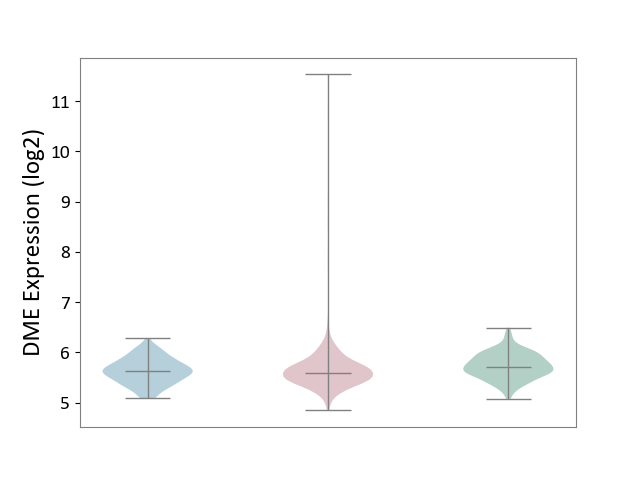
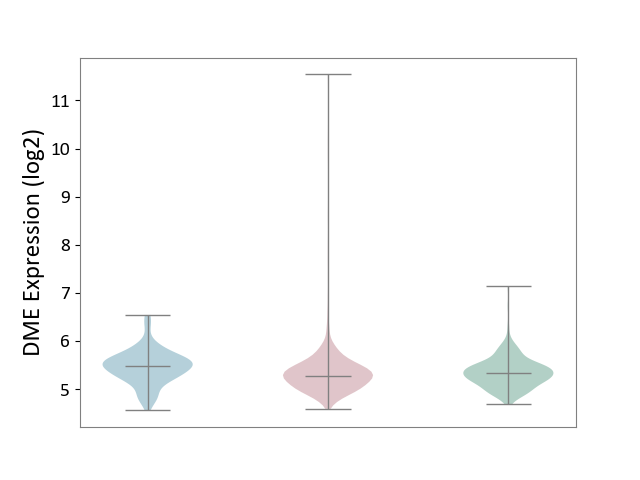
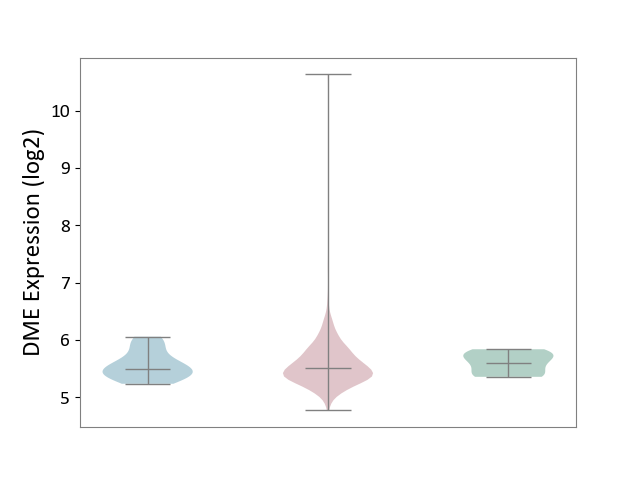
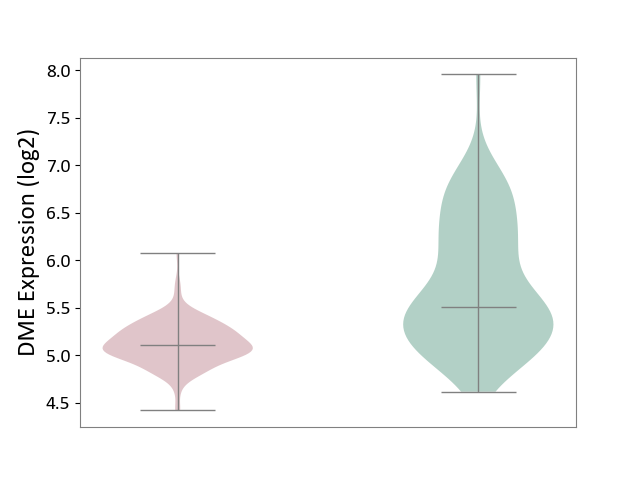
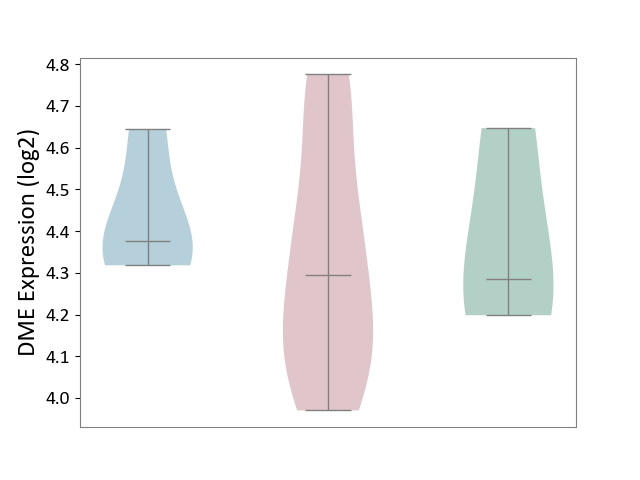
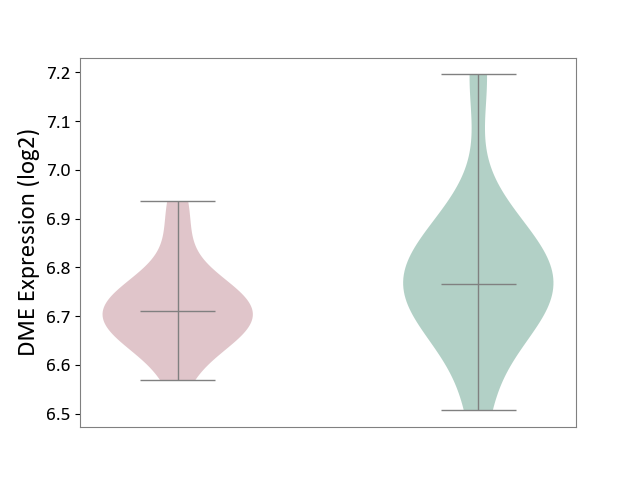
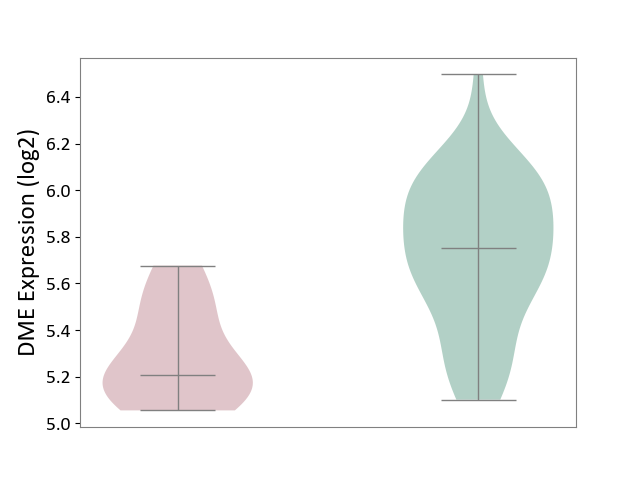
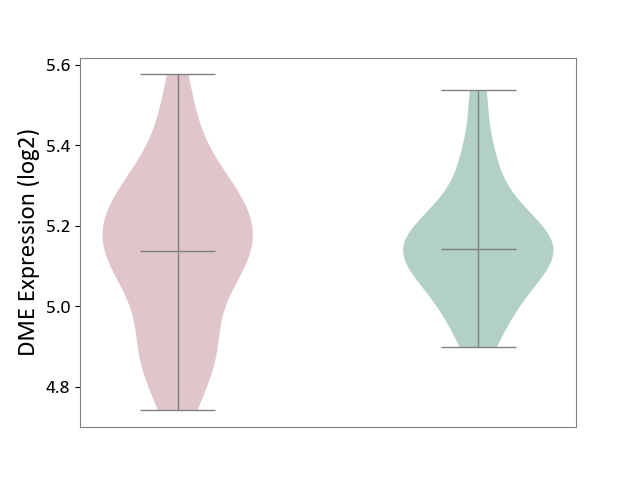
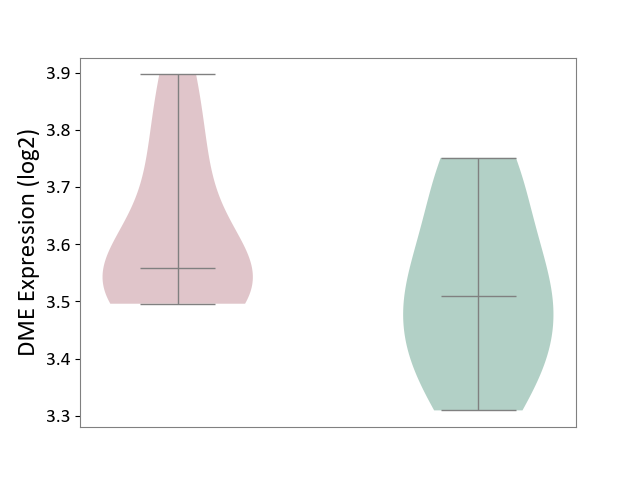
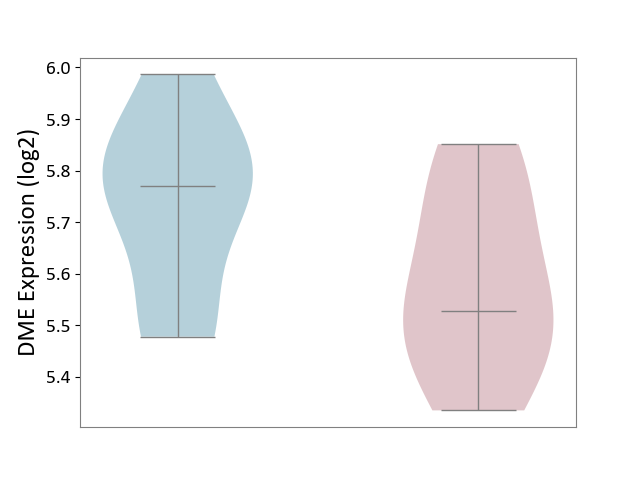
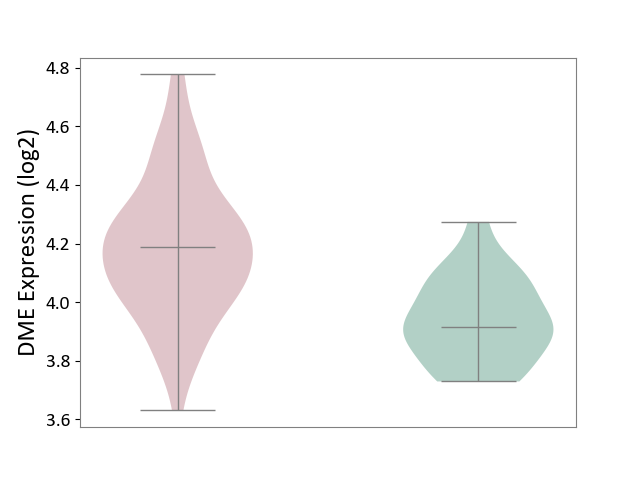
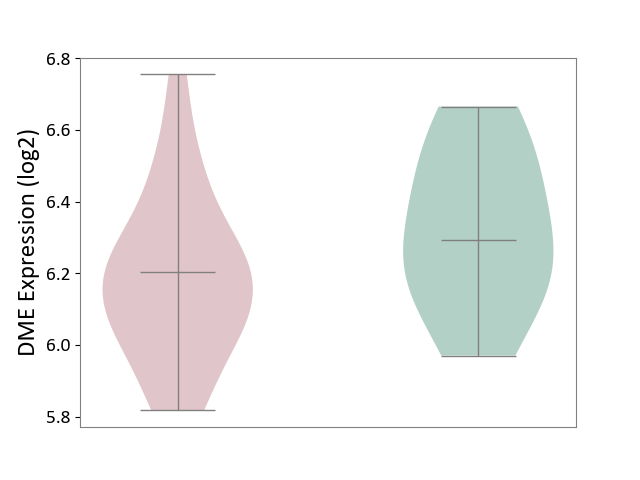
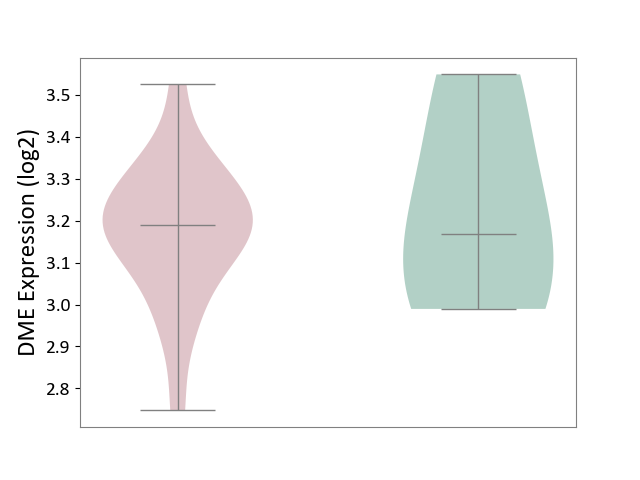
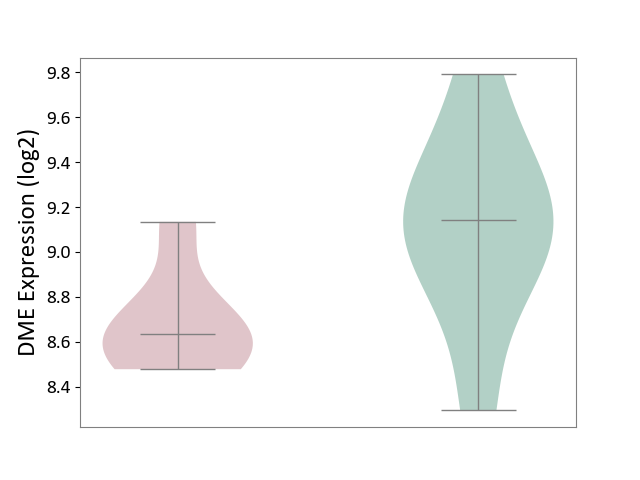
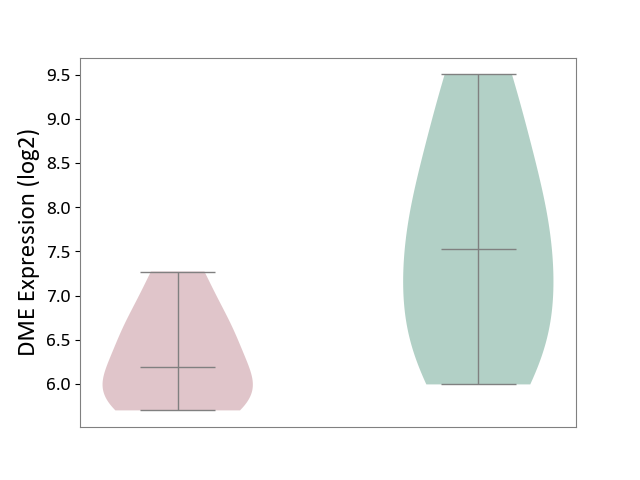
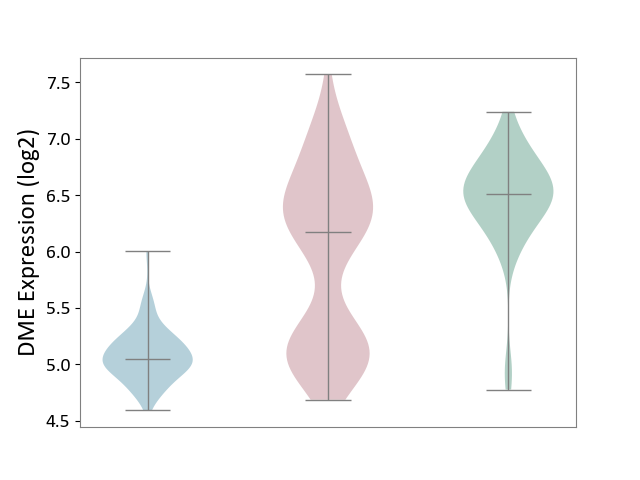
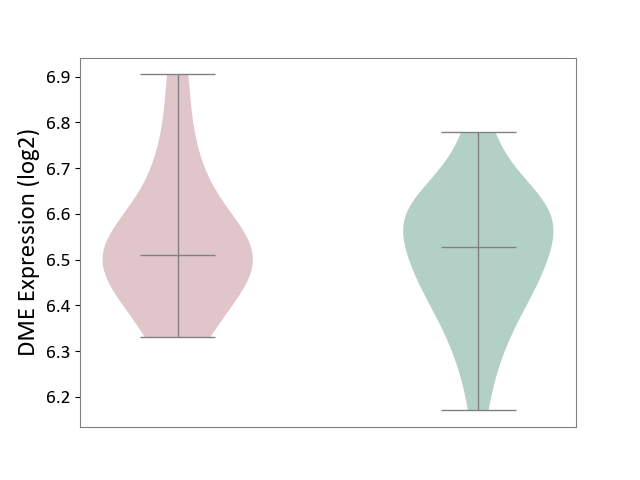
| ICD-11: 1E30 | Influenza | Click to Show/Hide | |||
| The Studied Tissue | Whole blood | ||||
| The Specified Disease | Influenza [ICD-11:1E30] | ||||
| The Expression Level of Disease Section Compare with the Healthy Individual Tissue | p-value: 3.46E-03; Fold-change: 4.94E-01; Z-score: 4.13E+00 | ||||
|
DME expression in the diseased tissue of patients
DME expression in the normal tissue of healthy individuals
|
|||||
| Violin Diagram of DME Disease-specific Protein Abundances |
|
Click to View the Clearer Original Diagram | |||
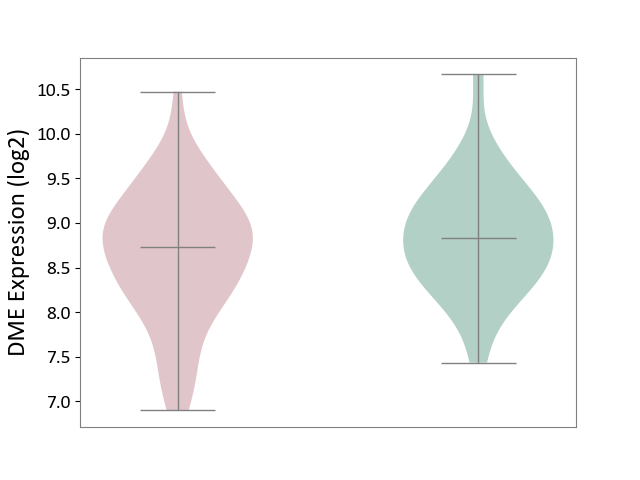
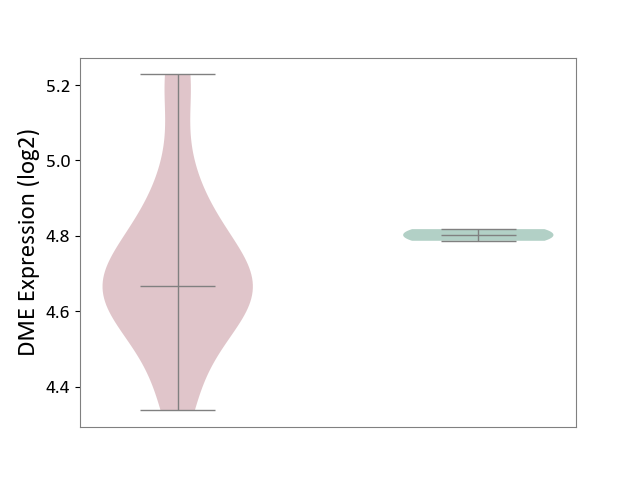
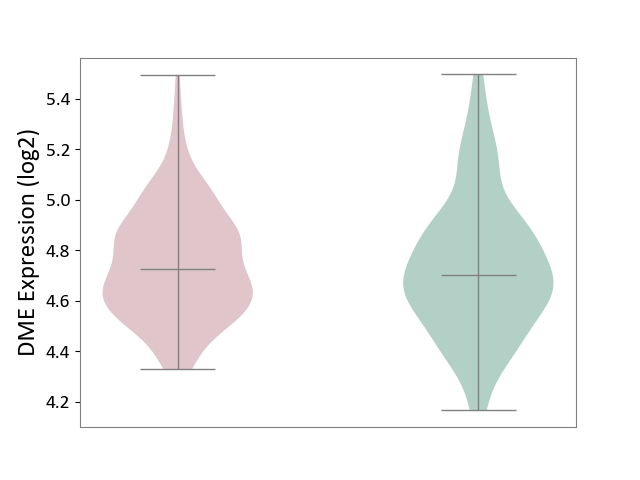
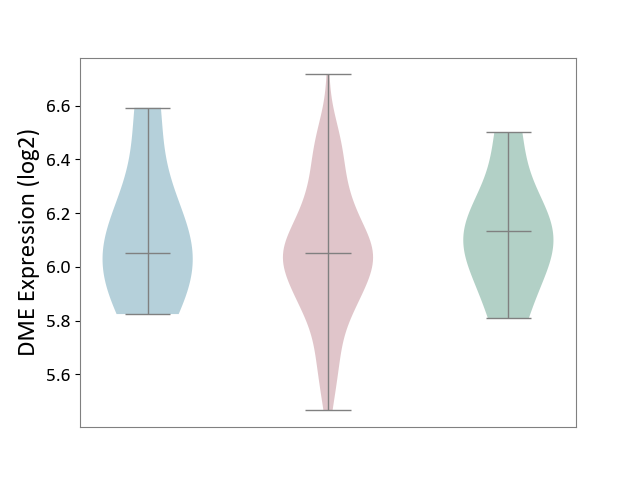
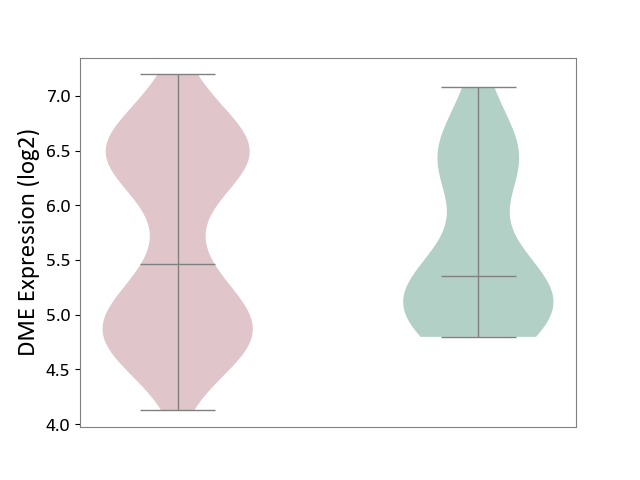
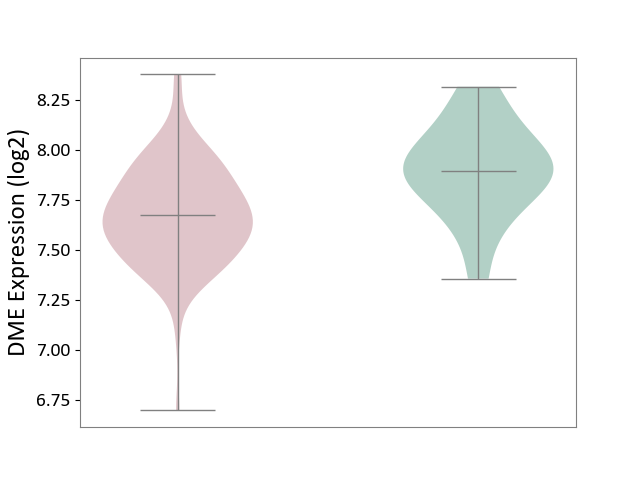
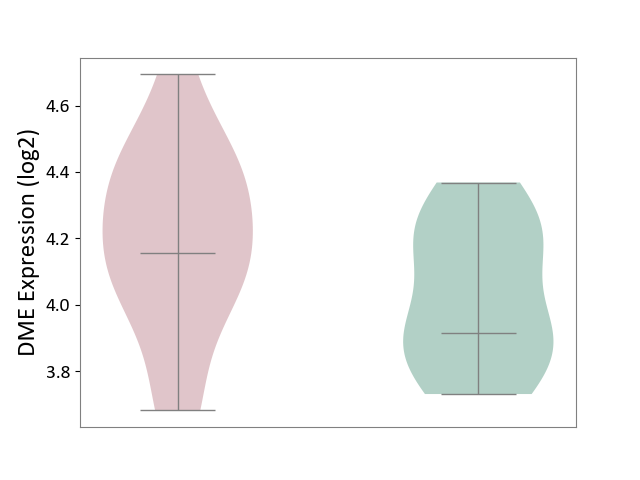
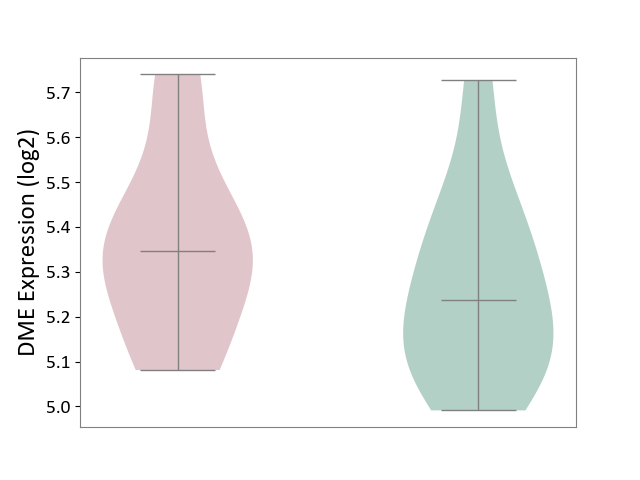
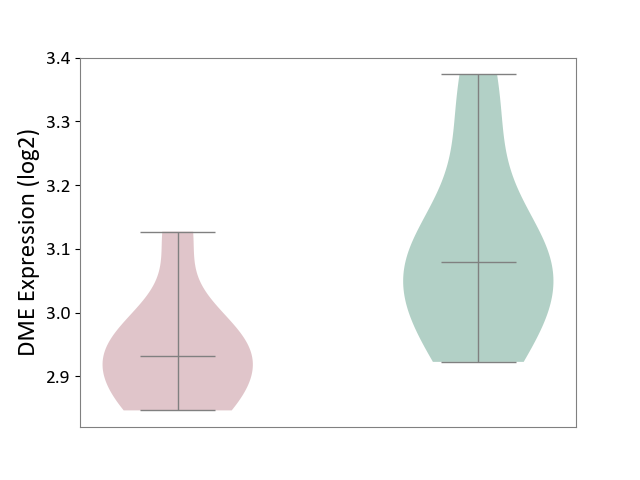
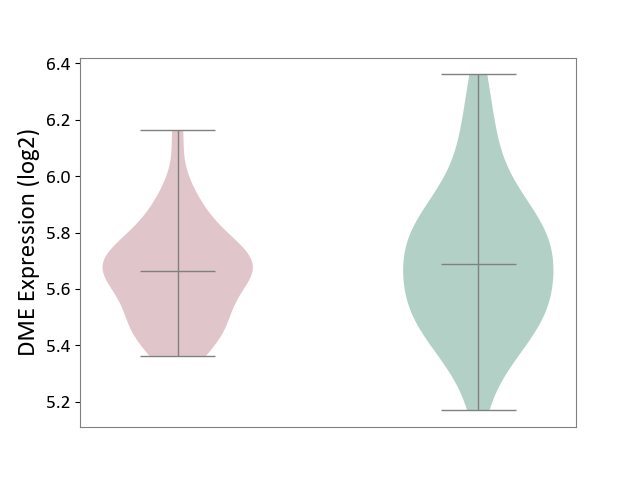
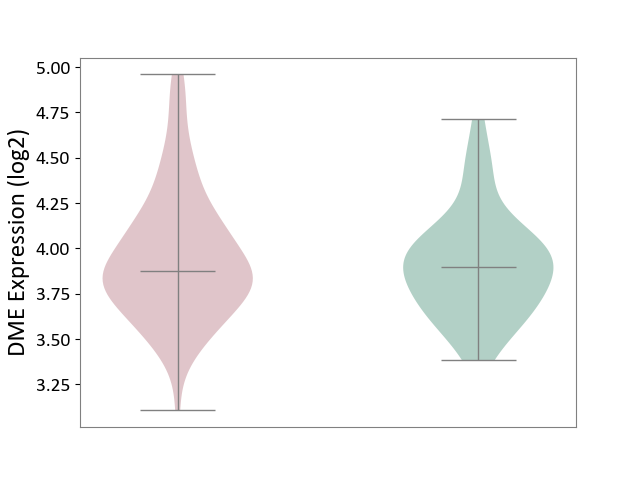
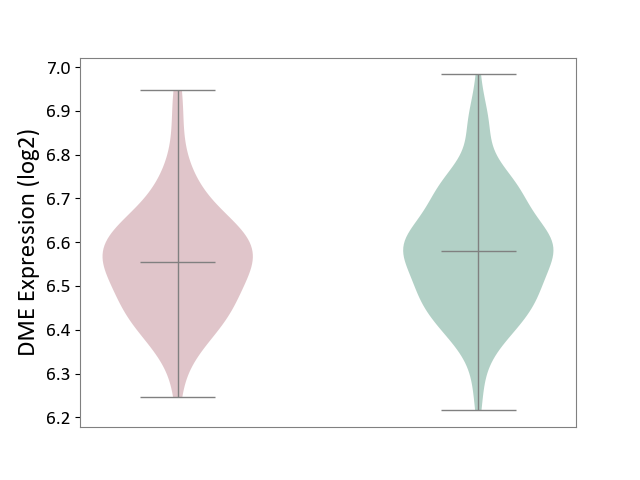
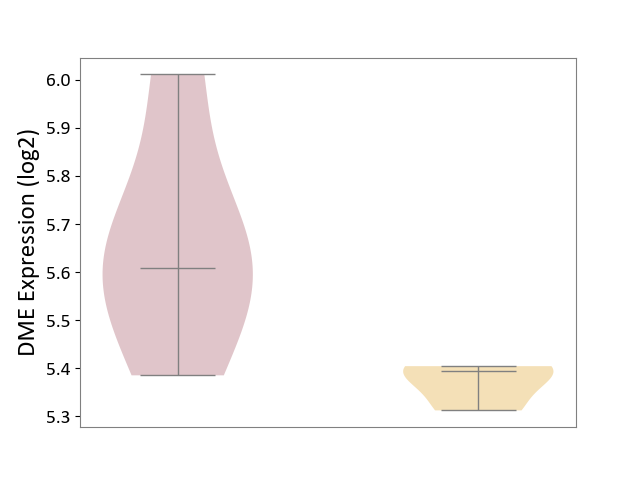
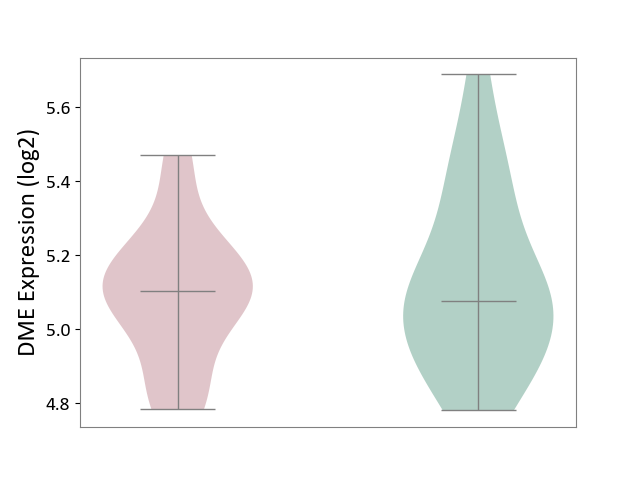
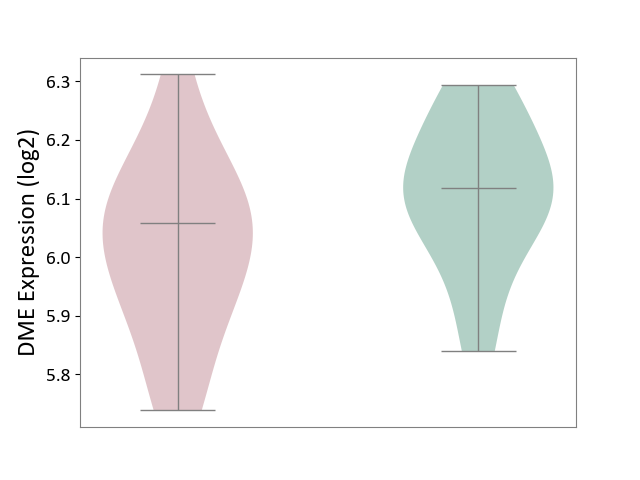
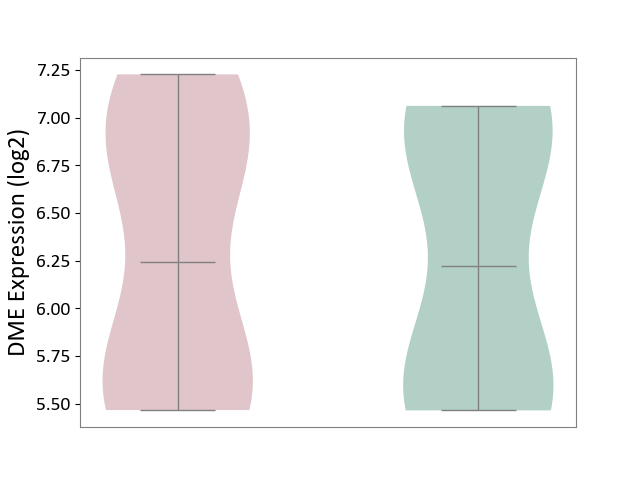
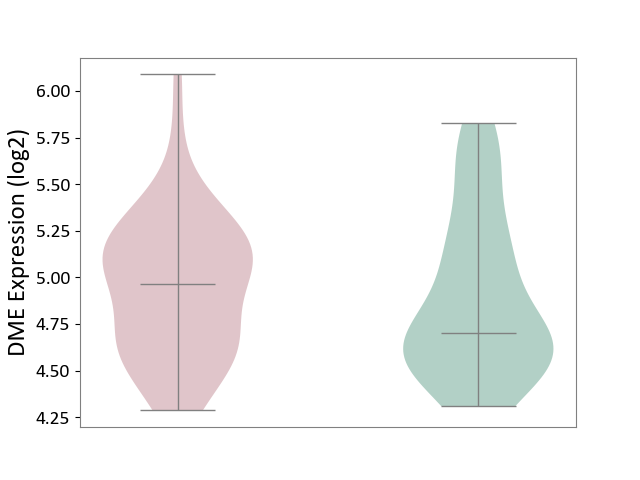
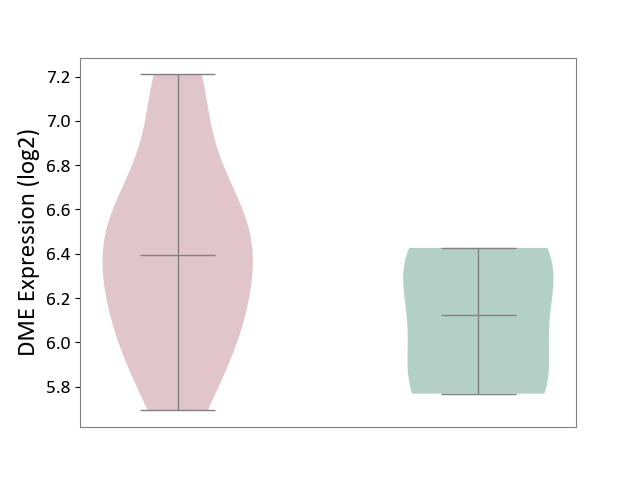
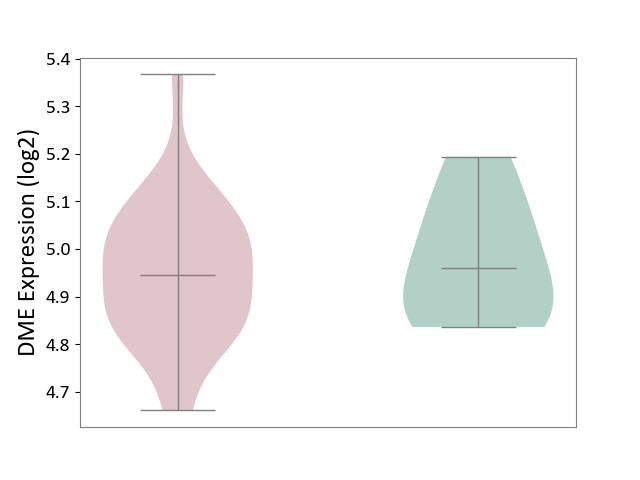
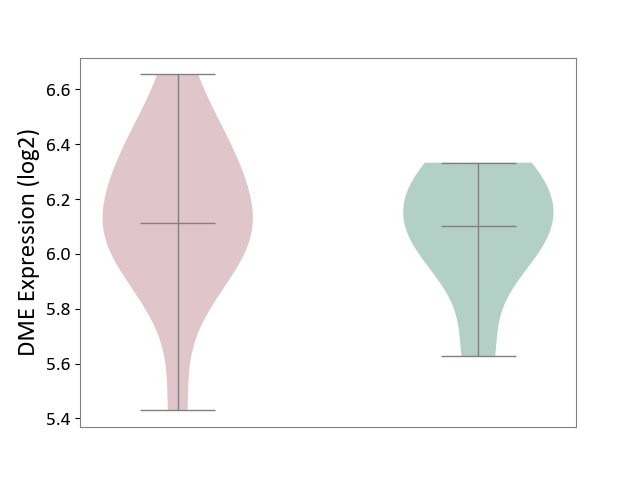
| ICD-11: 1E51 | Chronic viral hepatitis | Click to Show/Hide | |||
| The Studied Tissue | Whole blood | ||||
| The Specified Disease | Chronic hepatitis C [ICD-11:1E51.1] | ||||
| The Expression Level of Disease Section Compare with the Healthy Individual Tissue | p-value: 2.33E-01; Fold-change: 4.58E-02; Z-score: 2.41E-01 | ||||
|
DME expression in the diseased tissue of patients
DME expression in the normal tissue of healthy individuals
|
|||||
| Violin Diagram of DME Disease-specific Protein Abundances |
|
Click to View the Clearer Original Diagram | |||
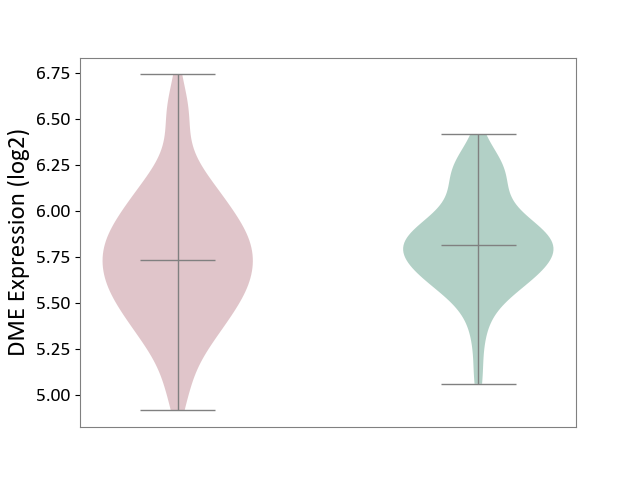
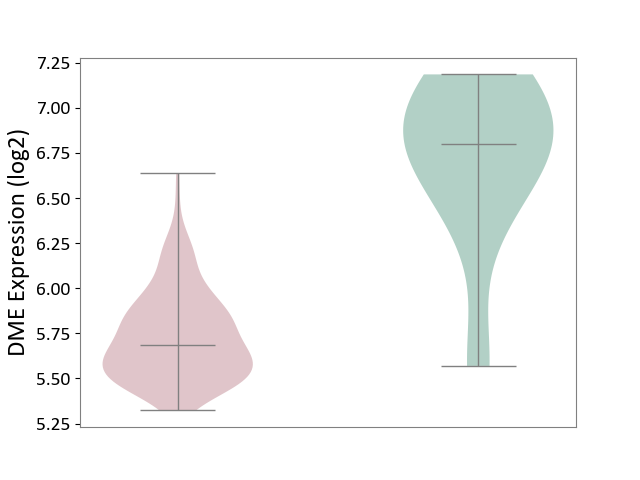
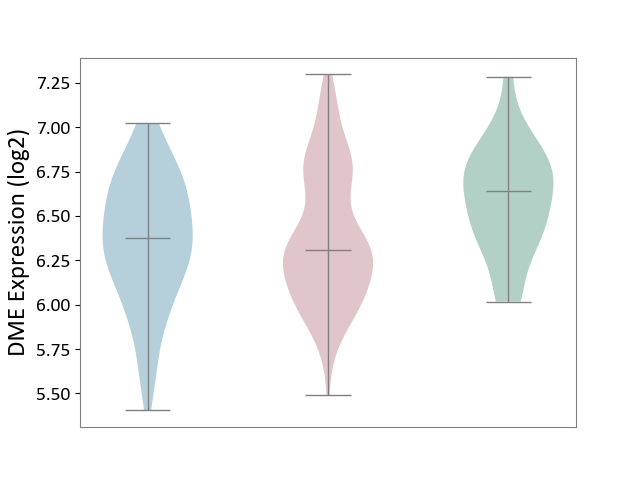
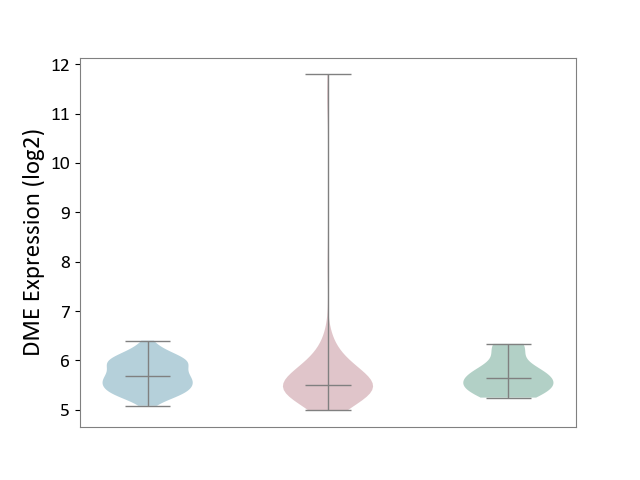
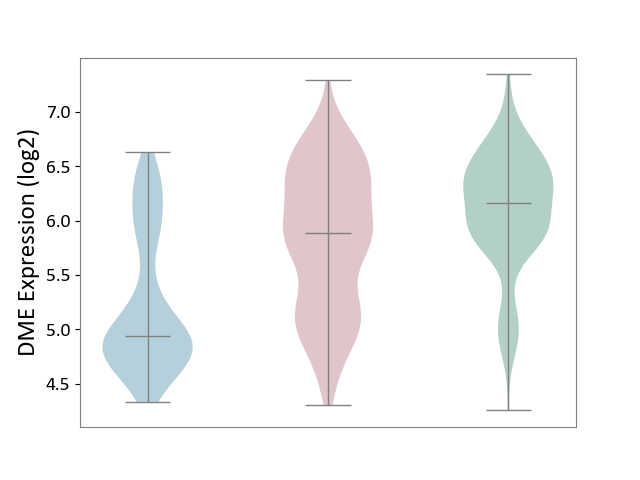
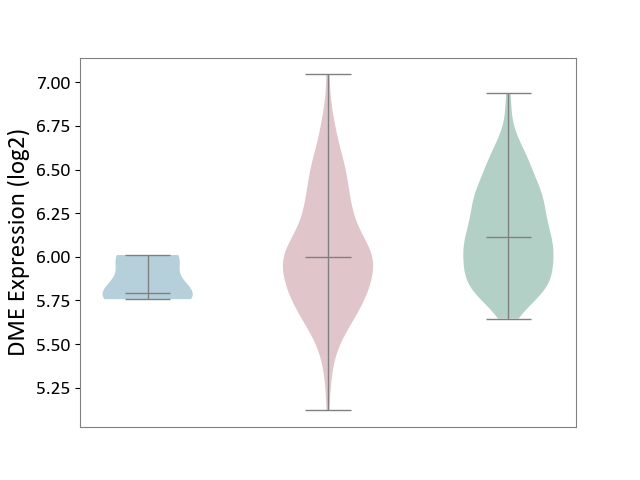
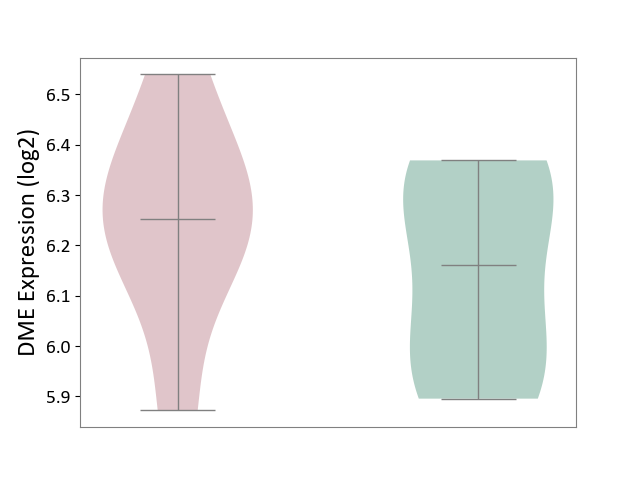
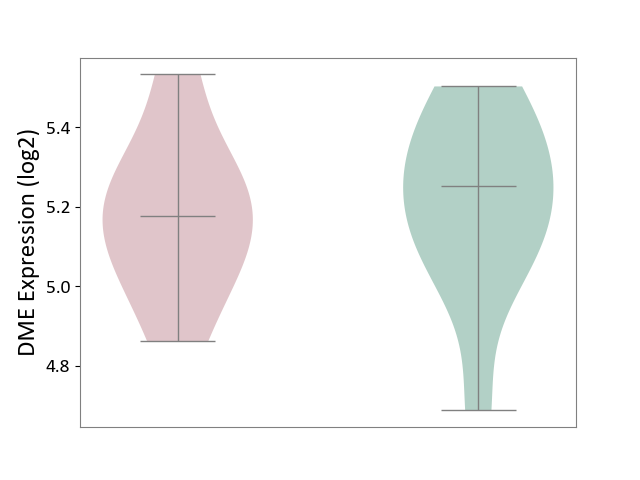
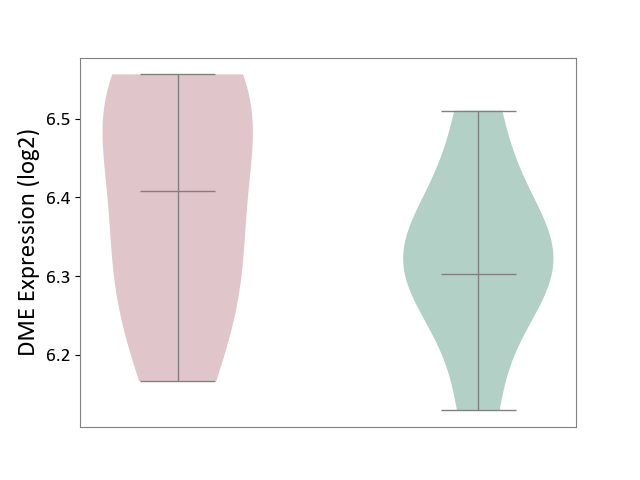
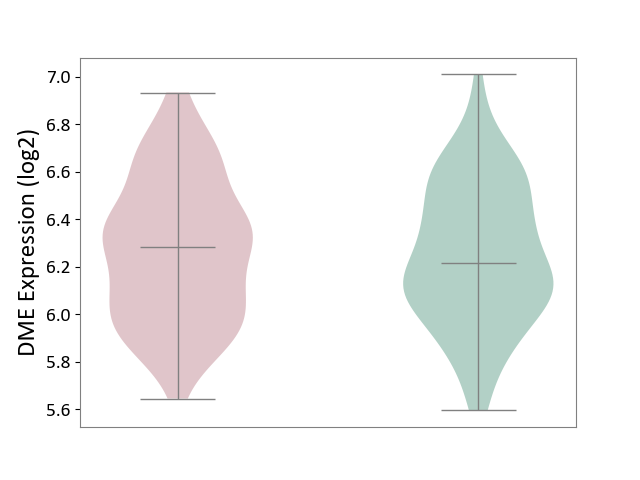
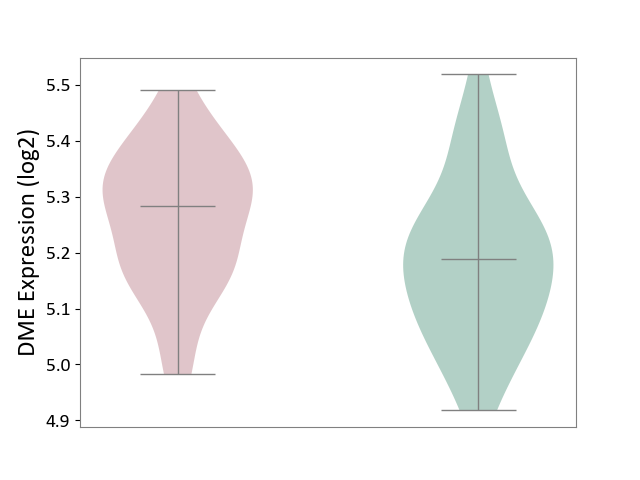
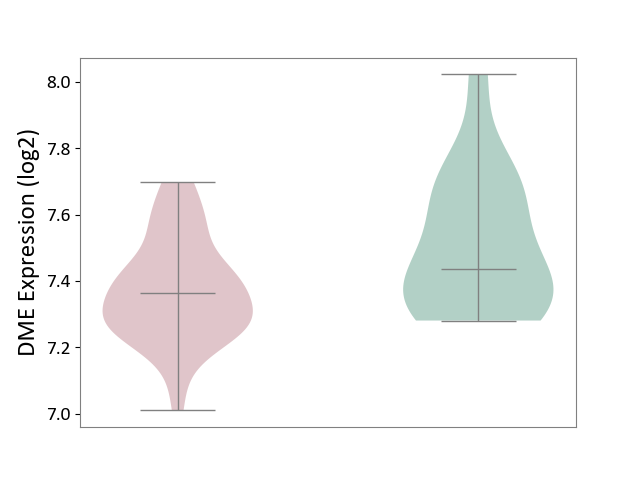
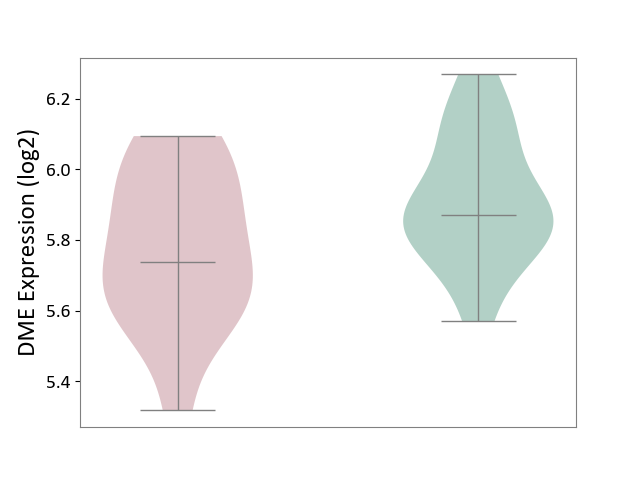
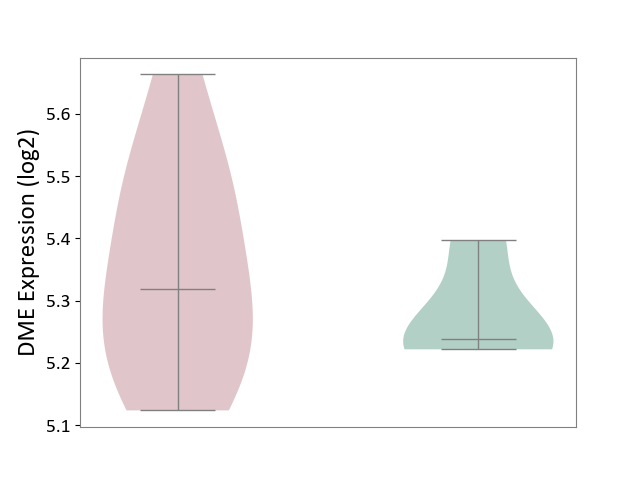
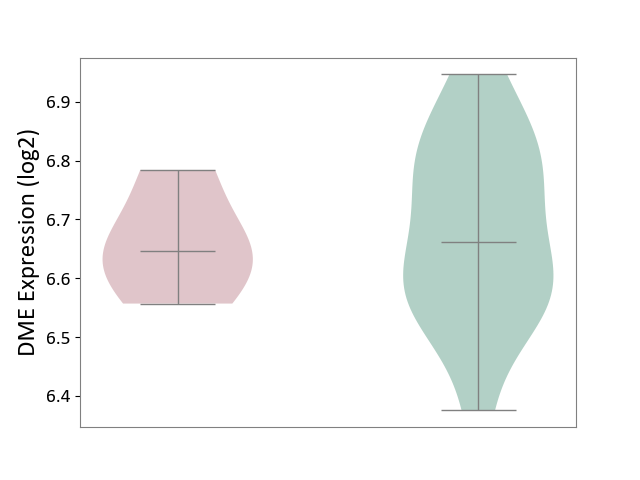
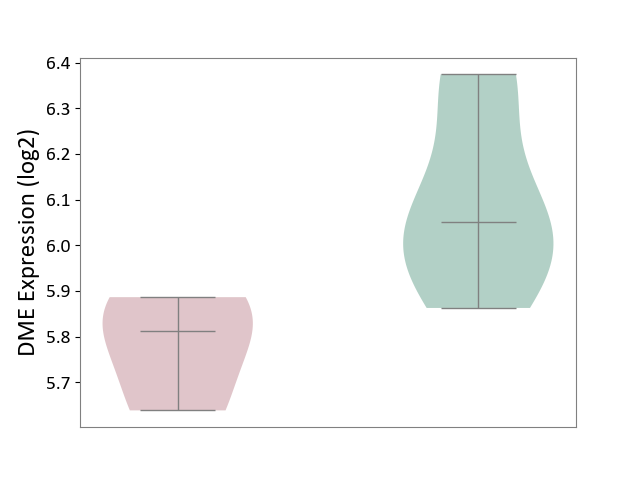
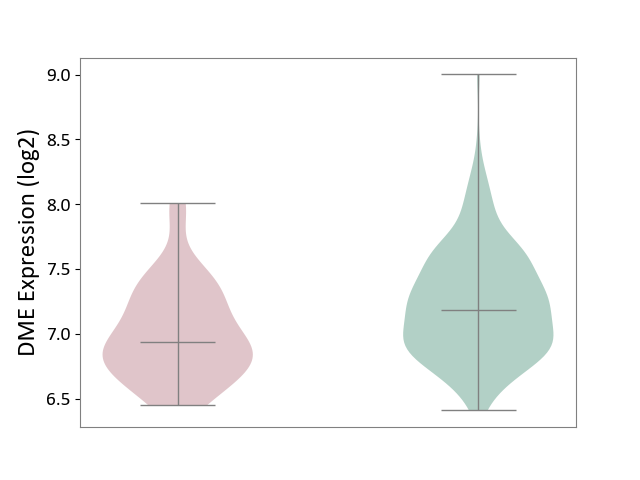
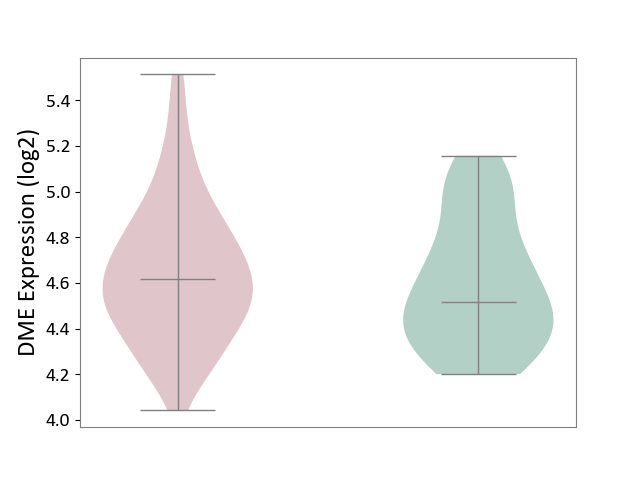
| ICD-11: 1G41 | Sepsis with septic shock | Click to Show/Hide | |||
| The Studied Tissue | Whole blood | ||||
| The Specified Disease | Sepsis with septic shock [ICD-11:1G41] | ||||
| The Expression Level of Disease Section Compare with the Healthy Individual Tissue | p-value: 1.62E-10; Fold-change: 1.45E-01; Z-score: 6.41E-01 | ||||
|
DME expression in the diseased tissue of patients
DME expression in the normal tissue of healthy individuals
|
|||||
| Violin Diagram of DME Disease-specific Protein Abundances |
|
Click to View the Clearer Original Diagram | |||
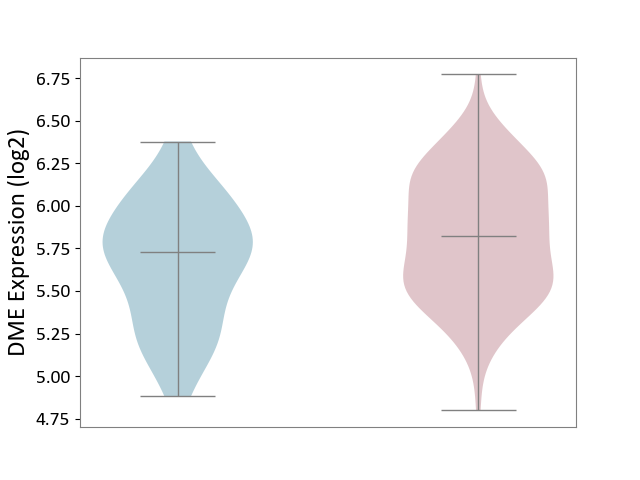
| ICD-11: CA40 | Respiratory syncytial virus infection | Click to Show/Hide | |||
| The Studied Tissue | Peripheral blood | ||||
| The Specified Disease | Pediatric respiratory syncytial virus infection [ICD-11:CA40.11] | ||||
| The Expression Level of Disease Section Compare with the Healthy Individual Tissue | p-value: 6.79E-01; Fold-change: -2.31E-03; Z-score: -1.24E-02 | ||||
|
DME expression in the diseased tissue of patients
DME expression in the normal tissue of healthy individuals
|
|||||
| Violin Diagram of DME Disease-specific Protein Abundances |
|
Click to View the Clearer Original Diagram | |||
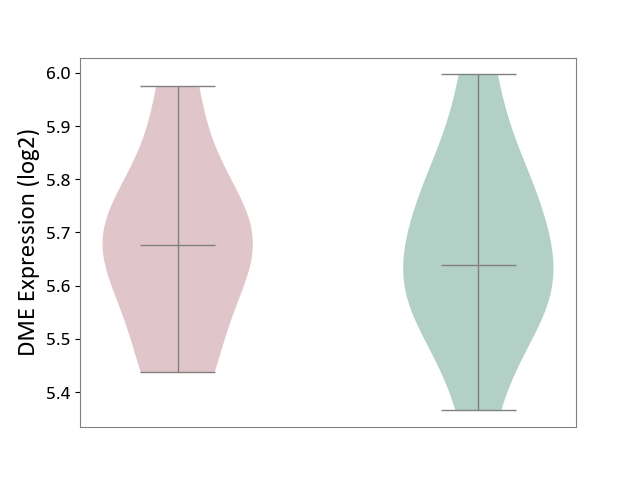
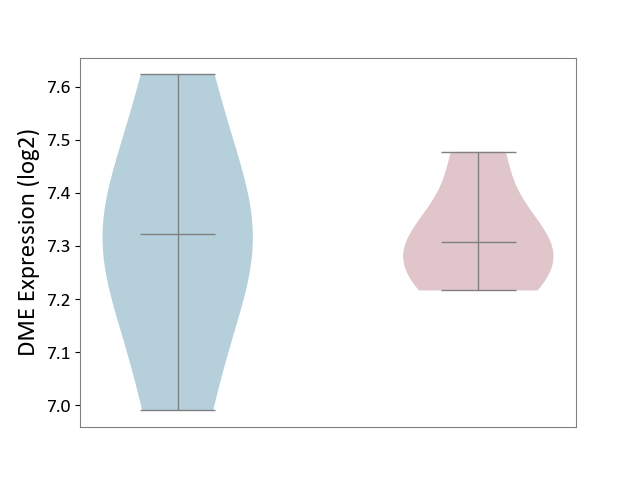
| ICD-11: CA42 | Rhinovirus infection | Click to Show/Hide | |||
| The Studied Tissue | Nasal epithelium tissue | ||||
| The Specified Disease | Rhinovirus infection [ICD-11:CA42.1] | ||||
| The Expression Level of Disease Section Compare with the Healthy Individual Tissue | p-value: 1.67E-01; Fold-change: -9.72E-02; Z-score: -1.52E-01 | ||||
|
DME expression in the diseased tissue of patients
DME expression in the normal tissue of healthy individuals
|
|||||
| Violin Diagram of DME Disease-specific Protein Abundances |
|
Click to View the Clearer Original Diagram | |||
| ICD-11: KA60 | Neonatal sepsis | Click to Show/Hide | |||
| The Studied Tissue | Whole blood | ||||
| The Specified Disease | Neonatal sepsis [ICD-11:KA60] | ||||
| The Expression Level of Disease Section Compare with the Healthy Individual Tissue | p-value: 4.34E-02; Fold-change: -8.46E-02; Z-score: -3.27E-01 | ||||
|
DME expression in the diseased tissue of patients
DME expression in the normal tissue of healthy individuals
|
|||||
| Violin Diagram of DME Disease-specific Protein Abundances |
|
Click to View the Clearer Original Diagram | |||
| ICD Disease Classification 02 | Neoplasm | Click to Show/Hide | |||
| ICD-11: 2A00 | Brain cancer | Click to Show/Hide | |||
| The Studied Tissue | Nervous tissue | ||||
| The Specified Disease | Glioblastopma [ICD-11:2A00.00] | ||||
| The Expression Level of Disease Section Compare with the Healthy Individual Tissue | p-value: 1.89E-07; Fold-change: -8.67E-02; Z-score: -3.13E-01 | ||||
|
DME expression in the diseased tissue of patients
DME expression in the normal tissue of healthy individuals
|
|||||
| Violin Diagram of DME Disease-specific Protein Abundances |
|
Click to View the Clearer Original Diagram | |||
| The Studied Tissue | Brain stem tissue | ||||
| The Specified Disease | Glioma [ICD-11:2A00.0Y-2A00.0Z] | ||||
| The Expression Level of Disease Section Compare with the Healthy Individual Tissue | p-value: 4.06E-02; Fold-change: -1.34E-01; Z-score: -6.13E+00 | ||||
|
DME expression in the diseased tissue of patients
DME expression in the normal tissue of healthy individuals
|
|||||
| Violin Diagram of DME Disease-specific Protein Abundances |
|
Click to View the Clearer Original Diagram | |||
| The Studied Tissue | White matter tissue | ||||
| The Specified Disease | Glioma [ICD-11:2A00.0Y-2A00.0Z] | ||||
| The Expression Level of Disease Section Compare with the Healthy Individual Tissue | p-value: 3.09E-08; Fold-change: -6.43E-01; Z-score: -3.81E+00 | ||||
|
DME expression in the diseased tissue of patients
DME expression in the normal tissue of healthy individuals
|
|||||
| Violin Diagram of DME Disease-specific Protein Abundances |
|
Click to View the Clearer Original Diagram | |||
| The Studied Tissue | Brain stem tissue | ||||
| The Specified Disease | Neuroectodermal tumour [ICD-11:2A00.11] | ||||
| The Expression Level of Disease Section Compare with the Healthy Individual Tissue | p-value: 8.90E-05; Fold-change: -1.12E+00; Z-score: -2.37E+00 | ||||
|
DME expression in the diseased tissue of patients
DME expression in the normal tissue of healthy individuals
|
|||||
| Violin Diagram of DME Disease-specific Protein Abundances |
|
Click to View the Clearer Original Diagram | |||
| ICD-11: 2A20 | Myeloproliferative neoplasm | Click to Show/Hide | |||
| The Studied Tissue | Whole blood | ||||
| The Specified Disease | Myelofibrosis [ICD-11:2A20.2] | ||||
| The Expression Level of Disease Section Compare with the Healthy Individual Tissue | p-value: 3.75E-01; Fold-change: 1.41E-02; Z-score: 7.72E-02 | ||||
|
DME expression in the diseased tissue of patients
DME expression in the normal tissue of healthy individuals
|
|||||
| Violin Diagram of DME Disease-specific Protein Abundances |
|
Click to View the Clearer Original Diagram | |||
| The Studied Tissue | Whole blood | ||||
| The Specified Disease | Polycythemia vera [ICD-11:2A20.4] | ||||
| The Expression Level of Disease Section Compare with the Healthy Individual Tissue | p-value: 3.52E-03; Fold-change: 9.77E-02; Z-score: 5.23E-01 | ||||
|
DME expression in the diseased tissue of patients
DME expression in the normal tissue of healthy individuals
|
|||||
| Violin Diagram of DME Disease-specific Protein Abundances |
|
Click to View the Clearer Original Diagram | |||
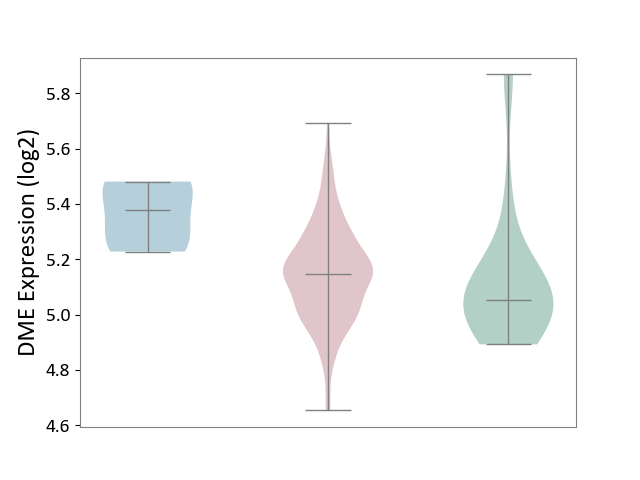
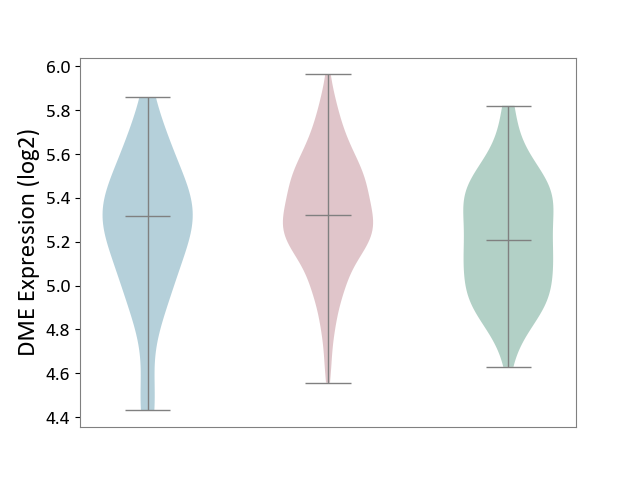
| ICD-11: 2A36 | Myelodysplastic syndrome | Click to Show/Hide | |||
| The Studied Tissue | Bone marrow | ||||
| The Specified Disease | Myelodysplastic syndrome [ICD-11:2A36-2A3Z] | ||||
| The Expression Level of Disease Section Compare with the Healthy Individual Tissue | p-value: 5.55E-01; Fold-change: 9.45E-02; Z-score: 3.90E-01 | ||||
| The Expression Level of Disease Section Compare with the Adjacent Tissue | p-value: 3.74E-02; Fold-change: -2.30E-01; Z-score: -1.83E+00 | ||||
|
DME expression in the diseased tissue of patients
DME expression in the normal tissue adjacent to the diseased tissue of patients
DME expression in the normal tissue of healthy individuals
|
|||||
| Violin Diagram of DME Disease-specific Protein Abundances |
|
Click to View the Clearer Original Diagram | |||
| ICD-11: 2A81 | Diffuse large B-cell lymphoma | Click to Show/Hide | |||
| The Studied Tissue | Tonsil tissue | ||||
| The Specified Disease | Diffuse large B-cell lymphoma [ICD-11:2A81] | ||||
| The Expression Level of Disease Section Compare with the Healthy Individual Tissue | p-value: 9.39E-01; Fold-change: 3.69E-02; Z-score: 2.11E-01 | ||||
|
DME expression in the diseased tissue of patients
DME expression in the normal tissue of healthy individuals
|
|||||
| Violin Diagram of DME Disease-specific Protein Abundances |
|
Click to View the Clearer Original Diagram | |||
| ICD-11: 2A83 | Plasma cell neoplasm | Click to Show/Hide | |||
| The Studied Tissue | Peripheral blood | ||||
| The Specified Disease | Multiple myeloma [ICD-11:2A83.1] | ||||
| The Expression Level of Disease Section Compare with the Healthy Individual Tissue | p-value: 7.88E-01; Fold-change: 7.42E-02; Z-score: 3.54E-01 | ||||
|
DME expression in the diseased tissue of patients
DME expression in the normal tissue of healthy individuals
|
|||||
| Violin Diagram of DME Disease-specific Protein Abundances |
|
Click to View the Clearer Original Diagram | |||
| The Studied Tissue | Bone marrow | ||||
| The Specified Disease | Multiple myeloma [ICD-11:2A83.1] | ||||
| The Expression Level of Disease Section Compare with the Healthy Individual Tissue | p-value: 1.57E-02; Fold-change: -2.75E-01; Z-score: -1.41E+00 | ||||
|
DME expression in the diseased tissue of patients
DME expression in the normal tissue of healthy individuals
|
|||||
| Violin Diagram of DME Disease-specific Protein Abundances |
|
Click to View the Clearer Original Diagram | |||
| ICD-11: 2B33 | Leukaemia | Click to Show/Hide | |||
| The Studied Tissue | Bone marrow | ||||
| The Specified Disease | Acute myelocytic leukaemia [ICD-11:2B33.1] | ||||
| The Expression Level of Disease Section Compare with the Healthy Individual Tissue | p-value: 5.37E-01; Fold-change: 2.12E-02; Z-score: 7.71E-02 | ||||
|
DME expression in the diseased tissue of patients
DME expression in the normal tissue of healthy individuals
|
|||||
| Violin Diagram of DME Disease-specific Protein Abundances |
|
Click to View the Clearer Original Diagram | |||
| ICD-11: 2B6E | Oral cancer | Click to Show/Hide | |||
| The Studied Tissue | Oral tissue | ||||
| The Specified Disease | Oral cancer [ICD-11:2B6E] | ||||
| The Expression Level of Disease Section Compare with the Healthy Individual Tissue | p-value: 2.08E-03; Fold-change: -3.33E-01; Z-score: -1.10E+00 | ||||
| The Expression Level of Disease Section Compare with the Adjacent Tissue | p-value: 6.87E-01; Fold-change: -6.85E-02; Z-score: -1.91E-01 | ||||
|
DME expression in the diseased tissue of patients
DME expression in the normal tissue adjacent to the diseased tissue of patients
DME expression in the normal tissue of healthy individuals
|
|||||
| Violin Diagram of DME Disease-specific Protein Abundances |
|
Click to View the Clearer Original Diagram | |||
| ICD-11: 2B70 | Esophageal cancer | Click to Show/Hide | |||
| The Studied Tissue | Esophagus | ||||
| The Specified Disease | Esophagal cancer [ICD-11:2B70] | ||||
| The Expression Level of Disease Section Compare with the Adjacent Tissue | p-value: 2.04E-01; Fold-change: -7.17E-02; Z-score: -6.05E-01 | ||||
|
DME expression in the diseased tissue of patients
DME expression in the normal tissue adjacent to the diseased tissue of patients
|
|||||
| Violin Diagram of DME Disease-specific Protein Abundances |

|
Click to View the Clearer Original Diagram | |||
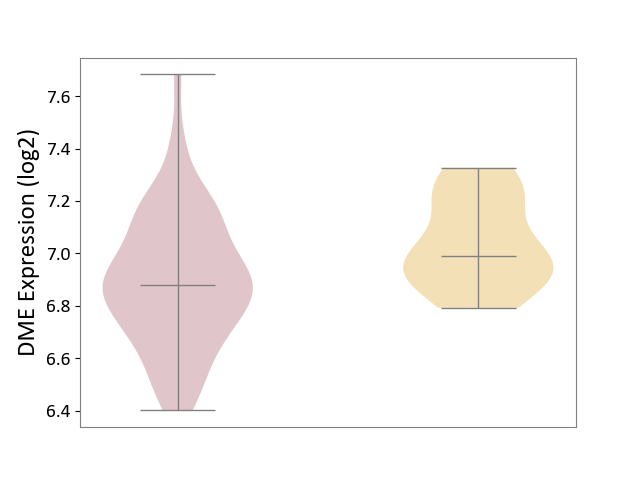
| ICD-11: 2B72 | Stomach cancer | Click to Show/Hide | |||
| The Studied Tissue | Gastric tissue | ||||
| The Specified Disease | Gastric cancer [ICD-11:2B72] | ||||
| The Expression Level of Disease Section Compare with the Healthy Individual Tissue | p-value: 4.33E-01; Fold-change: -1.87E-01; Z-score: -1.17E+00 | ||||
| The Expression Level of Disease Section Compare with the Adjacent Tissue | p-value: 1.74E-03; Fold-change: 1.70E-01; Z-score: 7.45E-01 | ||||
|
DME expression in the diseased tissue of patients
DME expression in the normal tissue adjacent to the diseased tissue of patients
DME expression in the normal tissue of healthy individuals
|
|||||
| Violin Diagram of DME Disease-specific Protein Abundances |
|
Click to View the Clearer Original Diagram | |||
| ICD-11: 2B90 | Colon cancer | Click to Show/Hide | |||
| The Studied Tissue | Colon tissue | ||||
| The Specified Disease | Colon cancer [ICD-11:2B90] | ||||
| The Expression Level of Disease Section Compare with the Healthy Individual Tissue | p-value: 1.92E-04; Fold-change: -1.16E-01; Z-score: -4.54E-01 | ||||
| The Expression Level of Disease Section Compare with the Adjacent Tissue | p-value: 7.13E-01; Fold-change: -3.72E-02; Z-score: -1.46E-01 | ||||
|
DME expression in the diseased tissue of patients
DME expression in the normal tissue adjacent to the diseased tissue of patients
DME expression in the normal tissue of healthy individuals
|
|||||
| Violin Diagram of DME Disease-specific Protein Abundances |
|
Click to View the Clearer Original Diagram | |||
| ICD-11: 2B92 | Rectal cancer | Click to Show/Hide | |||
| The Studied Tissue | Rectal colon tissue | ||||
| The Specified Disease | Rectal cancer [ICD-11:2B92] | ||||
| The Expression Level of Disease Section Compare with the Healthy Individual Tissue | p-value: 4.73E-01; Fold-change: -8.05E-02; Z-score: -3.56E-01 | ||||
| The Expression Level of Disease Section Compare with the Adjacent Tissue | p-value: 5.48E-01; Fold-change: 6.88E-04; Z-score: 2.59E-03 | ||||
|
DME expression in the diseased tissue of patients
DME expression in the normal tissue adjacent to the diseased tissue of patients
DME expression in the normal tissue of healthy individuals
|
|||||
| Violin Diagram of DME Disease-specific Protein Abundances |
|
Click to View the Clearer Original Diagram | |||
| ICD-11: 2C10 | Pancreatic cancer | Click to Show/Hide | |||
| The Studied Tissue | Pancreas | ||||
| The Specified Disease | Pancreatic cancer [ICD-11:2C10] | ||||
| The Expression Level of Disease Section Compare with the Healthy Individual Tissue | p-value: 8.83E-01; Fold-change: -1.43E-01; Z-score: -4.14E-01 | ||||
| The Expression Level of Disease Section Compare with the Adjacent Tissue | p-value: 6.93E-01; Fold-change: -2.00E-01; Z-score: -6.43E-01 | ||||
|
DME expression in the diseased tissue of patients
DME expression in the normal tissue adjacent to the diseased tissue of patients
DME expression in the normal tissue of healthy individuals
|
|||||
| Violin Diagram of DME Disease-specific Protein Abundances |
|
Click to View the Clearer Original Diagram | |||
| ICD-11: 2C12 | Liver cancer | Click to Show/Hide | |||
| The Studied Tissue | Liver tissue | ||||
| The Specified Disease | Liver cancer [ICD-11:2C12.0] | ||||
| The Expression Level of Disease Section Compare with the Healthy Individual Tissue | p-value: 5.71E-13; Fold-change: -4.22E+00; Z-score: -2.32E+00 | ||||
| The Expression Level of Disease Section Compare with the Adjacent Tissue | p-value: 4.51E-62; Fold-change: -3.15E+00; Z-score: -3.35E+00 | ||||
| The Expression Level of Disease Section Compare with the Other Disease Section | p-value: 8.38E-04; Fold-change: -4.34E+00; Z-score: -6.40E+00 | ||||
|
DME expression in the diseased tissue of patients
DME expression in the normal tissue adjacent to the diseased tissue of patients
DME expression in the normal tissue of healthy individuals
DME expression in tissue other than the diseased tissue of patients
|
|||||
| Violin Diagram of DME Disease-specific Protein Abundances |
|
Click to View the Clearer Original Diagram | |||
| ICD-11: 2C25 | Lung cancer | Click to Show/Hide | |||
| The Studied Tissue | Lung tissue | ||||
| The Specified Disease | Lung cancer [ICD-11:2C25] | ||||
| The Expression Level of Disease Section Compare with the Healthy Individual Tissue | p-value: 5.48E-01; Fold-change: -5.89E-02; Z-score: -1.77E-01 | ||||
| The Expression Level of Disease Section Compare with the Adjacent Tissue | p-value: 3.90E-04; Fold-change: -1.99E-01; Z-score: -5.51E-01 | ||||
|
DME expression in the diseased tissue of patients
DME expression in the normal tissue adjacent to the diseased tissue of patients
DME expression in the normal tissue of healthy individuals
|
|||||
| Violin Diagram of DME Disease-specific Protein Abundances |
|
Click to View the Clearer Original Diagram | |||
| ICD-11: 2C30 | Skin cancer | Click to Show/Hide | |||
| The Studied Tissue | Skin | ||||
| The Specified Disease | Melanoma [ICD-11:2C30] | ||||
| The Expression Level of Disease Section Compare with the Healthy Individual Tissue | p-value: 7.24E-01; Fold-change: 1.08E-01; Z-score: 1.51E-01 | ||||
|
DME expression in the diseased tissue of patients
DME expression in the normal tissue of healthy individuals
|
|||||
| Violin Diagram of DME Disease-specific Protein Abundances |
|
Click to View the Clearer Original Diagram | |||
| The Studied Tissue | Skin | ||||
| The Specified Disease | Skin cancer [ICD-11:2C30-2C3Z] | ||||
| The Expression Level of Disease Section Compare with the Healthy Individual Tissue | p-value: 7.83E-08; Fold-change: -2.77E-01; Z-score: -5.15E-01 | ||||
| The Expression Level of Disease Section Compare with the Adjacent Tissue | p-value: 1.59E-23; Fold-change: 9.47E-01; Z-score: 1.51E+00 | ||||
|
DME expression in the diseased tissue of patients
DME expression in the normal tissue adjacent to the diseased tissue of patients
DME expression in the normal tissue of healthy individuals
|
|||||
| Violin Diagram of DME Disease-specific Protein Abundances |
|
Click to View the Clearer Original Diagram | |||
| ICD-11: 2C6Z | Breast cancer | Click to Show/Hide | |||
| The Studied Tissue | Breast tissue | ||||
| The Specified Disease | Breast cancer [ICD-11:2C60-2C6Z] | ||||
| The Expression Level of Disease Section Compare with the Healthy Individual Tissue | p-value: 3.15E-06; Fold-change: -4.25E-01; Z-score: -9.04E-01 | ||||
| The Expression Level of Disease Section Compare with the Adjacent Tissue | p-value: 9.54E-01; Fold-change: -1.77E-01; Z-score: -4.40E-01 | ||||
|
DME expression in the diseased tissue of patients
DME expression in the normal tissue adjacent to the diseased tissue of patients
DME expression in the normal tissue of healthy individuals
|
|||||
| Violin Diagram of DME Disease-specific Protein Abundances |
|
Click to View the Clearer Original Diagram | |||
| ICD-11: 2C73 | Ovarian cancer | Click to Show/Hide | |||
| The Studied Tissue | Ovarian tissue | ||||
| The Specified Disease | Ovarian cancer [ICD-11:2C73] | ||||
| The Expression Level of Disease Section Compare with the Healthy Individual Tissue | p-value: 5.94E-01; Fold-change: -9.00E-02; Z-score: -4.71E-01 | ||||
| The Expression Level of Disease Section Compare with the Adjacent Tissue | p-value: 9.81E-01; Fold-change: 4.97E-03; Z-score: 1.99E-02 | ||||
|
DME expression in the diseased tissue of patients
DME expression in the normal tissue adjacent to the diseased tissue of patients
DME expression in the normal tissue of healthy individuals
|
|||||
| Violin Diagram of DME Disease-specific Protein Abundances |
|
Click to View the Clearer Original Diagram | |||
| ICD-11: 2C77 | Cervical cancer | Click to Show/Hide | |||
| The Studied Tissue | Cervical tissue | ||||
| The Specified Disease | Cervical cancer [ICD-11:2C77] | ||||
| The Expression Level of Disease Section Compare with the Healthy Individual Tissue | p-value: 1.04E-03; Fold-change: -2.19E-01; Z-score: -9.35E-01 | ||||
|
DME expression in the diseased tissue of patients
DME expression in the normal tissue of healthy individuals
|
|||||
| Violin Diagram of DME Disease-specific Protein Abundances |
|
Click to View the Clearer Original Diagram | |||
| ICD-11: 2C78 | Uterine cancer | Click to Show/Hide | |||
| The Studied Tissue | Endometrium tissue | ||||
| The Specified Disease | Uterine cancer [ICD-11:2C78] | ||||
| The Expression Level of Disease Section Compare with the Healthy Individual Tissue | p-value: 4.55E-04; Fold-change: -1.16E-01; Z-score: -4.21E-01 | ||||
| The Expression Level of Disease Section Compare with the Adjacent Tissue | p-value: 3.51E-02; Fold-change: 2.06E-01; Z-score: 1.67E+00 | ||||
|
DME expression in the diseased tissue of patients
DME expression in the normal tissue adjacent to the diseased tissue of patients
DME expression in the normal tissue of healthy individuals
|
|||||
| Violin Diagram of DME Disease-specific Protein Abundances |
|
Click to View the Clearer Original Diagram | |||
| ICD-11: 2C82 | Prostate cancer | Click to Show/Hide | |||
| The Studied Tissue | Prostate | ||||
| The Specified Disease | Prostate cancer [ICD-11:2C82] | ||||
| The Expression Level of Disease Section Compare with the Healthy Individual Tissue | p-value: 8.39E-05; Fold-change: -1.04E+00; Z-score: -1.40E+00 | ||||
|
DME expression in the diseased tissue of patients
DME expression in the normal tissue of healthy individuals
|
|||||
| Violin Diagram of DME Disease-specific Protein Abundances |
|
Click to View the Clearer Original Diagram | |||
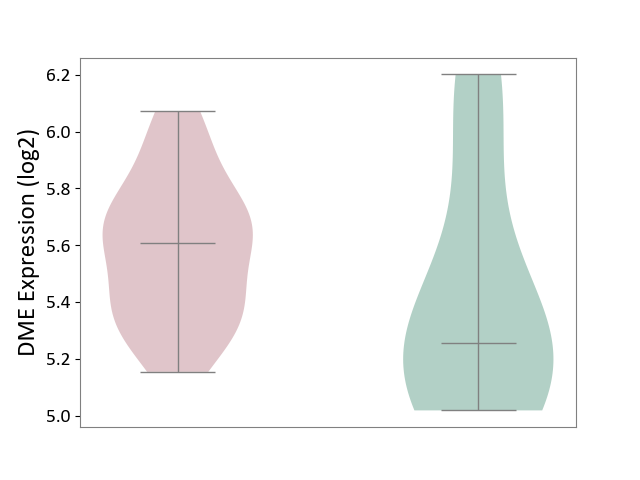
| ICD-11: 2C90 | Renal cancer | Click to Show/Hide | |||
| The Studied Tissue | Kidney | ||||
| The Specified Disease | Renal cancer [ICD-11:2C90-2C91] | ||||
| The Expression Level of Disease Section Compare with the Healthy Individual Tissue | p-value: 9.77E-02; Fold-change: -2.66E-01; Z-score: -7.98E-01 | ||||
| The Expression Level of Disease Section Compare with the Adjacent Tissue | p-value: 3.02E-14; Fold-change: -5.82E-01; Z-score: -1.62E+00 | ||||
|
DME expression in the diseased tissue of patients
DME expression in the normal tissue adjacent to the diseased tissue of patients
DME expression in the normal tissue of healthy individuals
|
|||||
| Violin Diagram of DME Disease-specific Protein Abundances |
|
Click to View the Clearer Original Diagram | |||
| ICD-11: 2C92 | Ureter cancer | Click to Show/Hide | |||
| The Studied Tissue | Urothelium | ||||
| The Specified Disease | Ureter cancer [ICD-11:2C92] | ||||
| The Expression Level of Disease Section Compare with the Healthy Individual Tissue | p-value: 3.47E-01; Fold-change: -5.85E-02; Z-score: -2.83E-01 | ||||
|
DME expression in the diseased tissue of patients
DME expression in the normal tissue of healthy individuals
|
|||||
| Violin Diagram of DME Disease-specific Protein Abundances |
|
Click to View the Clearer Original Diagram | |||
| ICD-11: 2C94 | Bladder cancer | Click to Show/Hide | |||
| The Studied Tissue | Bladder tissue | ||||
| The Specified Disease | Bladder cancer [ICD-11:2C94] | ||||
| The Expression Level of Disease Section Compare with the Healthy Individual Tissue | p-value: 2.75E-04; Fold-change: 5.92E-01; Z-score: 2.29E+00 | ||||
|
DME expression in the diseased tissue of patients
DME expression in the normal tissue of healthy individuals
|
|||||
| Violin Diagram of DME Disease-specific Protein Abundances |
|
Click to View the Clearer Original Diagram | |||
| ICD-11: 2D02 | Retinal cancer | Click to Show/Hide | |||
| The Studied Tissue | Uvea | ||||
| The Specified Disease | Retinoblastoma [ICD-11:2D02.2] | ||||
| The Expression Level of Disease Section Compare with the Healthy Individual Tissue | p-value: 4.27E-03; Fold-change: -3.92E-01; Z-score: -1.99E+00 | ||||
|
DME expression in the diseased tissue of patients
DME expression in the normal tissue of healthy individuals
|
|||||
| Violin Diagram of DME Disease-specific Protein Abundances |
|
Click to View the Clearer Original Diagram | |||
| ICD-11: 2D10 | Thyroid cancer | Click to Show/Hide | |||
| The Studied Tissue | Thyroid | ||||
| The Specified Disease | Thyroid cancer [ICD-11:2D10] | ||||
| The Expression Level of Disease Section Compare with the Healthy Individual Tissue | p-value: 3.50E-04; Fold-change: 1.16E-01; Z-score: 4.39E-01 | ||||
| The Expression Level of Disease Section Compare with the Adjacent Tissue | p-value: 1.38E-01; Fold-change: 4.78E-03; Z-score: 1.45E-02 | ||||
|
DME expression in the diseased tissue of patients
DME expression in the normal tissue adjacent to the diseased tissue of patients
DME expression in the normal tissue of healthy individuals
|
|||||
| Violin Diagram of DME Disease-specific Protein Abundances |
|
Click to View the Clearer Original Diagram | |||
| ICD-11: 2D11 | Adrenal cancer | Click to Show/Hide | |||
| The Studied Tissue | Adrenal cortex | ||||
| The Specified Disease | Adrenocortical carcinoma [ICD-11:2D11.Z] | ||||
| The Expression Level of Disease Section Compare with the Other Disease Section | p-value: 5.44E-03; Fold-change: -1.10E-01; Z-score: -6.37E-01 | ||||
|
DME expression in the diseased tissue of patients
DME expression in tissue other than the diseased tissue of patients
|
|||||
| Violin Diagram of DME Disease-specific Protein Abundances |
|
Click to View the Clearer Original Diagram | |||
| ICD-11: 2D12 | Endocrine gland neoplasm | Click to Show/Hide | |||
| The Studied Tissue | Pituitary tissue | ||||
| The Specified Disease | Pituitary cancer [ICD-11:2D12] | ||||
| The Expression Level of Disease Section Compare with the Healthy Individual Tissue | p-value: 2.21E-01; Fold-change: 3.51E-01; Z-score: 8.33E-01 | ||||
|
DME expression in the diseased tissue of patients
DME expression in the normal tissue of healthy individuals
|
|||||
| Violin Diagram of DME Disease-specific Protein Abundances |
|
Click to View the Clearer Original Diagram | |||
| The Studied Tissue | Pituitary tissue | ||||
| The Specified Disease | Pituitary gonadotrope tumour [ICD-11:2D12] | ||||
| The Expression Level of Disease Section Compare with the Healthy Individual Tissue | p-value: 7.50E-02; Fold-change: 3.49E-01; Z-score: 1.14E+00 | ||||
|
DME expression in the diseased tissue of patients
DME expression in the normal tissue of healthy individuals
|
|||||
| Violin Diagram of DME Disease-specific Protein Abundances |
|
Click to View the Clearer Original Diagram | |||
| ICD-11: 2D42 | Head and neck cancer | Click to Show/Hide | |||
| The Studied Tissue | Head and neck tissue | ||||
| The Specified Disease | Head and neck cancer [ICD-11:2D42] | ||||
| The Expression Level of Disease Section Compare with the Healthy Individual Tissue | p-value: 4.94E-13; Fold-change: -4.03E-01; Z-score: -6.01E-01 | ||||
|
DME expression in the diseased tissue of patients
DME expression in the normal tissue of healthy individuals
|
|||||
| Violin Diagram of DME Disease-specific Protein Abundances |
|
Click to View the Clearer Original Diagram | |||
| ICD Disease Classification 03 | Blood/blood-forming organ disease | Click to Show/Hide | |||
| ICD-11: 3A51 | Sickle cell disorder | Click to Show/Hide | |||
| The Studied Tissue | Peripheral blood | ||||
| The Specified Disease | Sickle cell disease [ICD-11:3A51.0-3A51.3] | ||||
| The Expression Level of Disease Section Compare with the Healthy Individual Tissue | p-value: 9.21E-02; Fold-change: 2.41E-01; Z-score: 1.09E+00 | ||||
|
DME expression in the diseased tissue of patients
DME expression in the normal tissue of healthy individuals
|
|||||
| Violin Diagram of DME Disease-specific Protein Abundances |
|
Click to View the Clearer Original Diagram | |||
| ICD-11: 3A70 | Aplastic anaemia | Click to Show/Hide | |||
| The Studied Tissue | Bone marrow | ||||
| The Specified Disease | Shwachman-Diamond syndrome [ICD-11:3A70.0] | ||||
| The Expression Level of Disease Section Compare with the Healthy Individual Tissue | p-value: 3.76E-01; Fold-change: 9.13E-02; Z-score: 4.54E-01 | ||||
|
DME expression in the diseased tissue of patients
DME expression in the normal tissue of healthy individuals
|
|||||
| Violin Diagram of DME Disease-specific Protein Abundances |
|
Click to View the Clearer Original Diagram | |||
| ICD-11: 3B63 | Thrombocytosis | Click to Show/Hide | |||
| The Studied Tissue | Whole blood | ||||
| The Specified Disease | Thrombocythemia [ICD-11:3B63] | ||||
| The Expression Level of Disease Section Compare with the Healthy Individual Tissue | p-value: 1.16E-02; Fold-change: 1.80E-01; Z-score: 9.50E-01 | ||||
|
DME expression in the diseased tissue of patients
DME expression in the normal tissue of healthy individuals
|
|||||
| Violin Diagram of DME Disease-specific Protein Abundances |
|
Click to View the Clearer Original Diagram | |||
| ICD-11: 3B64 | Thrombocytopenia | Click to Show/Hide | |||
| The Studied Tissue | Whole blood | ||||
| The Specified Disease | Thrombocytopenia [ICD-11:3B64] | ||||
| The Expression Level of Disease Section Compare with the Healthy Individual Tissue | p-value: 4.87E-01; Fold-change: 9.07E-02; Z-score: 2.80E-01 | ||||
|
DME expression in the diseased tissue of patients
DME expression in the normal tissue of healthy individuals
|
|||||
| Violin Diagram of DME Disease-specific Protein Abundances |
|
Click to View the Clearer Original Diagram | |||
| ICD Disease Classification 04 | Immune system disease | Click to Show/Hide | |||
| ICD-11: 4A00 | Immunodeficiency | Click to Show/Hide | |||
| The Studied Tissue | Peripheral blood | ||||
| The Specified Disease | Immunodeficiency [ICD-11:4A00-4A20] | ||||
| The Expression Level of Disease Section Compare with the Healthy Individual Tissue | p-value: 1.07E-01; Fold-change: 5.60E-02; Z-score: 5.82E-01 | ||||
|
DME expression in the diseased tissue of patients
DME expression in the normal tissue of healthy individuals
|
|||||
| Violin Diagram of DME Disease-specific Protein Abundances |
|
Click to View the Clearer Original Diagram | |||
| ICD-11: 4A40 | Lupus erythematosus | Click to Show/Hide | |||
| The Studied Tissue | Whole blood | ||||
| The Specified Disease | Lupus erythematosus [ICD-11:4A40] | ||||
| The Expression Level of Disease Section Compare with the Healthy Individual Tissue | p-value: 1.10E-02; Fold-change: -3.16E-01; Z-score: -4.56E-01 | ||||
|
DME expression in the diseased tissue of patients
DME expression in the normal tissue of healthy individuals
|
|||||
| Violin Diagram of DME Disease-specific Protein Abundances |
|
Click to View the Clearer Original Diagram | |||
| ICD-11: 4A42 | Systemic sclerosis | Click to Show/Hide | |||
| The Studied Tissue | Whole blood | ||||
| The Specified Disease | Scleroderma [ICD-11:4A42.Z] | ||||
| The Expression Level of Disease Section Compare with the Healthy Individual Tissue | p-value: 8.08E-05; Fold-change: 1.77E-01; Z-score: 1.65E+00 | ||||
|
DME expression in the diseased tissue of patients
DME expression in the normal tissue of healthy individuals
|
|||||
| Violin Diagram of DME Disease-specific Protein Abundances |
|
Click to View the Clearer Original Diagram | |||
| ICD-11: 4A43 | Systemic autoimmune disease | Click to Show/Hide | |||
| The Studied Tissue | Salivary gland tissue | ||||
| The Specified Disease | Sjogren's syndrome [ICD-11:4A43.2] | ||||
| The Expression Level of Disease Section Compare with the Healthy Individual Tissue | p-value: 7.61E-01; Fold-change: 1.05E-02; Z-score: 4.41E-02 | ||||
| The Expression Level of Disease Section Compare with the Adjacent Tissue | p-value: 3.20E-01; Fold-change: -8.21E-02; Z-score: -5.49E-01 | ||||
|
DME expression in the diseased tissue of patients
DME expression in the normal tissue adjacent to the diseased tissue of patients
DME expression in the normal tissue of healthy individuals
|
|||||
| Violin Diagram of DME Disease-specific Protein Abundances |
|
Click to View the Clearer Original Diagram | |||
| ICD-11: 4A62 | Behcet disease | Click to Show/Hide | |||
| The Studied Tissue | Peripheral blood | ||||
| The Specified Disease | Behcet's disease [ICD-11:4A62] | ||||
| The Expression Level of Disease Section Compare with the Healthy Individual Tissue | p-value: 2.84E-01; Fold-change: 1.09E-01; Z-score: 5.16E-01 | ||||
|
DME expression in the diseased tissue of patients
DME expression in the normal tissue of healthy individuals
|
|||||
| Violin Diagram of DME Disease-specific Protein Abundances |
|
Click to View the Clearer Original Diagram | |||
| ICD-11: 4B04 | Monocyte count disorder | Click to Show/Hide | |||
| The Studied Tissue | Whole blood | ||||
| The Specified Disease | Autosomal dominant monocytopenia [ICD-11:4B04] | ||||
| The Expression Level of Disease Section Compare with the Healthy Individual Tissue | p-value: 7.66E-01; Fold-change: -7.53E-02; Z-score: -3.25E-01 | ||||
|
DME expression in the diseased tissue of patients
DME expression in the normal tissue of healthy individuals
|
|||||
| Violin Diagram of DME Disease-specific Protein Abundances |
|
Click to View the Clearer Original Diagram | |||
| ICD Disease Classification 05 | Endocrine/nutritional/metabolic disease | Click to Show/Hide | |||
| ICD-11: 5A11 | Type 2 diabetes mellitus | Click to Show/Hide | |||
| The Studied Tissue | Omental adipose tissue | ||||
| The Specified Disease | Obesity related type 2 diabetes [ICD-11:5A11] | ||||
| The Expression Level of Disease Section Compare with the Healthy Individual Tissue | p-value: 3.86E-01; Fold-change: 9.21E-02; Z-score: 6.54E-01 | ||||
|
DME expression in the diseased tissue of patients
DME expression in the normal tissue of healthy individuals
|
|||||
| Violin Diagram of DME Disease-specific Protein Abundances |
|
Click to View the Clearer Original Diagram | |||
| The Studied Tissue | Liver tissue | ||||
| The Specified Disease | Type 2 diabetes [ICD-11:5A11] | ||||
| The Expression Level of Disease Section Compare with the Healthy Individual Tissue | p-value: 6.97E-01; Fold-change: 2.69E-01; Z-score: 5.70E-01 | ||||
|
DME expression in the diseased tissue of patients
DME expression in the normal tissue of healthy individuals
|
|||||
| Violin Diagram of DME Disease-specific Protein Abundances |

|
Click to View the Clearer Original Diagram | |||
| ICD-11: 5A80 | Ovarian dysfunction | Click to Show/Hide | |||
| The Studied Tissue | Vastus lateralis muscle | ||||
| The Specified Disease | Polycystic ovary syndrome [ICD-11:5A80.1] | ||||
| The Expression Level of Disease Section Compare with the Healthy Individual Tissue | p-value: 2.07E-01; Fold-change: -5.63E-02; Z-score: -3.55E-01 | ||||
|
DME expression in the diseased tissue of patients
DME expression in the normal tissue of healthy individuals
|
|||||
| Violin Diagram of DME Disease-specific Protein Abundances |
|
Click to View the Clearer Original Diagram | |||
| ICD-11: 5C51 | Inborn carbohydrate metabolism disorder | Click to Show/Hide | |||
| The Studied Tissue | Biceps muscle | ||||
| The Specified Disease | Pompe disease [ICD-11:5C51.3] | ||||
| The Expression Level of Disease Section Compare with the Healthy Individual Tissue | p-value: 1.21E-02; Fold-change: -1.47E-01; Z-score: -1.06E+00 | ||||
|
DME expression in the diseased tissue of patients
DME expression in the normal tissue of healthy individuals
|
|||||
| Violin Diagram of DME Disease-specific Protein Abundances |
|
Click to View the Clearer Original Diagram | |||
| ICD-11: 5C56 | Lysosomal disease | Click to Show/Hide | |||
| The Studied Tissue | Whole blood | ||||
| The Specified Disease | Batten disease [ICD-11:5C56.1] | ||||
| The Expression Level of Disease Section Compare with the Healthy Individual Tissue | p-value: 3.40E-01; Fold-change: 1.05E-01; Z-score: 9.15E-01 | ||||
|
DME expression in the diseased tissue of patients
DME expression in the normal tissue of healthy individuals
|
|||||
| Violin Diagram of DME Disease-specific Protein Abundances |
|
Click to View the Clearer Original Diagram | |||
| ICD-11: 5C80 | Hyperlipoproteinaemia | Click to Show/Hide | |||
| The Studied Tissue | Peripheral blood | ||||
| The Specified Disease | Familial hypercholesterolemia [ICD-11:5C80.00] | ||||
| The Expression Level of Disease Section Compare with the Healthy Individual Tissue | p-value: 5.05E-01; Fold-change: -7.80E-02; Z-score: -3.56E-01 | ||||
|
DME expression in the diseased tissue of patients
DME expression in the normal tissue of healthy individuals
|
|||||
| Violin Diagram of DME Disease-specific Protein Abundances |
|
Click to View the Clearer Original Diagram | |||
| The Studied Tissue | Whole blood | ||||
| The Specified Disease | Familial hypercholesterolemia [ICD-11:5C80.00] | ||||
| The Expression Level of Disease Section Compare with the Healthy Individual Tissue | p-value: 8.16E-05; Fold-change: -5.46E-01; Z-score: -1.71E+00 | ||||
|
DME expression in the diseased tissue of patients
DME expression in the normal tissue of healthy individuals
|
|||||
| Violin Diagram of DME Disease-specific Protein Abundances |
|
Click to View the Clearer Original Diagram | |||
| ICD Disease Classification 06 | Mental/behavioural/neurodevelopmental disorder | Click to Show/Hide | |||
| ICD-11: 6A02 | Autism spectrum disorder | Click to Show/Hide | |||
| The Studied Tissue | Whole blood | ||||
| The Specified Disease | Autism [ICD-11:6A02] | ||||
| The Expression Level of Disease Section Compare with the Healthy Individual Tissue | p-value: 3.98E-01; Fold-change: -2.30E-02; Z-score: -8.80E-02 | ||||
|
DME expression in the diseased tissue of patients
DME expression in the normal tissue of healthy individuals
|
|||||
| Violin Diagram of DME Disease-specific Protein Abundances |
|
Click to View the Clearer Original Diagram | |||
| ICD-11: 6A20 | Schizophrenia | Click to Show/Hide | |||
| The Studied Tissue | Prefrontal cortex | ||||
| The Specified Disease | Schizophrenia [ICD-11:6A20] | ||||
| The Expression Level of Disease Section Compare with the Healthy Individual Tissue | p-value: 6.24E-01; Fold-change: 6.79E-02; Z-score: 2.28E-01 | ||||
|
DME expression in the diseased tissue of patients
DME expression in the normal tissue of healthy individuals
|
|||||
| Violin Diagram of DME Disease-specific Protein Abundances |
|
Click to View the Clearer Original Diagram | |||
| The Studied Tissue | Superior temporal cortex | ||||
| The Specified Disease | Schizophrenia [ICD-11:6A20] | ||||
| The Expression Level of Disease Section Compare with the Healthy Individual Tissue | p-value: 2.82E-01; Fold-change: -4.18E-02; Z-score: -2.80E-01 | ||||
|
DME expression in the diseased tissue of patients
DME expression in the normal tissue of healthy individuals
|
|||||
| Violin Diagram of DME Disease-specific Protein Abundances |
|
Click to View the Clearer Original Diagram | |||
| ICD-11: 6A60 | Bipolar disorder | Click to Show/Hide | |||
| The Studied Tissue | Prefrontal cortex | ||||
| The Specified Disease | Bipolar disorder [ICD-11:6A60-6A6Z] | ||||
| The Expression Level of Disease Section Compare with the Healthy Individual Tissue | p-value: 5.78E-01; Fold-change: -6.08E-03; Z-score: -4.13E-02 | ||||
|
DME expression in the diseased tissue of patients
DME expression in the normal tissue of healthy individuals
|
|||||
| Violin Diagram of DME Disease-specific Protein Abundances |
|
Click to View the Clearer Original Diagram | |||
| ICD-11: 6A70 | Depressive disorder | Click to Show/Hide | |||
| The Studied Tissue | Whole blood | ||||
| The Specified Disease | Major depressive disorder [ICD-11:6A70-6A7Z] | ||||
| The Expression Level of Disease Section Compare with the Healthy Individual Tissue | p-value: 4.48E-01; Fold-change: -2.24E-02; Z-score: -7.80E-02 | ||||
|
DME expression in the diseased tissue of patients
DME expression in the normal tissue of healthy individuals
|
|||||
| Violin Diagram of DME Disease-specific Protein Abundances |
|
Click to View the Clearer Original Diagram | |||
| The Studied Tissue | Hippocampus | ||||
| The Specified Disease | Major depressive disorder [ICD-11:6A70-6A7Z] | ||||
| The Expression Level of Disease Section Compare with the Healthy Individual Tissue | p-value: 2.21E-02; Fold-change: 9.40E-02; Z-score: 6.62E-01 | ||||
|
DME expression in the diseased tissue of patients
DME expression in the normal tissue of healthy individuals
|
|||||
| Violin Diagram of DME Disease-specific Protein Abundances |
|
Click to View the Clearer Original Diagram | |||
| ICD Disease Classification 08 | Nervous system disease | Click to Show/Hide | |||
| ICD-11: 8A00 | Parkinsonism | Click to Show/Hide | |||
| The Studied Tissue | Substantia nigra tissue | ||||
| The Specified Disease | Parkinson's disease [ICD-11:8A00.0] | ||||
| The Expression Level of Disease Section Compare with the Healthy Individual Tissue | p-value: 8.99E-01; Fold-change: 4.59E-03; Z-score: 2.19E-02 | ||||
|
DME expression in the diseased tissue of patients
DME expression in the normal tissue of healthy individuals
|
|||||
| Violin Diagram of DME Disease-specific Protein Abundances |
|
Click to View the Clearer Original Diagram | |||
| ICD-11: 8A01 | Choreiform disorder | Click to Show/Hide | |||
| The Studied Tissue | Whole blood | ||||
| The Specified Disease | Huntington's disease [ICD-11:8A01.10] | ||||
| The Expression Level of Disease Section Compare with the Healthy Individual Tissue | p-value: 1.51E-01; Fold-change: 5.05E-02; Z-score: 3.39E-01 | ||||
|
DME expression in the diseased tissue of patients
DME expression in the normal tissue of healthy individuals
|
|||||
| Violin Diagram of DME Disease-specific Protein Abundances |
|
Click to View the Clearer Original Diagram | |||
| ICD-11: 8A20 | Alzheimer disease | Click to Show/Hide | |||
| The Studied Tissue | Entorhinal cortex | ||||
| The Specified Disease | Alzheimer's disease [ICD-11:8A20] | ||||
| The Expression Level of Disease Section Compare with the Healthy Individual Tissue | p-value: 2.02E-01; Fold-change: -2.49E-02; Z-score: -1.81E-01 | ||||
|
DME expression in the diseased tissue of patients
DME expression in the normal tissue of healthy individuals
|
|||||
| Violin Diagram of DME Disease-specific Protein Abundances |
|
Click to View the Clearer Original Diagram | |||
| ICD-11: 8A2Y | Neurocognitive impairment | Click to Show/Hide | |||
| The Studied Tissue | White matter tissue | ||||
| The Specified Disease | HIV-associated neurocognitive impairment [ICD-11:8A2Y-8A2Z] | ||||
| The Expression Level of Disease Section Compare with the Healthy Individual Tissue | p-value: 3.29E-02; Fold-change: -7.09E-02; Z-score: -3.37E-01 | ||||
|
DME expression in the diseased tissue of patients
DME expression in the normal tissue of healthy individuals
|
|||||
| Violin Diagram of DME Disease-specific Protein Abundances |
|
Click to View the Clearer Original Diagram | |||
| ICD-11: 8A40 | Multiple sclerosis | Click to Show/Hide | |||
| The Studied Tissue | Plasmacytoid dendritic cells | ||||
| The Specified Disease | Multiple sclerosis [ICD-11:8A40] | ||||
| The Expression Level of Disease Section Compare with the Healthy Individual Tissue | p-value: 7.56E-01; Fold-change: -6.70E-02; Z-score: -3.47E-01 | ||||
|
DME expression in the diseased tissue of patients
DME expression in the normal tissue of healthy individuals
|
|||||
| Violin Diagram of DME Disease-specific Protein Abundances |
|
Click to View the Clearer Original Diagram | |||
| The Studied Tissue | Spinal cord | ||||
| The Specified Disease | Multiple sclerosis [ICD-11:8A40] | ||||
| The Expression Level of Disease Section Compare with the Adjacent Tissue | p-value: 1.41E-01; Fold-change: -2.43E-01; Z-score: -1.37E+00 | ||||
|
DME expression in the diseased tissue of patients
DME expression in the normal tissue adjacent to the diseased tissue of patients
|
|||||
| Violin Diagram of DME Disease-specific Protein Abundances |
|
Click to View the Clearer Original Diagram | |||
| ICD-11: 8A60 | Epilepsy | Click to Show/Hide | |||
| The Studied Tissue | Peritumoral cortex tissue | ||||
| The Specified Disease | Epilepsy [ICD-11:8A60-8A6Z] | ||||
| The Expression Level of Disease Section Compare with the Other Disease Section | p-value: 4.75E-02; Fold-change: 2.15E-01; Z-score: 4.26E+00 | ||||
|
DME expression in the diseased tissue of patients
DME expression in tissue other than the diseased tissue of patients
|
|||||
| Violin Diagram of DME Disease-specific Protein Abundances |
|
Click to View the Clearer Original Diagram | |||
| The Studied Tissue | Whole blood | ||||
| The Specified Disease | Seizure [ICD-11:8A60-8A6Z] | ||||
| The Expression Level of Disease Section Compare with the Healthy Individual Tissue | p-value: 6.69E-02; Fold-change: -1.31E-01; Z-score: -7.17E-01 | ||||
|
DME expression in the diseased tissue of patients
DME expression in the normal tissue of healthy individuals
|
|||||
| Violin Diagram of DME Disease-specific Protein Abundances |
|
Click to View the Clearer Original Diagram | |||
| ICD-11: 8B01 | Subarachnoid haemorrhage | Click to Show/Hide | |||
| The Studied Tissue | Intracranial artery | ||||
| The Specified Disease | Intracranial aneurysm [ICD-11:8B01.0] | ||||
| The Expression Level of Disease Section Compare with the Healthy Individual Tissue | p-value: 5.49E-01; Fold-change: 2.01E-01; Z-score: 6.49E-01 | ||||
|
DME expression in the diseased tissue of patients
DME expression in the normal tissue of healthy individuals
|
|||||
| Violin Diagram of DME Disease-specific Protein Abundances |
|
Click to View the Clearer Original Diagram | |||
| ICD-11: 8B11 | Cerebral ischaemic stroke | Click to Show/Hide | |||
| The Studied Tissue | Whole blood | ||||
| The Specified Disease | Cardioembolic stroke [ICD-11:8B11.20] | ||||
| The Expression Level of Disease Section Compare with the Healthy Individual Tissue | p-value: 4.52E-07; Fold-change: 2.73E-01; Z-score: 1.88E+00 | ||||
|
DME expression in the diseased tissue of patients
DME expression in the normal tissue of healthy individuals
|
|||||
| Violin Diagram of DME Disease-specific Protein Abundances |
|
Click to View the Clearer Original Diagram | |||
| The Studied Tissue | Peripheral blood | ||||
| The Specified Disease | Ischemic stroke [ICD-11:8B11] | ||||
| The Expression Level of Disease Section Compare with the Healthy Individual Tissue | p-value: 5.94E-01; Fold-change: 2.54E-02; Z-score: 1.06E-01 | ||||
|
DME expression in the diseased tissue of patients
DME expression in the normal tissue of healthy individuals
|
|||||
| Violin Diagram of DME Disease-specific Protein Abundances |
|
Click to View the Clearer Original Diagram | |||
| ICD-11: 8B60 | Motor neuron disease | Click to Show/Hide | |||
| The Studied Tissue | Skin | ||||
| The Specified Disease | Lateral sclerosis [ICD-11:8B60.4] | ||||
| The Expression Level of Disease Section Compare with the Healthy Individual Tissue | p-value: 2.76E-01; Fold-change: 8.14E-02; Z-score: 9.84E-01 | ||||
|
DME expression in the diseased tissue of patients
DME expression in the normal tissue of healthy individuals
|
|||||
| Violin Diagram of DME Disease-specific Protein Abundances |
|
Click to View the Clearer Original Diagram | |||
| The Studied Tissue | Cervical spinal cord | ||||
| The Specified Disease | Lateral sclerosis [ICD-11:8B60.4] | ||||
| The Expression Level of Disease Section Compare with the Healthy Individual Tissue | p-value: 8.60E-01; Fold-change: 1.59E-02; Z-score: 5.91E-02 | ||||
|
DME expression in the diseased tissue of patients
DME expression in the normal tissue of healthy individuals
|
|||||
| Violin Diagram of DME Disease-specific Protein Abundances |
|
Click to View the Clearer Original Diagram | |||
| ICD-11: 8C70 | Muscular dystrophy | Click to Show/Hide | |||
| The Studied Tissue | Muscle tissue | ||||
| The Specified Disease | Myopathy [ICD-11:8C70.6] | ||||
| The Expression Level of Disease Section Compare with the Healthy Individual Tissue | p-value: 1.68E-01; Fold-change: -8.94E-02; Z-score: -3.91E-01 | ||||
|
DME expression in the diseased tissue of patients
DME expression in the normal tissue of healthy individuals
|
|||||
| Violin Diagram of DME Disease-specific Protein Abundances |
|
Click to View the Clearer Original Diagram | |||
| ICD-11: 8C75 | Distal myopathy | Click to Show/Hide | |||
| The Studied Tissue | Muscle tissue | ||||
| The Specified Disease | Tibial muscular dystrophy [ICD-11:8C75] | ||||
| The Expression Level of Disease Section Compare with the Healthy Individual Tissue | p-value: 8.92E-02; Fold-change: -6.11E-02; Z-score: -4.77E-01 | ||||
|
DME expression in the diseased tissue of patients
DME expression in the normal tissue of healthy individuals
|
|||||
| Violin Diagram of DME Disease-specific Protein Abundances |
|
Click to View the Clearer Original Diagram | |||
| ICD Disease Classification 09 | Visual system disease | Click to Show/Hide | |||
| ICD-11: 9A96 | Anterior uveitis | Click to Show/Hide | |||
| The Studied Tissue | Peripheral monocyte | ||||
| The Specified Disease | Autoimmune uveitis [ICD-11:9A96] | ||||
| The Expression Level of Disease Section Compare with the Healthy Individual Tissue | p-value: 7.48E-01; Fold-change: -1.59E-02; Z-score: -1.03E-01 | ||||
|
DME expression in the diseased tissue of patients
DME expression in the normal tissue of healthy individuals
|
|||||
| Violin Diagram of DME Disease-specific Protein Abundances |
|
Click to View the Clearer Original Diagram | |||
| ICD Disease Classification 11 | Circulatory system disease | Click to Show/Hide | |||
| ICD-11: BA41 | Myocardial infarction | Click to Show/Hide | |||
| The Studied Tissue | Peripheral blood | ||||
| The Specified Disease | Myocardial infarction [ICD-11:BA41-BA50] | ||||
| The Expression Level of Disease Section Compare with the Healthy Individual Tissue | p-value: 7.53E-02; Fold-change: 1.64E-01; Z-score: 2.20E-01 | ||||
|
DME expression in the diseased tissue of patients
DME expression in the normal tissue of healthy individuals
|
|||||
| Violin Diagram of DME Disease-specific Protein Abundances |
|
Click to View the Clearer Original Diagram | |||
| ICD-11: BA80 | Coronary artery disease | Click to Show/Hide | |||
| The Studied Tissue | Peripheral blood | ||||
| The Specified Disease | Coronary artery disease [ICD-11:BA80-BA8Z] | ||||
| The Expression Level of Disease Section Compare with the Healthy Individual Tissue | p-value: 7.54E-01; Fold-change: 2.14E-02; Z-score: 8.50E-02 | ||||
|
DME expression in the diseased tissue of patients
DME expression in the normal tissue of healthy individuals
|
|||||
| Violin Diagram of DME Disease-specific Protein Abundances |
|
Click to View the Clearer Original Diagram | |||
| ICD-11: BB70 | Aortic valve stenosis | Click to Show/Hide | |||
| The Studied Tissue | Calcified aortic valve | ||||
| The Specified Disease | Aortic stenosis [ICD-11:BB70] | ||||
| The Expression Level of Disease Section Compare with the Healthy Individual Tissue | p-value: 9.73E-01; Fold-change: 2.55E-02; Z-score: 3.48E-02 | ||||
|
DME expression in the diseased tissue of patients
DME expression in the normal tissue of healthy individuals
|
|||||
| Violin Diagram of DME Disease-specific Protein Abundances |
|
Click to View the Clearer Original Diagram | |||
| ICD Disease Classification 12 | Respiratory system disease | Click to Show/Hide | |||
| ICD-11: 7A40 | Central sleep apnoea | Click to Show/Hide | |||
| The Studied Tissue | Hyperplastic tonsil | ||||
| The Specified Disease | Apnea [ICD-11:7A40] | ||||
| The Expression Level of Disease Section Compare with the Healthy Individual Tissue | p-value: 2.22E-02; Fold-change: -2.39E-01; Z-score: -1.22E+00 | ||||
|
DME expression in the diseased tissue of patients
DME expression in the normal tissue of healthy individuals
|
|||||
| Violin Diagram of DME Disease-specific Protein Abundances |
|
Click to View the Clearer Original Diagram | |||
| ICD-11: CA08 | Vasomotor or allergic rhinitis | Click to Show/Hide | |||
| The Studied Tissue | Peripheral blood | ||||
| The Specified Disease | Olive pollen allergy [ICD-11:CA08.00] | ||||
| The Expression Level of Disease Section Compare with the Healthy Individual Tissue | p-value: 4.87E-02; Fold-change: 2.08E-01; Z-score: 1.53E+00 | ||||
|
DME expression in the diseased tissue of patients
DME expression in the normal tissue of healthy individuals
|
|||||
| Violin Diagram of DME Disease-specific Protein Abundances |
|
Click to View the Clearer Original Diagram | |||
| ICD-11: CA0A | Chronic rhinosinusitis | Click to Show/Hide | |||
| The Studied Tissue | Sinus mucosa tissue | ||||
| The Specified Disease | Chronic rhinosinusitis [ICD-11:CA0A] | ||||
| The Expression Level of Disease Section Compare with the Healthy Individual Tissue | p-value: 2.90E-02; Fold-change: -5.08E-01; Z-score: -1.19E+00 | ||||
|
DME expression in the diseased tissue of patients
DME expression in the normal tissue of healthy individuals
|
|||||
| Violin Diagram of DME Disease-specific Protein Abundances |
|
Click to View the Clearer Original Diagram | |||
| ICD-11: CA22 | Chronic obstructive pulmonary disease | Click to Show/Hide | |||
| The Studied Tissue | Lung tissue | ||||
| The Specified Disease | Chronic obstructive pulmonary disease [ICD-11:CA22] | ||||
| The Expression Level of Disease Section Compare with the Healthy Individual Tissue | p-value: 4.70E-01; Fold-change: 2.63E-01; Z-score: 6.12E-01 | ||||
|
DME expression in the diseased tissue of patients
DME expression in the normal tissue of healthy individuals
|
|||||
| Violin Diagram of DME Disease-specific Protein Abundances |
|
Click to View the Clearer Original Diagram | |||
| The Studied Tissue | Small airway epithelium | ||||
| The Specified Disease | Chronic obstructive pulmonary disease [ICD-11:CA22] | ||||
| The Expression Level of Disease Section Compare with the Healthy Individual Tissue | p-value: 1.35E-03; Fold-change: -2.46E-01; Z-score: -5.85E-01 | ||||
|
DME expression in the diseased tissue of patients
DME expression in the normal tissue of healthy individuals
|
|||||
| Violin Diagram of DME Disease-specific Protein Abundances |
|
Click to View the Clearer Original Diagram | |||
| ICD-11: CA23 | Asthma | Click to Show/Hide | |||
| The Studied Tissue | Nasal and bronchial airway | ||||
| The Specified Disease | Asthma [ICD-11:CA23] | ||||
| The Expression Level of Disease Section Compare with the Healthy Individual Tissue | p-value: 1.41E-01; Fold-change: 3.13E-01; Z-score: 2.71E-01 | ||||
|
DME expression in the diseased tissue of patients
DME expression in the normal tissue of healthy individuals
|
|||||
| Violin Diagram of DME Disease-specific Protein Abundances |
|
Click to View the Clearer Original Diagram | |||
| ICD-11: CB03 | Idiopathic interstitial pneumonitis | Click to Show/Hide | |||
| The Studied Tissue | Lung tissue | ||||
| The Specified Disease | Idiopathic pulmonary fibrosis [ICD-11:CB03.4] | ||||
| The Expression Level of Disease Section Compare with the Healthy Individual Tissue | p-value: 1.23E-01; Fold-change: 2.71E-01; Z-score: 8.39E-01 | ||||
|
DME expression in the diseased tissue of patients
DME expression in the normal tissue of healthy individuals
|
|||||
| Violin Diagram of DME Disease-specific Protein Abundances |
|
Click to View the Clearer Original Diagram | |||
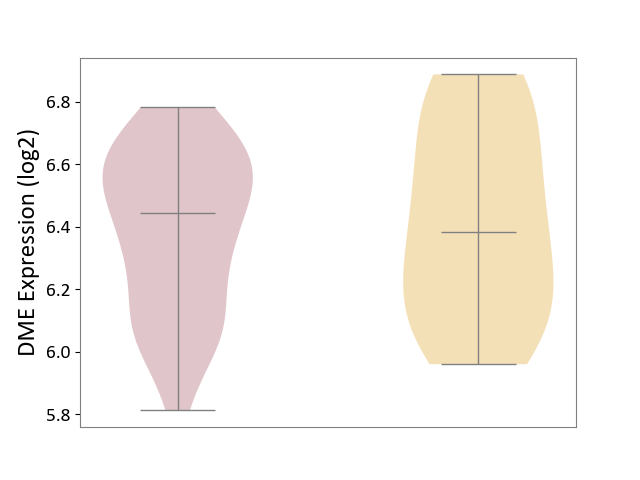
| ICD Disease Classification 13 | Digestive system disease | Click to Show/Hide | |||
| ICD-11: DA0C | Periodontal disease | Click to Show/Hide | |||
| The Studied Tissue | Gingival tissue | ||||
| The Specified Disease | Periodontal disease [ICD-11:DA0C] | ||||
| The Expression Level of Disease Section Compare with the Adjacent Tissue | p-value: 4.45E-03; Fold-change: 9.41E-02; Z-score: 2.61E-01 | ||||
|
DME expression in the diseased tissue of patients
DME expression in the normal tissue adjacent to the diseased tissue of patients
|
|||||
| Violin Diagram of DME Disease-specific Protein Abundances |
|
Click to View the Clearer Original Diagram | |||
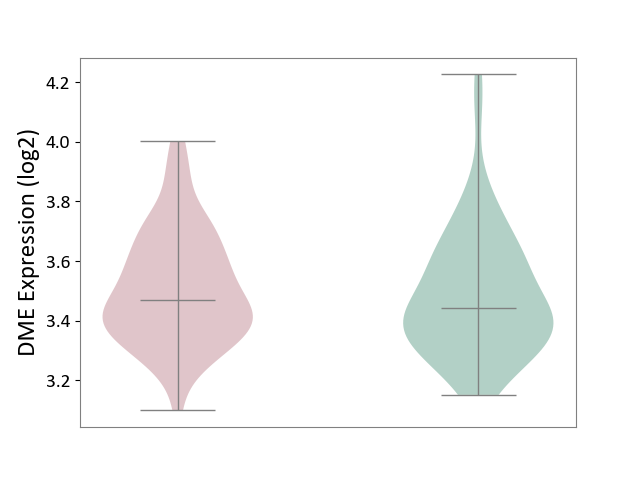
| ICD-11: DA42 | Gastritis | Click to Show/Hide | |||
| The Studied Tissue | Gastric antrum tissue | ||||
| The Specified Disease | Eosinophilic gastritis [ICD-11:DA42.2] | ||||
| The Expression Level of Disease Section Compare with the Adjacent Tissue | p-value: 9.54E-01; Fold-change: -1.49E-02; Z-score: -6.55E-02 | ||||
|
DME expression in the diseased tissue of patients
DME expression in the normal tissue adjacent to the diseased tissue of patients
|
|||||
| Violin Diagram of DME Disease-specific Protein Abundances |
|
Click to View the Clearer Original Diagram | |||
| ICD-11: DB92 | Non-alcoholic fatty liver disease | Click to Show/Hide | |||
| The Studied Tissue | Liver tissue | ||||
| The Specified Disease | Non-alcoholic fatty liver disease [ICD-11:DB92] | ||||
| The Expression Level of Disease Section Compare with the Healthy Individual Tissue | p-value: 1.76E-01; Fold-change: -3.41E-01; Z-score: -6.74E-01 | ||||
|
DME expression in the diseased tissue of patients
DME expression in the normal tissue of healthy individuals
|
|||||
| Violin Diagram of DME Disease-specific Protein Abundances |
|
Click to View the Clearer Original Diagram | |||
| ICD-11: DB99 | Hepatic failure | Click to Show/Hide | |||
| The Studied Tissue | Liver tissue | ||||
| The Specified Disease | Liver failure [ICD-11:DB99.7-DB99.8] | ||||
| The Expression Level of Disease Section Compare with the Healthy Individual Tissue | p-value: 2.37E-02; Fold-change: -1.33E+00; Z-score: -1.11E+00 | ||||
|
DME expression in the diseased tissue of patients
DME expression in the normal tissue of healthy individuals
|
|||||
| Violin Diagram of DME Disease-specific Protein Abundances |
|
Click to View the Clearer Original Diagram | |||
| ICD-11: DD71 | Ulcerative colitis | Click to Show/Hide | |||
| The Studied Tissue | Colon mucosal tissue | ||||
| The Specified Disease | Ulcerative colitis [ICD-11:DD71] | ||||
| The Expression Level of Disease Section Compare with the Adjacent Tissue | p-value: 7.77E-01; Fold-change: 6.19E-02; Z-score: 2.01E-01 | ||||
|
DME expression in the diseased tissue of patients
DME expression in tissue other than the diseased tissue of patients
|
|||||
| Violin Diagram of DME Disease-specific Protein Abundances |
|
Click to View the Clearer Original Diagram | |||
| ICD-11: DD91 | Irritable bowel syndrome | Click to Show/Hide | |||
| The Studied Tissue | Rectal colon tissue | ||||
| The Specified Disease | Irritable bowel syndrome [ICD-11:DD91.0] | ||||
| The Expression Level of Disease Section Compare with the Healthy Individual Tissue | p-value: 4.31E-01; Fold-change: 2.64E-02; Z-score: 1.27E-01 | ||||
|
DME expression in the diseased tissue of patients
DME expression in the normal tissue of healthy individuals
|
|||||
| Violin Diagram of DME Disease-specific Protein Abundances |
|
Click to View the Clearer Original Diagram | |||
| ICD Disease Classification 14 | Skin disease | Click to Show/Hide | |||
| ICD-11: EA80 | Atopic eczema | Click to Show/Hide | |||
| The Studied Tissue | Skin | ||||
| The Specified Disease | Atopic dermatitis [ICD-11:EA80] | ||||
| The Expression Level of Disease Section Compare with the Healthy Individual Tissue | p-value: 1.48E-01; Fold-change: 8.29E-02; Z-score: 9.03E-01 | ||||
|
DME expression in the diseased tissue of patients
DME expression in the normal tissue of healthy individuals
|
|||||
| Violin Diagram of DME Disease-specific Protein Abundances |
|
Click to View the Clearer Original Diagram | |||
| ICD-11: EA90 | Psoriasis | Click to Show/Hide | |||
| The Studied Tissue | Skin | ||||
| The Specified Disease | Psoriasis [ICD-11:EA90] | ||||
| The Expression Level of Disease Section Compare with the Healthy Individual Tissue | p-value: 2.19E-13; Fold-change: -3.40E-01; Z-score: -7.68E-01 | ||||
| The Expression Level of Disease Section Compare with the Adjacent Tissue | p-value: 9.69E-48; Fold-change: 1.12E+00; Z-score: 4.84E+00 | ||||
|
DME expression in the diseased tissue of patients
DME expression in the normal tissue adjacent to the diseased tissue of patients
DME expression in the normal tissue of healthy individuals
|
|||||
| Violin Diagram of DME Disease-specific Protein Abundances |
|
Click to View the Clearer Original Diagram | |||
| ICD-11: ED63 | Acquired hypomelanotic disorder | Click to Show/Hide | |||
| The Studied Tissue | Skin | ||||
| The Specified Disease | Vitiligo [ICD-11:ED63.0] | ||||
| The Expression Level of Disease Section Compare with the Healthy Individual Tissue | p-value: 6.56E-01; Fold-change: -1.48E-02; Z-score: -1.10E-01 | ||||
|
DME expression in the diseased tissue of patients
DME expression in the normal tissue of healthy individuals
|
|||||
| Violin Diagram of DME Disease-specific Protein Abundances |
|
Click to View the Clearer Original Diagram | |||
| ICD-11: ED70 | Alopecia or hair loss | Click to Show/Hide | |||
| The Studied Tissue | Skin from scalp | ||||
| The Specified Disease | Alopecia [ICD-11:ED70] | ||||
| The Expression Level of Disease Section Compare with the Healthy Individual Tissue | p-value: 3.91E-01; Fold-change: 1.03E-01; Z-score: 3.69E-01 | ||||
|
DME expression in the diseased tissue of patients
DME expression in the normal tissue of healthy individuals
|
|||||
| Violin Diagram of DME Disease-specific Protein Abundances |
|
Click to View the Clearer Original Diagram | |||
| ICD-11: EK0Z | Contact dermatitis | Click to Show/Hide | |||
| The Studied Tissue | Skin | ||||
| The Specified Disease | Sensitive skin [ICD-11:EK0Z] | ||||
| The Expression Level of Disease Section Compare with the Healthy Individual Tissue | p-value: 7.41E-01; Fold-change: 1.65E-02; Z-score: 8.11E-02 | ||||
|
DME expression in the diseased tissue of patients
DME expression in the normal tissue of healthy individuals
|
|||||
| Violin Diagram of DME Disease-specific Protein Abundances |
|
Click to View the Clearer Original Diagram | |||
| ICD Disease Classification 15 | Musculoskeletal system/connective tissue disease | Click to Show/Hide | |||
| ICD-11: FA00 | Osteoarthritis | Click to Show/Hide | |||
| The Studied Tissue | Peripheral blood | ||||
| The Specified Disease | Arthropathy [ICD-11:FA00-FA5Z] | ||||
| The Expression Level of Disease Section Compare with the Healthy Individual Tissue | p-value: 6.07E-01; Fold-change: -1.87E-02; Z-score: -1.29E-01 | ||||
|
DME expression in the diseased tissue of patients
DME expression in the normal tissue of healthy individuals
|
|||||
| Violin Diagram of DME Disease-specific Protein Abundances |
|
Click to View the Clearer Original Diagram | |||
| The Studied Tissue | Synovial tissue | ||||
| The Specified Disease | Osteoarthritis [ICD-11:FA00-FA0Z] | ||||
| The Expression Level of Disease Section Compare with the Healthy Individual Tissue | p-value: 6.41E-01; Fold-change: 1.23E-02; Z-score: 5.46E-02 | ||||
|
DME expression in the diseased tissue of patients
DME expression in the normal tissue of healthy individuals
|
|||||
| Violin Diagram of DME Disease-specific Protein Abundances |
|
Click to View the Clearer Original Diagram | |||
| ICD-11: FA20 | Rheumatoid arthritis | Click to Show/Hide | |||
| The Studied Tissue | Peripheral blood | ||||
| The Specified Disease | Childhood onset rheumatic disease [ICD-11:FA20.Z] | ||||
| The Expression Level of Disease Section Compare with the Healthy Individual Tissue | p-value: 6.22E-01; Fold-change: 1.37E-01; Z-score: 3.71E-01 | ||||
|
DME expression in the diseased tissue of patients
DME expression in the normal tissue of healthy individuals
|
|||||
| Violin Diagram of DME Disease-specific Protein Abundances |
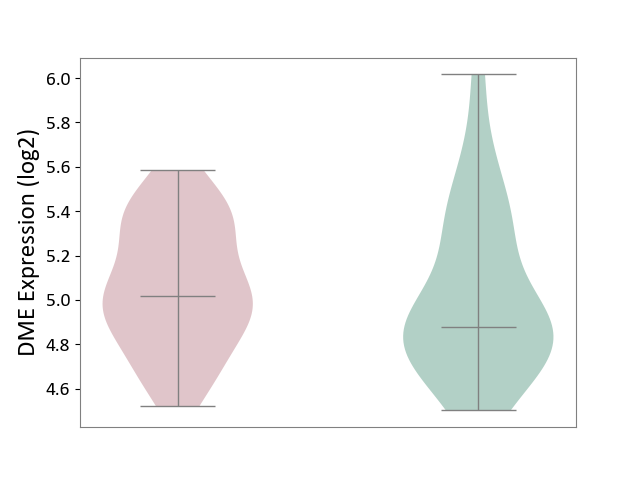
|
Click to View the Clearer Original Diagram | |||
| The Studied Tissue | Synovial tissue | ||||
| The Specified Disease | Rheumatoid arthritis [ICD-11:FA20] | ||||
| The Expression Level of Disease Section Compare with the Healthy Individual Tissue | p-value: 2.32E-02; Fold-change: -5.21E-01; Z-score: -1.72E+00 | ||||
|
DME expression in the diseased tissue of patients
DME expression in the normal tissue of healthy individuals
|
|||||
| Violin Diagram of DME Disease-specific Protein Abundances |
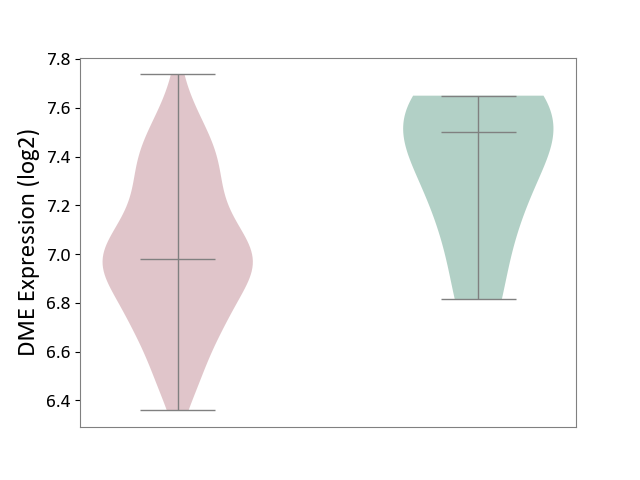
|
Click to View the Clearer Original Diagram | |||
| ICD-11: FA24 | Juvenile idiopathic arthritis | Click to Show/Hide | |||
| The Studied Tissue | Peripheral blood | ||||
| The Specified Disease | Juvenile idiopathic arthritis [ICD-11:FA24] | ||||
| The Expression Level of Disease Section Compare with the Healthy Individual Tissue | p-value: 9.70E-03; Fold-change: 6.62E-03; Z-score: 3.43E-02 | ||||
|
DME expression in the diseased tissue of patients
DME expression in the normal tissue of healthy individuals
|
|||||
| Violin Diagram of DME Disease-specific Protein Abundances |
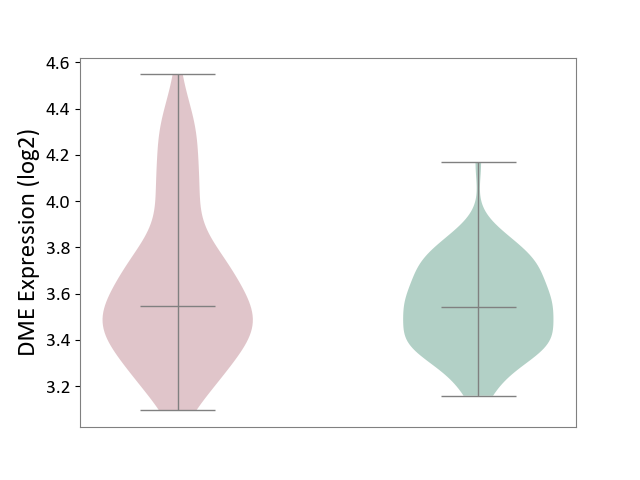
|
Click to View the Clearer Original Diagram | |||
| ICD-11: FA92 | Inflammatory spondyloarthritis | Click to Show/Hide | |||
| The Studied Tissue | Pheripheral blood | ||||
| The Specified Disease | Ankylosing spondylitis [ICD-11:FA92.0Z] | ||||
| The Expression Level of Disease Section Compare with the Healthy Individual Tissue | p-value: 9.39E-01; Fold-change: 4.37E-02; Z-score: 3.39E-01 | ||||
|
DME expression in the diseased tissue of patients
DME expression in the normal tissue of healthy individuals
|
|||||
| Violin Diagram of DME Disease-specific Protein Abundances |
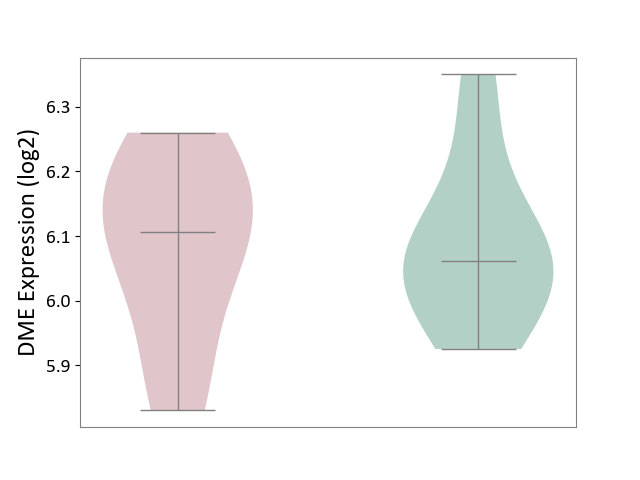
|
Click to View the Clearer Original Diagram | |||
| ICD-11: FB83 | Low bone mass disorder | Click to Show/Hide | |||
| The Studied Tissue | Bone marrow | ||||
| The Specified Disease | Osteoporosis [ICD-11:FB83.1] | ||||
| The Expression Level of Disease Section Compare with the Healthy Individual Tissue | p-value: 2.47E-03; Fold-change: 3.88E-01; Z-score: 3.09E+00 | ||||
|
DME expression in the diseased tissue of patients
DME expression in the normal tissue of healthy individuals
|
|||||
| Violin Diagram of DME Disease-specific Protein Abundances |
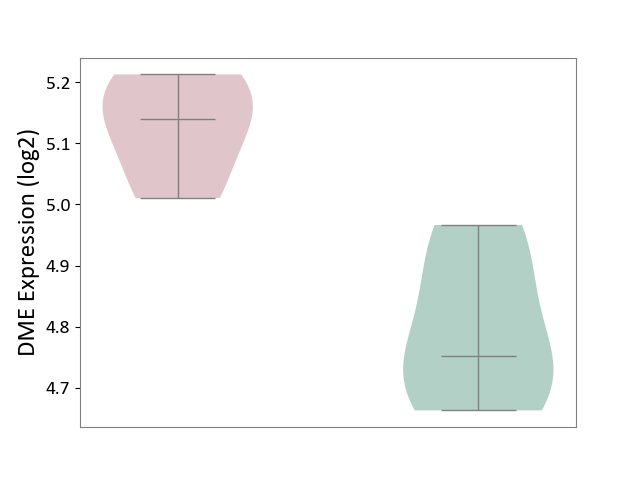
|
Click to View the Clearer Original Diagram | |||
| ICD Disease Classification 16 | Genitourinary system disease | Click to Show/Hide | |||
| ICD-11: GA10 | Endometriosis | Click to Show/Hide | |||
| The Studied Tissue | Endometrium tissue | ||||
| The Specified Disease | Endometriosis [ICD-11:GA10] | ||||
| The Expression Level of Disease Section Compare with the Healthy Individual Tissue | p-value: 1.99E-02; Fold-change: 1.17E-01; Z-score: 5.72E-01 | ||||
|
DME expression in the diseased tissue of patients
DME expression in the normal tissue of healthy individuals
|
|||||
| Violin Diagram of DME Disease-specific Protein Abundances |
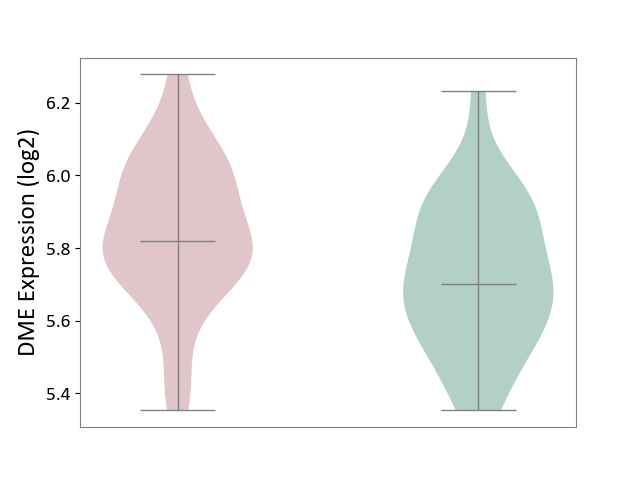
|
Click to View the Clearer Original Diagram | |||
| ICD-11: GC00 | Cystitis | Click to Show/Hide | |||
| The Studied Tissue | Bladder tissue | ||||
| The Specified Disease | Interstitial cystitis [ICD-11:GC00.3] | ||||
| The Expression Level of Disease Section Compare with the Healthy Individual Tissue | p-value: 2.24E-01; Fold-change: 1.21E-01; Z-score: 8.15E-01 | ||||
|
DME expression in the diseased tissue of patients
DME expression in the normal tissue of healthy individuals
|
|||||
| Violin Diagram of DME Disease-specific Protein Abundances |
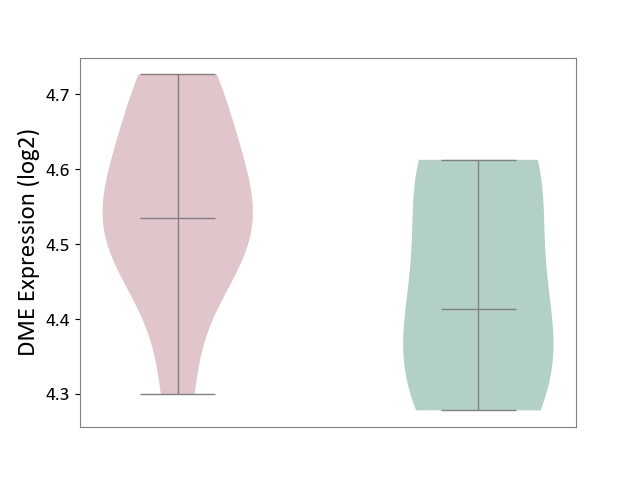
|
Click to View the Clearer Original Diagram | |||
| ICD Disease Classification 19 | Condition originating in perinatal period | Click to Show/Hide | |||
| ICD-11: KA21 | Short gestation disorder | Click to Show/Hide | |||
| The Studied Tissue | Myometrium | ||||
| The Specified Disease | Preterm birth [ICD-11:KA21.4Z] | ||||
| The Expression Level of Disease Section Compare with the Healthy Individual Tissue | p-value: 9.54E-01; Fold-change: 2.76E-02; Z-score: 3.03E-01 | ||||
|
DME expression in the diseased tissue of patients
DME expression in the normal tissue of healthy individuals
|
|||||
| Violin Diagram of DME Disease-specific Protein Abundances |
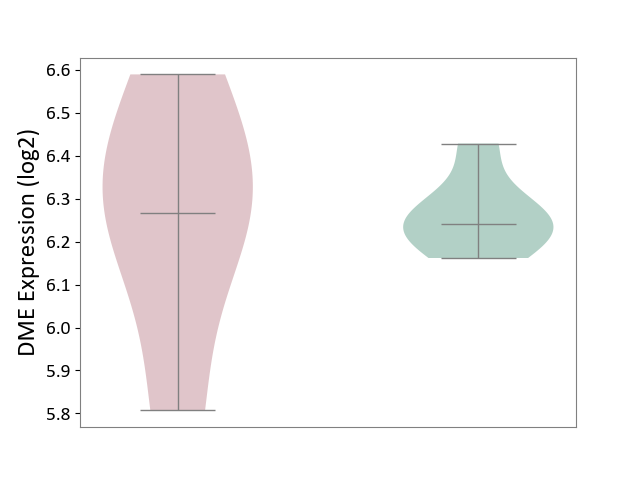
|
Click to View the Clearer Original Diagram | |||
| ICD Disease Classification 20 | Developmental anomaly | Click to Show/Hide | |||
| ICD-11: LD2C | Overgrowth syndrome | Click to Show/Hide | |||
| The Studied Tissue | Adipose tissue | ||||
| The Specified Disease | Simpson golabi behmel syndrome [ICD-11:LD2C] | ||||
| The Expression Level of Disease Section Compare with the Healthy Individual Tissue | p-value: 9.63E-01; Fold-change: -5.44E-02; Z-score: -5.89E-01 | ||||
|
DME expression in the diseased tissue of patients
DME expression in the normal tissue of healthy individuals
|
|||||
| Violin Diagram of DME Disease-specific Protein Abundances |
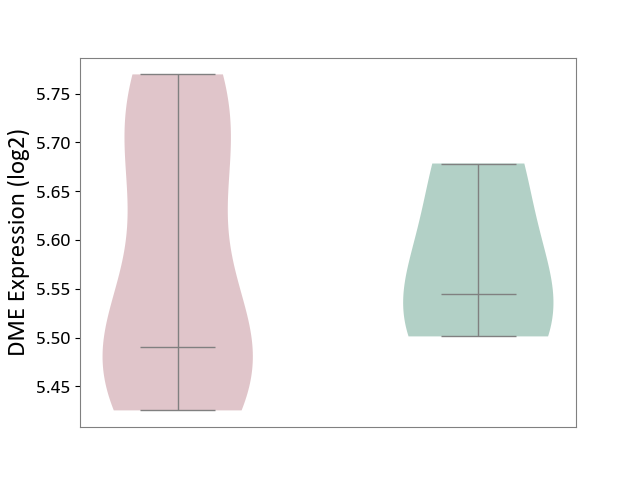
|
Click to View the Clearer Original Diagram | |||
| ICD-11: LD2D | Phakomatoses/hamartoneoplastic syndrome | Click to Show/Hide | |||
| The Studied Tissue | Perituberal tissue | ||||
| The Specified Disease | Tuberous sclerosis complex [ICD-11:LD2D.2] | ||||
| The Expression Level of Disease Section Compare with the Healthy Individual Tissue | p-value: 7.54E-02; Fold-change: 1.22E-01; Z-score: 1.17E+00 | ||||
|
DME expression in the diseased tissue of patients
DME expression in the normal tissue of healthy individuals
|
|||||
| Violin Diagram of DME Disease-specific Protein Abundances |
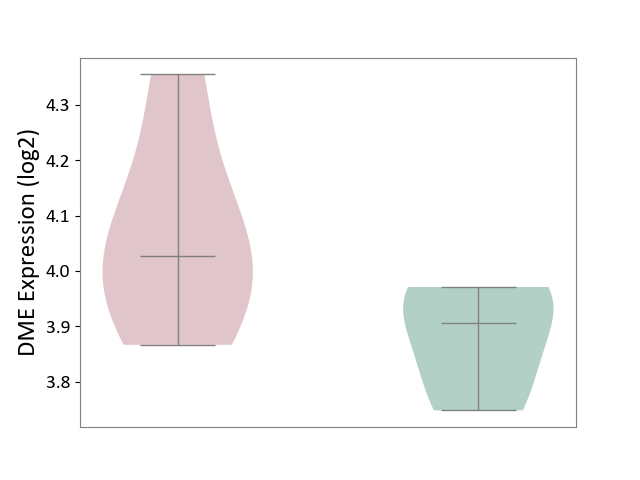
|
Click to View the Clearer Original Diagram | |||
| References | |||||
|---|---|---|---|---|---|
| 1 | Metabolism of thalidomide in human microsomes, cloned human cytochrome P-450 isozymes, and Hansen's disease patients. J Biochem Mol Toxicol. 2000;14(3):140-7. | ||||
| 2 | Genotoxicity of tamoxifen, tamoxifen epoxide and toremifene in human lymphoblastoid cells containing human cytochrome P450s. Carcinogenesis. 1994 Jan;15(1):5-9. | ||||
| 3 | CYP2A6- and CYP2A13-catalyzed metabolism of the nicotine delta-5'(1')iminium ion. J Pharmacol Exp Ther. 2012 Nov;343(2):307-15. | ||||
| 4 | Apremilast (Otezla): a new oral treatment for adults with psoriasis and psoriatic arthritis. P T. 2015 Aug;40(8):495-500. | ||||
| 5 | Health control over the feeding of troops on the Western and 3d Belorussian Fronts during the Great Patriotic War years. Voen Med Zh. 1975 Jun;(6):86-8. | ||||
| 6 | Substrates, inducers, inhibitors and structure-activity relationships of human Cytochrome P450 2C9 and implications in drug development. Curr Med Chem. 2009;16(27):3480-675. | ||||
| 7 | Summary of information on human CYP enzymes: human P450 metabolism data. Drug Metab Rev. 2002 Feb-May;34(1-2):83-448. | ||||
| 8 | The role of human cytochrome P450 enzymes in the formation of 2-hydroxymetronidazole: CYP2A6 is the high affinity (low Km) catalyst. Drug Metab Dispos. 2013 Sep;41(9):1686-94. | ||||
| 9 | Measurement of 4-hydroxylation of ifosfamide in human liver microsomes using the estimation of free and protein-bound acrolein and codetermination of keto- and carboxyifosfamide. J Cancer Res Clin Oncol. 2002 Jul;128(7):385-92. | ||||
| 10 | Psychotropic drug interactions with valproate. Clin Neuropharmacol. 2005 Mar-Apr;28(2):96-101. | ||||
| 11 | Halothane-dependent lipid peroxidation in human liver microsomes is catalyzed by cytochrome P4502A6 (CYP2A6). Anesthesiology. 2001 Aug;95(2):509-14. | ||||
| 12 | Identification of the cytochrome P450 enzymes involved in the metabolism of cisapride: in vitro studies of potential co-medication interactions. Br J Pharmacol. 2000 Apr;129(8):1655-67. | ||||
| 13 | Identification of human cytochrome P450 and flavin-containing monooxygenase enzymes involved in the metabolism of lorcaserin, a novel selective human 5-hydroxytryptamine 2C agonist. Drug Metab Dispos. 2012 Apr;40(4):761-71. | ||||
| 14 | Drug Interactions Flockhart Table | ||||
| 15 | Pharmacokinetics, metabolism, and excretion of (14)C-labeled belinostat in patients with recurrent or progressive malignancies | ||||
| 16 | FDA label of Cenobamate. The 2020 official website of the U.S. Food and Drug Administration. | ||||
| 17 | Development of a substrate-activity based approach to identify the major human liver P-450 catalysts of cyclophosphamide and ifosfamide activation based on cDNA-expressed activities and liver microsomal P-450 profiles. Drug Metab Dispos. 1999 Jun;27(6):655-66. | ||||
| 18 | Impact of CYP2A6 gene polymorphism on the pharmacokinetics of dexmedetomidine for premedication. Expert Rev Clin Pharmacol. 2018 Sep;11(9):917-922. | ||||
| 19 | Biotransformation of Efavirenz and Proteomic Analysis of Cytochrome P450s and UDP-Glucuronosyltransferases in Mouse, Macaque, and Human Brain-Derived In Vitro Systems. Drug Metab Dispos. 2023 Apr;51(4):521-531. doi: 10.1124/dmd.122.001195. | ||||
| 20 | Is 1-aminobenzotriazole an appropriate in vitro tool as a nonspecific cytochrome P450 inactivator? Drug Metab Dispos. 2009 Jan;37(1):10-3. | ||||
| 21 | Azelastine N-demethylation by cytochrome P-450 (CYP)3A4, CYP2D6, and CYP1A2 in human liver microsomes: evaluation of approach to predict the contribution of multiple CYPs. Drug Metab Dispos. 1999 Dec;27(12):1381-91. | ||||
| 22 | Characterization of human cytochrome P450s involved in the bioactivation of clozapine. Drug Metab Dispos. 2013 Mar;41(3):651-8. | ||||
| 23 | Evidence for the involvement of N-methylthiourea, a ring cleavage metabolite, in the hepatotoxicity of methimazole in glutathione-depleted mice: structure-toxicity and metabolic studies | ||||
| 24 | Role of CYP2A6 in Methimazole Bioactivation and Hepatotoxicity | ||||
| 25 | Possible involvement of multiple human cytochrome P450 isoforms in the liver metabolism of propofol. Br J Anaesth. 1998 Jun;80(6):788-95. | ||||
| 26 | Identification of the cytochrome P450 and other enzymes involved in the in vitro oxidative metabolism of a novel antidepressant, Lu AA21004. Drug Metab Dispos. 2012 Jul;40(7):1357-65. | ||||
| 27 | Metabolic interactions between acetaminophen (paracetamol) and two flavonoids, luteolin and quercetin, through in-vitro inhibition studies. J Pharm Pharmacol. 2017 Dec;69(12):1762-1772. | ||||
| 28 | Clinical pharmacokinetics and pharmacodynamics of dapagliflozin, a selective inhibitor of sodium-glucose co-transporter type 2. Clin Pharmacokinet. 2014 Jan;53(1):17-27. | ||||
| 29 | Metabolic activation of deferiprone mediated by CYP2A6 Xenobiotica. 2021 Nov;51(11):1282-1291. doi: 10.1080/00498254.2021.1931729. | ||||
| 30 | Roles of cytochromes P450 1A2, 2A6, and 2C8 in 5-fluorouracil formation from tegafur, an anticancer prodrug, in human liver microsomes. Drug Metab Dispos. 2000 Dec;28(12):1457-63. | ||||
| 31 | The impact of individual human cytochrome P450 enzymes on oxidative metabolism of anticancer drug lenvatinib | ||||
| 32 | N-demethylation of levo-alpha-acetylmethadol by human placental aromatase. Biochem Pharmacol. 2004 Mar 1;67(5):885-92. | ||||
| 33 | Timolol metabolism in human liver microsomes is mediated principally by CYP2D6. Drug Metab Dispos. 2007 Jul;35(7):1135-41. | ||||
| 34 | A comparison of the expression and metabolizing activities of phase I and II enzymes in freshly isolated human lung parenchymal cells and cryopreserved human hepatocytes. Drug Metab Dispos. 2007 Oct;35(10):1797-805. | ||||
| 35 | Drug Interactions with Angiotensin Receptor Blockers: Role of Human Cytochromes P450 | ||||
| 36 | Lithium Intoxication in the Elderly: A Possible Interaction between Azilsartan, Fluvoxamine, and Lithium | ||||
| 37 | Oxidative metabolism of flunarizine and cinnarizine by microsomes from B-lymphoblastoid cell lines expressing human cytochrome P450 enzymes. Biol Pharm Bull. 1996 Nov;19(11):1511-4. | ||||
| 38 | Moxidectin and the avermectins: Consanguinity but not identity | ||||
| 39 | Physiologically Based Pharmacokinetic Modeling of Transdermal Selegiline and Its Metabolites for the Evaluation of Disposition Differences between Healthy and Special Populations | ||||
| 40 | Variation in CYP2A6 activity and personalized medicine. J Pers Med. 2017 Dec 1;7(4). pii: E18. | ||||
| 41 | High prevalence of CYP2A6*4 and CYP2A6*9 alleles detected among a Malaysian population | ||||
| 42 | Prediction of human liver microsomal oxidations of 7-ethoxycoumarin and chlorzoxazone with kinetic parameters of recombinant cytochrome P-450 enzymes. Drug Metab Dispos. 1999 Nov;27(11):1274-80. | ||||
| 43 | Dorzolamide. A review of its pharmacology and therapeutic potential in the management of glaucoma and ocular hypertension | ||||
| 44 | In vitro metabolism of dorzolamide, a novel potent carbonic anhydrase inhibitor, in rat liver microsomes. Drug Metab Dispos. 1994 Nov-Dec;22(6):916-21. | ||||
| 45 | Letrozole concentration is associated with CYP2A6 variation but not with arthralgia in patients with breast cancer. Breast Cancer Res Treat. 2018 Nov;172(2):371-379. | ||||
| 46 | Metabolism of Meloxicam in human liver involves cytochromes P4502C9 and 3A4. Xenobiotica. 1998 Jan;28(1):1-13. | ||||
| 47 | Metabolism of (+)- and (-)-menthols by CYP2A6 in human liver microsomes | ||||
| 48 | Involvement of CYP2A6 in the formation of a novel metabolite, 3-hydroxypilocarpine, from pilocarpine in human liver microsomes | ||||
| 49 | Human kidney methoxyflurane and sevoflurane metabolism. Intrarenal fluoride production as a possible mechanism of methoxyflurane nephrotoxicity. Anesthesiology. 1995 Mar;82(3):689-99. | ||||
| 50 | Structure, function, regulation and polymorphism of human cytochrome P450 2A6. Curr Drug Metab. 2009 Sep;10(7):754-80. | ||||
| 51 | CYP2A6: a human coumarin 7-hydroxylase | ||||
| 52 | Identification of the human cytochrome P450 enzymes involved in the in vitro metabolism of artemisinin. Br J Clin Pharmacol. 1999 Oct;48(4):528-35. | ||||
| 53 | UFT Capsules (uracil-tegafur). | ||||
| 54 | Activation of phenacetin O-deethylase activity by alpha-naphthoflavone in human liver microsomes. Xenobiotica. 1999 Sep;29(9):885-98. | ||||
| 55 | CYP3A4 is the major CYP isoform mediating the in vitro hydroxylation and demethylation of flunitrazepam. Drug Metab Dispos. 2001 Feb;29(2):133-40. | ||||
| 56 | The metabolism of the piperazine-type phenothiazine neuroleptic perazine by the human cytochrome P-450 isoenzymes. Eur Neuropsychopharmacol. 2004 May;14(3):199-208. | ||||
| 57 | Rapid development of S-1 in the west for therapy of advanced gastric carcinoma. Gan To Kagaku Ryoho. 2006 Jun;33 Suppl 1:117-20. | ||||
| 58 | Metabolism, Excretion, and Pharmacokinetics of Selumetinib, an MEK1/2 inhibitor, in Healthy Adult Male Subjects | ||||
| 59 | Australian Public Assessment Report for asunaprevir. | ||||
| 60 | In vitro characterization of the human biotransformation pathways of aplidine, a novel marine anti-cancer drug. Invest New Drugs. 2007 Feb;25(1):9-19. | ||||
| 61 | Cytochrome P450 CYP1B1 interacts with 8-methoxypsoralen (8-MOP) and influences psoralen-ultraviolet A (PUVA) sensitivity. PLoS One. 2013 Sep 23;8(9):e75494. | ||||
| 62 | Disposition and metabolism of semagacestat, a {gamma}-secretase inhibitor, in humans. Drug Metab Dispos. 2010 Apr;38(4):554-65. | ||||
| 63 | In vitro metabolism of (-)-camphor using human liver microsomes and CYP2A6. Biol Pharm Bull. 2007 Feb;30(2):230-3. | ||||
| 64 | In vitro characterization of sarizotan metabolism: hepatic clearance, identification and characterization of metabolites, drug-metabolizing enzyme identification, and evaluation of cytochrome p450 inhibition. Drug Metab Dispos. 2010 Jun;38(6):905-16. | ||||
| 65 | Cytochrome P450 enzymes involved in the metabolic pathway of the histamine 2 (H2)-receptor antagonist roxatidine acetate by human liver microsomes. Arzneimittelforschung. 2001;51(8):651-8. | ||||
| 66 | Metabolism and transport of oxazaphosphorines and the clinical implications Drug Metab Rev. 2005;37(4):611-703. doi: 10.1080/03602530500364023. | ||||
| 67 | Identification of human cytochrome P(450)s that metabolise anti-parasitic drugs and predictions of in vivo drug hepatic clearance from in vitro data. Eur J Clin Pharmacol. 2003 Sep;59(5-6):429-42. | ||||
| 68 | In vitro metabolism of 17-(dimethylaminoethylamino)-17-demethoxygeldanamycin in human liver microsomes | ||||
| 69 | Inactivation of cytochrome P450 (P450) 3A4 but not P450 3A5 by OSI-930, a thiophene-containing anticancer drug | ||||
| 70 | A new deleted allele in the human cytochrome P450 2A6 (CYP2A6) gene found in individuals showing poor metabolic capacity to coumarin and (+)-cis-3,5-dimethyl-2-(3-pyridyl)thiazolidin-4-one hydrochloride (SM-12502) | ||||
| 71 | Identification of the cytochromes P450 that catalyze coumarin 3,4-epoxidation and 3-hydroxylation | ||||
| 72 | Species differences and interindividual variation in liver microsomal cytochrome P450 2A enzymes: effects on coumarin, dicumarol, and testosterone oxidation | ||||
| 73 | Site-specific oxidation of flavanone and flavone by cytochrome P450 2A6 in human liver microsomes. Xenobiotica. 2019 Jul;49(7):791-802. | ||||
| 74 | Urinary metabolites of dibutyl phthalate and benzophenone-3 are potential chemical risk factors of chronic kidney function markers among healthy women | ||||
| 75 | Interindividual variability in nicotine metabolism: C-oxidation and glucuronidation | ||||
| 76 | Identification of the human hepatic cytochromes P450 involved in the in vitro oxidation of antipyrine. Drug Metab Dispos. 1996 Apr;24(4):487-94. | ||||
| 77 | The participation of human hepatic P450 isoforms, flavin-containing monooxygenases and aldehyde oxidase in the biotransformation of the insecticide fenthion. Toxicol Appl Pharmacol. 2008 Dec 1;233(2):343-52. | ||||
| 78 | Roles of human CYP2A6 and 2B6 and rat CYP2C11 and 2B1 in the 10-hydroxylation of (-)-verbenone by liver microsomes. Drug Metab Dispos. 2003 Aug;31(8):1049-53. | ||||
| 79 | Stability of the nicotine metabolite ratio in ad libitum and reducing smokers. Cancer Epidemiol Biomarkers Prev. 2008 Jun;17(6):1396-400. | ||||
| 80 | Acetaminophen, via its reactive metabolite N-acetyl-p-benzo-quinoneimine and transient receptor potential ankyrin-1 stimulation, causes neurogenic inflammation in the airways and other tissues in rodents FASEB J. 2010 Dec;24(12):4904-16. doi: 10.1096/fj.10-162438. | ||||
| 81 | Rapid detection and quantification of paracetamol and its major metabolites using surface enhanced Raman scattering. Analyst. 2023 Apr 11;148(8):1805-1814. doi: 10.1039/d3an00249g. | ||||
| 82 | Disposition, metabolism and mass balance of [(14)C]apremilast following oral administration. Xenobiotica. 2011 Dec;41(12):1063-75. | ||||
| 83 | A cytochrome P450 class I electron transfer system from Novosphingobium aromaticivorans. Appl Microbiol Biotechnol. 2010 Mar;86(1):163-75. | ||||
| 84 | DrugBank(Pharmacology-Metabolism)BRN-1907611 | ||||
| 85 | DrugBank : Cinnarizine | ||||
| 86 | Physiologically based modeling of lisofylline pharmacokinetics following intravenous administration in mice. Eur J Drug Metab Pharmacokinet. 2016 Aug;41(4):403-12. | ||||
| 87 | In vitro characterization and pharmacokinetics of dapagliflozin (BMS-512148), a potent sodium-glucose cotransporter type II inhibitor, in animals and humans Drug Metab Dispos. 2010 Mar;38(3):405-14. doi: 10.1124/dmd.109.029165. | ||||
| 88 | Analytical method development for the simultaneous quantitation of dexmedetomidine and three potential metabolites in plasma J Chromatogr A. 1997 Feb 21;762(1-2):281-91. doi: 10.1016/s0021-9673(96)00965-x. | ||||
| 89 | Mass balance and metabolism of [(3)H]Formoterol in healthy men after combined i.v. and oral administration-mimicking inhalation Drug Metab Dispos. 1999 Oct;27(10):1104-16. | ||||
| 90 | FDA Approved Drug Products: Perforomist? inhalation solution | ||||
| 91 | Cytochromes P450: a structure-based summary of biotransformations using representative substrates Drug Metab Rev. 2008;40(1):1-100. doi: 10.1080/03602530802309742. | ||||
| 92 | The KEGG resource for deciphering the genome | ||||
| 93 | Inhibition of drug metabolizing cytochrome P450s by the aromatase inhibitor drug letrozole and its major oxidative metabolite 4,4'-methanol-bisbenzonitrile in vitro. Cancer Chemother Pharmacol. 2009 Oct;64(5):867-75. | ||||
| 94 | A prospective longitudinal study of growth in twin gestations compared with growth in singleton pregnancies. I. The fetal head J Ultrasound Med. 1991 Aug;10(8):439-43. doi: 10.7863/jum.1991.10.8.439. | ||||
| 95 | Disposition and metabolism of metronidazole in patients with liver failure | ||||
| 96 | Metronidazole Metabolism in Neonates and the Interplay Between Ontogeny and Genetic Variation | ||||
| 97 | Metronidazole: an update on metabolism, structure-cytotoxicity and resistance mechanisms | ||||
| 98 | In vitro metabolism of montelukast by cytochrome P450s and UDP-glucuronosyltransferases. Drug Metab Dispos. 2015 Dec;43(12):1905-16. | ||||
| 99 | NORMAN Suspect List Exchange:Levomenthol | ||||
| 100 | Pharmacogenomics knowledge for personalized medicine Clin Pharmacol Ther. 2012 Oct;92(4):414-7. doi: 10.1038/clpt.2012.96. | ||||
| 101 | U. S. FDA Label -Nicotine | ||||
| 102 | Oxidative bioactivation of nitrofurantoin in rat liver microsomes Xenobiotica. 2017 Feb;47(2):103-111. doi: 10.3109/00498254.2016.1164913. | ||||
| 103 | DrugBank(Pharmacology-Metabolism)Phenacetin | ||||
| 104 | (+)-cis-3,5-dimethyl-2-(3-pyridyl) thiazolidin-4-one hydrochloride (SM-12502) as a novel substrate for cytochrome P450 2A6 in human liver microsomes | ||||
| 105 | S-oxidation of (+)-cis-3,5-dimethyl-2-(3-pyridyl)-thiazolidin-4-one hydrochloride by rat hepatic flavin-containing monooxygenase 1 expressed in yeast | ||||
| 106 | In vitro metabolism of irosustat, a novel steroid sulfatase inhibitor: interspecies comparison, metabolite identification, and metabolic enzyme identification | ||||
| 107 | DrugBank(Pharmacology-Metabolism):Tegafur-uracil | ||||
| 108 | Comparative pharmacology of oral fluoropyrimidines: a focus on pharmacokinetics, pharmacodynamics and pharmacomodulation | ||||
| 109 | Identification of human cytochrome P450s involved in the formation of all-trans-retinoic acid principal metabolites. Mol Pharmacol. 2000 Dec;58(6):1341-8. | ||||
| 110 | Retinoic acid metabolism and mechanism of action: a review | ||||
| 111 | Human cytochrome P450s involved in the metabolism of 9-cis- and 13-cis-retinoic acids | ||||
| 112 | Assessments of CYP?inhibition?based drug-drug interaction between vonoprazan and poziotinib in?vitro and in?vivo | ||||
| 113 | In vitro metabolism of TAK-438, vonoprazan fumarate, a novel potassium-competitive acid blocker. Xenobiotica. 2017 Dec;47(12):1027-1034. | ||||
| 114 | Vonoprazan fumarate, a novel potassium-competitive acid blocker, in the management of gastroesophageal reflux disease: safety and clinical evidence to date | ||||
| 115 | Vortioxetine: clinical pharmacokinetics and drug interactions. Clin Pharmacokinet. 2018 Jun;57(6):673-686. | ||||
| 116 | BioTransformer: a comprehensive computational tool for small molecule metabolism prediction and metabolite identification | ||||
If you find any error in data or bug in web service, please kindly report it to Dr. Yin and Dr. Li.