

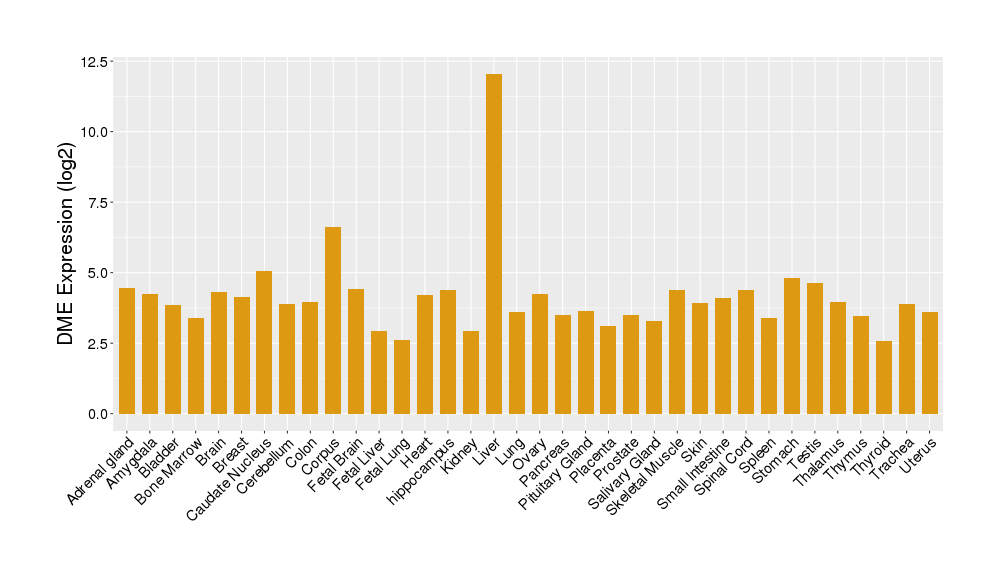
Details of Drug-Metabolizing Enzyme (DME)
| Full List of Drug(s) Metabolized by This DME | |||||
|---|---|---|---|---|---|
| Drugs Approved by FDA | Click to Show/Hide the Full List of Drugs: 82 Drugs | ||||
Thalidomide |
Drug Info | Approved | Breast cancer | ICD11: 2C60 | [1] |
Bupropion |
Drug Info | Approved | Nicotine dependence | ICD11: 6C4A | [2] |
Tamoxifen citrate |
Drug Info | Approved | Breast cancer | ICD11: 2C60 | [3] |
Yn-968D1 |
Drug Info | Approved | Breast cancer | ICD11: 2C60-2C6Y | [4] |
Estrone |
Drug Info | Approved | Menopausal disorder | ICD11: GA30 | [5] |
Nicotine |
Drug Info | Approved | Nicotine dependence | ICD11: 6C4A | [6] |
Fospropofol disodium |
Drug Info | Approved | Monitored anaesthesia care | ICD11: N.A. | [7] |
Almogran |
Drug Info | Approved | Migraine | ICD11: 8A80 | [8] |
Almogran |
Drug Info | Approved | Migraine | ICD11: 8A80 | [9] |
Cannabidiol |
Drug Info | Approved | Lennox-Gastaut syndrome | ICD11: 8A62 | [10] |
Capsaicin |
Drug Info | Approved | Herpes zoster | ICD11: 1E91 | [11] |
Ifosfamide |
Drug Info | Approved | Lung cancer | ICD11: 2C25 | [12] |
Almotriptan malate |
Drug Info | Approved | Migraine | ICD11: 8A80 | [13] |
Disulfiram |
Drug Info | Approved | Alcohol dependence | ICD11: 6C40 | [14] |
Isoniazid |
Drug Info | Approved | Pulmonary tuberculosis | ICD11: 1B10 | [15] |
Trabectedin |
Drug Info | Approved | Leiomyosarcoma | ICD11: 2B58 | [16] |
Fluvoxamine maleate |
Drug Info | Approved | Obsessive-compulsive disorder | ICD11: 6B20 | [17] |
Halothane |
Drug Info | Approved | Anaesthesia | ICD11: 8E22 | [18] |
Caffeine |
Drug Info | Approved | Orthostatic hypotension | ICD11: BA21 | [19] |
Carvedilol |
Drug Info | Approved | Congestive heart failure | ICD11: BD10 | [20] |
Lorcaserin |
Drug Info | Approved | Obesity | ICD11: 5B81 | [21] |
Ondansetron |
Drug Info | Approved | Gastritis | ICD11: DA42 | [22] |
Verapamil hydrochloride |
Drug Info | Approved | Essential hypertension | ICD11: BA00 | [23] |
Amitriptyline hydrochloride |
Drug Info | Approved | Depression | ICD11: 6A71 | [24] |
Cenobamate |
Drug Info | Approved | Focal seizure | ICD11: 8A68 | [25] |
Dexmedetomidine hydrochloride |
Drug Info | Approved | Tension headache | ICD11: 8A81 | [26] |
Felbamate |
Drug Info | Approved | Epilepsy | ICD11: 8A60 | [23] |
Fluoxetine hydrochloride |
Drug Info | Approved | Depression | ICD11: 6A71 | [17] |
Phenytoin |
Drug Info | Approved | Epilepsy | ICD11: 8A60 | [27] |
Quinidine |
Drug Info | Approved | Ventricular tachyarrhythmia | ICD11: BC71 | [28] |
Citalopram hydrobromide |
Drug Info | Approved | Depression | ICD11: 6A71 | [17] |
Eszopiclone |
Drug Info | Approved | Insomnia | ICD11: 7A00 | [29] |
Ethosuximide |
Drug Info | Approved | Epilepsy | ICD11: 8A60 | [30] |
Fingolimod |
Drug Info | Approved | Multiple sclerosis | ICD11: 8A40 | [31] |
Fingolimod hydrochloride |
Drug Info | Approved | Multiple sclerosis | ICD11: 8A40 | [31] |
Levocarnitine |
Drug Info | Approved | Cognitive impairment | ICD11: 6D71 | [32] |
Pentobarbital |
Drug Info | Approved | Insomnia | ICD11: 7A00 | [33] |
Propofol |
Drug Info | Approved | Anaesthesia | ICD11: 8E22 | [34] |
Theophylline |
Drug Info | Approved | Chronic obstructive pulmonary disease | ICD11: CA22 | [35] |
VESNARINONE |
Drug Info | Approved | Cardiac failure | ICD11: BD10-BD1Z | [36] |
Acetaminophen |
Drug Info | Approved | Anaesthesia | ICD11: 8E22 | [37] |
Benzocaine |
Drug Info | Approved | Anaesthesia | ICD11: 9A76-9A78 | [38] |
Cisplatin |
Drug Info | Approved | Lung cancer | ICD11: 2C25 | [39] |
Etoposide |
Drug Info | Approved | Lung cancer | ICD11: 2C25 | [40] |
Levomethadyl acetate hydrochloride |
Drug Info | Approved | Opiate dependence | ICD11: 6C43 | [41] |
Mexiletine hydrochloride |
Drug Info | Approved | Ventricular tachyarrhythmia | ICD11: BC71 | [42] |
Olopatadine |
Drug Info | Approved | Conjunctivitis | ICD11: 9A60 | [43] |
Phenobarbital |
Drug Info | Approved | Epilepsy | ICD11: 8A60 | [44] |
Sulfadiazine |
Drug Info | Approved | Toxoplasmosis | ICD11: 1F57 | [23] |
Azilsartan |
Drug Info | Approved | Hypertension | ICD11: BA00-BA04 | [45], [46] |
Dalfampridine |
Drug Info | Approved | Multiple sclerosis | ICD11: 8A40 | [47] |
Dapsone |
Drug Info | Approved | Pneumocystis pneumonia | ICD11: CA40 | [48] |
Folic acid |
Drug Info | Approved | Vitamin deficiency | ICD11: 5B55 | [49] |
Fomepizole |
Drug Info | Approved | Methanol/ethylene-glycol poisoning | ICD11: DA40 | [50] |
Furosemide |
Drug Info | Approved | Congestive heart failure | ICD11: BD10 | [51] |
Mitoxantrone |
Drug Info | Approved | Prostate cancer | ICD11: 2C82 | [52] |
Nicardipine hydrochloride |
Drug Info | Approved | Essential hypertension | ICD11: BA00 | [23] |
Oxaliplatin |
Drug Info | Approved | Colorectal cancer | ICD11: 2B91 | [53] |
Primidone |
Drug Info | Approved | Epilepsy | ICD11: 8A60 | [54] |
Sertraline hydrochloride |
Drug Info | Approved | Depression | ICD11: 6A71 | [55] |
Sildenafil citrate |
Drug Info | Approved | Erectile dysfunction | ICD11: HA01 | [56] |
Benzyl alcohol |
Drug Info | Approved | Pediculosis | ICD11: 1G00 | [57] |
Chlorzoxazone |
Drug Info | Approved | Anaesthesia | ICD11: 8E22 | [58] |
Clevidipine |
Drug Info | Approved | Essential hypertension | ICD11: BA00 | [59] |
Dacarbazine |
Drug Info | Approved | Melanoma | ICD11: 2C30 | [60] |
Dorzolamide hydrochloride |
Drug Info | Approved | Glaucoma | ICD11: 9C61 | [61] |
Enflurane |
Drug Info | Approved | Anaesthesia | ICD11: 8E22 | [62] |
Enfuvirtide |
Drug Info | Approved | Human immunodeficiency virus infection | ICD11: 1C60 | [63] |
Ibudilast |
Drug Info | Approved | Castleman's disease | ICD11: 4B2Y | [64] |
Isoflurane |
Drug Info | Approved | Anaesthesia | ICD11: 8E22 | [65] |
Meloxicam |
Drug Info | Approved | Osteoarthritis | ICD11: FA00 | [66] |
Rifampicin |
Drug Info | Approved | Osteoporosis | ICD11: FB83 | [67] |
Ripretinib |
Drug Info | Approved | Gastrointestinal stromal tumour | ICD11: 2B5B | [68] |
Sevoflurane |
Drug Info | Approved | Anaesthesia | ICD11: 8E22 | [34] |
Trimethadione |
Drug Info | Approved | Epilepsy | ICD11: 8A60 | [69] |
Aminophylline |
Drug Info | Approved | Asthma | ICD11: CA23 | [70] |
Menadione |
Drug Info | Approved | Vitamin deficiency | ICD11: 5B55 | [71] |
Meprobamate |
Drug Info | Approved | Anxiety disorder | ICD11: 6B00 | [72] |
Methoxyflurane |
Drug Info | Approved | Anaesthesia | ICD11: 8E22 | [35] |
Nabilone |
Drug Info | Approved | Insomnia | ICD11: 7A00-7A0Z | [73] |
Berberine |
Drug Info | Phase 4 | Discovery agent | ICD: N.A. | [74] |
3,4-Dihydroxycinnamic Acid |
Drug Info | Phase 4 | Thrombocytopenia | ICD11: 3B64 | [75] |
| Drugs in Phase 4 Clinical Trial | Click to Show/Hide the Full List of Drugs: 9 Drugs | ||||
Ademetionine |
Drug Info | Phase 4 | Cerebral ischaemia | ICD11: 8B1Z | [15] |
Phenacetin |
Drug Info | Phase 4 | Anaesthesia | ICD11: 8E22 | [76] |
Perazine |
Drug Info | Phase 4 | Cerebrovascular dementia | ICD11: 6D81 | [77] |
Urethane |
Drug Info | Phase 4 | Lung cancer | ICD11: 2C25 | [78] |
Zopiclone |
Drug Info | Phase 4 | Insomnia | ICD11: 7A00 | [29] |
Proguanil |
Drug Info | Phase 4 | Malaria | ICD11: 1F40 | [79] |
Glucosamine |
Drug Info | Phase 4 | Osteoarthritis | ICD11: FA00 | [80] |
Tegafur |
Drug Info | Phase 4 | Colon cancer | ICD11: 2B90 | [81] |
Thiamylal |
Drug Info | Phase 4 | Anaesthesia | ICD11: 8E22 | [82] |
| Drugs in Phase 3 Clinical Trial | Click to Show/Hide the Full List of Drugs: 8 Drugs | ||||
Selumetinib |
Drug Info | Phase 3 | Neurofibromatosis | ICD11: LD2D | [83] |
NSC-122758 |
Drug Info | Phase 3 | Vitamin deficiency | ICD11: 5B55 | [84] |
Y-100032 |
Drug Info | Phase 3 | Multiple myeloma | ICD11: 2A83 | [85] |
HSDB-3466 |
Drug Info | Phase 3 | Psoriasis vulgaris | ICD11: EA90 | [86] |
SC-15090 |
Drug Info | Phase 3 | Acute bronchitis | ICD11: CA42 | [87] |
LY-450139 |
Drug Info | Phase 3 | Alzheimer disease | ICD11: 8A20 | [88] |
SR-4233 |
Drug Info | Phase 3 | Alzheimer disease | ICD11: 8A20 | [89] |
ARC-029 |
Drug Info | Phase 3 | Alzheimer disease | ICD11: 8A20 | [90] |
| Drugs in Phase 2 Clinical Trial | Click to Show/Hide the Full List of Drugs: 9 Drugs | ||||
Verapamil |
Drug Info | Phase 2/3 | Hypertension | ICD11: BA00-BA04 | [91] |
ENT-1814 |
Drug Info | Phase 2/3 | Bell palsy | ICD11: 8B88 | [23] |
N-547 |
Drug Info | Phase 2/3 | Lung cancer | ICD11: 2C25 | [92] |
Ethanol |
Drug Info | Phase 2 | Diabetic nephropathy | ICD11: GB61 | [93] |
Ethanol |
Drug Info | Phase 2 | Diabetic nephropathy | ICD11: GB61 | [94] |
BCP-13498 |
Drug Info | Phase 2 | Anaesthesia | ICD11: 8E22 | [95] |
Vincamine |
Drug Info | Phase 2 | Cerebrovascular dementia | ICD11: 6D81 | [96] |
GTS-21 |
Drug Info | Phase 2 | Schizophrenia | ICD11: 6A20 | [97] |
HSDB-1516 |
Drug Info | Phase 2 | Allergy | ICD11: 4A80 | [98] |
| Drugs in Phase 1 Clinical Trial | Click to Show/Hide the Full List of Drugs: 5 Drugs | ||||
STX 64 |
Drug Info | Phase 1 | Prostate cancer | ICD11: 2C82 | [99] |
AST-1306 |
Drug Info | Phase 1 | Solid tumour/cancer | ICD11: 2A00-2F9Z | [100] |
GTPL-1666 |
Drug Info | Phase 1 | Cerebral vasospasm | ICD11: BA85 | [101] |
INS-260 |
Drug Info | Phase 1 | Colorectal cancer | ICD11: 2B91 | [102] |
FO-611 |
Drug Info | Phase 1 | Hepatic encephalopathy | ICD11: DB99 | [103] |
| Discontinued/withdrawn Drugs | Click to Show/Hide the Full List of Drugs: 4 Drugs | ||||
TAK-802 |
Drug Info | Discontinued in Phase 2 | Urinary dysfunction | ICD11: GC2Z | [104] |
BMS-181168 |
Drug Info | Discontinued in Phase 2 | Cognitive impairment | ICD11: 6D71 | [105] |
EGYT-3886 |
Drug Info | Discontinued | Anxiety disorder | ICD11: 6B00 | [106] |
CAM-2028 |
Drug Info | Discontinued | Acute nasopharyngitis | ICD11: CA00 | [80] |
| Preclinical/investigative Agents | Click to Show/Hide the Full List of Drugs: 11 Drugs | ||||
Benzylamine |
Drug Info | Investigative | Functional nausea/vomiting | ICD11: DD90 | [107] |
Chloroben |
Drug Info | Investigative | Discovery agent | ICD: N.A. | [108] |
Coumarin |
Drug Info | Investigative | Discovery agent | ICD: N.A. | [109] |
N,N-dimethylformamide |
Drug Info | Investigative | Discovery agent | ICD: N.A. | [110] |
Aniline |
Drug Info | Investigative | Discovery agent | ICD: N.A. | [111] |
Antipyrine |
Drug Info | Investigative | Discovery agent | ICD: N.A. | [112] |
Chloroxylenol |
Drug Info | Investigative | Pseudomonas infection | ICD11: 1G40 | [23] |
Lauric acid |
Drug Info | Investigative | Alzheimer disease | ICD11: 8A20 | [113], [114] |
Paraoxon |
Drug Info | Investigative | Discovery agent | ICD: N.A. | [115] |
Thiram |
Drug Info | Investigative | Discovery agent | ICD: N.A. | [116] |
AC1L9GJA |
Drug Info | Investigative | Discovery agent | ICD: N.A. | [117] |
| Tissue/Disease-Specific Protein Abundances of This DME | |||||
|---|---|---|---|---|---|
| Tissue-specific Protein Abundances in Healthy Individuals | Click to Show/Hide | ||||
|
|||||
| ICD Disease Classification 01 | Infectious/parasitic disease | Click to Show/Hide | |||
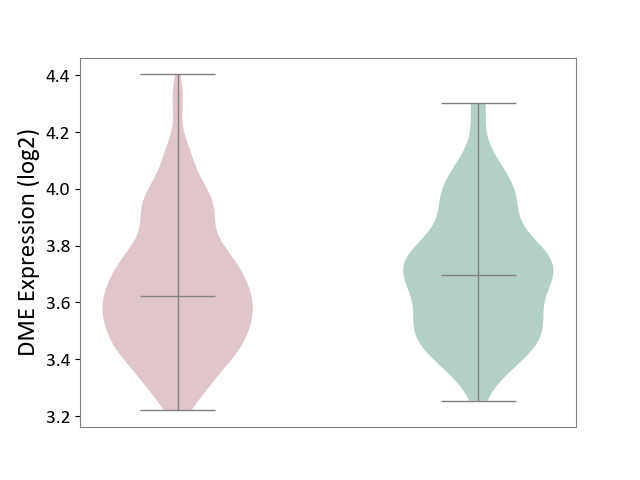
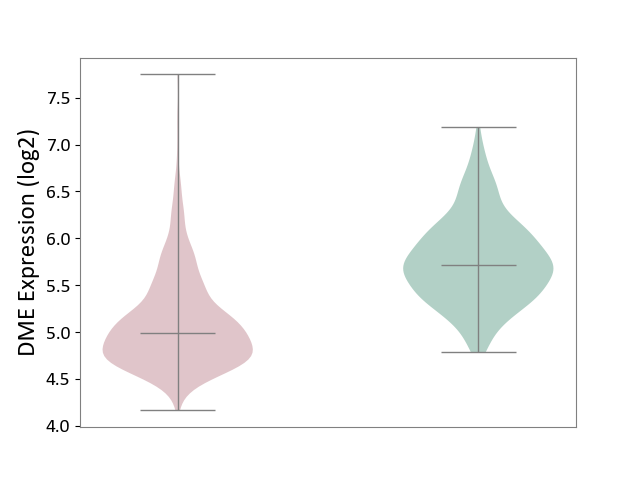
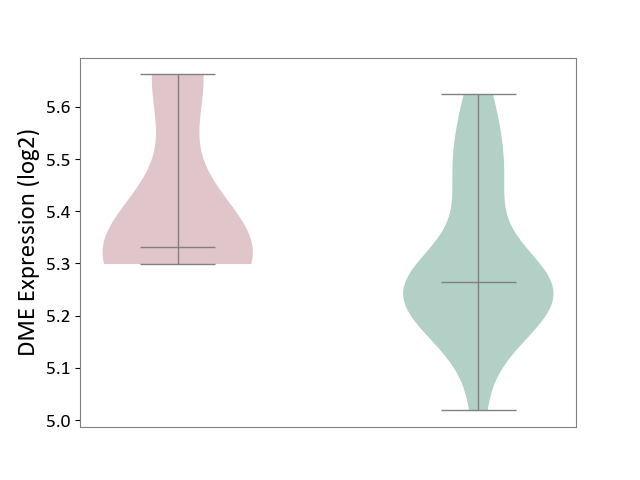
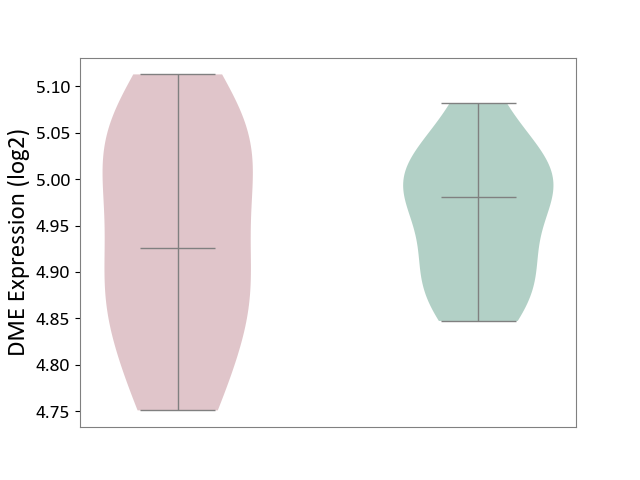
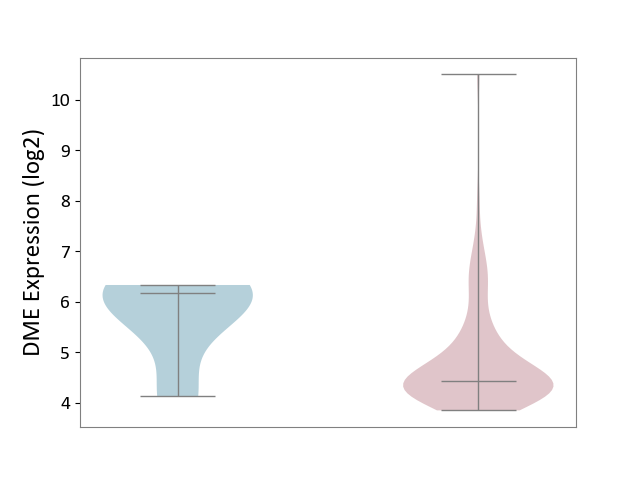
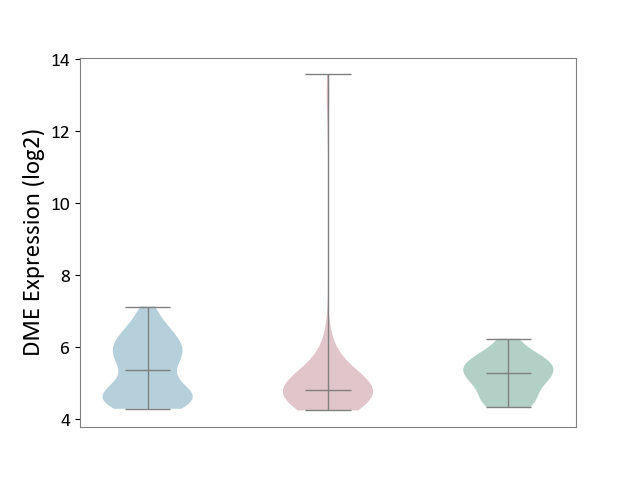
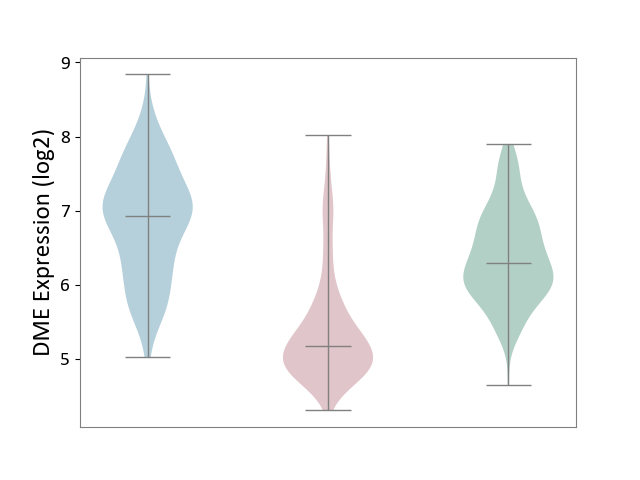
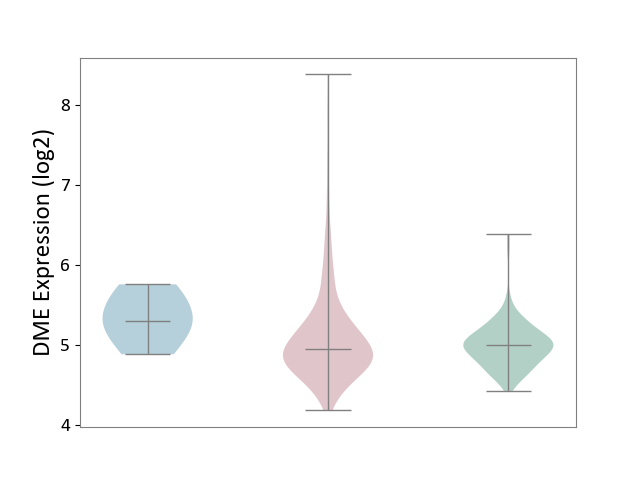
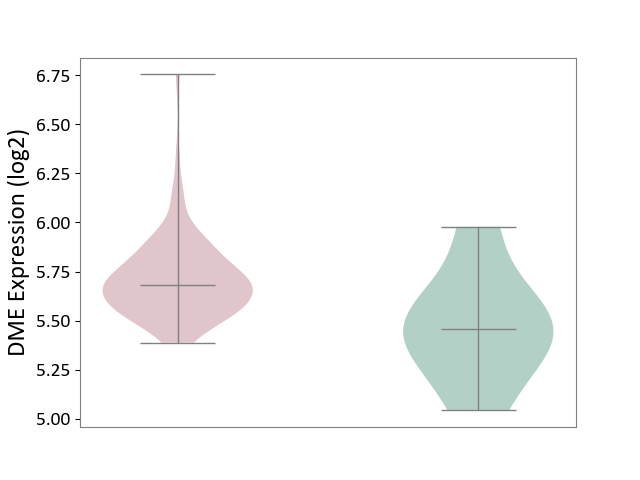
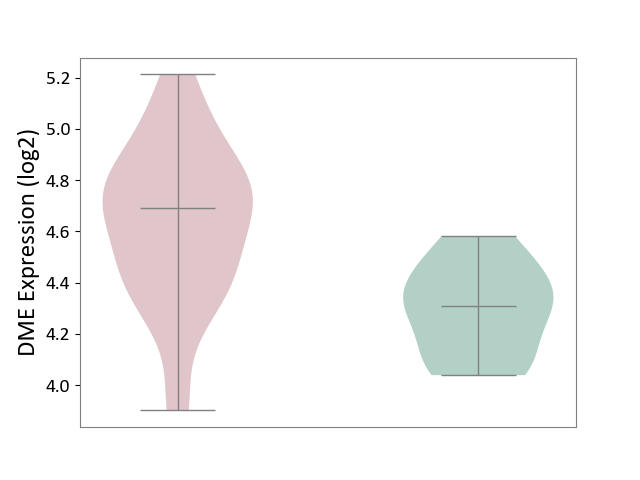
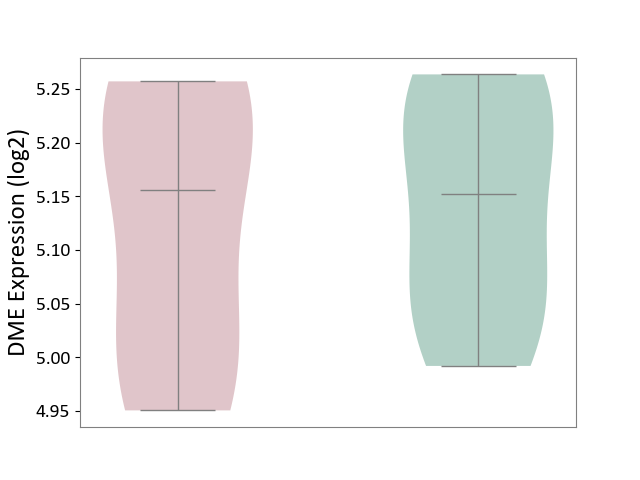
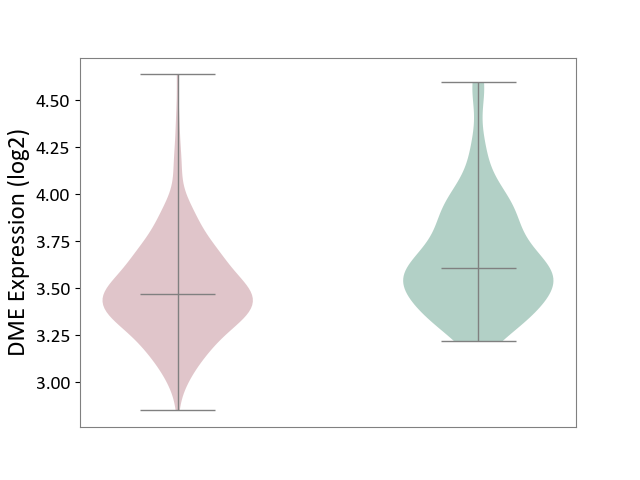
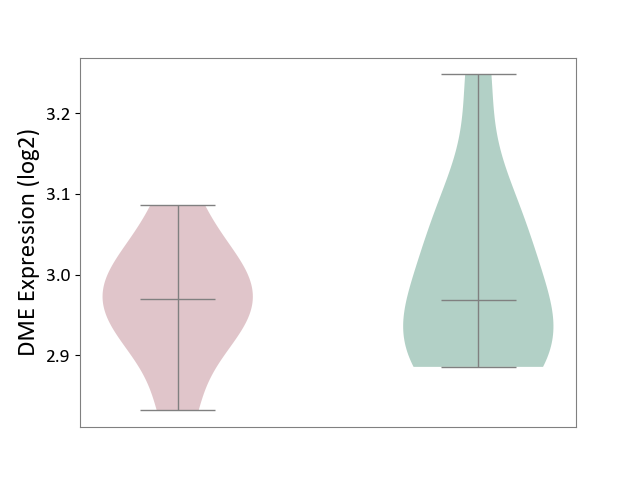
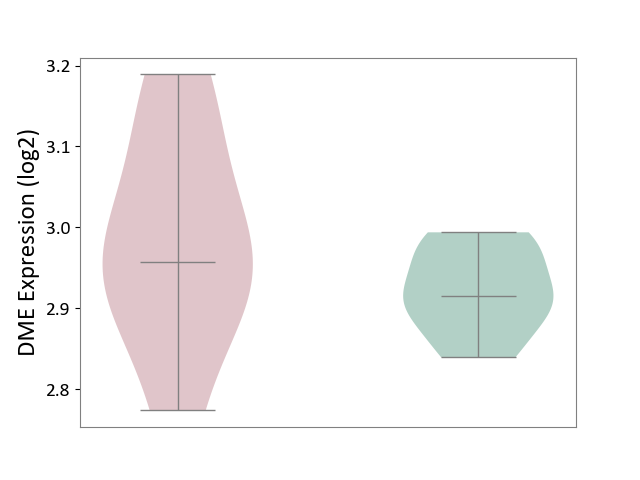
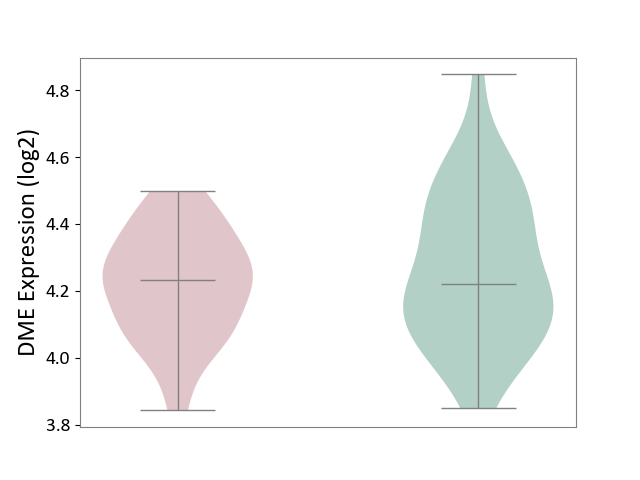
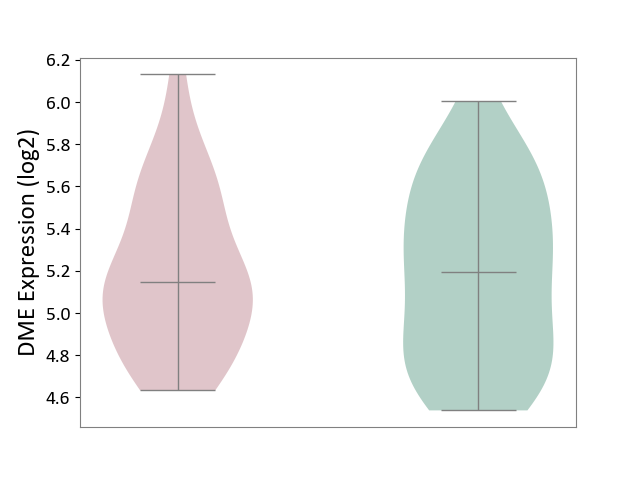
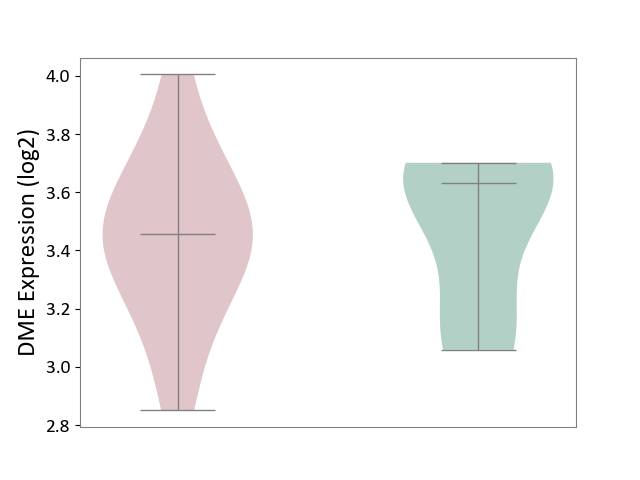
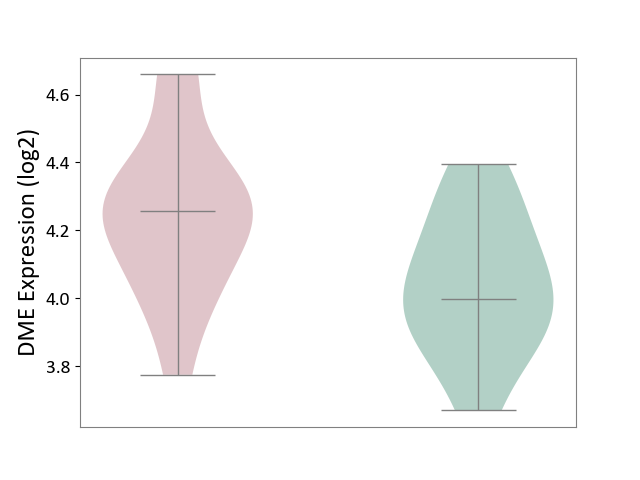
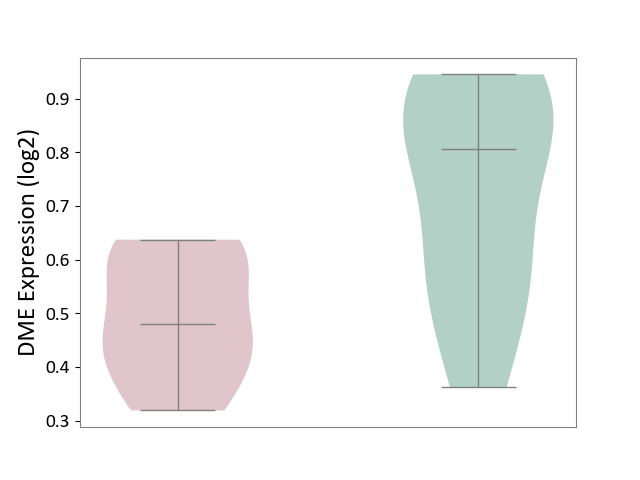
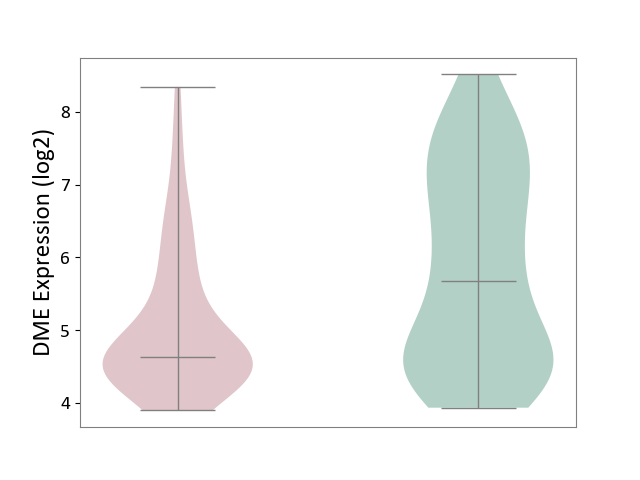
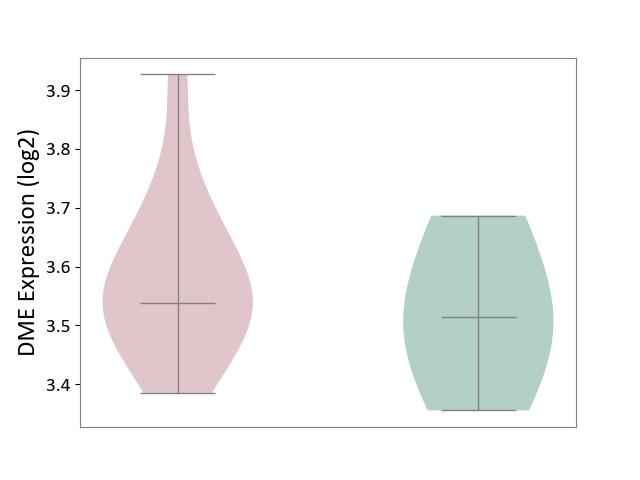
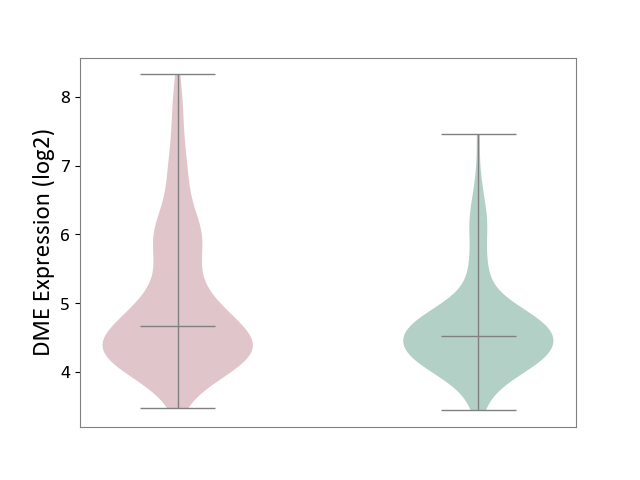
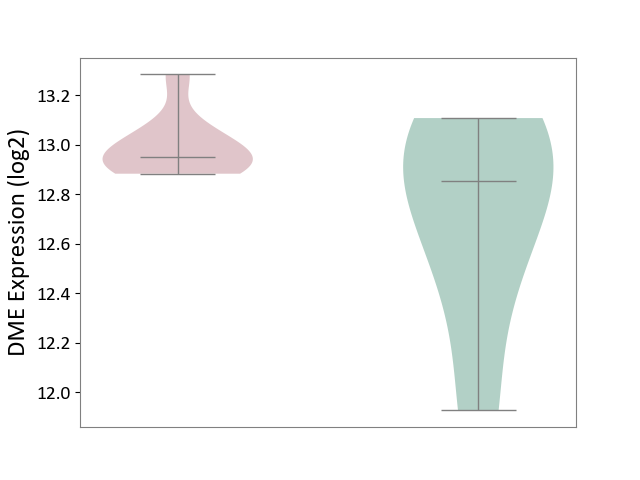
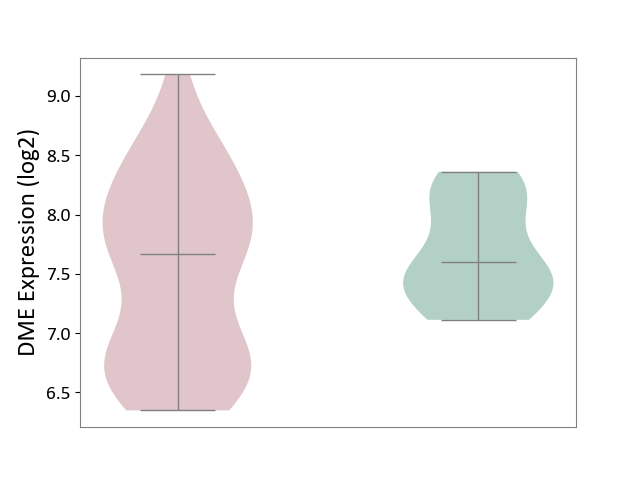
| ICD-11: 1C1H | Necrotising ulcerative gingivitis | Click to Show/Hide | |||
| The Studied Tissue | Gingival tissue | ||||
| The Specified Disease | Bacterial infection of gingival [ICD-11:1C1H] | ||||
| The Expression Level of Disease Section Compare with the Healthy Individual Tissue | p-value: 3.18E-01; Fold-change: 5.90E-02; Z-score: 1.16E-01 | ||||
|
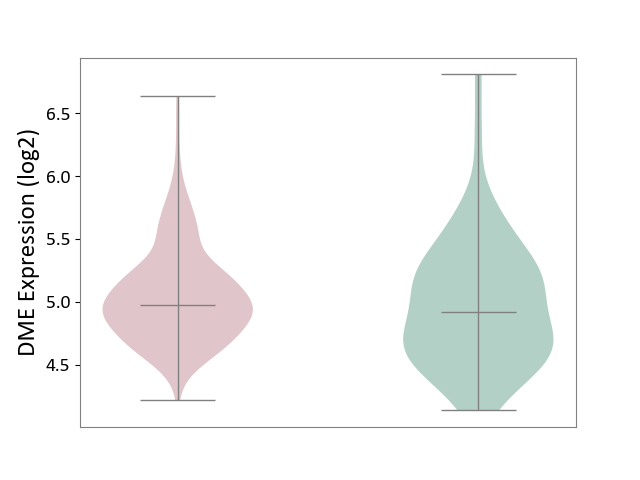
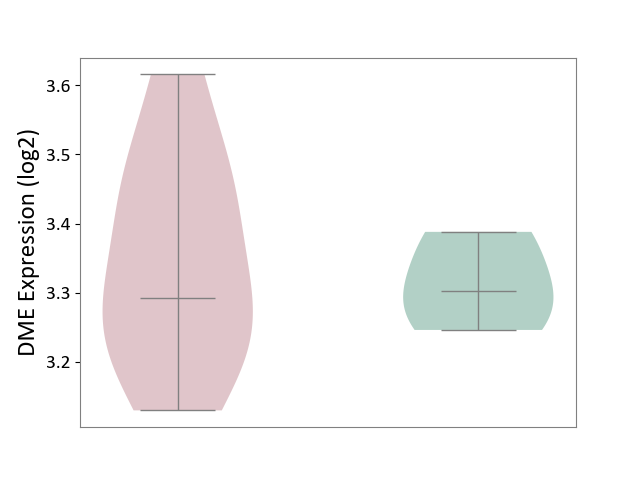
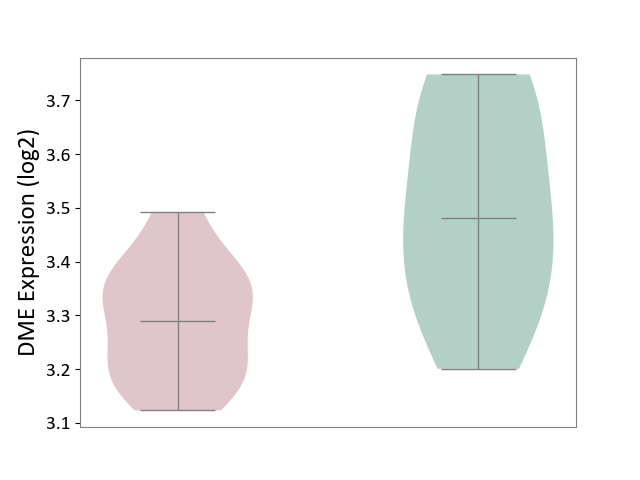
DME expression in the diseased tissue of patients
DME expression in the normal tissue of healthy individuals
|
|||||
| Violin Diagram of DME Disease-specific Protein Abundances |
|
Click to View the Clearer Original Diagram | |||
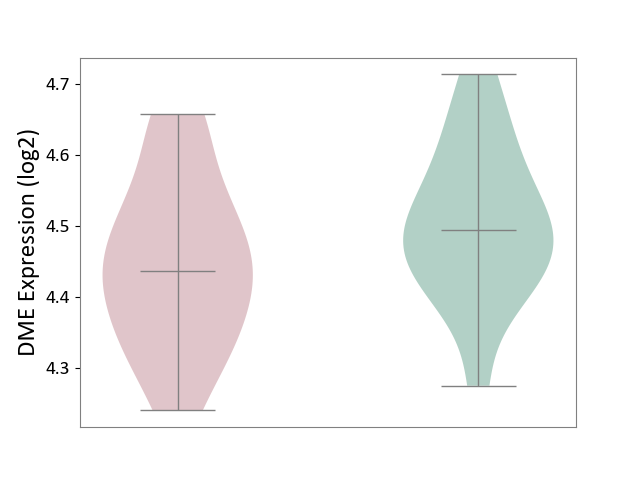
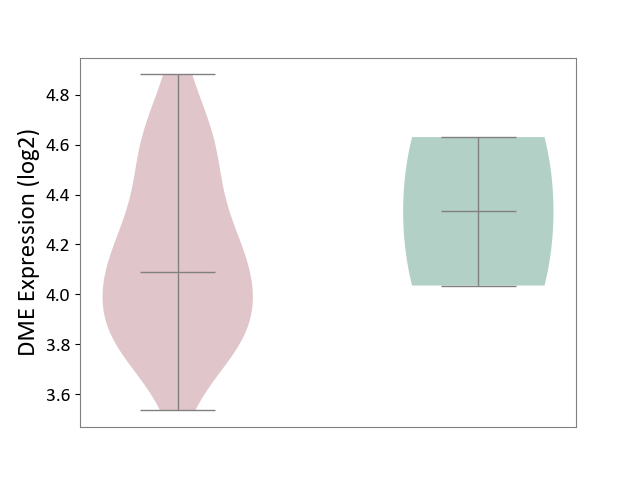
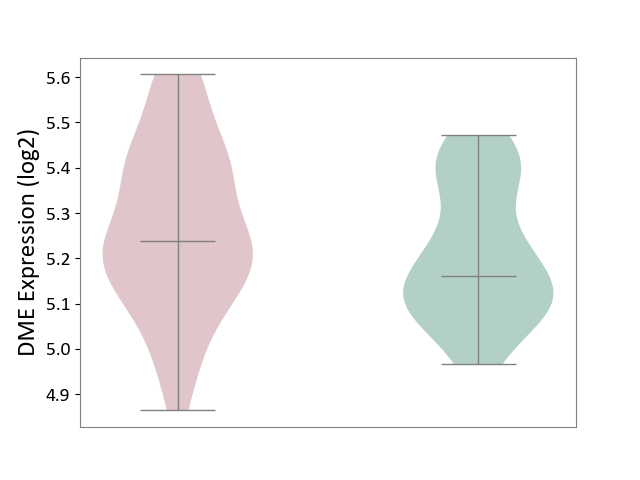
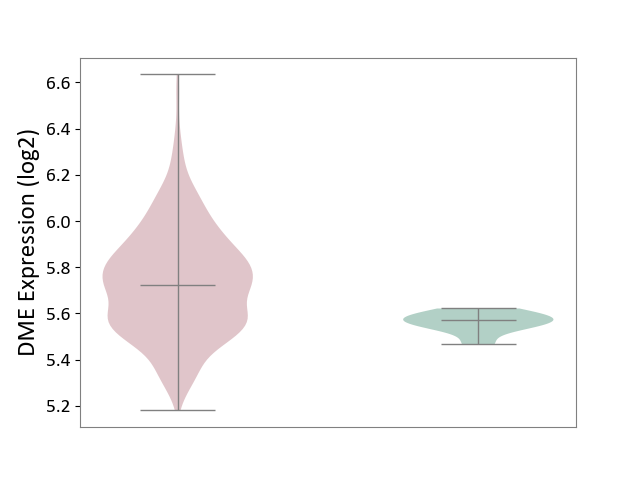
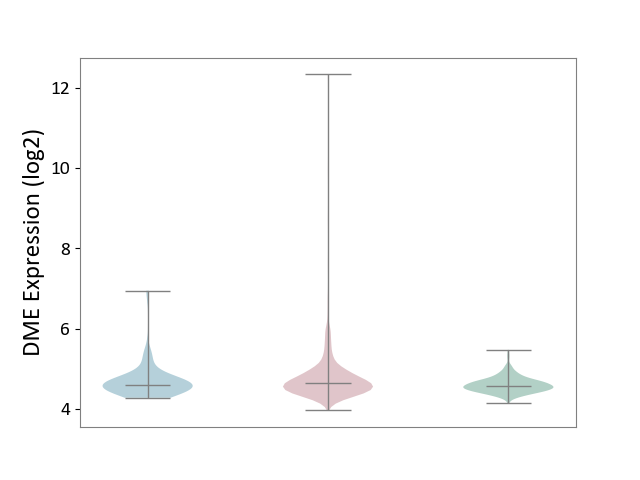
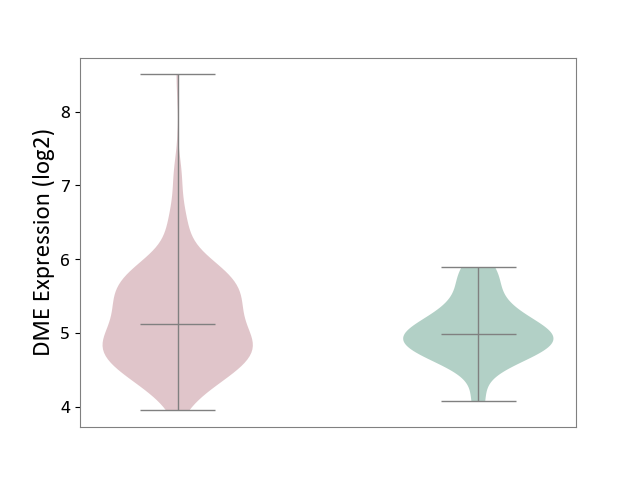
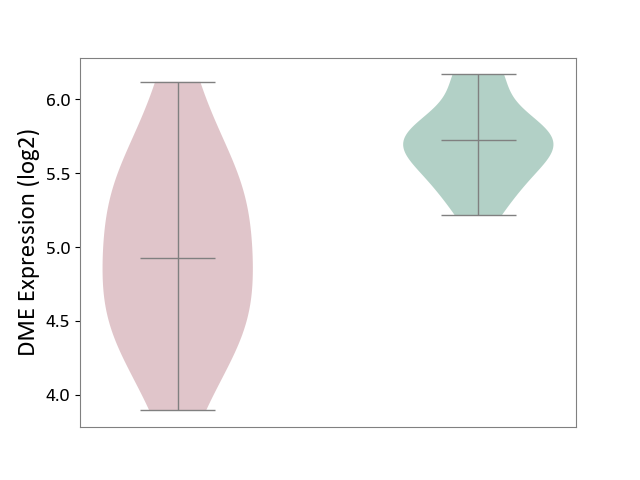
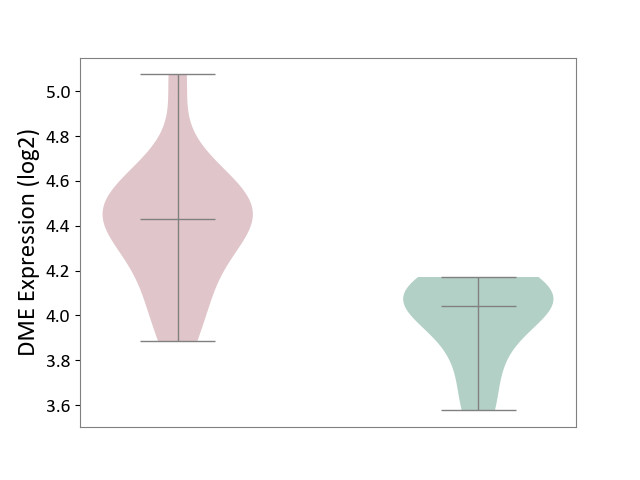
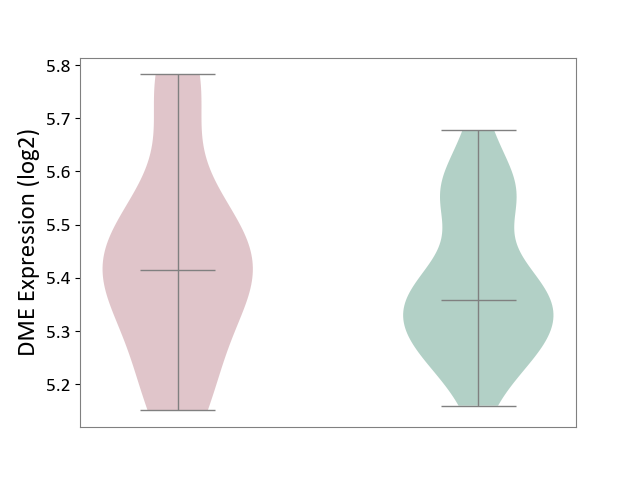
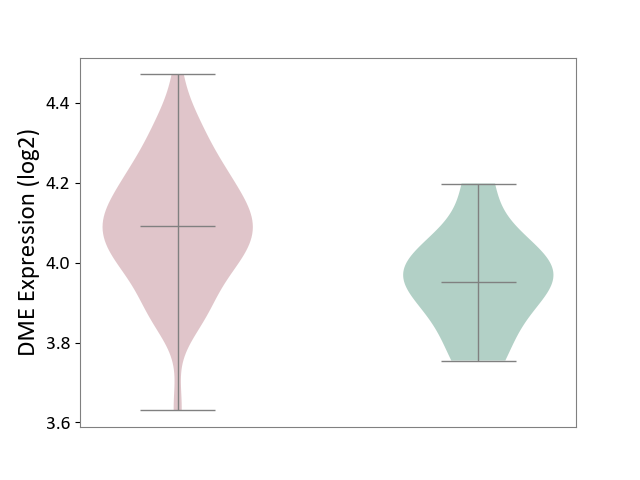
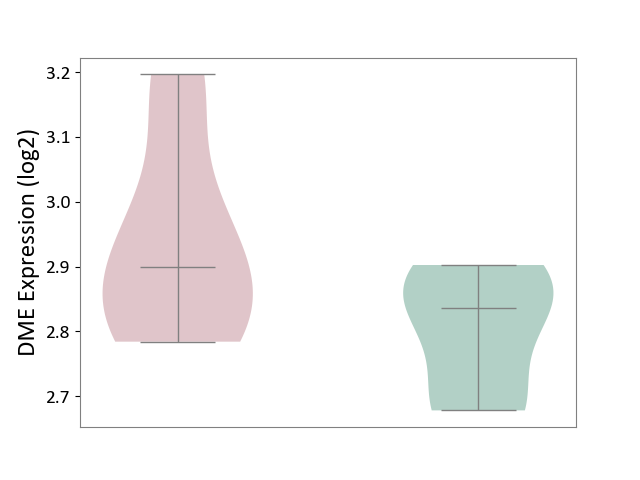
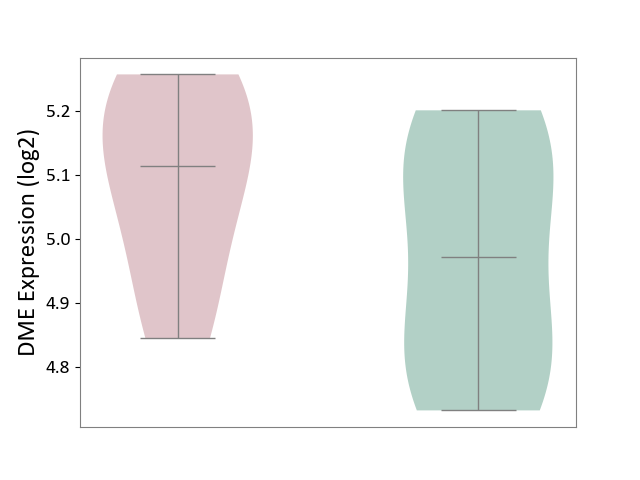
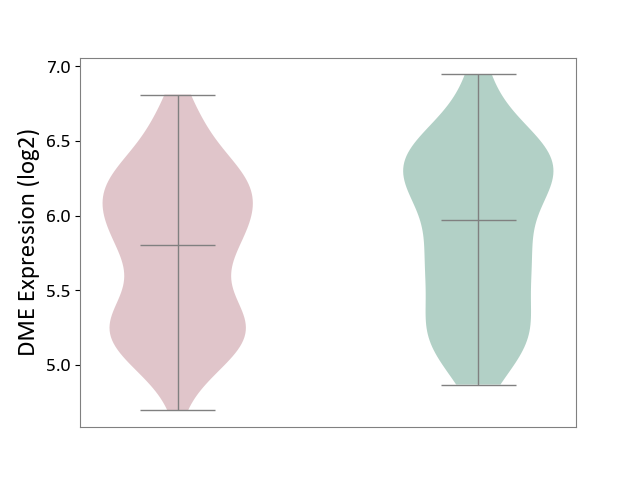
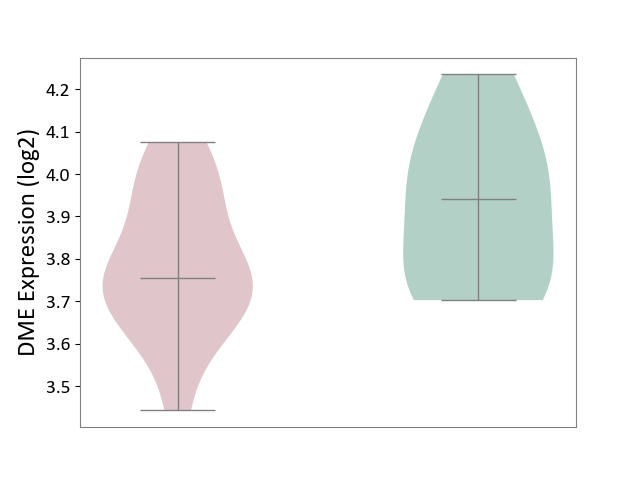
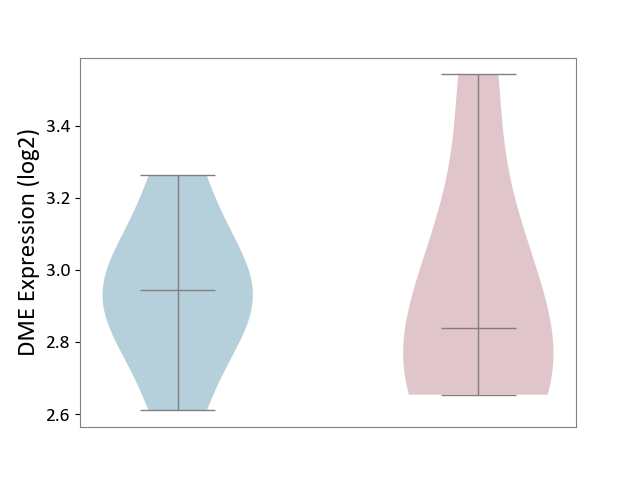
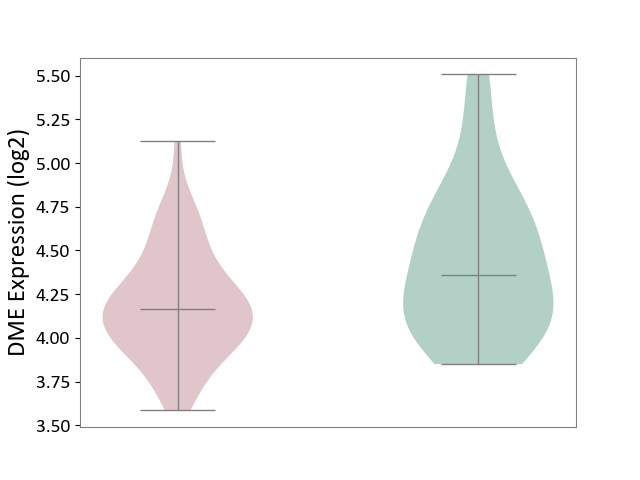
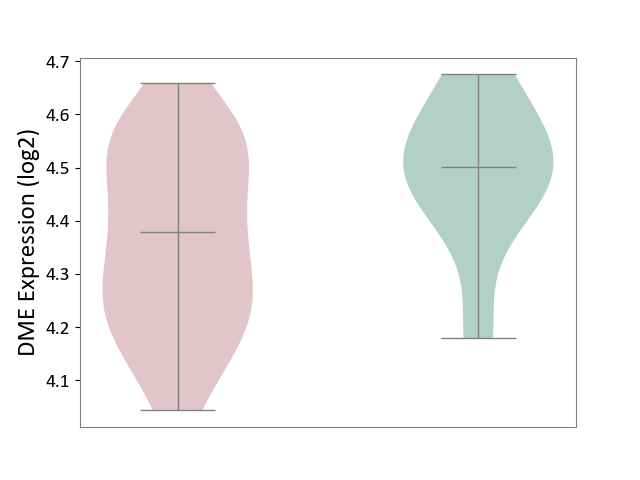
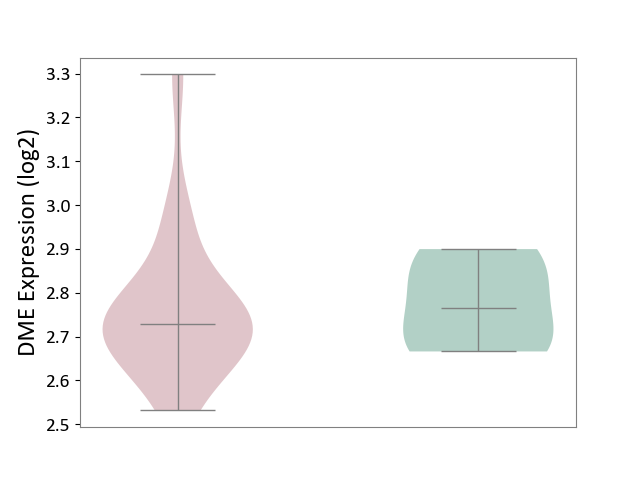
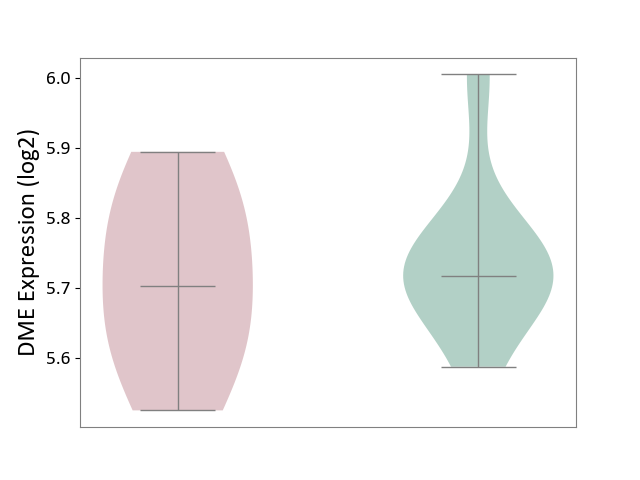
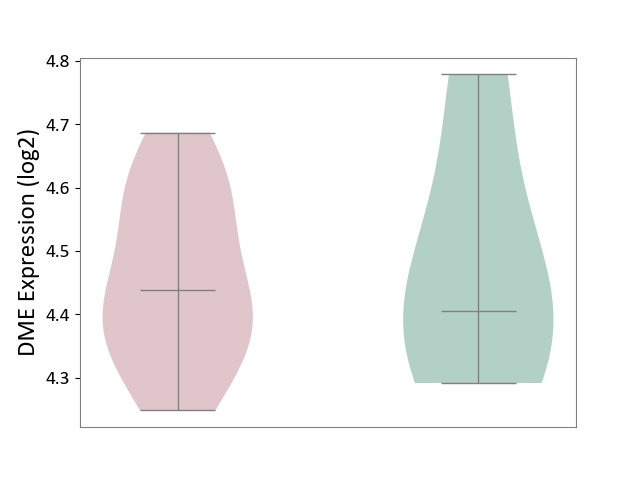
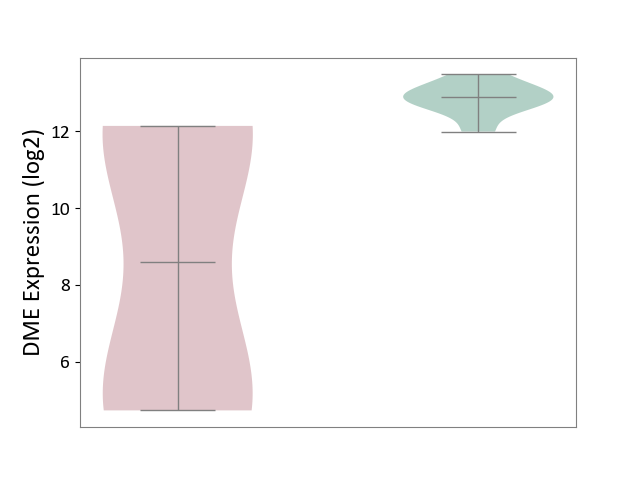
| ICD-11: 1E30 | Influenza | Click to Show/Hide | |||
| The Studied Tissue | Whole blood | ||||
| The Specified Disease | Influenza [ICD-11:1E30] | ||||
| The Expression Level of Disease Section Compare with the Healthy Individual Tissue | p-value: 6.39E-01; Fold-change: -1.08E-02; Z-score: -1.52E-01 | ||||
|
DME expression in the diseased tissue of patients
DME expression in the normal tissue of healthy individuals
|
|||||
| Violin Diagram of DME Disease-specific Protein Abundances |
|
Click to View the Clearer Original Diagram | |||
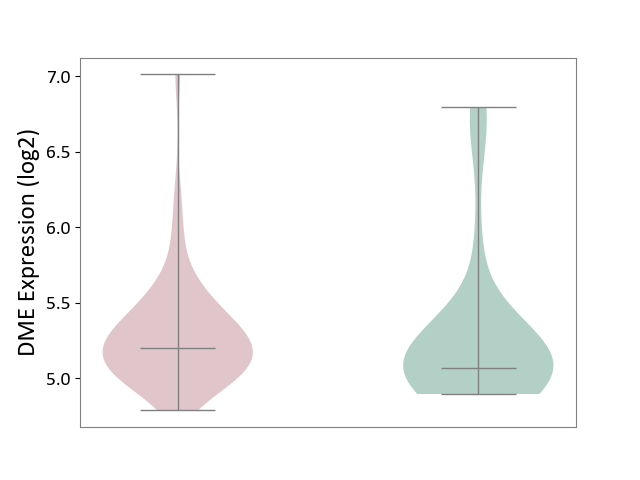
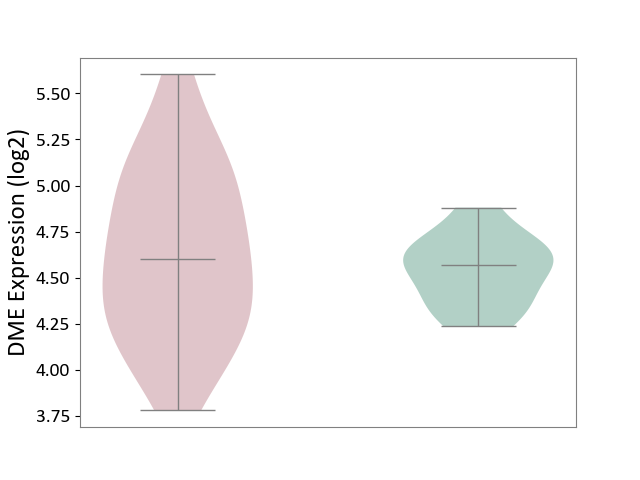
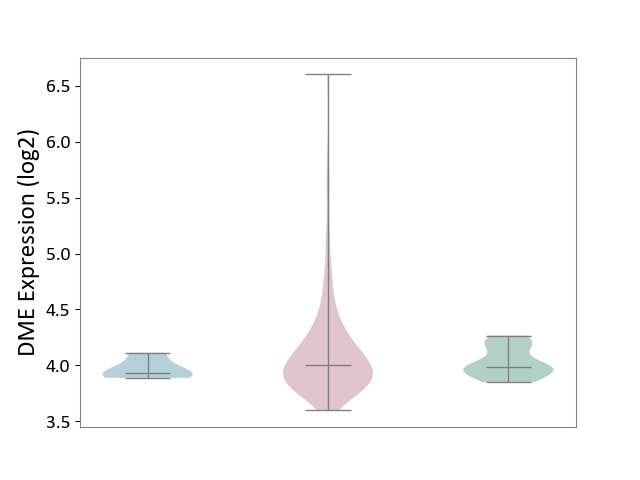
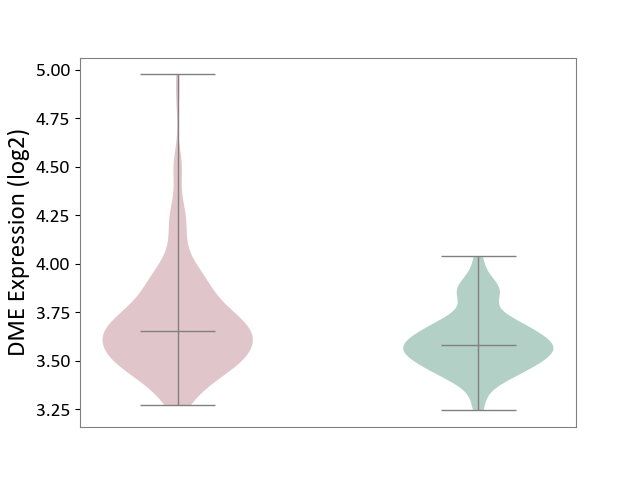
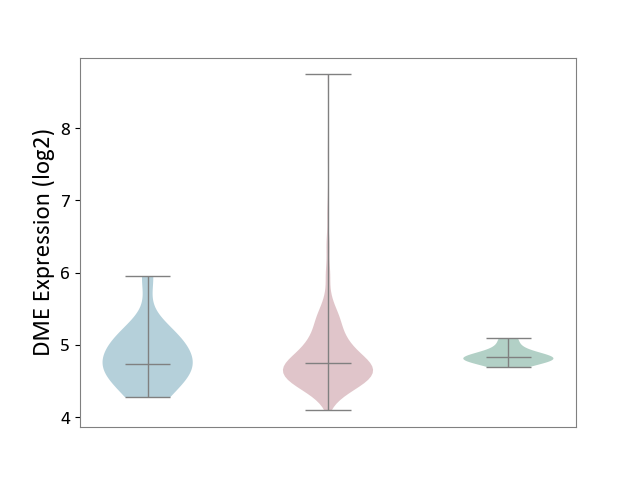
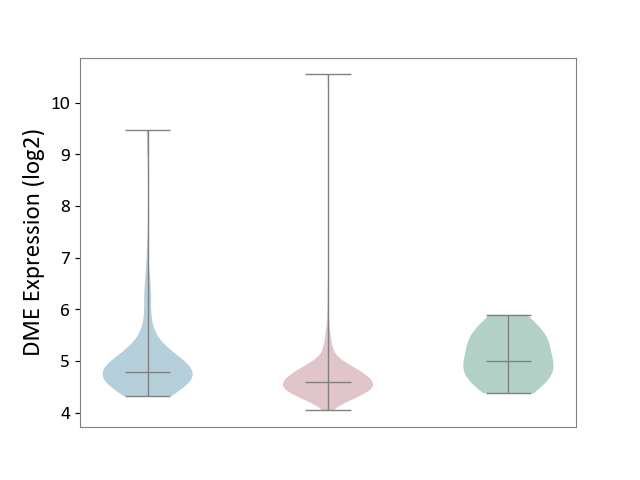
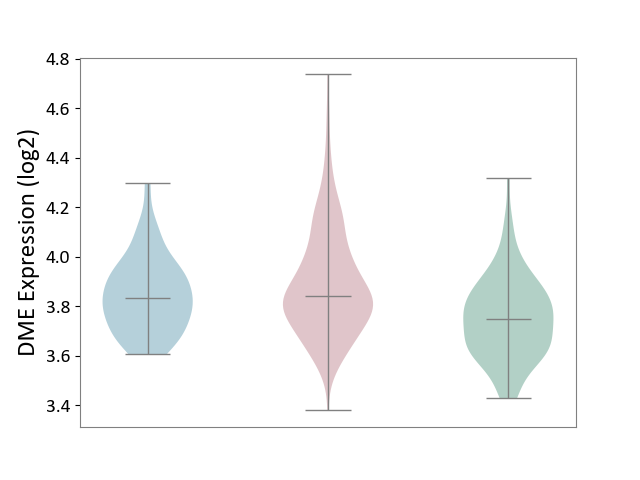
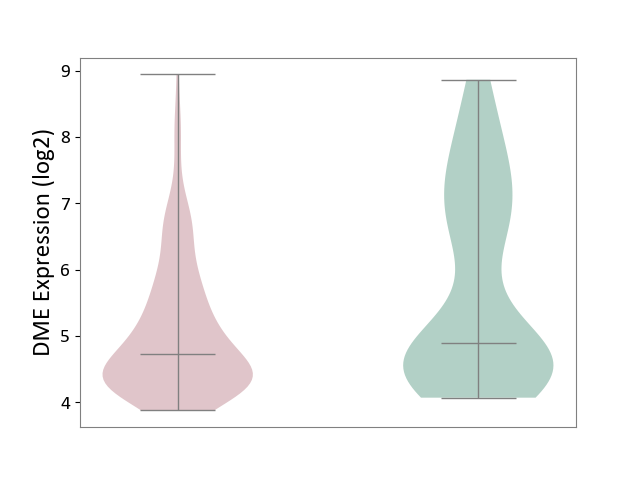
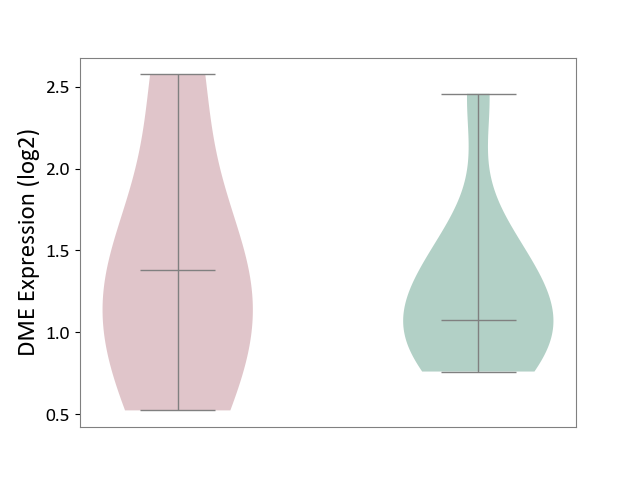
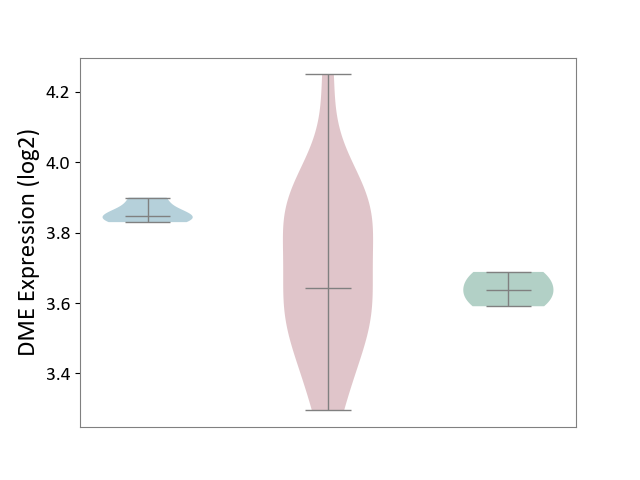
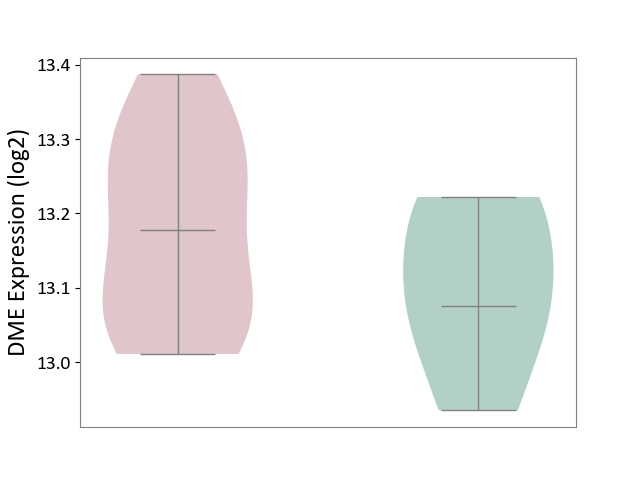
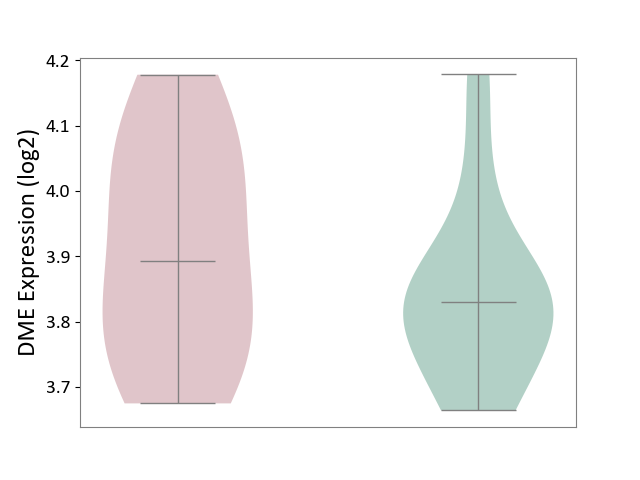
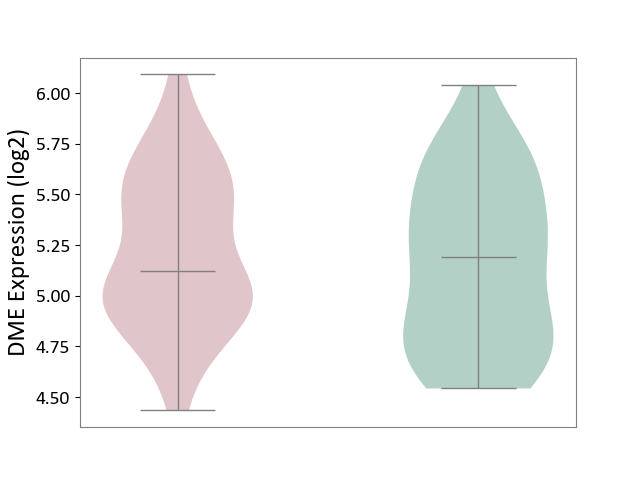
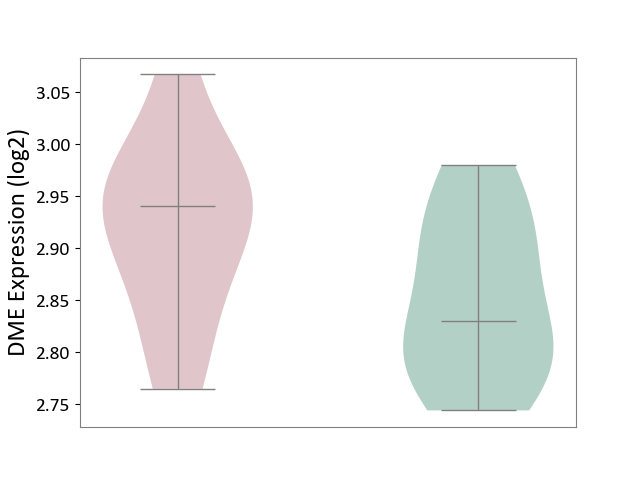
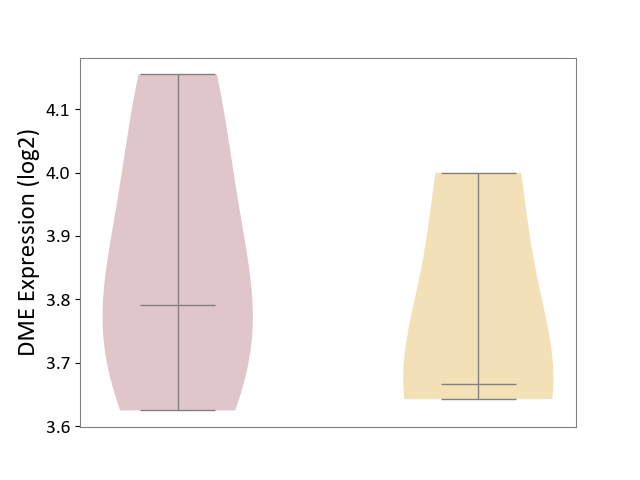
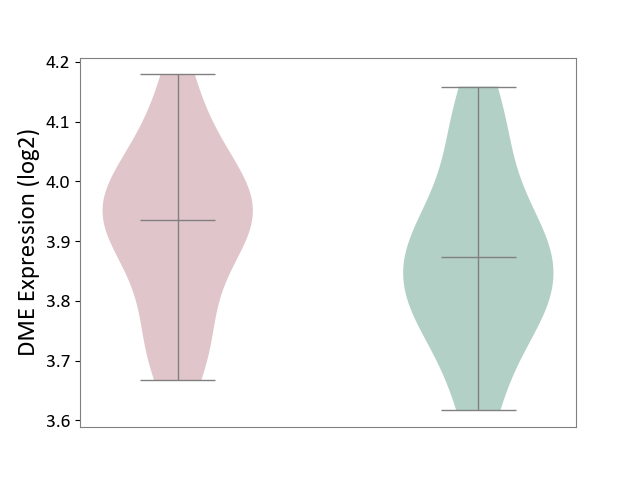
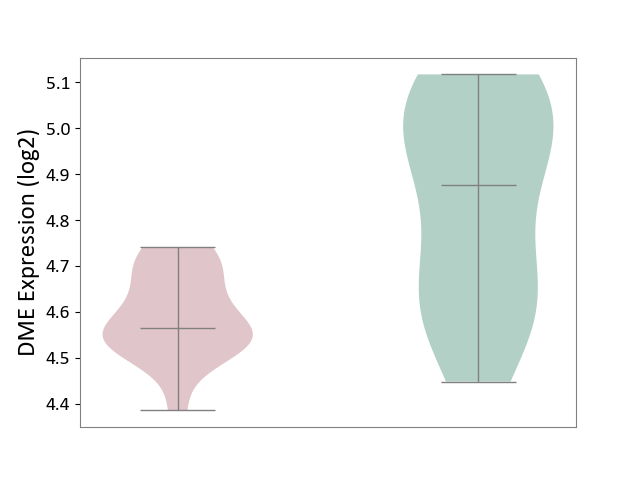
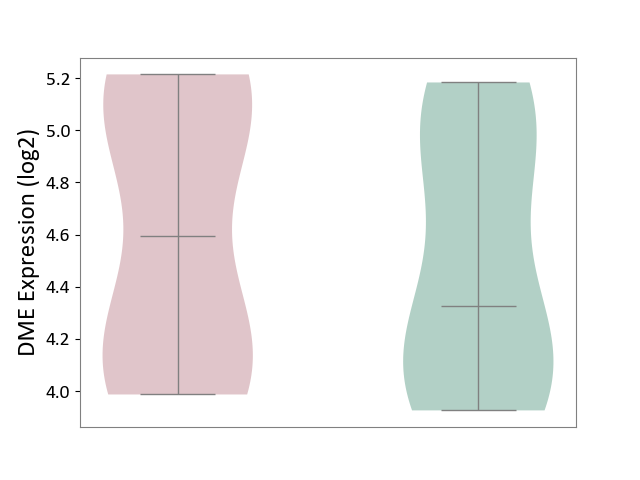
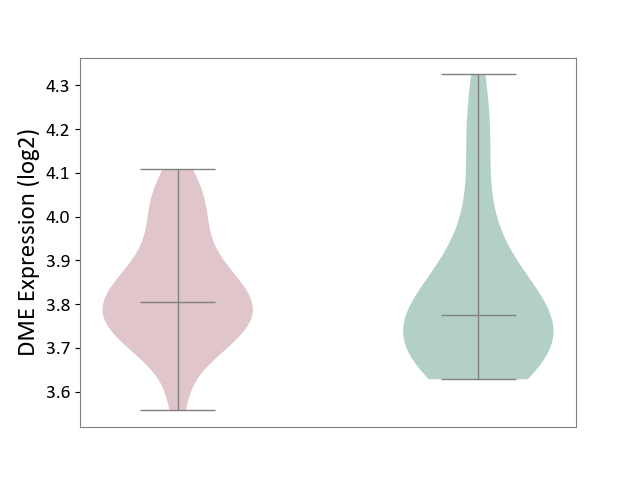
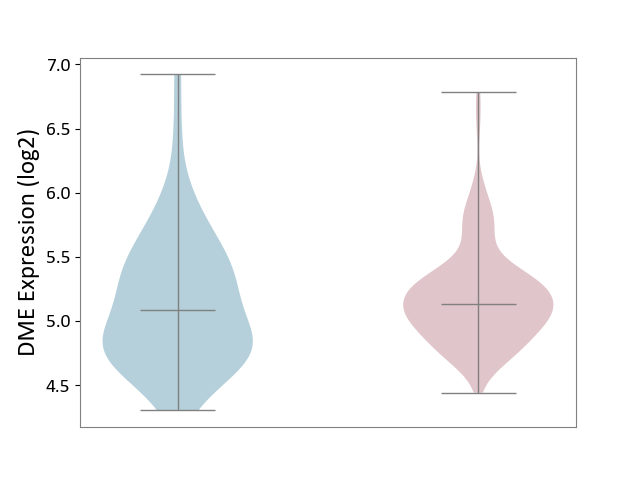
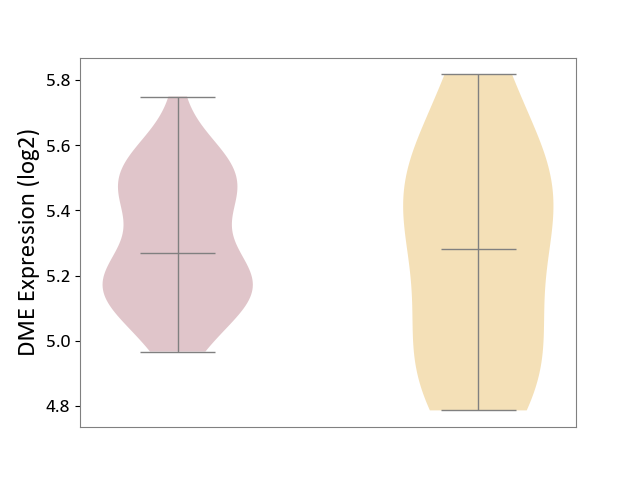
| ICD-11: 1E51 | Chronic viral hepatitis | Click to Show/Hide | |||
| The Studied Tissue | Whole blood | ||||
| The Specified Disease | Chronic hepatitis C [ICD-11:1E51.1] | ||||
| The Expression Level of Disease Section Compare with the Healthy Individual Tissue | p-value: 9.03E-03; Fold-change: -1.91E-01; Z-score: -1.01E+00 | ||||
|
DME expression in the diseased tissue of patients
DME expression in the normal tissue of healthy individuals
|
|||||
| Violin Diagram of DME Disease-specific Protein Abundances |
|
Click to View the Clearer Original Diagram | |||
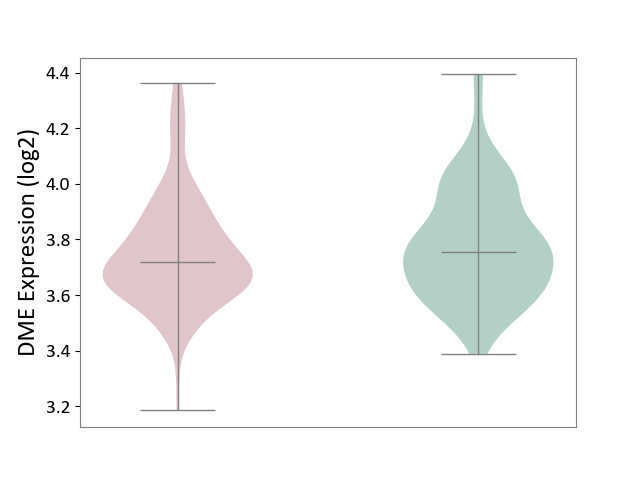
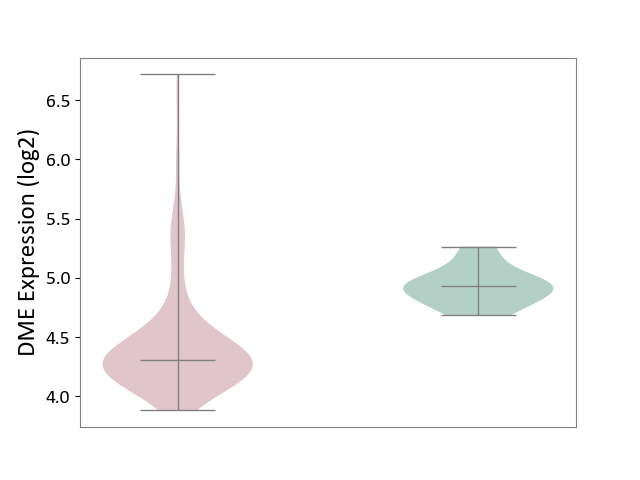
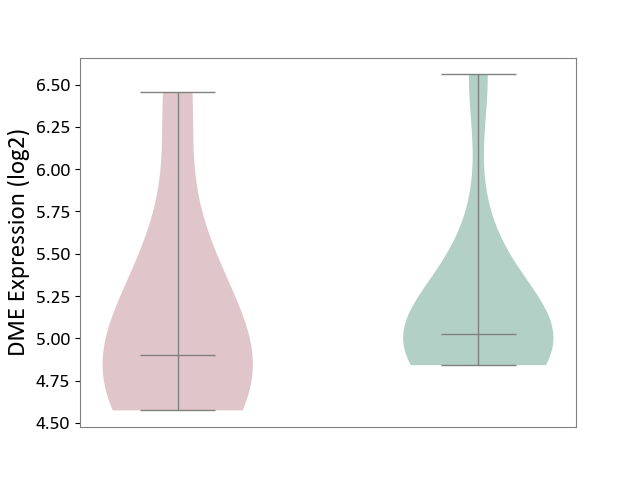
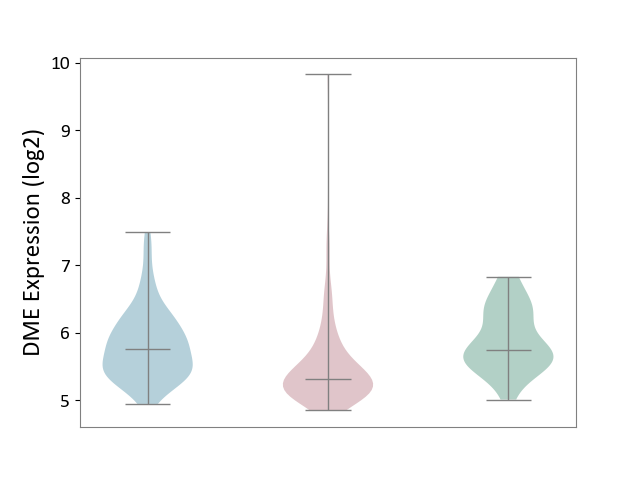
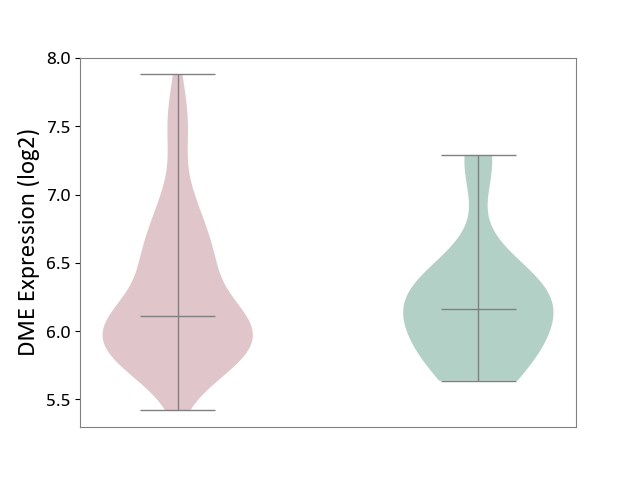
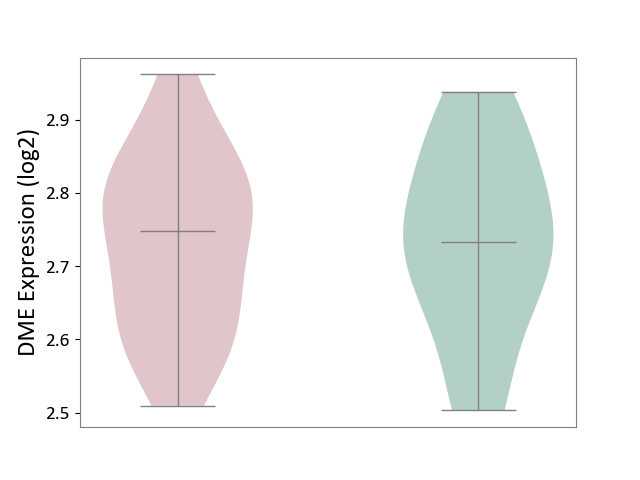
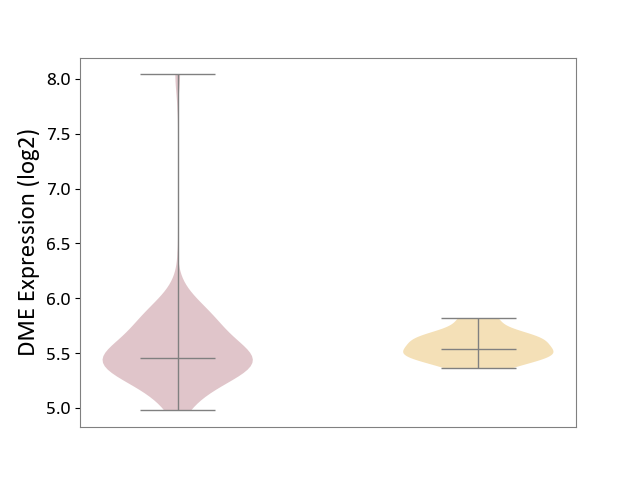
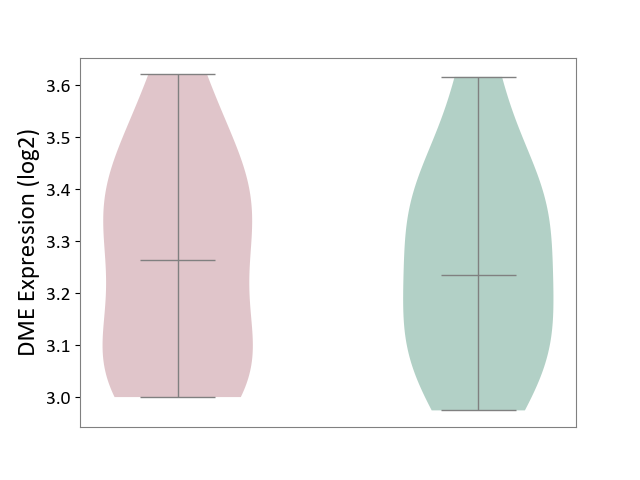
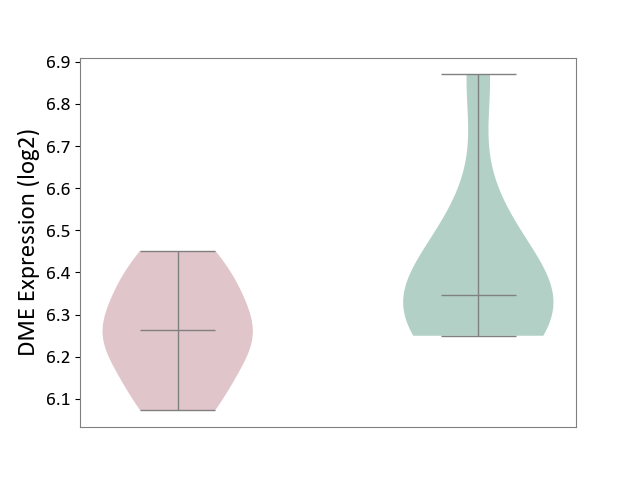
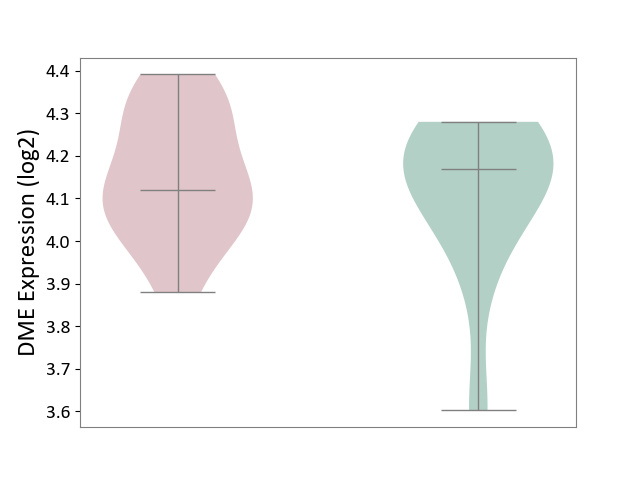
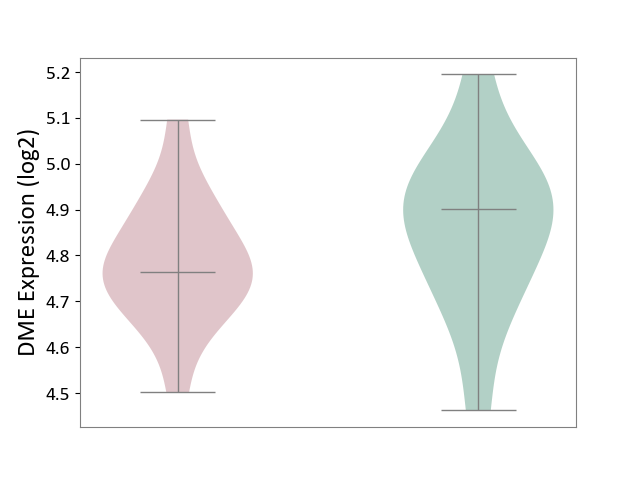
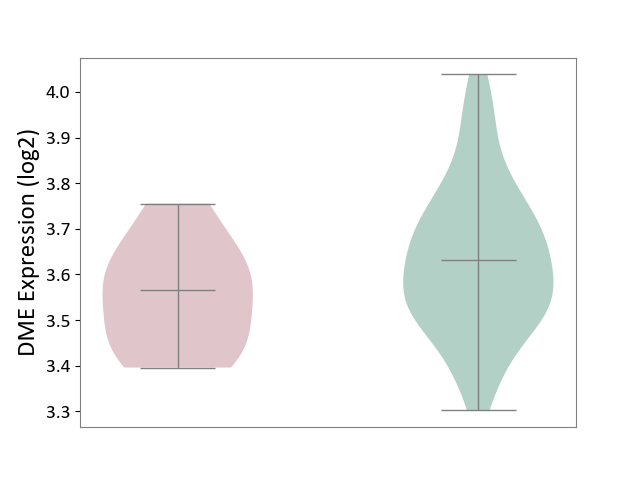
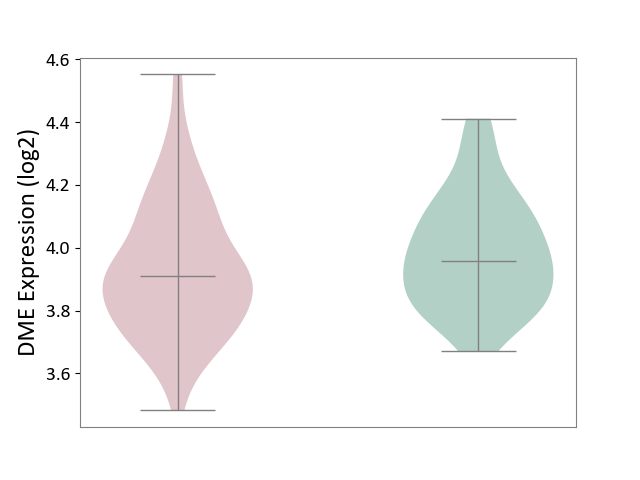
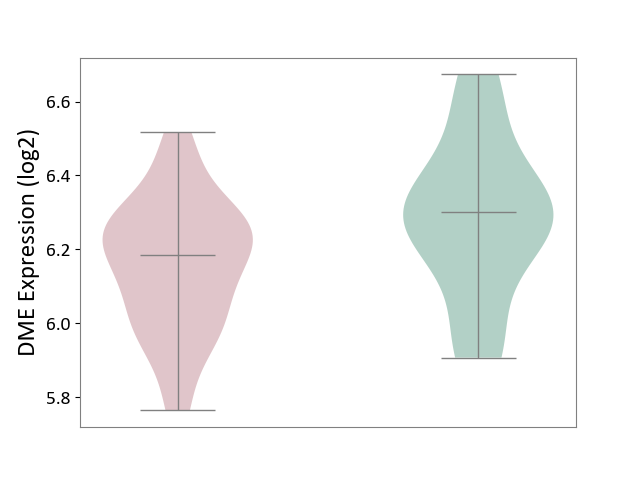
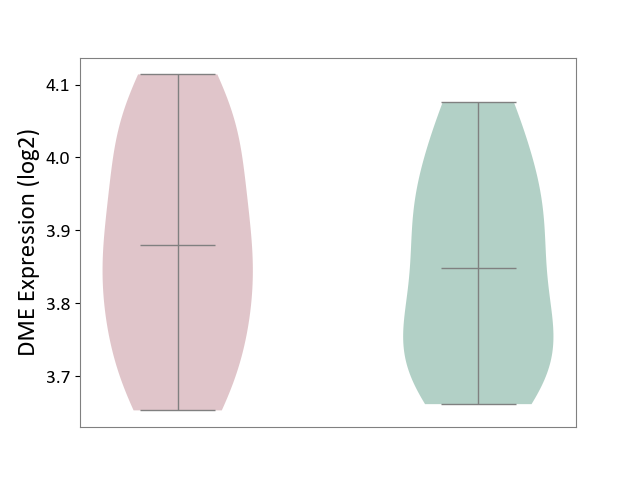
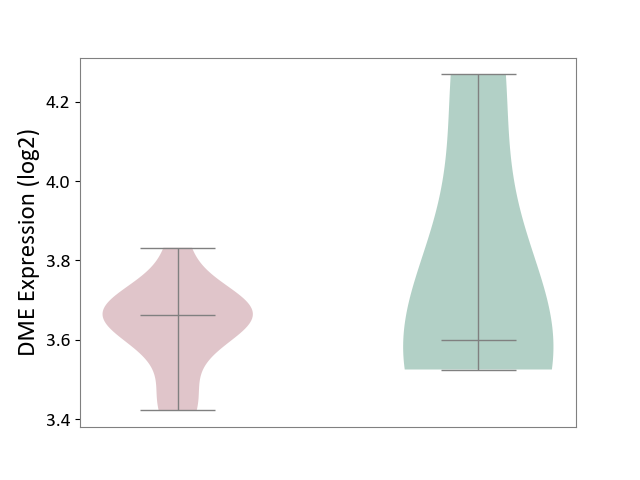
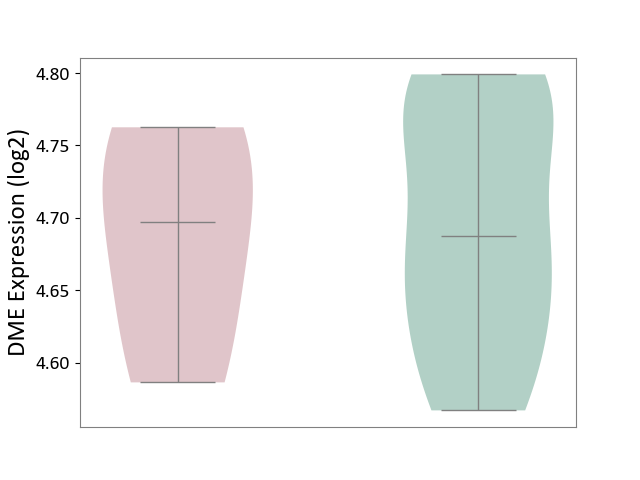
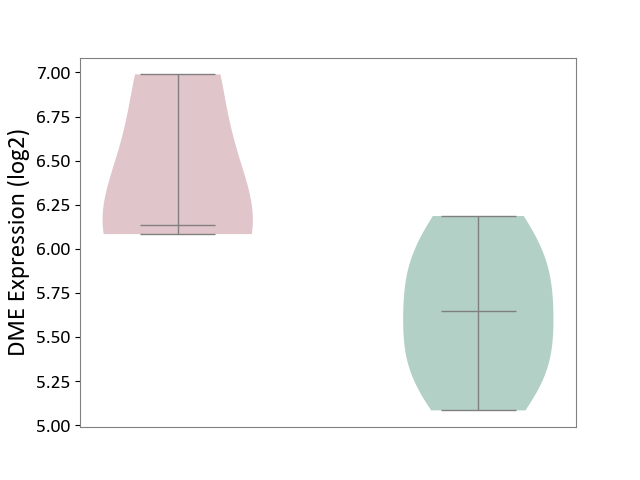
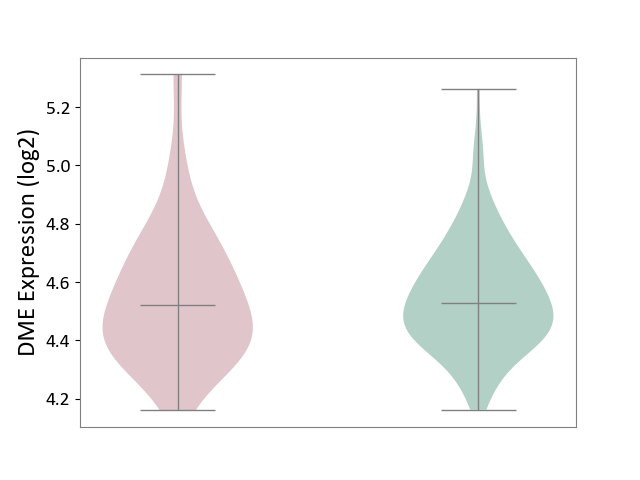
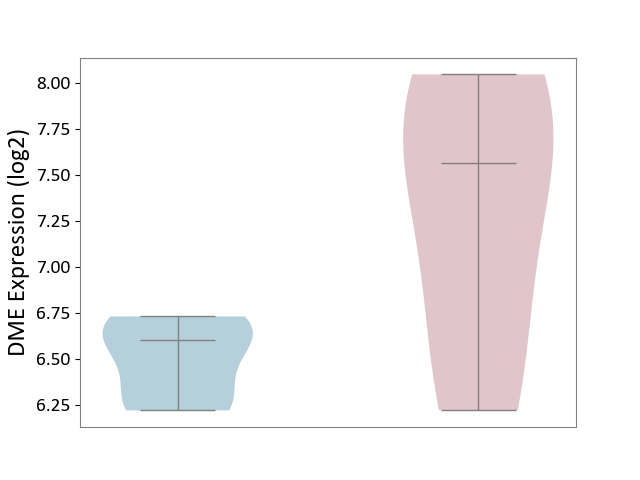
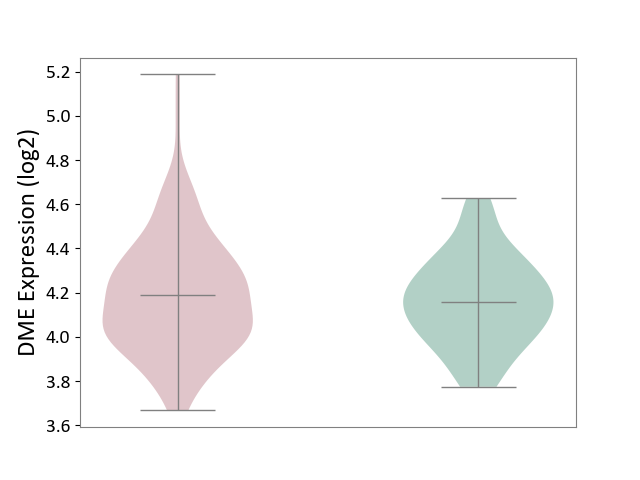
| ICD-11: 1G41 | Sepsis with septic shock | Click to Show/Hide | |||
| The Studied Tissue | Whole blood | ||||
| The Specified Disease | Sepsis with septic shock [ICD-11:1G41] | ||||
| The Expression Level of Disease Section Compare with the Healthy Individual Tissue | p-value: 1.45E-02; Fold-change: -7.38E-02; Z-score: -3.22E-01 | ||||
|
DME expression in the diseased tissue of patients
DME expression in the normal tissue of healthy individuals
|
|||||
| Violin Diagram of DME Disease-specific Protein Abundances |
|
Click to View the Clearer Original Diagram | |||
| ICD-11: CA40 | Respiratory syncytial virus infection | Click to Show/Hide | |||
| The Studied Tissue | Peripheral blood | ||||
| The Specified Disease | Pediatric respiratory syncytial virus infection [ICD-11:CA40.11] | ||||
| The Expression Level of Disease Section Compare with the Healthy Individual Tissue | p-value: 1.10E-01; Fold-change: -5.80E-02; Z-score: -5.35E-01 | ||||
|
DME expression in the diseased tissue of patients
DME expression in the normal tissue of healthy individuals
|
|||||
| Violin Diagram of DME Disease-specific Protein Abundances |
|
Click to View the Clearer Original Diagram | |||
| ICD-11: CA42 | Rhinovirus infection | Click to Show/Hide | |||
| The Studied Tissue | Nasal epithelium tissue | ||||
| The Specified Disease | Rhinovirus infection [ICD-11:CA42.1] | ||||
| The Expression Level of Disease Section Compare with the Healthy Individual Tissue | p-value: 8.58E-01; Fold-change: 1.31E-01; Z-score: 2.57E-01 | ||||
|
DME expression in the diseased tissue of patients
DME expression in the normal tissue of healthy individuals
|
|||||
| Violin Diagram of DME Disease-specific Protein Abundances |
|
Click to View the Clearer Original Diagram | |||
| ICD-11: KA60 | Neonatal sepsis | Click to Show/Hide | |||
| The Studied Tissue | Whole blood | ||||
| The Specified Disease | Neonatal sepsis [ICD-11:KA60] | ||||
| The Expression Level of Disease Section Compare with the Healthy Individual Tissue | p-value: 2.57E-01; Fold-change: -3.65E-02; Z-score: -1.83E-01 | ||||
|
DME expression in the diseased tissue of patients
DME expression in the normal tissue of healthy individuals
|
|||||
| Violin Diagram of DME Disease-specific Protein Abundances |
|
Click to View the Clearer Original Diagram | |||
| ICD Disease Classification 02 | Neoplasm | Click to Show/Hide | |||
| ICD-11: 2A00 | Brain cancer | Click to Show/Hide | |||
| The Studied Tissue | Nervous tissue | ||||
| The Specified Disease | Glioblastopma [ICD-11:2A00.00] | ||||
| The Expression Level of Disease Section Compare with the Healthy Individual Tissue | p-value: 8.49E-94; Fold-change: -7.35E-01; Z-score: -1.60E+00 | ||||
|
DME expression in the diseased tissue of patients
DME expression in the normal tissue of healthy individuals
|
|||||
| Violin Diagram of DME Disease-specific Protein Abundances |
|
Click to View the Clearer Original Diagram | |||
| The Studied Tissue | Brain stem tissue | ||||
| The Specified Disease | Glioma [ICD-11:2A00.0Y-2A00.0Z] | ||||
| The Expression Level of Disease Section Compare with the Healthy Individual Tissue | p-value: 6.47E-01; Fold-change: -2.42E-01; Z-score: -5.76E-01 | ||||
|
DME expression in the diseased tissue of patients
DME expression in the normal tissue of healthy individuals
|
|||||
| Violin Diagram of DME Disease-specific Protein Abundances |
|
Click to View the Clearer Original Diagram | |||
| The Studied Tissue | White matter tissue | ||||
| The Specified Disease | Glioma [ICD-11:2A00.0Y-2A00.0Z] | ||||
| The Expression Level of Disease Section Compare with the Healthy Individual Tissue | p-value: 3.48E-01; Fold-change: 3.53E-02; Z-score: 1.86E-01 | ||||
|
DME expression in the diseased tissue of patients
DME expression in the normal tissue of healthy individuals
|
|||||
| Violin Diagram of DME Disease-specific Protein Abundances |
|
Click to View the Clearer Original Diagram | |||
| The Studied Tissue | Brain stem tissue | ||||
| The Specified Disease | Neuroectodermal tumour [ICD-11:2A00.11] | ||||
| The Expression Level of Disease Section Compare with the Healthy Individual Tissue | p-value: 2.84E-07; Fold-change: -6.21E-01; Z-score: -3.73E+00 | ||||
|
DME expression in the diseased tissue of patients
DME expression in the normal tissue of healthy individuals
|
|||||
| Violin Diagram of DME Disease-specific Protein Abundances |
|
Click to View the Clearer Original Diagram | |||
| ICD-11: 2A20 | Myeloproliferative neoplasm | Click to Show/Hide | |||
| The Studied Tissue | Whole blood | ||||
| The Specified Disease | Myelofibrosis [ICD-11:2A20.2] | ||||
| The Expression Level of Disease Section Compare with the Healthy Individual Tissue | p-value: 1.23E-01; Fold-change: 6.68E-02; Z-score: 4.47E-01 | ||||
|
DME expression in the diseased tissue of patients
DME expression in the normal tissue of healthy individuals
|
|||||
| Violin Diagram of DME Disease-specific Protein Abundances |
|
Click to View the Clearer Original Diagram | |||
| The Studied Tissue | Whole blood | ||||
| The Specified Disease | Polycythemia vera [ICD-11:2A20.4] | ||||
| The Expression Level of Disease Section Compare with the Healthy Individual Tissue | p-value: 7.35E-02; Fold-change: 7.86E-02; Z-score: 5.31E-01 | ||||
|
DME expression in the diseased tissue of patients
DME expression in the normal tissue of healthy individuals
|
|||||
| Violin Diagram of DME Disease-specific Protein Abundances |
|
Click to View the Clearer Original Diagram | |||
| ICD-11: 2A36 | Myelodysplastic syndrome | Click to Show/Hide | |||
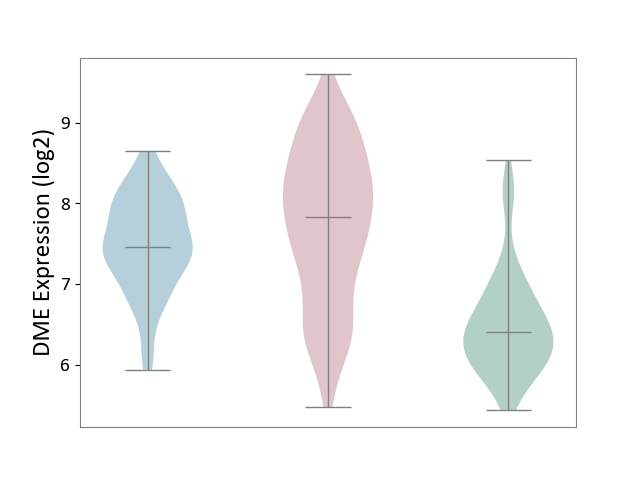
| The Studied Tissue | Bone marrow | ||||
| The Specified Disease | Myelodysplastic syndrome [ICD-11:2A36-2A3Z] | ||||
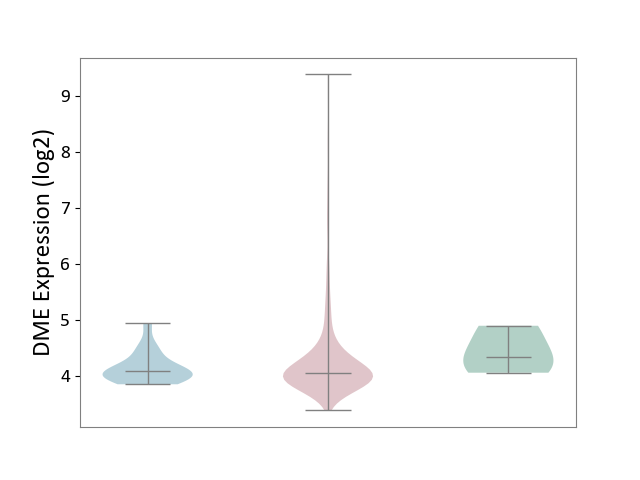
| The Expression Level of Disease Section Compare with the Healthy Individual Tissue | p-value: 7.92E-03; Fold-change: 1.81E-02; Z-score: 1.34E-01 | ||||
| The Expression Level of Disease Section Compare with the Adjacent Tissue | p-value: 3.88E-02; Fold-change: 6.84E-02; Z-score: 6.80E-01 | ||||
|
DME expression in the diseased tissue of patients
DME expression in the normal tissue adjacent to the diseased tissue of patients
DME expression in the normal tissue of healthy individuals
|
|||||
| Violin Diagram of DME Disease-specific Protein Abundances |
|
Click to View the Clearer Original Diagram | |||
| ICD-11: 2A81 | Diffuse large B-cell lymphoma | Click to Show/Hide | |||
| The Studied Tissue | Tonsil tissue | ||||
| The Specified Disease | Diffuse large B-cell lymphoma [ICD-11:2A81] | ||||
| The Expression Level of Disease Section Compare with the Healthy Individual Tissue | p-value: 7.54E-01; Fold-change: -1.25E-01; Z-score: -2.42E-01 | ||||
|
DME expression in the diseased tissue of patients
DME expression in the normal tissue of healthy individuals
|
|||||
| Violin Diagram of DME Disease-specific Protein Abundances |
|
Click to View the Clearer Original Diagram | |||
| ICD-11: 2A83 | Plasma cell neoplasm | Click to Show/Hide | |||
| The Studied Tissue | Peripheral blood | ||||
| The Specified Disease | Multiple myeloma [ICD-11:2A83.1] | ||||
| The Expression Level of Disease Section Compare with the Healthy Individual Tissue | p-value: 5.05E-01; Fold-change: -5.50E-02; Z-score: -7.63E-01 | ||||
|
DME expression in the diseased tissue of patients
DME expression in the normal tissue of healthy individuals
|
|||||
| Violin Diagram of DME Disease-specific Protein Abundances |
|
Click to View the Clearer Original Diagram | |||
| The Studied Tissue | Bone marrow | ||||
| The Specified Disease | Multiple myeloma [ICD-11:2A83.1] | ||||
| The Expression Level of Disease Section Compare with the Healthy Individual Tissue | p-value: 3.00E-06; Fold-change: 1.50E-01; Z-score: 3.20E+00 | ||||
|
DME expression in the diseased tissue of patients
DME expression in the normal tissue of healthy individuals
|
|||||
| Violin Diagram of DME Disease-specific Protein Abundances |
|
Click to View the Clearer Original Diagram | |||
| ICD-11: 2B33 | Leukaemia | Click to Show/Hide | |||
| The Studied Tissue | Bone marrow | ||||
| The Specified Disease | Acute myelocytic leukaemia [ICD-11:2B33.1] | ||||
| The Expression Level of Disease Section Compare with the Healthy Individual Tissue | p-value: 1.94E-06; Fold-change: 7.00E-02; Z-score: 4.44E-01 | ||||
|
DME expression in the diseased tissue of patients
DME expression in the normal tissue of healthy individuals
|
|||||
| Violin Diagram of DME Disease-specific Protein Abundances |
|
Click to View the Clearer Original Diagram | |||
| ICD-11: 2B6E | Oral cancer | Click to Show/Hide | |||
| The Studied Tissue | Oral tissue | ||||
| The Specified Disease | Oral cancer [ICD-11:2B6E] | ||||
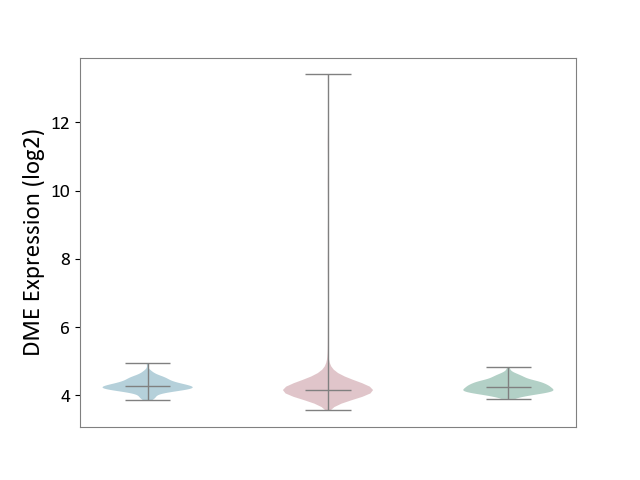
| The Expression Level of Disease Section Compare with the Healthy Individual Tissue | p-value: 1.75E-04; Fold-change: -4.29E-01; Z-score: -9.27E-01 | ||||
| The Expression Level of Disease Section Compare with the Adjacent Tissue | p-value: 2.10E-06; Fold-change: -4.51E-01; Z-score: -8.65E-01 | ||||
|
DME expression in the diseased tissue of patients
DME expression in the normal tissue adjacent to the diseased tissue of patients
DME expression in the normal tissue of healthy individuals
|
|||||
| Violin Diagram of DME Disease-specific Protein Abundances |
|
Click to View the Clearer Original Diagram | |||
| ICD-11: 2B70 | Esophageal cancer | Click to Show/Hide | |||
| The Studied Tissue | Esophagus | ||||
| The Specified Disease | Esophagal cancer [ICD-11:2B70] | ||||
| The Expression Level of Disease Section Compare with the Adjacent Tissue | p-value: 8.40E-02; Fold-change: -1.74E+00; Z-score: -1.91E+00 | ||||
|
DME expression in the diseased tissue of patients
DME expression in the normal tissue adjacent to the diseased tissue of patients
|
|||||
| Violin Diagram of DME Disease-specific Protein Abundances |
|
Click to View the Clearer Original Diagram | |||
| ICD-11: 2B72 | Stomach cancer | Click to Show/Hide | |||
| The Studied Tissue | Gastric tissue | ||||
| The Specified Disease | Gastric cancer [ICD-11:2B72] | ||||
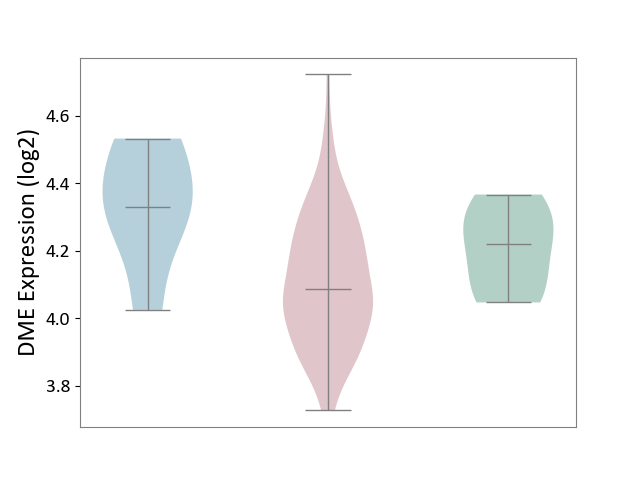
| The Expression Level of Disease Section Compare with the Healthy Individual Tissue | p-value: 5.80E-01; Fold-change: -2.76E-01; Z-score: -6.46E-01 | ||||
| The Expression Level of Disease Section Compare with the Adjacent Tissue | p-value: 1.16E-01; Fold-change: -2.77E-02; Z-score: -9.84E-02 | ||||
|
DME expression in the diseased tissue of patients
DME expression in the normal tissue adjacent to the diseased tissue of patients
DME expression in the normal tissue of healthy individuals
|
|||||
| Violin Diagram of DME Disease-specific Protein Abundances |
|
Click to View the Clearer Original Diagram | |||
| ICD-11: 2B90 | Colon cancer | Click to Show/Hide | |||
| The Studied Tissue | Colon tissue | ||||
| The Specified Disease | Colon cancer [ICD-11:2B90] | ||||
| The Expression Level of Disease Section Compare with the Healthy Individual Tissue | p-value: 4.90E-01; Fold-change: -7.63E-02; Z-score: -4.17E-01 | ||||
| The Expression Level of Disease Section Compare with the Adjacent Tissue | p-value: 6.42E-01; Fold-change: -1.05E-01; Z-score: -5.67E-01 | ||||
|
DME expression in the diseased tissue of patients
DME expression in the normal tissue adjacent to the diseased tissue of patients
DME expression in the normal tissue of healthy individuals
|
|||||
| Violin Diagram of DME Disease-specific Protein Abundances |
|
Click to View the Clearer Original Diagram | |||
| ICD-11: 2B92 | Rectal cancer | Click to Show/Hide | |||
| The Studied Tissue | Rectal colon tissue | ||||
| The Specified Disease | Rectal cancer [ICD-11:2B92] | ||||
| The Expression Level of Disease Section Compare with the Healthy Individual Tissue | p-value: 1.23E-01; Fold-change: -1.33E-01; Z-score: -1.06E+00 | ||||
| The Expression Level of Disease Section Compare with the Adjacent Tissue | p-value: 2.79E-02; Fold-change: -2.42E-01; Z-score: -1.32E+00 | ||||
|
DME expression in the diseased tissue of patients
DME expression in the normal tissue adjacent to the diseased tissue of patients
DME expression in the normal tissue of healthy individuals
|
|||||
| Violin Diagram of DME Disease-specific Protein Abundances |
|
Click to View the Clearer Original Diagram | |||
| ICD-11: 2C10 | Pancreatic cancer | Click to Show/Hide | |||
| The Studied Tissue | Pancreas | ||||
| The Specified Disease | Pancreatic cancer [ICD-11:2C10] | ||||
| The Expression Level of Disease Section Compare with the Healthy Individual Tissue | p-value: 6.21E-01; Fold-change: -4.74E-01; Z-score: -8.77E-01 | ||||
| The Expression Level of Disease Section Compare with the Adjacent Tissue | p-value: 9.72E-02; Fold-change: -5.76E-01; Z-score: -7.07E-01 | ||||
|
DME expression in the diseased tissue of patients
DME expression in the normal tissue adjacent to the diseased tissue of patients
DME expression in the normal tissue of healthy individuals
|
|||||
| Violin Diagram of DME Disease-specific Protein Abundances |
|
Click to View the Clearer Original Diagram | |||
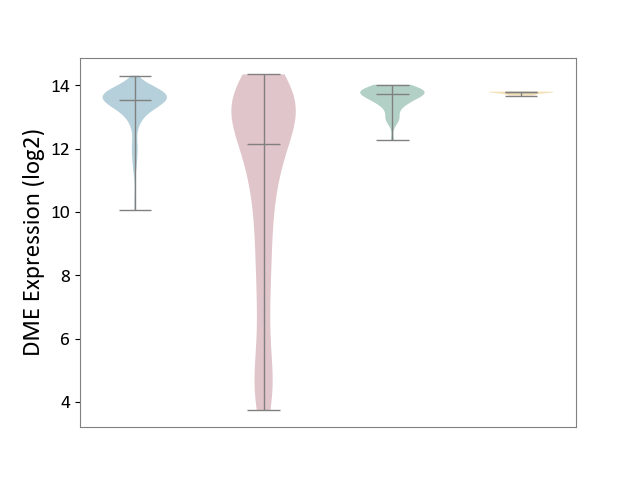
| ICD-11: 2C12 | Liver cancer | Click to Show/Hide | |||
| The Studied Tissue | Liver tissue | ||||
| The Specified Disease | Liver cancer [ICD-11:2C12.0] | ||||
| The Expression Level of Disease Section Compare with the Healthy Individual Tissue | p-value: 9.39E-47; Fold-change: -1.57E+00; Z-score: -4.16E+00 | ||||
| The Expression Level of Disease Section Compare with the Adjacent Tissue | p-value: 1.97E-42; Fold-change: -1.41E+00; Z-score: -2.10E+00 | ||||
| The Expression Level of Disease Section Compare with the Other Disease Section | p-value: 6.58E-53; Fold-change: -1.65E+00; Z-score: -2.83E+01 | ||||
|
DME expression in the diseased tissue of patients
DME expression in the normal tissue adjacent to the diseased tissue of patients
DME expression in the normal tissue of healthy individuals
DME expression in tissue other than the diseased tissue of patients
|
|||||
| Violin Diagram of DME Disease-specific Protein Abundances |
|
Click to View the Clearer Original Diagram | |||
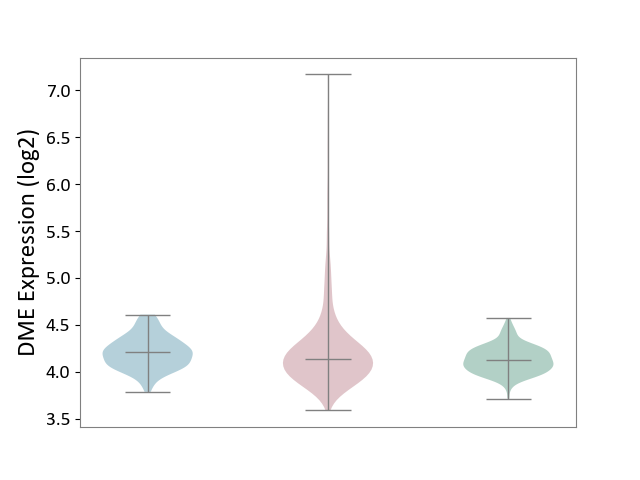
| ICD-11: 2C25 | Lung cancer | Click to Show/Hide | |||
| The Studied Tissue | Lung tissue | ||||
| The Specified Disease | Lung cancer [ICD-11:2C25] | ||||
| The Expression Level of Disease Section Compare with the Healthy Individual Tissue | p-value: 2.89E-08; Fold-change: 1.30E-02; Z-score: 8.86E-02 | ||||
| The Expression Level of Disease Section Compare with the Adjacent Tissue | p-value: 3.45E-01; Fold-change: -7.00E-02; Z-score: -4.01E-01 | ||||
|
DME expression in the diseased tissue of patients
DME expression in the normal tissue adjacent to the diseased tissue of patients
DME expression in the normal tissue of healthy individuals
|
|||||
| Violin Diagram of DME Disease-specific Protein Abundances |
|
Click to View the Clearer Original Diagram | |||
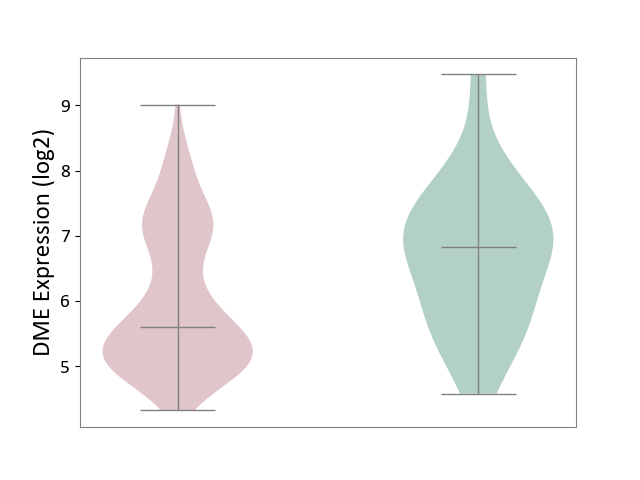
| ICD-11: 2C30 | Skin cancer | Click to Show/Hide | |||
| The Studied Tissue | Skin | ||||
| The Specified Disease | Melanoma [ICD-11:2C30] | ||||
| The Expression Level of Disease Section Compare with the Healthy Individual Tissue | p-value: 8.62E-03; Fold-change: -1.23E+00; Z-score: -1.11E+00 | ||||
|
DME expression in the diseased tissue of patients
DME expression in the normal tissue of healthy individuals
|
|||||
| Violin Diagram of DME Disease-specific Protein Abundances |
|
Click to View the Clearer Original Diagram | |||
| The Studied Tissue | Skin | ||||
| The Specified Disease | Skin cancer [ICD-11:2C30-2C3Z] | ||||
| The Expression Level of Disease Section Compare with the Healthy Individual Tissue | p-value: 1.22E-57; Fold-change: -1.11E+00; Z-score: -1.79E+00 | ||||
| The Expression Level of Disease Section Compare with the Adjacent Tissue | p-value: 1.49E-69; Fold-change: -1.75E+00; Z-score: -2.33E+00 | ||||
|
DME expression in the diseased tissue of patients
DME expression in the normal tissue adjacent to the diseased tissue of patients
DME expression in the normal tissue of healthy individuals
|
|||||
| Violin Diagram of DME Disease-specific Protein Abundances |
|
Click to View the Clearer Original Diagram | |||
| ICD-11: 2C6Z | Breast cancer | Click to Show/Hide | |||
| The Studied Tissue | Breast tissue | ||||
| The Specified Disease | Breast cancer [ICD-11:2C60-2C6Z] | ||||
| The Expression Level of Disease Section Compare with the Healthy Individual Tissue | p-value: 1.91E-13; Fold-change: 6.46E-02; Z-score: 3.30E-01 | ||||
| The Expression Level of Disease Section Compare with the Adjacent Tissue | p-value: 3.13E-01; Fold-change: 3.66E-02; Z-score: 8.92E-02 | ||||
|
DME expression in the diseased tissue of patients
DME expression in the normal tissue adjacent to the diseased tissue of patients
DME expression in the normal tissue of healthy individuals
|
|||||
| Violin Diagram of DME Disease-specific Protein Abundances |
|
Click to View the Clearer Original Diagram | |||
| ICD-11: 2C73 | Ovarian cancer | Click to Show/Hide | |||
| The Studied Tissue | Ovarian tissue | ||||
| The Specified Disease | Ovarian cancer [ICD-11:2C73] | ||||
| The Expression Level of Disease Section Compare with the Healthy Individual Tissue | p-value: 8.79E-01; Fold-change: -8.17E-02; Z-score: -6.97E-01 | ||||
| The Expression Level of Disease Section Compare with the Adjacent Tissue | p-value: 9.02E-01; Fold-change: 8.84E-03; Z-score: 2.07E-02 | ||||
|
DME expression in the diseased tissue of patients
DME expression in the normal tissue adjacent to the diseased tissue of patients
DME expression in the normal tissue of healthy individuals
|
|||||
| Violin Diagram of DME Disease-specific Protein Abundances |
|
Click to View the Clearer Original Diagram | |||
| ICD-11: 2C77 | Cervical cancer | Click to Show/Hide | |||
| The Studied Tissue | Cervical tissue | ||||
| The Specified Disease | Cervical cancer [ICD-11:2C77] | ||||
| The Expression Level of Disease Section Compare with the Healthy Individual Tissue | p-value: 5.26E-01; Fold-change: -5.53E-02; Z-score: -1.23E-01 | ||||
|
DME expression in the diseased tissue of patients
DME expression in the normal tissue of healthy individuals
|
|||||
| Violin Diagram of DME Disease-specific Protein Abundances |
|
Click to View the Clearer Original Diagram | |||
| ICD-11: 2C78 | Uterine cancer | Click to Show/Hide | |||
| The Studied Tissue | Endometrium tissue | ||||
| The Specified Disease | Uterine cancer [ICD-11:2C78] | ||||
| The Expression Level of Disease Section Compare with the Healthy Individual Tissue | p-value: 2.23E-02; Fold-change: -4.31E-02; Z-score: -1.51E-01 | ||||
| The Expression Level of Disease Section Compare with the Adjacent Tissue | p-value: 1.89E-01; Fold-change: -3.50E-01; Z-score: -1.06E+00 | ||||
|
DME expression in the diseased tissue of patients
DME expression in the normal tissue adjacent to the diseased tissue of patients
DME expression in the normal tissue of healthy individuals
|
|||||
| Violin Diagram of DME Disease-specific Protein Abundances |
|
Click to View the Clearer Original Diagram | |||
| ICD-11: 2C82 | Prostate cancer | Click to Show/Hide | |||
| The Studied Tissue | Prostate | ||||
| The Specified Disease | Prostate cancer [ICD-11:2C82] | ||||
| The Expression Level of Disease Section Compare with the Healthy Individual Tissue | p-value: 1.17E-01; Fold-change: 1.32E-01; Z-score: 3.15E-01 | ||||
|
DME expression in the diseased tissue of patients
DME expression in the normal tissue of healthy individuals
|
|||||
| Violin Diagram of DME Disease-specific Protein Abundances |
|
Click to View the Clearer Original Diagram | |||
| ICD-11: 2C90 | Renal cancer | Click to Show/Hide | |||
| The Studied Tissue | Kidney | ||||
| The Specified Disease | Renal cancer [ICD-11:2C90-2C91] | ||||
| The Expression Level of Disease Section Compare with the Healthy Individual Tissue | p-value: 1.32E-02; Fold-change: -4.14E-01; Z-score: -8.77E-01 | ||||
| The Expression Level of Disease Section Compare with the Adjacent Tissue | p-value: 8.28E-04; Fold-change: -1.99E-01; Z-score: -2.73E-01 | ||||
|
DME expression in the diseased tissue of patients
DME expression in the normal tissue adjacent to the diseased tissue of patients
DME expression in the normal tissue of healthy individuals
|
|||||
| Violin Diagram of DME Disease-specific Protein Abundances |
|
Click to View the Clearer Original Diagram | |||
| ICD-11: 2C92 | Ureter cancer | Click to Show/Hide | |||
| The Studied Tissue | Urothelium | ||||
| The Specified Disease | Ureter cancer [ICD-11:2C92] | ||||
| The Expression Level of Disease Section Compare with the Healthy Individual Tissue | p-value: 9.16E-01; Fold-change: 1.52E-02; Z-score: 1.17E-01 | ||||
|
DME expression in the diseased tissue of patients
DME expression in the normal tissue of healthy individuals
|
|||||
| Violin Diagram of DME Disease-specific Protein Abundances |
|
Click to View the Clearer Original Diagram | |||
| ICD-11: 2C94 | Bladder cancer | Click to Show/Hide | |||
| The Studied Tissue | Bladder tissue | ||||
| The Specified Disease | Bladder cancer [ICD-11:2C94] | ||||
| The Expression Level of Disease Section Compare with the Healthy Individual Tissue | p-value: 7.05E-02; Fold-change: 2.24E-01; Z-score: 7.74E-01 | ||||
|
DME expression in the diseased tissue of patients
DME expression in the normal tissue of healthy individuals
|
|||||
| Violin Diagram of DME Disease-specific Protein Abundances |
|
Click to View the Clearer Original Diagram | |||
| ICD-11: 2D02 | Retinal cancer | Click to Show/Hide | |||
| The Studied Tissue | Uvea | ||||
| The Specified Disease | Retinoblastoma [ICD-11:2D02.2] | ||||
| The Expression Level of Disease Section Compare with the Healthy Individual Tissue | p-value: 6.71E-04; Fold-change: -7.97E-01; Z-score: -2.83E+00 | ||||
|
DME expression in the diseased tissue of patients
DME expression in the normal tissue of healthy individuals
|
|||||
| Violin Diagram of DME Disease-specific Protein Abundances |
|
Click to View the Clearer Original Diagram | |||
| ICD-11: 2D10 | Thyroid cancer | Click to Show/Hide | |||
| The Studied Tissue | Thyroid | ||||
| The Specified Disease | Thyroid cancer [ICD-11:2D10] | ||||
| The Expression Level of Disease Section Compare with the Healthy Individual Tissue | p-value: 2.92E-10; Fold-change: 9.21E-02; Z-score: 5.56E-01 | ||||
| The Expression Level of Disease Section Compare with the Adjacent Tissue | p-value: 1.25E-01; Fold-change: 7.57E-03; Z-score: 4.97E-02 | ||||
|
DME expression in the diseased tissue of patients
DME expression in the normal tissue adjacent to the diseased tissue of patients
DME expression in the normal tissue of healthy individuals
|
|||||
| Violin Diagram of DME Disease-specific Protein Abundances |
|
Click to View the Clearer Original Diagram | |||
| ICD-11: 2D11 | Adrenal cancer | Click to Show/Hide | |||
| The Studied Tissue | Adrenal cortex | ||||
| The Specified Disease | Adrenocortical carcinoma [ICD-11:2D11.Z] | ||||
| The Expression Level of Disease Section Compare with the Other Disease Section | p-value: 7.30E-01; Fold-change: -7.79E-02; Z-score: -5.92E-01 | ||||
|
DME expression in the diseased tissue of patients
DME expression in tissue other than the diseased tissue of patients
|
|||||
| Violin Diagram of DME Disease-specific Protein Abundances |
|
Click to View the Clearer Original Diagram | |||
| ICD-11: 2D12 | Endocrine gland neoplasm | Click to Show/Hide | |||
| The Studied Tissue | Pituitary tissue | ||||
| The Specified Disease | Pituitary cancer [ICD-11:2D12] | ||||
| The Expression Level of Disease Section Compare with the Healthy Individual Tissue | p-value: 1.81E-04; Fold-change: 3.83E-01; Z-score: 2.11E+00 | ||||
|
DME expression in the diseased tissue of patients
DME expression in the normal tissue of healthy individuals
|
|||||
| Violin Diagram of DME Disease-specific Protein Abundances |
|
Click to View the Clearer Original Diagram | |||
| The Studied Tissue | Pituitary tissue | ||||
| The Specified Disease | Pituitary gonadotrope tumour [ICD-11:2D12] | ||||
| The Expression Level of Disease Section Compare with the Healthy Individual Tissue | p-value: 4.01E-04; Fold-change: 3.85E-01; Z-score: 1.98E+00 | ||||
|
DME expression in the diseased tissue of patients
DME expression in the normal tissue of healthy individuals
|
|||||
| Violin Diagram of DME Disease-specific Protein Abundances |
|
Click to View the Clearer Original Diagram | |||
| ICD-11: 2D42 | Head and neck cancer | Click to Show/Hide | |||
| The Studied Tissue | Head and neck tissue | ||||
| The Specified Disease | Head and neck cancer [ICD-11:2D42] | ||||
| The Expression Level of Disease Section Compare with the Healthy Individual Tissue | p-value: 3.00E-04; Fold-change: -1.73E-01; Z-score: -1.17E-01 | ||||
|
DME expression in the diseased tissue of patients
DME expression in the normal tissue of healthy individuals
|
|||||
| Violin Diagram of DME Disease-specific Protein Abundances |
|
Click to View the Clearer Original Diagram | |||
| ICD Disease Classification 03 | Blood/blood-forming organ disease | Click to Show/Hide | |||
| ICD-11: 3A51 | Sickle cell disorder | Click to Show/Hide | |||
| The Studied Tissue | Peripheral blood | ||||
| The Specified Disease | Sickle cell disease [ICD-11:3A51.0-3A51.3] | ||||
| The Expression Level of Disease Section Compare with the Healthy Individual Tissue | p-value: 9.47E-01; Fold-change: 2.86E-02; Z-score: 1.47E-01 | ||||
|
DME expression in the diseased tissue of patients
DME expression in the normal tissue of healthy individuals
|
|||||
| Violin Diagram of DME Disease-specific Protein Abundances |
|
Click to View the Clearer Original Diagram | |||
| ICD-11: 3A70 | Aplastic anaemia | Click to Show/Hide | |||
| The Studied Tissue | Bone marrow | ||||
| The Specified Disease | Shwachman-Diamond syndrome [ICD-11:3A70.0] | ||||
| The Expression Level of Disease Section Compare with the Healthy Individual Tissue | p-value: 7.80E-01; Fold-change: 3.68E-03; Z-score: 3.41E-02 | ||||
|
DME expression in the diseased tissue of patients
DME expression in the normal tissue of healthy individuals
|
|||||
| Violin Diagram of DME Disease-specific Protein Abundances |
|
Click to View the Clearer Original Diagram | |||
| ICD-11: 3B63 | Thrombocytosis | Click to Show/Hide | |||
| The Studied Tissue | Whole blood | ||||
| The Specified Disease | Thrombocythemia [ICD-11:3B63] | ||||
| The Expression Level of Disease Section Compare with the Healthy Individual Tissue | p-value: 3.45E-01; Fold-change: 5.71E-02; Z-score: 4.18E-01 | ||||
|
DME expression in the diseased tissue of patients
DME expression in the normal tissue of healthy individuals
|
|||||
| Violin Diagram of DME Disease-specific Protein Abundances |
|
Click to View the Clearer Original Diagram | |||
| ICD-11: 3B64 | Thrombocytopenia | Click to Show/Hide | |||
| The Studied Tissue | Whole blood | ||||
| The Specified Disease | Thrombocytopenia [ICD-11:3B64] | ||||
| The Expression Level of Disease Section Compare with the Healthy Individual Tissue | p-value: 7.57E-01; Fold-change: 3.09E-01; Z-score: 6.23E-01 | ||||
|
DME expression in the diseased tissue of patients
DME expression in the normal tissue of healthy individuals
|
|||||
| Violin Diagram of DME Disease-specific Protein Abundances |
|
Click to View the Clearer Original Diagram | |||
| ICD Disease Classification 04 | Immune system disease | Click to Show/Hide | |||
| ICD-11: 4A00 | Immunodeficiency | Click to Show/Hide | |||
| The Studied Tissue | Peripheral blood | ||||
| The Specified Disease | Immunodeficiency [ICD-11:4A00-4A20] | ||||
| The Expression Level of Disease Section Compare with the Healthy Individual Tissue | p-value: 7.78E-02; Fold-change: -8.42E-02; Z-score: -4.31E-01 | ||||
|
DME expression in the diseased tissue of patients
DME expression in the normal tissue of healthy individuals
|
|||||
| Violin Diagram of DME Disease-specific Protein Abundances |
|
Click to View the Clearer Original Diagram | |||
| ICD-11: 4A40 | Lupus erythematosus | Click to Show/Hide | |||
| The Studied Tissue | Whole blood | ||||
| The Specified Disease | Lupus erythematosus [ICD-11:4A40] | ||||
| The Expression Level of Disease Section Compare with the Healthy Individual Tissue | p-value: 3.35E-07; Fold-change: -1.38E-01; Z-score: -4.68E-01 | ||||
|
DME expression in the diseased tissue of patients
DME expression in the normal tissue of healthy individuals
|
|||||
| Violin Diagram of DME Disease-specific Protein Abundances |
|
Click to View the Clearer Original Diagram | |||
| ICD-11: 4A42 | Systemic sclerosis | Click to Show/Hide | |||
| The Studied Tissue | Whole blood | ||||
| The Specified Disease | Scleroderma [ICD-11:4A42.Z] | ||||
| The Expression Level of Disease Section Compare with the Healthy Individual Tissue | p-value: 1.30E-02; Fold-change: 1.39E-01; Z-score: 1.09E+00 | ||||
|
DME expression in the diseased tissue of patients
DME expression in the normal tissue of healthy individuals
|
|||||
| Violin Diagram of DME Disease-specific Protein Abundances |
|
Click to View the Clearer Original Diagram | |||
| ICD-11: 4A43 | Systemic autoimmune disease | Click to Show/Hide | |||
| The Studied Tissue | Salivary gland tissue | ||||
| The Specified Disease | Sjogren's syndrome [ICD-11:4A43.2] | ||||
| The Expression Level of Disease Section Compare with the Healthy Individual Tissue | p-value: 3.21E-01; Fold-change: 5.69E-03; Z-score: 1.17E-01 | ||||
| The Expression Level of Disease Section Compare with the Adjacent Tissue | p-value: 1.10E-02; Fold-change: -2.05E-01; Z-score: -6.81E+00 | ||||
|
DME expression in the diseased tissue of patients
DME expression in the normal tissue adjacent to the diseased tissue of patients
DME expression in the normal tissue of healthy individuals
|
|||||
| Violin Diagram of DME Disease-specific Protein Abundances |
|
Click to View the Clearer Original Diagram | |||
| ICD-11: 4A62 | Behcet disease | Click to Show/Hide | |||
| The Studied Tissue | Peripheral blood | ||||
| The Specified Disease | Behcet's disease [ICD-11:4A62] | ||||
| The Expression Level of Disease Section Compare with the Healthy Individual Tissue | p-value: 5.63E-01; Fold-change: -4.80E-02; Z-score: -2.52E-01 | ||||
|
DME expression in the diseased tissue of patients
DME expression in the normal tissue of healthy individuals
|
|||||
| Violin Diagram of DME Disease-specific Protein Abundances |
|
Click to View the Clearer Original Diagram | |||
| ICD-11: 4B04 | Monocyte count disorder | Click to Show/Hide | |||
| The Studied Tissue | Whole blood | ||||
| The Specified Disease | Autosomal dominant monocytopenia [ICD-11:4B04] | ||||
| The Expression Level of Disease Section Compare with the Healthy Individual Tissue | p-value: 5.41E-01; Fold-change: 1.29E-03; Z-score: 1.14E-02 | ||||
|
DME expression in the diseased tissue of patients
DME expression in the normal tissue of healthy individuals
|
|||||
| Violin Diagram of DME Disease-specific Protein Abundances |
|
Click to View the Clearer Original Diagram | |||
| ICD Disease Classification 05 | Endocrine/nutritional/metabolic disease | Click to Show/Hide | |||
| ICD-11: 5A11 | Type 2 diabetes mellitus | Click to Show/Hide | |||
| The Studied Tissue | Omental adipose tissue | ||||
| The Specified Disease | Obesity related type 2 diabetes [ICD-11:5A11] | ||||
| The Expression Level of Disease Section Compare with the Healthy Individual Tissue | p-value: 4.89E-02; Fold-change: 6.41E-02; Z-score: 6.54E-01 | ||||
|
DME expression in the diseased tissue of patients
DME expression in the normal tissue of healthy individuals
|
|||||
| Violin Diagram of DME Disease-specific Protein Abundances |
|
Click to View the Clearer Original Diagram | |||
| The Studied Tissue | Liver tissue | ||||
| The Specified Disease | Type 2 diabetes [ICD-11:5A11] | ||||
| The Expression Level of Disease Section Compare with the Healthy Individual Tissue | p-value: 2.66E-01; Fold-change: 1.02E-01; Z-score: 8.88E-01 | ||||
|
DME expression in the diseased tissue of patients
DME expression in the normal tissue of healthy individuals
|
|||||
| Violin Diagram of DME Disease-specific Protein Abundances |
|
Click to View the Clearer Original Diagram | |||
| ICD-11: 5A80 | Ovarian dysfunction | Click to Show/Hide | |||
| The Studied Tissue | Vastus lateralis muscle | ||||
| The Specified Disease | Polycystic ovary syndrome [ICD-11:5A80.1] | ||||
| The Expression Level of Disease Section Compare with the Healthy Individual Tissue | p-value: 2.40E-01; Fold-change: -1.36E-01; Z-score: -7.48E-01 | ||||
|
DME expression in the diseased tissue of patients
DME expression in the normal tissue of healthy individuals
|
|||||
| Violin Diagram of DME Disease-specific Protein Abundances |
|
Click to View the Clearer Original Diagram | |||
| ICD-11: 5C51 | Inborn carbohydrate metabolism disorder | Click to Show/Hide | |||
| The Studied Tissue | Biceps muscle | ||||
| The Specified Disease | Pompe disease [ICD-11:5C51.3] | ||||
| The Expression Level of Disease Section Compare with the Healthy Individual Tissue | p-value: 2.42E-01; Fold-change: 4.17E-02; Z-score: 7.85E-01 | ||||
|
DME expression in the diseased tissue of patients
DME expression in the normal tissue of healthy individuals
|
|||||
| Violin Diagram of DME Disease-specific Protein Abundances |
|
Click to View the Clearer Original Diagram | |||
| ICD-11: 5C56 | Lysosomal disease | Click to Show/Hide | |||
| The Studied Tissue | Whole blood | ||||
| The Specified Disease | Batten disease [ICD-11:5C56.1] | ||||
| The Expression Level of Disease Section Compare with the Healthy Individual Tissue | p-value: 1.99E-01; Fold-change: 1.42E-01; Z-score: 7.62E-01 | ||||
|
DME expression in the diseased tissue of patients
DME expression in the normal tissue of healthy individuals
|
|||||
| Violin Diagram of DME Disease-specific Protein Abundances |
|
Click to View the Clearer Original Diagram | |||
| ICD-11: 5C80 | Hyperlipoproteinaemia | Click to Show/Hide | |||
| The Studied Tissue | Peripheral blood | ||||
| The Specified Disease | Familial hypercholesterolemia [ICD-11:5C80.00] | ||||
| The Expression Level of Disease Section Compare with the Healthy Individual Tissue | p-value: 3.39E-01; Fold-change: 6.30E-02; Z-score: 4.51E-01 | ||||
|
DME expression in the diseased tissue of patients
DME expression in the normal tissue of healthy individuals
|
|||||
| Violin Diagram of DME Disease-specific Protein Abundances |
|
Click to View the Clearer Original Diagram | |||
| The Studied Tissue | Whole blood | ||||
| The Specified Disease | Familial hypercholesterolemia [ICD-11:5C80.00] | ||||
| The Expression Level of Disease Section Compare with the Healthy Individual Tissue | p-value: 1.03E-01; Fold-change: -6.60E-02; Z-score: -4.09E-01 | ||||
|
DME expression in the diseased tissue of patients
DME expression in the normal tissue of healthy individuals
|
|||||
| Violin Diagram of DME Disease-specific Protein Abundances |
|
Click to View the Clearer Original Diagram | |||
| ICD Disease Classification 06 | Mental/behavioural/neurodevelopmental disorder | Click to Show/Hide | |||
| ICD-11: 6A02 | Autism spectrum disorder | Click to Show/Hide | |||
| The Studied Tissue | Whole blood | ||||
| The Specified Disease | Autism [ICD-11:6A02] | ||||
| The Expression Level of Disease Section Compare with the Healthy Individual Tissue | p-value: 3.43E-01; Fold-change: 1.27E-02; Z-score: 5.63E-02 | ||||
|
DME expression in the diseased tissue of patients
DME expression in the normal tissue of healthy individuals
|
|||||
| Violin Diagram of DME Disease-specific Protein Abundances |
|
Click to View the Clearer Original Diagram | |||
| ICD-11: 6A20 | Schizophrenia | Click to Show/Hide | |||
| The Studied Tissue | Prefrontal cortex | ||||
| The Specified Disease | Schizophrenia [ICD-11:6A20] | ||||
| The Expression Level of Disease Section Compare with the Healthy Individual Tissue | p-value: 4.20E-02; Fold-change: -1.71E-01; Z-score: -3.15E-01 | ||||
|
DME expression in the diseased tissue of patients
DME expression in the normal tissue of healthy individuals
|
|||||
| Violin Diagram of DME Disease-specific Protein Abundances |
|
Click to View the Clearer Original Diagram | |||
| The Studied Tissue | Superior temporal cortex | ||||
| The Specified Disease | Schizophrenia [ICD-11:6A20] | ||||
| The Expression Level of Disease Section Compare with the Healthy Individual Tissue | p-value: 3.07E-01; Fold-change: -2.23E-02; Z-score: -1.46E-01 | ||||
|
DME expression in the diseased tissue of patients
DME expression in the normal tissue of healthy individuals
|
|||||
| Violin Diagram of DME Disease-specific Protein Abundances |

|
Click to View the Clearer Original Diagram | |||
| ICD-11: 6A60 | Bipolar disorder | Click to Show/Hide | |||
| The Studied Tissue | Prefrontal cortex | ||||
| The Specified Disease | Bipolar disorder [ICD-11:6A60-6A6Z] | ||||
| The Expression Level of Disease Section Compare with the Healthy Individual Tissue | p-value: 4.85E-01; Fold-change: -6.88E-02; Z-score: -1.64E-01 | ||||
|
DME expression in the diseased tissue of patients
DME expression in the normal tissue of healthy individuals
|
|||||
| Violin Diagram of DME Disease-specific Protein Abundances |
|
Click to View the Clearer Original Diagram | |||
| ICD-11: 6A70 | Depressive disorder | Click to Show/Hide | |||
| The Studied Tissue | Whole blood | ||||
| The Specified Disease | Major depressive disorder [ICD-11:6A70-6A7Z] | ||||
| The Expression Level of Disease Section Compare with the Healthy Individual Tissue | p-value: 1.11E-01; Fold-change: -4.77E-02; Z-score: -2.68E-01 | ||||
|
DME expression in the diseased tissue of patients
DME expression in the normal tissue of healthy individuals
|
|||||
| Violin Diagram of DME Disease-specific Protein Abundances |
|
Click to View the Clearer Original Diagram | |||
| The Studied Tissue | Hippocampus | ||||
| The Specified Disease | Major depressive disorder [ICD-11:6A70-6A7Z] | ||||
| The Expression Level of Disease Section Compare with the Healthy Individual Tissue | p-value: 9.06E-01; Fold-change: -5.05E-02; Z-score: -1.20E-01 | ||||
|
DME expression in the diseased tissue of patients
DME expression in the normal tissue of healthy individuals
|
|||||
| Violin Diagram of DME Disease-specific Protein Abundances |
|
Click to View the Clearer Original Diagram | |||
| ICD Disease Classification 08 | Nervous system disease | Click to Show/Hide | |||
| ICD-11: 8A00 | Parkinsonism | Click to Show/Hide | |||
| The Studied Tissue | Substantia nigra tissue | ||||
| The Specified Disease | Parkinson's disease [ICD-11:8A00.0] | ||||
| The Expression Level of Disease Section Compare with the Healthy Individual Tissue | p-value: 9.45E-02; Fold-change: -1.86E-01; Z-score: -9.83E-01 | ||||
|
DME expression in the diseased tissue of patients
DME expression in the normal tissue of healthy individuals
|
|||||
| Violin Diagram of DME Disease-specific Protein Abundances |
|
Click to View the Clearer Original Diagram | |||
| ICD-11: 8A01 | Choreiform disorder | Click to Show/Hide | |||
| The Studied Tissue | Whole blood | ||||
| The Specified Disease | Huntington's disease [ICD-11:8A01.10] | ||||
| The Expression Level of Disease Section Compare with the Healthy Individual Tissue | p-value: 9.81E-02; Fold-change: 1.10E-01; Z-score: 1.38E+00 | ||||
|
DME expression in the diseased tissue of patients
DME expression in the normal tissue of healthy individuals
|
|||||
| Violin Diagram of DME Disease-specific Protein Abundances |
|
Click to View the Clearer Original Diagram | |||
| ICD-11: 8A20 | Alzheimer disease | Click to Show/Hide | |||
| The Studied Tissue | Entorhinal cortex | ||||
| The Specified Disease | Alzheimer's disease [ICD-11:8A20] | ||||
| The Expression Level of Disease Section Compare with the Healthy Individual Tissue | p-value: 1.87E-04; Fold-change: -1.20E-01; Z-score: -3.22E-01 | ||||
|
DME expression in the diseased tissue of patients
DME expression in the normal tissue of healthy individuals
|
|||||
| Violin Diagram of DME Disease-specific Protein Abundances |

|
Click to View the Clearer Original Diagram | |||
| ICD-11: 8A2Y | Neurocognitive impairment | Click to Show/Hide | |||
| The Studied Tissue | White matter tissue | ||||
| The Specified Disease | HIV-associated neurocognitive impairment [ICD-11:8A2Y-8A2Z] | ||||
| The Expression Level of Disease Section Compare with the Healthy Individual Tissue | p-value: 4.67E-02; Fold-change: -1.16E-01; Z-score: -5.42E-01 | ||||
|
DME expression in the diseased tissue of patients
DME expression in the normal tissue of healthy individuals
|
|||||
| Violin Diagram of DME Disease-specific Protein Abundances |
|
Click to View the Clearer Original Diagram | |||
| ICD-11: 8A40 | Multiple sclerosis | Click to Show/Hide | |||
| The Studied Tissue | Plasmacytoid dendritic cells | ||||
| The Specified Disease | Multiple sclerosis [ICD-11:8A40] | ||||
| The Expression Level of Disease Section Compare with the Healthy Individual Tissue | p-value: 7.75E-01; Fold-change: -1.76E-01; Z-score: -6.23E-01 | ||||
|
DME expression in the diseased tissue of patients
DME expression in the normal tissue of healthy individuals
|
|||||
| Violin Diagram of DME Disease-specific Protein Abundances |
|
Click to View the Clearer Original Diagram | |||
| The Studied Tissue | Spinal cord | ||||
| The Specified Disease | Multiple sclerosis [ICD-11:8A40] | ||||
| The Expression Level of Disease Section Compare with the Adjacent Tissue | p-value: 9.13E-01; Fold-change: -1.05E-01; Z-score: -5.07E-01 | ||||
|
DME expression in the diseased tissue of patients
DME expression in the normal tissue adjacent to the diseased tissue of patients
|
|||||
| Violin Diagram of DME Disease-specific Protein Abundances |
|
Click to View the Clearer Original Diagram | |||
| ICD-11: 8A60 | Epilepsy | Click to Show/Hide | |||
| The Studied Tissue | Peritumoral cortex tissue | ||||
| The Specified Disease | Epilepsy [ICD-11:8A60-8A6Z] | ||||
| The Expression Level of Disease Section Compare with the Other Disease Section | p-value: 5.73E-01; Fold-change: 1.25E-01; Z-score: 6.28E-01 | ||||
|
DME expression in the diseased tissue of patients
DME expression in tissue other than the diseased tissue of patients
|
|||||
| Violin Diagram of DME Disease-specific Protein Abundances |
|
Click to View the Clearer Original Diagram | |||
| The Studied Tissue | Whole blood | ||||
| The Specified Disease | Seizure [ICD-11:8A60-8A6Z] | ||||
| The Expression Level of Disease Section Compare with the Healthy Individual Tissue | p-value: 6.09E-01; Fold-change: 3.19E-02; Z-score: 2.34E-01 | ||||
|
DME expression in the diseased tissue of patients
DME expression in the normal tissue of healthy individuals
|
|||||
| Violin Diagram of DME Disease-specific Protein Abundances |
|
Click to View the Clearer Original Diagram | |||
| ICD-11: 8B01 | Subarachnoid haemorrhage | Click to Show/Hide | |||
| The Studied Tissue | Intracranial artery | ||||
| The Specified Disease | Intracranial aneurysm [ICD-11:8B01.0] | ||||
| The Expression Level of Disease Section Compare with the Healthy Individual Tissue | p-value: 2.77E-02; Fold-change: 2.60E-01; Z-score: 1.25E+00 | ||||
|
DME expression in the diseased tissue of patients
DME expression in the normal tissue of healthy individuals
|
|||||
| Violin Diagram of DME Disease-specific Protein Abundances |
|
Click to View the Clearer Original Diagram | |||
| ICD-11: 8B11 | Cerebral ischaemic stroke | Click to Show/Hide | |||
| The Studied Tissue | Whole blood | ||||
| The Specified Disease | Cardioembolic stroke [ICD-11:8B11.20] | ||||
| The Expression Level of Disease Section Compare with the Healthy Individual Tissue | p-value: 2.47E-02; Fold-change: -1.94E-01; Z-score: -4.51E-01 | ||||
|
DME expression in the diseased tissue of patients
DME expression in the normal tissue of healthy individuals
|
|||||
| Violin Diagram of DME Disease-specific Protein Abundances |
|
Click to View the Clearer Original Diagram | |||
| The Studied Tissue | Peripheral blood | ||||
| The Specified Disease | Ischemic stroke [ICD-11:8B11] | ||||
| The Expression Level of Disease Section Compare with the Healthy Individual Tissue | p-value: 2.81E-01; Fold-change: 6.10E-02; Z-score: 4.21E-01 | ||||
|
DME expression in the diseased tissue of patients
DME expression in the normal tissue of healthy individuals
|
|||||
| Violin Diagram of DME Disease-specific Protein Abundances |
|
Click to View the Clearer Original Diagram | |||
| ICD-11: 8B60 | Motor neuron disease | Click to Show/Hide | |||
| The Studied Tissue | Skin | ||||
| The Specified Disease | Lateral sclerosis [ICD-11:8B60.4] | ||||
| The Expression Level of Disease Section Compare with the Healthy Individual Tissue | p-value: 5.68E-01; Fold-change: 6.40E-02; Z-score: 1.83E-01 | ||||
|
DME expression in the diseased tissue of patients
DME expression in the normal tissue of healthy individuals
|
|||||
| Violin Diagram of DME Disease-specific Protein Abundances |
|
Click to View the Clearer Original Diagram | |||
| The Studied Tissue | Cervical spinal cord | ||||
| The Specified Disease | Lateral sclerosis [ICD-11:8B60.4] | ||||
| The Expression Level of Disease Section Compare with the Healthy Individual Tissue | p-value: 1.09E-02; Fold-change: -3.26E-01; Z-score: -1.59E+00 | ||||
|
DME expression in the diseased tissue of patients
DME expression in the normal tissue of healthy individuals
|
|||||
| Violin Diagram of DME Disease-specific Protein Abundances |
|
Click to View the Clearer Original Diagram | |||
| ICD-11: 8C70 | Muscular dystrophy | Click to Show/Hide | |||
| The Studied Tissue | Muscle tissue | ||||
| The Specified Disease | Myopathy [ICD-11:8C70.6] | ||||
| The Expression Level of Disease Section Compare with the Healthy Individual Tissue | p-value: 6.47E-02; Fold-change: -1.23E-01; Z-score: -8.37E-01 | ||||
|
DME expression in the diseased tissue of patients
DME expression in the normal tissue of healthy individuals
|
|||||
| Violin Diagram of DME Disease-specific Protein Abundances |
|
Click to View the Clearer Original Diagram | |||
| ICD-11: 8C75 | Distal myopathy | Click to Show/Hide | |||
| The Studied Tissue | Muscle tissue | ||||
| The Specified Disease | Tibial muscular dystrophy [ICD-11:8C75] | ||||
| The Expression Level of Disease Section Compare with the Healthy Individual Tissue | p-value: 2.22E-03; Fold-change: -3.12E-01; Z-score: -1.39E+00 | ||||
|
DME expression in the diseased tissue of patients
DME expression in the normal tissue of healthy individuals
|
|||||
| Violin Diagram of DME Disease-specific Protein Abundances |
|
Click to View the Clearer Original Diagram | |||
| ICD Disease Classification 09 | Visual system disease | Click to Show/Hide | |||
| ICD-11: 9A96 | Anterior uveitis | Click to Show/Hide | |||
| The Studied Tissue | Peripheral monocyte | ||||
| The Specified Disease | Autoimmune uveitis [ICD-11:9A96] | ||||
| The Expression Level of Disease Section Compare with the Healthy Individual Tissue | p-value: 8.61E-01; Fold-change: 9.52E-03; Z-score: 1.13E-01 | ||||
|
DME expression in the diseased tissue of patients
DME expression in the normal tissue of healthy individuals
|
|||||
| Violin Diagram of DME Disease-specific Protein Abundances |
|
Click to View the Clearer Original Diagram | |||
| ICD Disease Classification 11 | Circulatory system disease | Click to Show/Hide | |||
| ICD-11: BA41 | Myocardial infarction | Click to Show/Hide | |||
| The Studied Tissue | Peripheral blood | ||||
| The Specified Disease | Myocardial infarction [ICD-11:BA41-BA50] | ||||
| The Expression Level of Disease Section Compare with the Healthy Individual Tissue | p-value: 2.66E-04; Fold-change: -1.04E+00; Z-score: -7.59E-01 | ||||
|
DME expression in the diseased tissue of patients
DME expression in the normal tissue of healthy individuals
|
|||||
| Violin Diagram of DME Disease-specific Protein Abundances |
|
Click to View the Clearer Original Diagram | |||
| ICD-11: BA80 | Coronary artery disease | Click to Show/Hide | |||
| The Studied Tissue | Peripheral blood | ||||
| The Specified Disease | Coronary artery disease [ICD-11:BA80-BA8Z] | ||||
| The Expression Level of Disease Section Compare with the Healthy Individual Tissue | p-value: 8.63E-01; Fold-change: -3.68E-02; Z-score: -3.33E-01 | ||||
|
DME expression in the diseased tissue of patients
DME expression in the normal tissue of healthy individuals
|
|||||
| Violin Diagram of DME Disease-specific Protein Abundances |
|
Click to View the Clearer Original Diagram | |||
| ICD-11: BB70 | Aortic valve stenosis | Click to Show/Hide | |||
| The Studied Tissue | Calcified aortic valve | ||||
| The Specified Disease | Aortic stenosis [ICD-11:BB70] | ||||
| The Expression Level of Disease Section Compare with the Healthy Individual Tissue | p-value: 6.13E-01; Fold-change: 2.68E-01; Z-score: 5.32E-01 | ||||
|
DME expression in the diseased tissue of patients
DME expression in the normal tissue of healthy individuals
|
|||||
| Violin Diagram of DME Disease-specific Protein Abundances |
|
Click to View the Clearer Original Diagram | |||
| ICD Disease Classification 12 | Respiratory system disease | Click to Show/Hide | |||
| ICD-11: 7A40 | Central sleep apnoea | Click to Show/Hide | |||
| The Studied Tissue | Hyperplastic tonsil | ||||
| The Specified Disease | Apnea [ICD-11:7A40] | ||||
| The Expression Level of Disease Section Compare with the Healthy Individual Tissue | p-value: 9.79E-02; Fold-change: 4.92E-01; Z-score: 1.27E+00 | ||||
|
DME expression in the diseased tissue of patients
DME expression in the normal tissue of healthy individuals
|
|||||
| Violin Diagram of DME Disease-specific Protein Abundances |
|
Click to View the Clearer Original Diagram | |||
| ICD-11: CA08 | Vasomotor or allergic rhinitis | Click to Show/Hide | |||
| The Studied Tissue | Peripheral blood | ||||
| The Specified Disease | Olive pollen allergy [ICD-11:CA08.00] | ||||
| The Expression Level of Disease Section Compare with the Healthy Individual Tissue | p-value: 4.71E-01; Fold-change: 2.46E-02; Z-score: 1.78E-01 | ||||
|
DME expression in the diseased tissue of patients
DME expression in the normal tissue of healthy individuals
|
|||||
| Violin Diagram of DME Disease-specific Protein Abundances |
|
Click to View the Clearer Original Diagram | |||
| ICD-11: CA0A | Chronic rhinosinusitis | Click to Show/Hide | |||
| The Studied Tissue | Sinus mucosa tissue | ||||
| The Specified Disease | Chronic rhinosinusitis [ICD-11:CA0A] | ||||
| The Expression Level of Disease Section Compare with the Healthy Individual Tissue | p-value: 6.73E-01; Fold-change: -1.48E-02; Z-score: -1.31E-01 | ||||
|
DME expression in the diseased tissue of patients
DME expression in the normal tissue of healthy individuals
|
|||||
| Violin Diagram of DME Disease-specific Protein Abundances |
|
Click to View the Clearer Original Diagram | |||
| ICD-11: CA22 | Chronic obstructive pulmonary disease | Click to Show/Hide | |||
| The Studied Tissue | Lung tissue | ||||
| The Specified Disease | Chronic obstructive pulmonary disease [ICD-11:CA22] | ||||
| The Expression Level of Disease Section Compare with the Healthy Individual Tissue | p-value: 7.08E-01; Fold-change: 3.02E-02; Z-score: 1.71E-01 | ||||
|
DME expression in the diseased tissue of patients
DME expression in the normal tissue of healthy individuals
|
|||||
| Violin Diagram of DME Disease-specific Protein Abundances |
|
Click to View the Clearer Original Diagram | |||
| The Studied Tissue | Small airway epithelium | ||||
| The Specified Disease | Chronic obstructive pulmonary disease [ICD-11:CA22] | ||||
| The Expression Level of Disease Section Compare with the Healthy Individual Tissue | p-value: 9.24E-01; Fold-change: -8.81E-03; Z-score: -4.67E-02 | ||||
|
DME expression in the diseased tissue of patients
DME expression in the normal tissue of healthy individuals
|
|||||
| Violin Diagram of DME Disease-specific Protein Abundances |
|
Click to View the Clearer Original Diagram | |||
| ICD-11: CA23 | Asthma | Click to Show/Hide | |||
| The Studied Tissue | Nasal and bronchial airway | ||||
| The Specified Disease | Asthma [ICD-11:CA23] | ||||
| The Expression Level of Disease Section Compare with the Healthy Individual Tissue | p-value: 2.10E-04; Fold-change: 1.44E-01; Z-score: 2.04E-01 | ||||
|
DME expression in the diseased tissue of patients
DME expression in the normal tissue of healthy individuals
|
|||||
| Violin Diagram of DME Disease-specific Protein Abundances |
|
Click to View the Clearer Original Diagram | |||
| ICD-11: CB03 | Idiopathic interstitial pneumonitis | Click to Show/Hide | |||
| The Studied Tissue | Lung tissue | ||||
| The Specified Disease | Idiopathic pulmonary fibrosis [ICD-11:CB03.4] | ||||
| The Expression Level of Disease Section Compare with the Healthy Individual Tissue | p-value: 8.20E-01; Fold-change: 3.19E-02; Z-score: 1.66E-01 | ||||
|
DME expression in the diseased tissue of patients
DME expression in the normal tissue of healthy individuals
|
|||||
| Violin Diagram of DME Disease-specific Protein Abundances |
|
Click to View the Clearer Original Diagram | |||
| ICD Disease Classification 13 | Digestive system disease | Click to Show/Hide | |||
| ICD-11: DA0C | Periodontal disease | Click to Show/Hide | |||
| The Studied Tissue | Gingival tissue | ||||
| The Specified Disease | Periodontal disease [ICD-11:DA0C] | ||||
| The Expression Level of Disease Section Compare with the Adjacent Tissue | p-value: 5.58E-01; Fold-change: 4.81E-02; Z-score: 9.30E-02 | ||||
|
DME expression in the diseased tissue of patients
DME expression in the normal tissue adjacent to the diseased tissue of patients
|
|||||
| Violin Diagram of DME Disease-specific Protein Abundances |
|
Click to View the Clearer Original Diagram | |||
| ICD-11: DA42 | Gastritis | Click to Show/Hide | |||
| The Studied Tissue | Gastric antrum tissue | ||||
| The Specified Disease | Eosinophilic gastritis [ICD-11:DA42.2] | ||||
| The Expression Level of Disease Section Compare with the Adjacent Tissue | p-value: 7.62E-02; Fold-change: 9.64E-01; Z-score: 4.21E+00 | ||||
|
DME expression in the diseased tissue of patients
DME expression in the normal tissue adjacent to the diseased tissue of patients
|
|||||
| Violin Diagram of DME Disease-specific Protein Abundances |
|
Click to View the Clearer Original Diagram | |||
| ICD-11: DB92 | Non-alcoholic fatty liver disease | Click to Show/Hide | |||
| The Studied Tissue | Liver tissue | ||||
| The Specified Disease | Non-alcoholic fatty liver disease [ICD-11:DB92] | ||||
| The Expression Level of Disease Section Compare with the Healthy Individual Tissue | p-value: 1.39E-01; Fold-change: 9.57E-02; Z-score: 2.29E-01 | ||||
|
DME expression in the diseased tissue of patients
DME expression in the normal tissue of healthy individuals
|
|||||
| Violin Diagram of DME Disease-specific Protein Abundances |
|
Click to View the Clearer Original Diagram | |||
| ICD-11: DB99 | Hepatic failure | Click to Show/Hide | |||
| The Studied Tissue | Liver tissue | ||||
| The Specified Disease | Liver failure [ICD-11:DB99.7-DB99.8] | ||||
| The Expression Level of Disease Section Compare with the Healthy Individual Tissue | p-value: 1.45E-02; Fold-change: -4.32E+00; Z-score: -9.91E+00 | ||||
|
DME expression in the diseased tissue of patients
DME expression in the normal tissue of healthy individuals
|
|||||
| Violin Diagram of DME Disease-specific Protein Abundances |
|
Click to View the Clearer Original Diagram | |||
| ICD-11: DD71 | Ulcerative colitis | Click to Show/Hide | |||
| The Studied Tissue | Colon mucosal tissue | ||||
| The Specified Disease | Ulcerative colitis [ICD-11:DD71] | ||||
| The Expression Level of Disease Section Compare with the Adjacent Tissue | p-value: 6.97E-01; Fold-change: -1.39E-02; Z-score: -4.20E-02 | ||||
|
DME expression in the diseased tissue of patients
DME expression in tissue other than the diseased tissue of patients
|
|||||
| Violin Diagram of DME Disease-specific Protein Abundances |
|
Click to View the Clearer Original Diagram | |||
| ICD-11: DD91 | Irritable bowel syndrome | Click to Show/Hide | |||
| The Studied Tissue | Rectal colon tissue | ||||
| The Specified Disease | Irritable bowel syndrome [ICD-11:DD91.0] | ||||
| The Expression Level of Disease Section Compare with the Healthy Individual Tissue | p-value: 5.24E-01; Fold-change: 3.23E-02; Z-score: 1.59E-01 | ||||
|
DME expression in the diseased tissue of patients
DME expression in the normal tissue of healthy individuals
|
|||||
| Violin Diagram of DME Disease-specific Protein Abundances |
|
Click to View the Clearer Original Diagram | |||
| ICD Disease Classification 14 | Skin disease | Click to Show/Hide | |||
| ICD-11: EA80 | Atopic eczema | Click to Show/Hide | |||
| The Studied Tissue | Skin | ||||
| The Specified Disease | Atopic dermatitis [ICD-11:EA80] | ||||
| The Expression Level of Disease Section Compare with the Healthy Individual Tissue | p-value: 2.85E-01; Fold-change: 6.79E-02; Z-score: 1.57E-01 | ||||
|
DME expression in the diseased tissue of patients
DME expression in the normal tissue of healthy individuals
|
|||||
| Violin Diagram of DME Disease-specific Protein Abundances |
|
Click to View the Clearer Original Diagram | |||
| ICD-11: EA90 | Psoriasis | Click to Show/Hide | |||
| The Studied Tissue | Skin | ||||
| The Specified Disease | Psoriasis [ICD-11:EA90] | ||||
| The Expression Level of Disease Section Compare with the Healthy Individual Tissue | p-value: 1.05E-32; Fold-change: 1.42E+00; Z-score: 2.27E+00 | ||||
| The Expression Level of Disease Section Compare with the Adjacent Tissue | p-value: 7.68E-03; Fold-change: 3.70E-01; Z-score: 6.32E-01 | ||||
|
DME expression in the diseased tissue of patients
DME expression in the normal tissue adjacent to the diseased tissue of patients
DME expression in the normal tissue of healthy individuals
|
|||||
| Violin Diagram of DME Disease-specific Protein Abundances |
|
Click to View the Clearer Original Diagram | |||
| ICD-11: ED63 | Acquired hypomelanotic disorder | Click to Show/Hide | |||
| The Studied Tissue | Skin | ||||
| The Specified Disease | Vitiligo [ICD-11:ED63.0] | ||||
| The Expression Level of Disease Section Compare with the Healthy Individual Tissue | p-value: 5.98E-01; Fold-change: 9.63E-02; Z-score: 1.38E-01 | ||||
|
DME expression in the diseased tissue of patients
DME expression in the normal tissue of healthy individuals
|
|||||
| Violin Diagram of DME Disease-specific Protein Abundances |
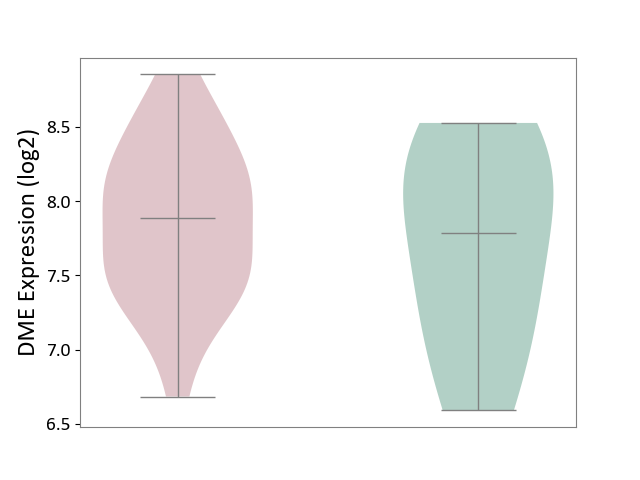
|
Click to View the Clearer Original Diagram | |||
| ICD-11: ED70 | Alopecia or hair loss | Click to Show/Hide | |||
| The Studied Tissue | Skin from scalp | ||||
| The Specified Disease | Alopecia [ICD-11:ED70] | ||||
| The Expression Level of Disease Section Compare with the Healthy Individual Tissue | p-value: 4.19E-05; Fold-change: 4.85E-01; Z-score: 1.06E+00 | ||||
|
DME expression in the diseased tissue of patients
DME expression in the normal tissue of healthy individuals
|
|||||
| Violin Diagram of DME Disease-specific Protein Abundances |
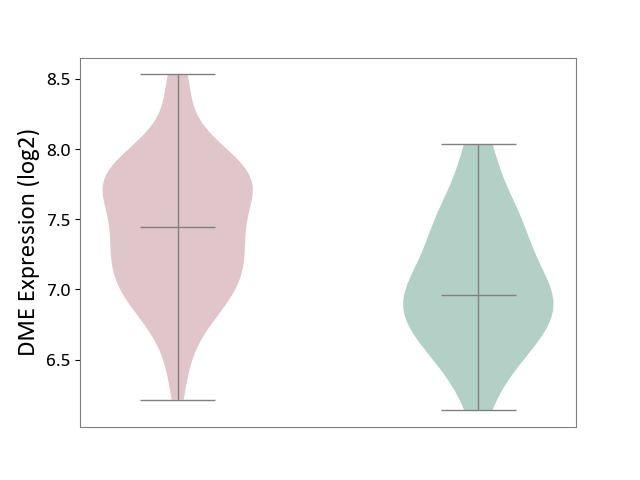
|
Click to View the Clearer Original Diagram | |||
| ICD-11: EK0Z | Contact dermatitis | Click to Show/Hide | |||
| The Studied Tissue | Skin | ||||
| The Specified Disease | Sensitive skin [ICD-11:EK0Z] | ||||
| The Expression Level of Disease Section Compare with the Healthy Individual Tissue | p-value: 6.49E-01; Fold-change: 3.07E-01; Z-score: 7.84E-01 | ||||
|
DME expression in the diseased tissue of patients
DME expression in the normal tissue of healthy individuals
|
|||||
| Violin Diagram of DME Disease-specific Protein Abundances |
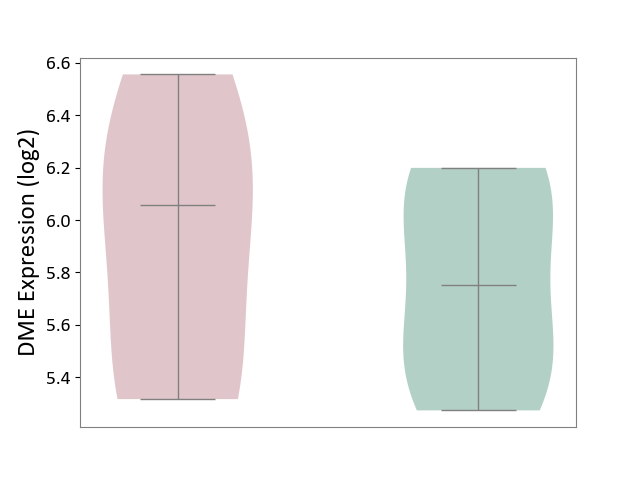
|
Click to View the Clearer Original Diagram | |||
| ICD Disease Classification 15 | Musculoskeletal system/connective tissue disease | Click to Show/Hide | |||
| ICD-11: FA00 | Osteoarthritis | Click to Show/Hide | |||
| The Studied Tissue | Peripheral blood | ||||
| The Specified Disease | Arthropathy [ICD-11:FA00-FA5Z] | ||||
| The Expression Level of Disease Section Compare with the Healthy Individual Tissue | p-value: 2.65E-01; Fold-change: 1.91E-02; Z-score: 1.45E-01 | ||||
|
DME expression in the diseased tissue of patients
DME expression in the normal tissue of healthy individuals
|
|||||
| Violin Diagram of DME Disease-specific Protein Abundances |
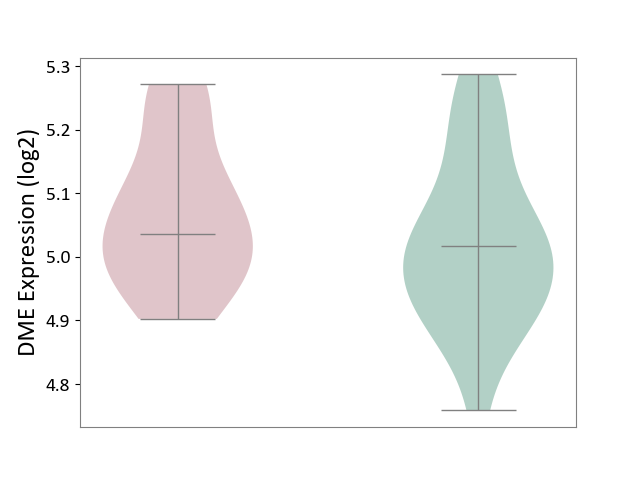
|
Click to View the Clearer Original Diagram | |||
| The Studied Tissue | Synovial tissue | ||||
| The Specified Disease | Osteoarthritis [ICD-11:FA00-FA0Z] | ||||
| The Expression Level of Disease Section Compare with the Healthy Individual Tissue | p-value: 2.40E-01; Fold-change: 2.81E-02; Z-score: 1.36E-01 | ||||
|
DME expression in the diseased tissue of patients
DME expression in the normal tissue of healthy individuals
|
|||||
| Violin Diagram of DME Disease-specific Protein Abundances |
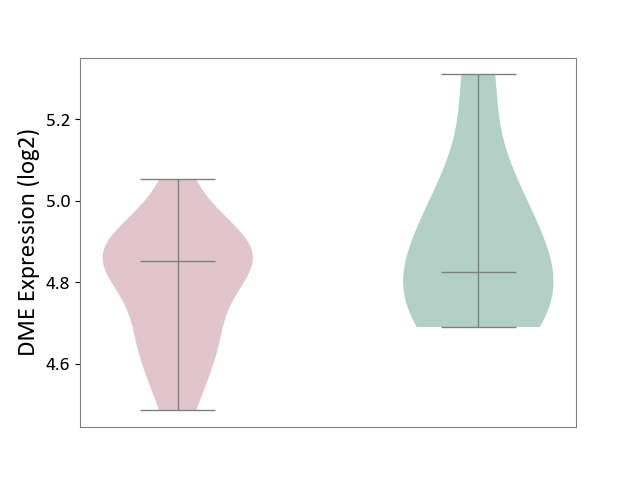
|
Click to View the Clearer Original Diagram | |||
| ICD-11: FA20 | Rheumatoid arthritis | Click to Show/Hide | |||
| The Studied Tissue | Peripheral blood | ||||
| The Specified Disease | Childhood onset rheumatic disease [ICD-11:FA20.Z] | ||||
| The Expression Level of Disease Section Compare with the Healthy Individual Tissue | p-value: 9.59E-01; Fold-change: 2.47E-02; Z-score: 1.23E-01 | ||||
|
DME expression in the diseased tissue of patients
DME expression in the normal tissue of healthy individuals
|
|||||
| Violin Diagram of DME Disease-specific Protein Abundances |
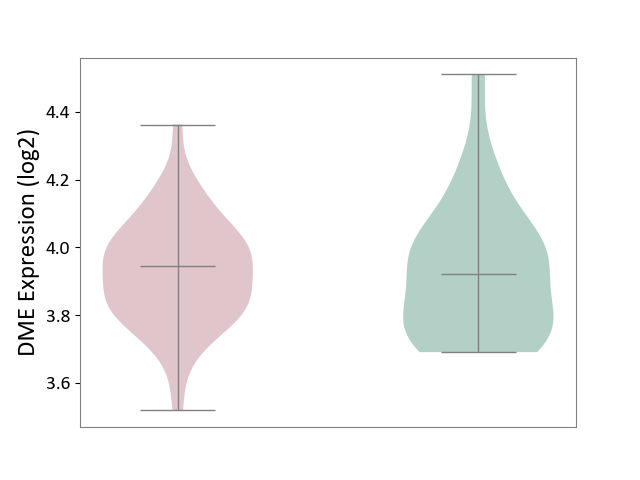
|
Click to View the Clearer Original Diagram | |||
| The Studied Tissue | Synovial tissue | ||||
| The Specified Disease | Rheumatoid arthritis [ICD-11:FA20] | ||||
| The Expression Level of Disease Section Compare with the Healthy Individual Tissue | p-value: 8.69E-01; Fold-change: 6.50E-02; Z-score: 1.78E-01 | ||||
|
DME expression in the diseased tissue of patients
DME expression in the normal tissue of healthy individuals
|
|||||
| Violin Diagram of DME Disease-specific Protein Abundances |
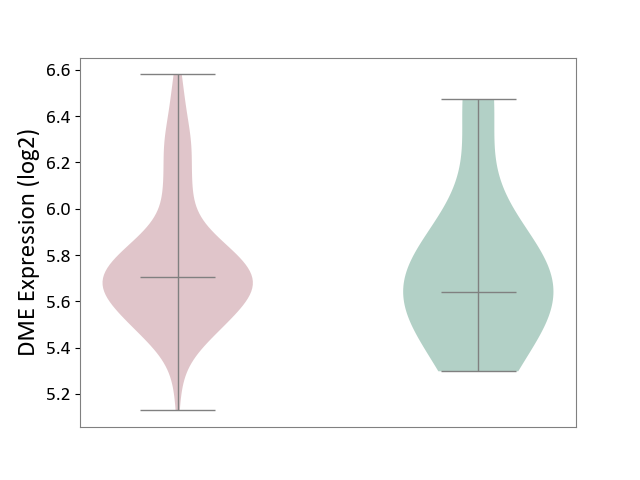
|
Click to View the Clearer Original Diagram | |||
| ICD-11: FA24 | Juvenile idiopathic arthritis | Click to Show/Hide | |||
| The Studied Tissue | Peripheral blood | ||||
| The Specified Disease | Juvenile idiopathic arthritis [ICD-11:FA24] | ||||
| The Expression Level of Disease Section Compare with the Healthy Individual Tissue | p-value: 9.53E-10; Fold-change: -2.24E-01; Z-score: -9.26E-01 | ||||
|
DME expression in the diseased tissue of patients
DME expression in the normal tissue of healthy individuals
|
|||||
| Violin Diagram of DME Disease-specific Protein Abundances |
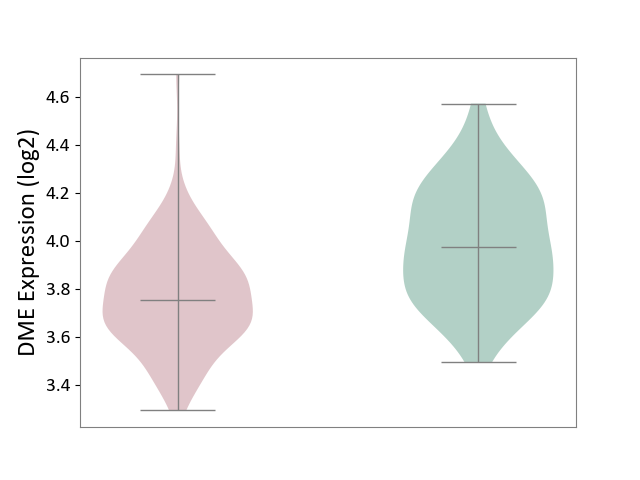
|
Click to View the Clearer Original Diagram | |||
| ICD-11: FA92 | Inflammatory spondyloarthritis | Click to Show/Hide | |||
| The Studied Tissue | Pheripheral blood | ||||
| The Specified Disease | Ankylosing spondylitis [ICD-11:FA92.0Z] | ||||
| The Expression Level of Disease Section Compare with the Healthy Individual Tissue | p-value: 2.60E-01; Fold-change: -2.35E-03; Z-score: -2.74E-02 | ||||
|
DME expression in the diseased tissue of patients
DME expression in the normal tissue of healthy individuals
|
|||||
| Violin Diagram of DME Disease-specific Protein Abundances |
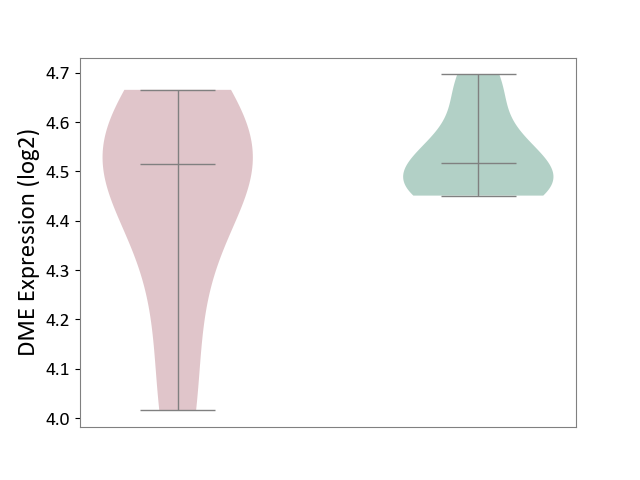
|
Click to View the Clearer Original Diagram | |||
| ICD-11: FB83 | Low bone mass disorder | Click to Show/Hide | |||
| The Studied Tissue | Bone marrow | ||||
| The Specified Disease | Osteoporosis [ICD-11:FB83.1] | ||||
| The Expression Level of Disease Section Compare with the Healthy Individual Tissue | p-value: 8.24E-01; Fold-change: -9.91E-02; Z-score: -3.60E-01 | ||||
|
DME expression in the diseased tissue of patients
DME expression in the normal tissue of healthy individuals
|
|||||
| Violin Diagram of DME Disease-specific Protein Abundances |
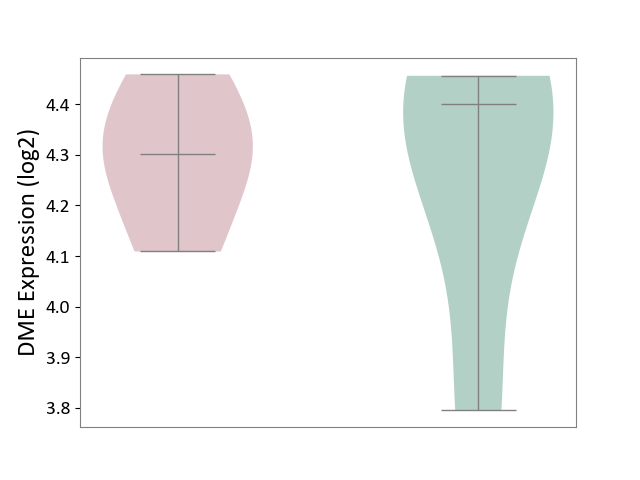
|
Click to View the Clearer Original Diagram | |||
| ICD Disease Classification 16 | Genitourinary system disease | Click to Show/Hide | |||
| ICD-11: GA10 | Endometriosis | Click to Show/Hide | |||
| The Studied Tissue | Endometrium tissue | ||||
| The Specified Disease | Endometriosis [ICD-11:GA10] | ||||
| The Expression Level of Disease Section Compare with the Healthy Individual Tissue | p-value: 4.20E-01; Fold-change: 3.70E-02; Z-score: 1.62E-01 | ||||
|
DME expression in the diseased tissue of patients
DME expression in the normal tissue of healthy individuals
|
|||||
| Violin Diagram of DME Disease-specific Protein Abundances |
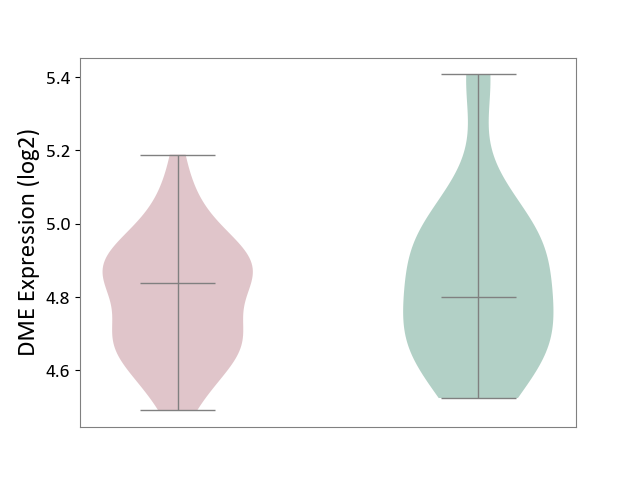
|
Click to View the Clearer Original Diagram | |||
| ICD-11: GC00 | Cystitis | Click to Show/Hide | |||
| The Studied Tissue | Bladder tissue | ||||
| The Specified Disease | Interstitial cystitis [ICD-11:GC00.3] | ||||
| The Expression Level of Disease Section Compare with the Healthy Individual Tissue | p-value: 3.09E-02; Fold-change: 1.49E-01; Z-score: 9.86E-01 | ||||
|
DME expression in the diseased tissue of patients
DME expression in the normal tissue of healthy individuals
|
|||||
| Violin Diagram of DME Disease-specific Protein Abundances |
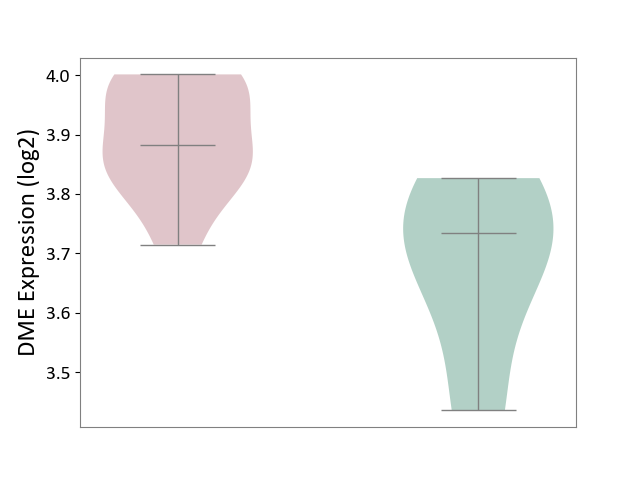
|
Click to View the Clearer Original Diagram | |||
| ICD Disease Classification 19 | Condition originating in perinatal period | Click to Show/Hide | |||
| ICD-11: KA21 | Short gestation disorder | Click to Show/Hide | |||
| The Studied Tissue | Myometrium | ||||
| The Specified Disease | Preterm birth [ICD-11:KA21.4Z] | ||||
| The Expression Level of Disease Section Compare with the Healthy Individual Tissue | p-value: 5.12E-01; Fold-change: -6.02E-02; Z-score: -3.95E-01 | ||||
|
DME expression in the diseased tissue of patients
DME expression in the normal tissue of healthy individuals
|
|||||
| Violin Diagram of DME Disease-specific Protein Abundances |
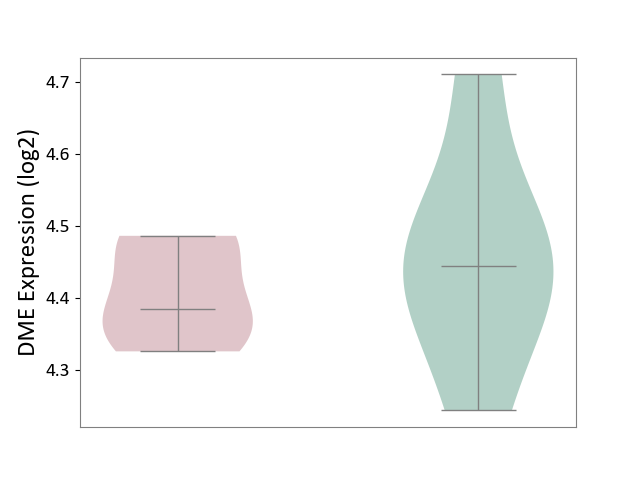
|
Click to View the Clearer Original Diagram | |||
| ICD Disease Classification 20 | Developmental anomaly | Click to Show/Hide | |||
| ICD-11: LD2C | Overgrowth syndrome | Click to Show/Hide | |||
| The Studied Tissue | Adipose tissue | ||||
| The Specified Disease | Simpson golabi behmel syndrome [ICD-11:LD2C] | ||||
| The Expression Level of Disease Section Compare with the Healthy Individual Tissue | p-value: 8.00E-01; Fold-change: 3.44E-02; Z-score: 3.24E-01 | ||||
|
DME expression in the diseased tissue of patients
DME expression in the normal tissue of healthy individuals
|
|||||
| Violin Diagram of DME Disease-specific Protein Abundances |

|
Click to View the Clearer Original Diagram | |||
| ICD-11: LD2D | Phakomatoses/hamartoneoplastic syndrome | Click to Show/Hide | |||
| The Studied Tissue | Perituberal tissue | ||||
| The Specified Disease | Tuberous sclerosis complex [ICD-11:LD2D.2] | ||||
| The Expression Level of Disease Section Compare with the Healthy Individual Tissue | p-value: 8.64E-02; Fold-change: -5.71E-01; Z-score: -1.32E+00 | ||||
|
DME expression in the diseased tissue of patients
DME expression in the normal tissue of healthy individuals
|
|||||
| Violin Diagram of DME Disease-specific Protein Abundances |
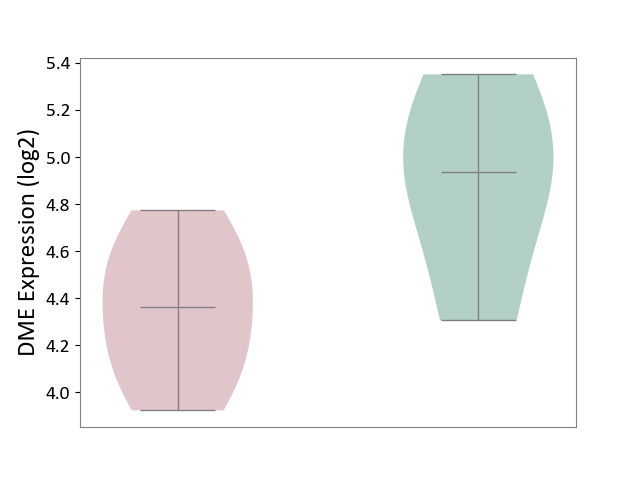
|
Click to View the Clearer Original Diagram | |||
| References | |||||
|---|---|---|---|---|---|
| 1 | Substrates, inducers, inhibitors and structure-activity relationships of human Cytochrome P450 2C9 and implications in drug development. Curr Med Chem. 2009;16(27):3480-675. | ||||
| 2 | Validation of bupropion hydroxylation as a selective marker of human cytochrome P450 2B6 catalytic activity. Drug Metab Dispos. 2000 Oct;28(10):1222-30. | ||||
| 3 | Genotoxicity of tamoxifen, tamoxifen epoxide and toremifene in human lymphoblastoid cells containing human cytochrome P450s. Carcinogenesis. 1994 Jan;15(1):5-9. | ||||
| 4 | Metabolism and pharmacokinetics of novel selective vascular endothelial growth factor receptor-2 inhibitor apatinib in humans | ||||
| 5 | Novel metabolic pathway of estrone and 17beta-estradiol catalyzed by cytochrome P-450. Drug Metab Dispos. 2000 Feb;28(2):110-2. | ||||
| 6 | Effects of nicotine on cytochrome P450 2A6 and 2E1 activities. Br J Clin Pharmacol. 2010 Feb;69(2):152-9. | ||||
| 7 | Metabolic Profiles of Propofol and Fospropofol: Clinical and Forensic Interpretative Aspects | ||||
| 8 | DrugBank(Pharmacology-Metabolism):Almogran | ||||
| 9 | U. S. FDA Label -Almogran | ||||
| 10 | Cytochrome P450-Catalyzed Metabolism of Cannabidiol to the Active Metabolite 7-Hydroxy-Cannabidiol Drug Metab Dispos. 2021 Oct;49(10):882-891. doi: 10.1124/dmd.120.000350. | ||||
| 11 | Metabolism of capsaicin by cytochrome P450 produces novel dehydrogenated metabolites and decreases cytotoxicity to lung and liver cells. Chem Res Toxicol. 2003 Mar;16(3):336-49. | ||||
| 12 | DrugBank(Pharmacology-Metabolism):Ifosfamide | ||||
| 13 | Identification of the human liver enzymes involved in the metabolism of the antimigraine agent almotriptan. Drug Metab Dispos. 2003 Apr;31(4):404-11. | ||||
| 14 | Identification of the human P-450 enzymes responsible for the sulfoxidation and thiono-oxidation of diethyldithiocarbamate methyl ester: role of P-450 enzymes in disulfiram bioactivation Alcohol Clin Exp Res. 1998 Sep;22(6):1212-9. | ||||
| 15 | Inhibition of CYP2E1 catalytic activity in vitro by S-adenosyl-L-methionine. Biochem Pharmacol. 2005 Apr 1;69(7):1081-93. | ||||
| 16 | In vitro characterization of the human biotransformation and CYP reaction phenotype of ET-743 (Yondelis, Trabectidin), a novel marine anti-cancer drug. Invest New Drugs. 2006 Jan;24(1):3-14. | ||||
| 17 | Antidepressant drugs in the elderly--role of the cytochrome P450 2D6. World J Biol Psychiatry. 2003 Apr;4(2):74-80. | ||||
| 18 | Concordance between trifluoroacetic acid and hepatic protein trifluoroacetylation after disulfiram inhibition of halothane metabolism in rats. Acta Anaesthesiol Scand. 2003 Jul;47(6):765-70. | ||||
| 19 | CYP2E1 active site residues in substrate recognition sequence 5 identified by photoaffinity labeling and homology modeling. Arch Biochem Biophys. 2007 Mar 1;459(1):59-69. | ||||
| 20 | In vitro identification of the human cytochrome P450 enzymes involved in the metabolism of R(+)- and S(-)-carvedilol. Drug Metab Dispos. 1997 Aug;25(8):970-7. | ||||
| 21 | Identification of human cytochrome P450 and flavin-containing monooxygenase enzymes involved in the metabolism of lorcaserin, a novel selective human 5-hydroxytryptamine 2C agonist. Drug Metab Dispos. 2012 Apr;40(4):761-71. | ||||
| 22 | Characterization of the cytochrome P450 enzymes involved in the in vitro metabolism of dolasetron. Comparison with other indole-containing 5-HT3 antagonists. Drug Metab Dispos. 1996 May;24(5):602-9. | ||||
| 23 | Summary of information on human CYP enzymes: human P450 metabolism data. Drug Metab Rev. 2002 Feb-May;34(1-2):83-448. | ||||
| 24 | Five distinct human cytochromes mediate amitriptyline N-demethylation in vitro: dominance of CYP 2C19 and 3A4. J Clin Pharmacol. 1998 Feb;38(2):112-21. | ||||
| 25 | FDA label of Cenobamate. The 2020 official website of the U.S. Food and Drug Administration. | ||||
| 26 | Metabolic stability and determination of cytochrome P450 isoenzymes' contribution to the metabolism of medetomidine in dog liver microsomes. Biomed Chromatogr. 2010 Aug;24(8):868-77. | ||||
| 27 | Substrates, inducers, inhibitors and structure-activity relationships of human Cytochrome P450 2C9 and implications in drug development Curr Med Chem. 2009;16(27):3480-675. doi: 10.2174/092986709789057635. | ||||
| 28 | In vitro metabolism of quinidine: the (3S)-3-hydroxylation of quinidine is a specific marker reaction for cytochrome P-4503A4 activity in human liver microsomes. J Pharmacol Exp Ther. 1999 Apr;289(1):31-7. | ||||
| 29 | Eszopiclone, a nonbenzodiazepine sedative-hypnotic agent for the treatment of transient and chronic insomnia. Clin Ther. 2006 Apr;28(4):491-516. | ||||
| 30 | Characterization of the cytochrome P450 enzymes involved in the in vitro metabolism of ethosuximide by human hepatic microsomal enzymes. Xenobiotica. 2003 Mar;33(3):265-76. | ||||
| 31 | CYP4F enzymes are responsible for the elimination of fingolimod (FTY720), a novel treatment of relapsing multiple sclerosis. Drug Metab Dispos. 2011 Feb;39(2):191-8. | ||||
| 32 | Modulation of ethanol-mediated CYP2E1 induction by clofibrate and L-carnitine in rat liver. Biol Pharm Bull. 1993 Dec;16(12):1240-3. | ||||
| 33 | CYP2C19 polymorphism effect on phenobarbitone. Pharmacokinetics in Japanese patients with epilepsy: analysis by population pharmacokinetics Eur J Clin Pharmacol. 2000 Feb-Mar;55(11-12):821-5. doi: 10.1007/s002280050703. | ||||
| 34 | Inhibition of cytochrome P450 2E1 by propofol in human and porcine liver microsomes. Biochem Pharmacol. 2002 Oct 1;64(7):1151-6. | ||||
| 35 | Construction and assessment of models of CYP2E1: predictions of metabolism from docking, molecular dynamics, and density functional theoretical calculations. J Med Chem. 2003 Apr 24;46(9):1645-60. | ||||
| 36 | Effect of disulfiram-mediated CYP2E1 inhibition on the disposition of vesnarinone | ||||
| 37 | Acetaminophen induced acute liver failure via oxidative stress and JNK activation: protective role of taurine by the suppression of cytochrome P450 2E1. Free Radic Res. 2010 Mar;44(3):340-55. | ||||
| 38 | More methemoglobin is produced by benzocaine treatment than lidocaine treatment in human in vitro systems | ||||
| 39 | Cytochrome P450 2E1 null mice provide novel protection against cisplatin-induced nephrotoxicity and apoptosis. Kidney Int. 2003 May;63(5):1687-96. | ||||
| 40 | A study on the metabolism of etoposide and possible interactions with antitumor or supporting agents by human liver microsomes. J Pharmacol Exp Ther. 1998 Sep;286(3):1294-300. | ||||
| 41 | N-demethylation of levo-alpha-acetylmethadol by human placental aromatase. Biochem Pharmacol. 2004 Mar 1;67(5):885-92. | ||||
| 42 | Role of specific cytochrome P450 enzymes in the N-oxidation of the antiarrhythmic agent mexiletine. Xenobiotica. 2003 Jan;33(1):13-25. | ||||
| 43 | Effects of olopatadine, a new antiallergic agent, on human liver microsomal cytochrome P450 activities Drug Metab Dispos. 2002 Dec;30(12):1504-11. doi: 10.1124/dmd.30.12.1504. | ||||
| 44 | Phenobarbital induces monkey brain CYP2E1 protein but not hepatic CYP2E1, in vitro or in vivo chlorzoxazone metabolism. Eur J Pharmacol. 2006 Dec 15;552(1-3):151-8. | ||||
| 45 | Drug Interactions with Angiotensin Receptor Blockers: Role of Human Cytochromes P450 | ||||
| 46 | Lithium Intoxication in the Elderly: A Possible Interaction between Azilsartan, Fluvoxamine, and Lithium | ||||
| 47 | Dalfampridine: a medication to improve walking in patients with multiple sclerosis. Ann Pharmacother. 2012 Jul-Aug;46(7-8):1010-5. | ||||
| 48 | CYP2C8/9 mediate dapsone N-hydroxylation at clinical concentrations of dapsone. Drug Metab Dispos. 2000 Aug;28(8):865-8. | ||||
| 49 | Chronic ethanol feeding and folate deficiency activate hepatic endoplasmic reticulum stress pathway in micropigs. Am J Physiol Gastrointest Liver Physiol. 2005 Jul;289(1):G54-63. | ||||
| 50 | Treatment of patients with ethylene glycol or methanol poisoning: focus on fomepizole. Open Access Emerg Med. 2010 Aug 24;2:67-75. | ||||
| 51 | Effects of cytochrome P450 inducers and inhibitors on the pharmacokinetics of intravenous furosemide in rats: involvement of CYP2C11, 2E1, 3A1 and 3A2 in furosemide metabolism. J Pharm Pharmacol. 2009 Jan;61(1):47-54. | ||||
| 52 | FDA label of Mitoxantrone. The 2020 official website of the U.S. Food and Drug Administration. | ||||
| 53 | The influence of metabolic gene polymorphisms on urinary 1-hydroxypyrene concentrations in Chinese coke oven workers. Sci Total Environ. 2007 Aug 1;381(1-3):38-46. | ||||
| 54 | Clinically significant pharmacokinetic drug interactions between antiepileptic drugs. J Clin Pharm Ther. 1999 Apr;24(2):87-92. | ||||
| 55 | PharmGKB: A worldwide resource for pharmacogenomic information. Wiley Interdiscip Rev Syst Biol Med. 2018 Jul;10(4):e1417. (ID: PA166181117) | ||||
| 56 | Erectile dysfunction drugs changed the protein expressions and activities of drug-metabolising enzymes in the liver of male rats. Oxid Med Cell Longev. 2016;2016:4970906. | ||||
| 57 | The metabolic rate constants and specific activity of human and rat hepatic cytochrome P-450 2E1 toward toluene and chloroform. J Toxicol Environ Health A. 2004 Apr 9;67(7):537-53. | ||||
| 58 | Prediction of human liver microsomal oxidations of 7-ethoxycoumarin and chlorzoxazone with kinetic parameters of recombinant cytochrome P-450 enzymes. Drug Metab Dispos. 1999 Nov;27(11):1274-80. | ||||
| 59 | Human cytochrome p450 induction and inhibition potential of clevidipine and its primary metabolite h152/81. Drug Metab Dispos. 2006 May;34(5):734-7. | ||||
| 60 | Role of cytochrome P450 isoenzymes in metabolism of O(6)-benzylguanine: implications for dacarbazine activation. Clin Cancer Res. 2001 Dec;7(12):4239-44. | ||||
| 61 | In vitro metabolism of dorzolamide, a novel potent carbonic anhydrase inhibitor, in rat liver microsomes. Drug Metab Dispos. 1994 Nov-Dec;22(6):916-21. | ||||
| 62 | Stereoselective metabolism of enflurane by human liver cytochrome P450 2E1. Drug Metab Dispos. 1995 Dec;23(12):1426-30. | ||||
| 63 | Pharmacokinetics, pharmacodynamics and drug interaction potential of enfuvirtide. Clin Pharmacokinet. 2005;44(2):175-86. | ||||
| 64 | Cross-species comparisons of the pharmacokinetics of ibudilast | ||||
| 65 | Clinical isoflurane metabolism by cytochrome P450 2E1. Anesthesiology. 1999 Mar;90(3):766-71. | ||||
| 66 | Metabolism of Meloxicam in human liver involves cytochromes P4502C9 and 3A4. Xenobiotica. 1998 Jan;28(1):1-13. | ||||
| 67 | Protective effect of rifampicin against acute liver injury induced by carbon tetrachloride in mice. Jpn J Pharmacol. 1995 Dec;69(4):325-34. | ||||
| 68 | DrugBank(Pharmacology-Metabolism):Ripretinib | ||||
| 69 | Involvement of cytochrome P450 2C9, 2E1 and 3A4 in trimethadione N-demethylation in human microsomes. J Clin Pharm Ther. 2003 Dec;28(6):493-6. | ||||
| 70 | Theophylline metabolism in human liver microsomes: inhibition studies. J Pharmacol Exp Ther. 1996 Mar;276(3):912-7. | ||||
| 71 | CYP2E1 overexpression alters hepatocyte death from menadione and fatty acids by activation of ERK1/2 signaling. Hepatology. 2004 Feb;39(2):444-55. | ||||
| 72 | Mechanisms of circadian rhythmicity of carbon tetrachloride hepatotoxicity. J Pharmacol Exp Ther. 2002 Jan;300(1):273-81. | ||||
| 73 | Delta-9-Tetrahydrocannabinol and Cannabidiol Drug-Drug Interactions | ||||
| 74 | CYP2D plays a major role in berberine metabolism in liver of mice and humans | ||||
| 75 | Metabolism of caffeic acid by isolated rat hepatocytes and subcellular fractions | ||||
| 76 | Involvement of CYP2E1 as A low-affinity enzyme in phenacetin O-deethylation in human liver microsomes. Drug Metab Dispos. 1999 Aug;27(8):860-5. | ||||
| 77 | Effects of phenothiazine neuroleptics on the rate of caffeine demethylation and hydroxylation in the rat liver. Pol J Pharmacol. 2001 Nov-Dec;53(6):615-21. | ||||
| 78 | Cytochrome P450 2E1 (CYP2E1) is the principal enzyme responsible for urethane metabolism: comparative studies using CYP2E1-null and wild-type mice | ||||
| 79 | Comparison of (S)-mephenytoin and proguanil oxidation in vitro: contribution of several CYP isoforms. Br J Clin Pharmacol. 1999 Aug;48(2):158-67. | ||||
| 80 | Characterization of moclobemide N-oxidation in human liver microsomes. Xenobiotica. 2001 Jul;31(7):387-97. | ||||
| 81 | Roles of cytochromes P450 1A2, 2A6, and 2C8 in 5-fluorouracil formation from tegafur, an anticancer prodrug, in human liver microsomes. Drug Metab Dispos. 2000 Dec;28(12):1457-63. | ||||
| 82 | Effects of premedication medicines on the formation of the CYP3A4-dependent metabolite of ropivacaine, 2', 6'-Pipecoloxylidide, on human liver microsomes in vitro. Basic Clin Pharmacol Toxicol. 2006 Feb;98(2):181-3. | ||||
| 83 | Physiologically Based Pharmacokinetic Modeling for Selumetinib to Evaluate Drug-Drug Interactions and Pediatric Dose Regimens | ||||
| 84 | The role of inflammatory cells and cytochrome P450 in the potentiation of CCl4-induced liver injury by a single dose of retinol. Toxicol Appl Pharmacol. 1996 Dec;141(2):507-19. | ||||
| 85 | In vitro characterization of the human biotransformation pathways of aplidine, a novel marine anti-cancer drug. Invest New Drugs. 2007 Feb;25(1):9-19. | ||||
| 86 | Cytochrome P450 CYP1B1 interacts with 8-methoxypsoralen (8-MOP) and influences psoralen-ultraviolet A (PUVA) sensitivity. PLoS One. 2013 Sep 23;8(9):e75494. | ||||
| 87 | Cytochrome P450 isoform selectivity in human hepatic theobromine metabolism. Br J Clin Pharmacol. 1999 Mar;47(3):299-305. | ||||
| 88 | Disposition and metabolism of semagacestat, a {gamma}-secretase inhibitor, in humans. Drug Metab Dispos. 2010 Apr;38(4):554-65. | ||||
| 89 | Molecular mechanisms of tirapazamine (SR 4233, Win 59075)-induced hepatocyte toxicity under low oxygen concentrations. Br J Cancer. 1995 Apr;71(4):780-5. | ||||
| 90 | Effect of nilvadipine, a dihydropyridine calcium antagonist, on cytochrome P450 activities in human hepatic microsomes. Biol Pharm Bull. 2004 Mar;27(3):415-7. | ||||
| 91 | DrugBank(Pharmacology-Metabolism):Verapamil | ||||
| 92 | Nicotinamide N-oxidation by CYP2E1 in human liver microsomes. Drug Metab Dispos. 2013 Mar;41(3):550-3. | ||||
| 93 | CYP2E1 and clinical features in alcoholics. Neuropsychobiology. 2003;47(2):86-9. | ||||
| 94 | Ethanol Metabolism in the Liver, the Induction of Oxidant Stress, and the Antioxidant Defense System | ||||
| 95 | Involvement of human cytochrome P450 2D6 in the bioactivation of acetaminophen. Drug Metab Dispos. 2000 Dec;28(12):1397-400. | ||||
| 96 | Characterization of human cytochrome P450 isoenzymes involved in the metabolism of vinorelbine. Fundam Clin Pharmacol. 2005 Oct;19(5):545-53. | ||||
| 97 | Metabolism and disposition of GTS-21, a novel drug for Alzheimer's disease. Xenobiotica. 1999 Jul;29(7):747-62. | ||||
| 98 | Pyrethroids: mammalian metabolism and toxicity. J Agric Food Chem. 2011 Apr 13;59(7):2786-91. | ||||
| 99 | In vitro metabolism of irosustat, a novel steroid sulfatase inhibitor: interspecies comparison, metabolite identification, and metabolic enzyme identification | ||||
| 100 | Metabolism and pharmacokinetics of allitinib in cancer patients: the roles of cytochrome P450s and epoxide hydrolase in its biotransformation | ||||
| 101 | Evaluation of the transport, in vitro metabolism and pharmacokinetics of Salvinorin A, a potent hallucinogen. Eur J Pharm Biopharm. 2009 Jun;72(2):471-7. | ||||
| 102 | Kinetics of cytochrome P450 2E1-catalyzed oxidation of ethanol to acetic acid via acetaldehyde. J Biol Chem. 1999 Aug 20;274(34):23833-40. | ||||
| 103 | CYP2E1--biochemical and toxicological aspects and role in alcohol-induced liver injury. Mt Sinai J Med. 2006 Jul;73(4):657-72. | ||||
| 104 | Main metabolic pathways of TAK-802, a novel drug candidate for voiding dysfunction, in humans: the involvement of carbonyl reduction by 11-hydroxysteroid dehydrogenase 1 | ||||
| 105 | Behavior of thymidylate kinase toward monophosphate metabolites and its role in the metabolism of 1-(2'-deoxy-2'-fluoro-beta-L-arabinofuranosyl)-5-methyluracil (Clevudine) and 2',3'-didehydro-2',3'-dideoxythymidine in cells. Antimicrob Agents Chemother. 2005 May;49(5):2044-9. doi: 10.1128/AAC.49.5.2044-2049.2005. | ||||
| 106 | Role of CYP2E1 in deramciclane metabolism. Drug Metab Dispos. 2005 Nov;33(11):1717-22. | ||||
| 107 | Bioactivation of benzylamine to reactive intermediates in rodents: formation of glutathione, glutamate, and peptide conjugates | ||||
| 108 | Cytochrome P450 catalyzed oxidation of monochlorobenzene, 1,2- and 1,4-dichlorobenzene in rat, mouse, and human liver microsomes. Chem Biol Interact. 1998 Aug 14;115(1):53-70. | ||||
| 109 | Identification of the cytochromes P450 that catalyze coumarin 3,4-epoxidation and 3-hydroxylation | ||||
| 110 | Association between CYP2E1 and GOT2 gene polymorphisms and susceptibility and low-dose N,N-dimethylformamide occupational exposure-induced liver injury. Int Arch Occup Environ Health. 2019 Oct;92(7):967-975. | ||||
| 111 | Cytochromes P450: a structure-based summary of biotransformations using representative substrates Drug Metab Rev. 2008;40(1):1-100. doi: 10.1080/03602530802309742. | ||||
| 112 | Identification of the human hepatic cytochromes P450 involved in the in vitro oxidation of antipyrine. Drug Metab Dispos. 1996 Apr;24(4):487-94. | ||||
| 113 | The omega-hydroxlyation of lauric acid: oxidation of 12-hydroxlauric acid to dodecanedioic acid by a purified recombinant fusion protein containing P450 4A1 and NADPH-P450 reductase | ||||
| 114 | Cytochrome P450 4A11 inhibition assays based on characterization of lauric acid metabolites | ||||
| 115 | Interaction of ethanol and the organophosphorus insecticide parathion. Biochem Pharmacol. 1995 Nov 27;50(11):1925-32. | ||||
| 116 | Effect of cytochrome P450 inducers on the metabolism and toxicity of thiram in rats. Vet Hum Toxicol. 2002 Dec;44(6):331-3. | ||||
| 117 | Drug Interactions Flockhart Table | ||||
| 118 | Acetaminophen, via its reactive metabolite N-acetyl-p-benzo-quinoneimine and transient receptor potential ankyrin-1 stimulation, causes neurogenic inflammation in the airways and other tissues in rodents FASEB J. 2010 Dec;24(12):4904-16. doi: 10.1096/fj.10-162438. | ||||
| 119 | Rapid detection and quantification of paracetamol and its major metabolites using surface enhanced Raman scattering. Analyst. 2023 Apr 11;148(8):1805-1814. doi: 10.1039/d3an00249g. | ||||
| 120 | Clinical pharmacokinetics of almotriptan, a serotonin 5-HT(1B/1D) receptor agonist for the treatment of migraine. Clin Pharmacokinet. 2005;44(3):237-46. | ||||
| 121 | Aniline and its metabolites generate free radicals in yeast | ||||
| 122 | Aniline derivative-induced methemoglobin in rats | ||||
| 123 | Role of cytochrome P450 enzymes in the bioactivation of polyunsaturated fatty acids. Biochim Biophys Acta. 2011 Jan;1814(1):210-22. | ||||
| 124 | The metabolism of berberine and its contribution to the pharmacological effects | ||||
| 125 | Role of CYP3A in bromperidol metabolism in rat in vitro and in vivo Xenobiotica. 1999 Aug;29(8):839-46. doi: 10.1080/004982599238281. | ||||
| 126 | DrugBank(Pharmacology-Metabolism)Bupropion | ||||
| 127 | PharmGKB summary: caffeine pathway. Pharmacogenet Genomics. 2012 May;22(5):389-95. | ||||
| 128 | Urine caffeine metabolites are positively associated with cognitive performance in older adults: An analysis of US National Health and Nutrition Examination Survey (NHANES) 2011 to 2014. Nutr Res. 2023 Jan;109:12-25. doi: 10.1016/j.nutres.2022.11.002. | ||||
| 129 | Metabolism of carvedilol in dogs, rats, and mice Drug Metab Dispos. 1998 Oct;26(10):958-69. | ||||
| 130 | Dose-dependent kinetics and metabolism of 1,2-dichlorobenzene in rat: effect of pretreatment with phenobarbital | ||||
| 131 | Robustness of chlorzoxazone as an in vivo measure of cytochrome P450 2E1 activity Br J Clin Pharmacol. 2004 Aug;58(2):190-200. doi: 10.1111/j.1365-2125.2004.02132.x. | ||||
| 132 | Amalgamation of in-silico, in-vitro and in-vivo approach to establish glabridin as a potential CYP2E1 inhibitor. Xenobiotica. 2021 Jun;51(6):625-635. doi: 10.1080/00498254.2021.1883769. | ||||
| 133 | Generation and Characterization of CYP2E1-Overexpressing HepG2 Cells to Study the Role of CYP2E1 in Hepatic Hypoxia-Reoxygenation Injury. Int J Mol Sci. 2023 May 1;24(9):8121. doi: 10.3390/ijms24098121. | ||||
| 134 | Pharmacokinetics of dacarbazine (DTIC) in pregnancy | ||||
| 135 | LABEL:ALFAMPRIDINE tablet, extended release | ||||
| 136 | Pharmacokinetics and metabolism of delamanid, a novel anti-tuberculosis drug, in animals and humans: importance of albumin metabolism in vivo. Drug Metab Dispos. 2015 Aug;43(8):1267-76. | ||||
| 137 | Identification of the human P-450 enzymes responsible for the sulfoxidation and thiono-oxidation of diethyldithiocarbamate methyl ester: role of P-450 enzymes in disulfiram bioactivation. Alcohol Clin Exp Res. 1998 Sep;22(6):1212-9. | ||||
| 138 | Dorzolamide. A review of its pharmacology and therapeutic potential in the management of glaucoma and ocular hypertension | ||||
| 139 | Identification of cytochrome P450 2E1 as the predominant enzyme catalyzing human liver microsomal defluorination of sevoflurane, isoflurane, and methoxyflurane. Anesthesiology. 1993 Oct;79(4):795-807. | ||||
| 140 | Clinical enflurane metabolism by cytochrome P450 2E1. Clin Pharmacol Ther. 1994 Apr;55(4):434-40. | ||||
| 141 | Biotransformation of halothane, enflurane, isoflurane, and desflurane to trifluoroacetylated liver proteins: association between protein acylation and hepatic injury | ||||
| 142 | Cytochrome P450 isozymes involved in the metabolism of phenol, a benzene metabolite. Toxicol Lett. 2001 Dec 15;125(1-3):117-23. | ||||
| 143 | Development of a novel tandem mass spectrometry method for the quantification of eszopiclone without interference from 2-amino-5-chloropyridine and application in a pharmacokinetic study of rat J Pharm Biomed Anal. 2020 Sep 5;188:113363. doi: 10.1016/j.jpba.2020.113363. | ||||
| 144 | Chiral aspects of the human metabolism of ethosuximide Biopharm Drug Dispos. 2005 Sep;26(6):225-32. doi: 10.1002/bdd.454. | ||||
| 145 | The metabolism of ethosuximide Eur J Drug Metab Pharmacokinet. 1993 Oct-Dec;18(4):349-53. doi: 10.1007/BF03190184. | ||||
| 146 | Reactive metabolites of the anticonvulsant drugs and approaches to minimize the adverse drug reaction. Eur J Med Chem. 2021 Dec 15;226:113890. doi: 10.1016/j.ejmech.2021.113890. | ||||
| 147 | DrugBank(Pharmacology-Metabolism)Felbamate | ||||
| 148 | LABEL:FELBAMATE suspension | ||||
| 149 | Kinetics and metabolism of fomepizole in healthy humans Clin Toxicol (Phila). 2012 Jun;50(5):375-83. doi: 10.3109/15563650.2012.683197. | ||||
| 150 | DrugBank(Pharmacology-Metabolism)Fospropofol | ||||
| 151 | Chemical and enzymatic oxidation of furosemide: formation of pyridinium salts Chem Res Toxicol. 2007 Dec;20(12):1741-4. doi: 10.1021/tx700262z. | ||||
| 152 | DrugBank(Pharmacology-Metabolism):Halothane | ||||
| 153 | In vitro metabolism of indiplon and an assessment of its drug interaction potential | ||||
| 154 | Exploration of inhibition potential of isoniazid and its metabolites towards CYP2E1 in human liver microsomes through LC-MS/MS analysis J Pharm Biomed Anal. 2021 Sep 5;203:114223. doi: 10.1016/j.jpba.2021.114223. | ||||
| 155 | A prospective longitudinal study of growth in twin gestations compared with growth in singleton pregnancies. I. The fetal head J Ultrasound Med. 1991 Aug;10(8):439-43. doi: 10.7863/jum.1991.10.8.439. | ||||
| 156 | Sulfotransferase 1E1 is a low km isoform mediating the 3-O-sulfation of ethinyl estradiol Drug Metab Dispos. 2004 Nov;32(11):1299-303. doi: 10.1124/dmd.32.11.. | ||||
| 157 | CYP-eicosanoids--a new link between omega-3 fatty acids and cardiac disease? Prostaglandins Other Lipid Mediat. 2011 Nov;96(1-4):99-108. | ||||
| 158 | Inhibitory effects of nicardipine to cytochrome P450 (CYP) in human liver microsomes. Biol Pharm Bull. 2005 May;28(5):882-5. | ||||
| 159 | Metabolic pro?ling of tyrosine kinase inhibitor nintedanib using metabolomics J Pharm Biomed Anal. 2020 Feb 20;180:113045. doi: 10.1016/j.jpba.2019.113045. | ||||
| 160 | Metabolic Disposition of Osimertinib in Rats, Dogs, and Humans: Insights into a Drug Designed to Bind Covalently to a Cysteine Residue of Epidermal Growth Factor Receptor Drug Metab Dispos. 2016 Aug;44(8):1201-12. doi: 10.1124/dmd.115.069203. | ||||
| 161 | Population Pharmacokinetics, Pharmacogenomics, and Adverse Events of Osimertinib and its Two Active Metabolites, AZ5104 and AZ7550, in Japanese Patients with Advanced Non-small Cell Lung Cancer: a Prospective Observational Study. Invest New Drugs. 2023 Feb;41(1):122-133. doi: 10.1007/s10637-023-01328-9. | ||||
| 162 | Instability Mechanism of Osimertinib in Plasma and a Solving Strategy in the Pharmacokinetics Study. Front Pharmacol. 2022 Jul 22;13:928983. doi: 10.3389/fphar.2022.928983. | ||||
| 163 | CYP2C19 polymorphism effect on phenobarbitone. Pharmacokinetics in Japanese patients with epilepsy: analysis by population pharmacokinetics. Eur J Clin Pharmacol. 2000 Feb-Mar;55(11-12):821-5. | ||||
| 164 | DrugBank(Pharmacology-Metabolism)Phenacetin | ||||
| 165 | DrugBank(Pharmacology-Metabolism)Phenobarbital | ||||
| 166 | Physiologically based pharmacokinetics model of primidone and its metabolites phenobarbital and phenylethylmalonamide in humans, rats, and mice Drug Metab Dispos. 1998 Jun;26(6):585-94. | ||||
| 167 | Blood and cerebrospinal fluid pharmacokinetics of primidone and its primary pharmacologically active metabolites, phenobarbital and phenylethylmalonamide in the rat Eur J Drug Metab Pharmacokinet. 1999 Jul-Sep;24(3):255-64. doi: 10.1007/BF03190029. | ||||
| 168 | Managing the Drug-Drug Interaction With Apixaban and Primidone: A Case Report. Hosp Pharm. 2023 Aug;58(4):345-349. doi: 10.1177/00185787221150928. | ||||
| 169 | Ticagrelor and primidone interaction masquerading as dual antiplatelet therapy noncompliance. Future Cardiol. 2023 Jun 14. doi: 10.2217/fca-2023-0011. | ||||
| 170 | Effects of CYP3A Inhibition, CYP3A Induction, and Gastric Acid Reduction on the Pharmacokinetics of Ripretinib, a Switch Control KIT Tyrosine Kinase Inhibitor | ||||
| 171 | DrugBank(Pharmacology-Metabolism)Sertraline hydrochloride | ||||
| 172 | FDA Approved Drug Products: Ultane (sevoflurane), volatile liquid for inhalation | ||||
| 173 | The contributions of cytochromes P450 3A4 and 3A5 to the metabolism of the phosphodiesterase type 5 inhibitors sildenafil, udenafil, and vardenafil. Drug Metab Dispos. 2008 Jun;36(6):986-90. | ||||
| 174 | Pharmacokinetics of sildenafil after single oral doses in healthy male subjects: absolute bioavailability, food effects and dose proportionality. Br J Clin Pharmacol. 2002;53 Suppl 1(Suppl 1):5S-12S. doi: 10.1046/j.0306-5251.2001.00027.x. | ||||
| 175 | Thalidomide metabolism and hydrolysis: mechanisms and implications | ||||
| 176 | Protein binding and the metabolism of thiamylal enantiomers in vitro. Anesth Analg. 2000 Sep;91(3):736-40. | ||||
| 177 | Don't stay home without it | ||||
| 178 | Trimethadione metabolism by human liver cytochrome P450: evidence for the involvement of CYP2E1. Xenobiotica. 1998 Nov;28(11):1041-7. | ||||
| 179 | Detection of 1,N6-ethenodeoxyadenosine and 3,N4-ethenodeoxycytidine by immunoaffinity/32P-postlabelling in liver and lung DNA of mice treated with ethyl carbamate (urethane) or its metabolites | ||||
If you find any error in data or bug in web service, please kindly report it to Dr. Yin and Dr. Li.