

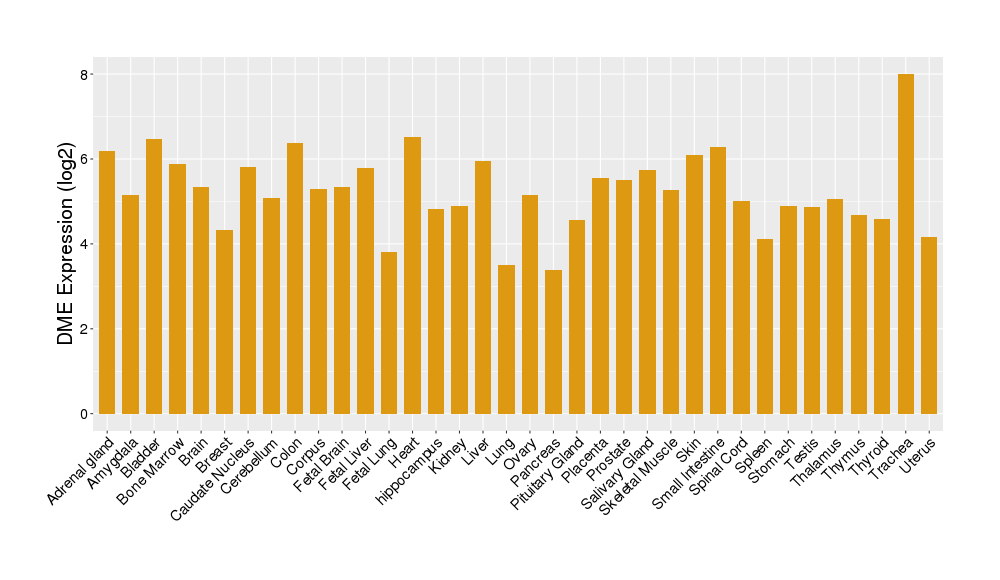
Details of Drug-Metabolizing Enzyme (DME)
| Full List of Drug(s) Metabolized by This DME | |||||
|---|---|---|---|---|---|
| Drugs Approved by FDA | Click to Show/Hide the Full List of Drugs: 65 Drugs | ||||
Thalidomide |
Drug Info | Approved | Breast cancer | ICD11: 2C60 | [1], [2] |
Tamoxifen citrate |
Drug Info | Approved | Breast cancer | ICD11: 2C60 | [3] |
Erlotinib hydrochloride |
Drug Info | Approved | Lung cancer | ICD11: 2C25 | [4] |
Estradiol acetate |
Drug Info | Approved | Acquired prion disease | ICD11: 8E01 | [5] |
Estradiol cypionate |
Drug Info | Approved | Acquired prion disease | ICD11: 8E01 | [6] |
Estrone |
Drug Info | Approved | Menopausal disorder | ICD11: GA30 | [7] |
Nicotine |
Drug Info | Approved | Nicotine dependence | ICD11: 6C4A | [8] |
Capmatinib |
Drug Info | Approved | Lung cancer | ICD11: 2C25 | [9] |
Dronabinol |
Drug Info | Approved | Anorexia nervosa | ICD11: 6B80 | [10] |
Ozanimod |
Drug Info | Approved | Multiple sclerosis | ICD11: 8A40 | [11] |
Diclofenac sodium |
Drug Info | Approved | Osteoarthritis | ICD11: FA00 | [12] |
Prazosin |
Drug Info | Approved | Prostatic hyperplasia | ICD11: GA90 | [13] |
Progesterone |
Drug Info | Approved | Premature labour | ICD11: JB00 | [14] |
Imatinib mesylate |
Drug Info | Approved | Chronic myelogenous leukaemia | ICD11: 2A20 | [1], [15], [16] |
Cannabidiol |
Drug Info | Approved | Lennox-Gastaut syndrome | ICD11: 8A62 | [17] |
Capsaicin |
Drug Info | Approved | Herpes zoster | ICD11: 1E91 | [18] |
Ethinyl estradiol |
Drug Info | Approved | Menopausal disorder | ICD11: GA30 | [19] |
Sunitinib malate |
Drug Info | Approved | Renal cell carcinoma | ICD11: 2C90 | [20] |
Tretinoin |
Drug Info | Approved | Acne vulgaris | ICD11: ED80 | [21] |
Daunorubicin |
Drug Info | Approved | Acute myeloid leukaemia | ICD11: 2A60 | [22] |
Febuxostat |
Drug Info | Approved | Hyperuricaemia | ICD11: 5C55 | [23] |
Copanlisib |
Drug Info | Approved | Follicular lymphoma | ICD11: 2A80 | [24] |
Alitretinoin |
Drug Info | Approved | Kaposi sarcoma | ICD11: 2B57 | [25] |
Carvedilol |
Drug Info | Approved | Congestive heart failure | ICD11: BD10 | [26] |
Flutamide |
Drug Info | Approved | Prostate cancer | ICD11: 2C82 | [27] |
Haloperidol decanoate |
Drug Info | Approved | Agitation/aggression | ICD11: 6D86 | [28] |
Nevirapine |
Drug Info | Approved | Human immunodeficiency virus infection | ICD11: 1C60 | [29] |
Tivozanib |
Drug Info | Approved | Renal cell carcinoma | ICD11: 2C90 | [30] |
Toremifene citrate |
Drug Info | Approved | Breast cancer | ICD11: 2C60 | [31] |
Umeclidinium bromide |
Drug Info | Approved | Chronic obstructive pulmonary disease | ICD11: CA22 | [32] |
Fluvastatin sodium |
Drug Info | Approved | Hypertriglyceridaemia | ICD11: 5C80 | [33] |
Lesinurad |
Drug Info | Approved | Uncontrolled gout | ICD11: FA25 | [34] |
Mercaptopurine |
Drug Info | Approved | Acute lymphoblastic leukemia | ICD11: 2B33 | [35] |
Riluzole |
Drug Info | Approved | Amyotrophic lateral sclerosis | ICD11: 8B60 | [36] |
Amiodarone hydrochloride |
Drug Info | Approved | Ventricular tachyarrhythmia | ICD11: BC71 | [37] |
Clonidine |
Drug Info | Approved | Essential hypertension | ICD11: BA00 | [38] |
Loxapine succinate |
Drug Info | Approved | Schizophrenia | ICD11: 6A20 | [39] |
Ponatinib hydrochloride |
Drug Info | Approved | Acute lymphoblastic leukemia | ICD11: 2B33 | [40] |
Solifenacin succinate |
Drug Info | Approved | Overactive bladder | ICD11: GC50 | [41] |
Tasimelteon |
Drug Info | Approved | Insomnia | ICD11: 7A00 | [42] |
Theophylline |
Drug Info | Approved | Chronic obstructive pulmonary disease | ICD11: CA22 | [43] |
Triclosan |
Drug Info | Approved | Malaria | ICD11: 1F40-1F45 | [44] |
Acetaminophen |
Drug Info | Approved | Anaesthesia | ICD11: 8E22 | [45] |
Lenvatinib |
Drug Info | Approved | Thyroid cancer | ICD11: 2D10 | [46] |
Procarbazine |
Drug Info | Approved | Anaplastic large cell lymphoma | ICD11: 2A90 | [47] |
Riociguat |
Drug Info | Approved | Pulmonary hypertension | ICD11: BB01 | [48] |
Troglitazone |
Drug Info | Approved | Diabetes mellitus | ICD11: 5A10 | [49] |
Azilsartan |
Drug Info | Approved | Hypertension | ICD11: BA00-BA04 | [50], [51] |
Clofibrate |
Drug Info | Approved | Hypertriglyceridaemia | ICD11: 5C80 | [52] |
Granisetron hydrochloride |
Drug Info | Approved | Functional nausea/vomiting | ICD11: DD90 | [53] |
Oxaliplatin |
Drug Info | Approved | Colorectal cancer | ICD11: 2B91 | [54] |
Pentamidine isethionate |
Drug Info | Approved | Pneumocystis pneumonia | ICD11: CA40 | [55] |
Sulindac |
Drug Info | Approved | Rheumatoid arthritis | ICD11: FA20 | [56] |
Chloroquine |
Drug Info | Approved | Malaria | ICD11: 1F40 | [57] |
Dacarbazine |
Drug Info | Approved | Melanoma | ICD11: 2C30 | [58] |
Erythromycin stearate |
Drug Info | Approved | Acute upper respiratory infection | ICD11: CA07 | [59] |
Meloxicam |
Drug Info | Approved | Osteoarthritis | ICD11: FA00 | [60] |
Niraparib |
Drug Info | Approved | Ovarian cancer | ICD11: 2C73 | [61] |
Raltegravir potassium |
Drug Info | Approved | Human immunodeficiency virus infection | ICD11: 1C60 | [62] |
Risdiplam |
Drug Info | Approved | Muscular atrophy | ICD11: 8B61 | [63] |
Risdiplam |
Drug Info | Approved | Muscular atrophy | ICD11: 8B61 | [64] |
Romidepsin |
Drug Info | Approved | Cutaneous T-cell lymphoma | ICD11: 2B01 | [65] |
Testosterone cypionate |
Drug Info | Approved | Testosterone deficiency | ICD11: 5A81 | [14] |
Menadione |
Drug Info | Approved | Vitamin deficiency | ICD11: 5B55 | [66] |
Riboflavin |
Drug Info | Approved | Acne vulgaris | ICD11: ED80 | [67] |
| Drugs in Phase 4 Clinical Trial | Click to Show/Hide the Full List of Drugs: 8 Drugs | ||||
Cinnarizine |
Drug Info | Phase 4 | Haemorrhagic stroke | ICD11: 8B20 | [1] |
Amodiaquine |
Drug Info | Phase 4 | Malaria | ICD11: 1F40 | [68] |
Melatonin |
Drug Info | Phase 4 | Foetal growth restriction | ICD11: KA20 | [69] |
Zotepine |
Drug Info | Phase 4 | Schizophrenia | ICD11: 6A20 | [70] |
Phenacetin |
Drug Info | Phase 4 | Anaesthesia | ICD11: 8E22 | [71] |
Flunarizine |
Drug Info | Phase 4 | Schizophrenia | ICD11: 6A20 | [52] |
Perazine |
Drug Info | Phase 4 | Cerebrovascular dementia | ICD11: 6D81 | [72] |
Retigabine |
Drug Info | Phase 4 | Epilepsy | ICD11: 8A60 | [73] |
| Drugs in Phase 3 Clinical Trial | Click to Show/Hide the Full List of Drugs: 8 Drugs | ||||
E-3A |
Drug Info | Phase 3 | Turner syndrome | ICD11: LD50 | [74] |
Finerenone |
Drug Info | Phase 3 | Diabetic nephropathy | ICD11: GB61 | [75] |
Finerenone |
Drug Info | Phase 3 | Diabetic nephropathy | ICD11: GB61 | [76] |
NE-10064 |
Drug Info | Phase 3 | Cardiac arrhythmia | ICD11: BC65 | [77] |
NSC-122758 |
Drug Info | Phase 3 | Vitamin deficiency | ICD11: 5B55 | [78], [79] |
MLN4924 |
Drug Info | Phase 3 | Myelodysplastic syndrome | ICD11: 2A37 | [80] |
HSDB-3466 |
Drug Info | Phase 3 | Psoriasis vulgaris | ICD11: EA90 | [81] |
MK-595 |
Drug Info | Phase 3 | Congenital heart anomaly | ICD11: LA8Z | [82] |
| Drugs in Phase 2 Clinical Trial | Click to Show/Hide the Full List of Drugs: 12 Drugs | ||||
CS-5245 |
Drug Info | Phase 2/3 | Fragile X syndrome | ICD11: LD55 | [83] |
Leniolisib |
Drug Info | Phase 2 | Sjogren syndrome | ICD11: 4A43 | [84] |
LIK-066 |
Drug Info | Phase 2 | Heart failure | ICD11: BD10-BD1Z | [85] |
BS-3952 |
Drug Info | Phase 2 | Essential hypertension | ICD11: BA00 | [86] |
AR-67 |
Drug Info | Phase 2 | Brain cancer | ICD11: 2A00 | [87] |
JI-101 |
Drug Info | Phase 2 | Solid tumour/cancer | ICD11: 2A00-2F9Z | [88] |
NAB-365 |
Drug Info | Phase 2 | Amyotrophic lateral sclerosis | ICD11: 8B60 | [89] |
SMT-C1100 |
Drug Info | Phase 2 | Muscular dystrophy | ICD11: 8C70 | [90] |
NSC-603071 |
Drug Info | Phase 2 | Ovarian cancer | ICD11: 2C73 | [91] |
NSC-659853 |
Drug Info | Phase 2 | Breast cancer | ICD11: 2C60 | [92] |
RG-7916 |
Drug Info | Phase 2 | Muscular atrophy | ICD11: 8B61 | |
SHR-1020 |
Drug Info | Phase 2 | Breast cancer | ICD11: 2C60 | [93] |
| Drugs in Phase 1 Clinical Trial | Click to Show/Hide the Full List of Drugs: 7 Drugs | ||||
CB-3304 |
Drug Info | Phase 1/2 | Chronic lymphocytic leukaemia | ICD11: 2A82 | [94] |
CCRIS-1920 |
Drug Info | Phase 1/2 | Osteoporosis | ICD11: FB83 | [95] |
TMC-120 |
Drug Info | Phase 1/2 | Human immunodeficiency virus infection | ICD11: 1C60 | [96] |
Daniquidone |
Drug Info | Phase 1 | Lymphoma | ICD11: 2A80-2A86 | [97] |
M-813 |
Drug Info | Phase 1 | Schizophrenia | ICD11: 6A20 | [98], [99] |
Benzoylphenylurea |
Drug Info | Phase 1 | Solid tumour/cancer | ICD11: 2A00-2F9Z | [100], [101] |
GTPL-1666 |
Drug Info | Phase 1 | Cerebral vasospasm | ICD11: BA85 | [102] |
| Discontinued/withdrawn Drugs | Click to Show/Hide the Full List of Drugs: 7 Drugs | ||||
Motesanib |
Drug Info | Discontinued in Phase 3 | Lung cancer | ICD11: 2C25 | [103] |
Almokalant |
Drug Info | Discontinued in Phase 3 | Cardiac arrhythmias | ICD11: BC9Z | [104] |
EM-800 |
Drug Info | Discontinued in Phase 3 | Osteoporosis | ICD11: FB83 | [105] |
YM-992 |
Drug Info | Discontinued in Phase 2 | Depression | ICD11: 6A70-6A7Z | [106] |
Tr-14035 |
Drug Info | Discontinued in Phase 1 | Multiple sclerosis | ICD11: 8A40 | [107] |
CAM-2028 |
Drug Info | Discontinued | Acute nasopharyngitis | ICD11: CA00 | [108] |
AN-16649 |
Drug Info | Discontinued | Acute lymphoblastic leukemia | ICD11: 2B33 | [109], [110], [111] |
| Preclinical/investigative Agents | Click to Show/Hide the Full List of Drugs: 6 Drugs | ||||
Coumarin |
Drug Info | Investigative | Discovery agent | ICD: N.A. | [112] |
Nitrobenzanthrone |
Drug Info | Investigative | Discovery agent | ICD: N.A. | [113] |
Sudan I |
Drug Info | Investigative | Discovery agent | ICD: N.A. | [114] |
Acriflavinium chloride |
Drug Info | Investigative | Trypanosomiasis | ICD11: 1F51 | [115] |
Equilenin |
Drug Info | Investigative | Discovery agent | ICD: N.A. | [116] |
O-Benzylguanine |
Drug Info | Investigative | Discovery agent | ICD: N.A. | [117] |
| Tissue/Disease-Specific Protein Abundances of This DME | |||||
|---|---|---|---|---|---|
| Tissue-specific Protein Abundances in Healthy Individuals | Click to Show/Hide | ||||
|
|||||
| ICD Disease Classification 01 | Infectious/parasitic disease | Click to Show/Hide | |||
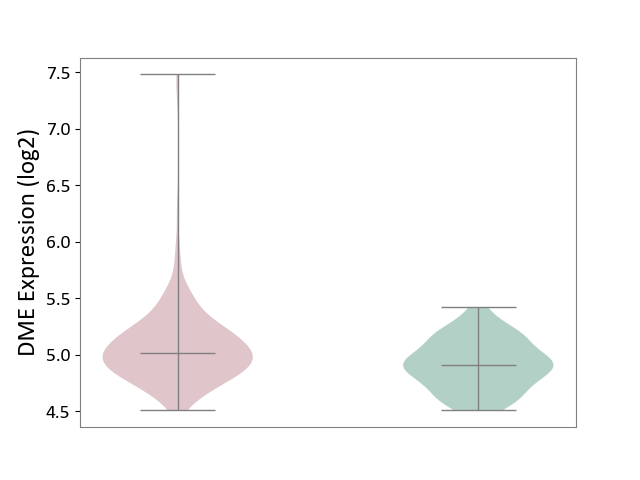
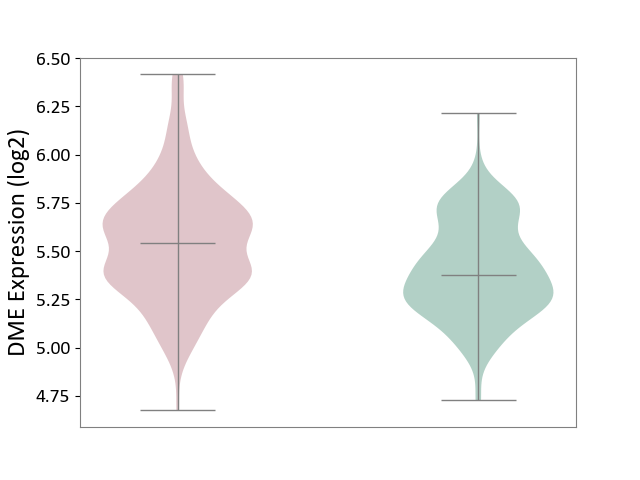
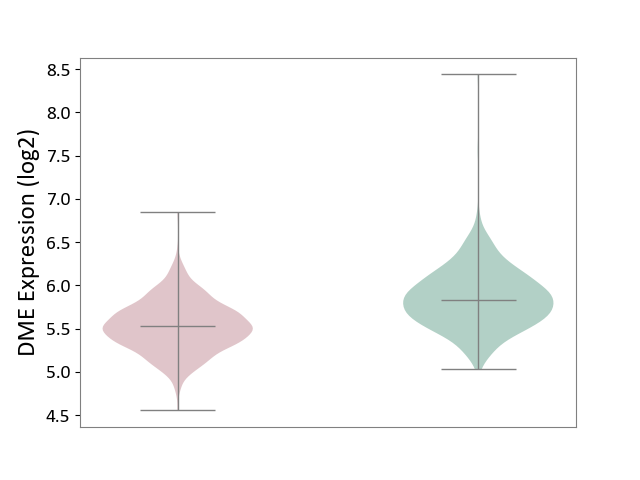
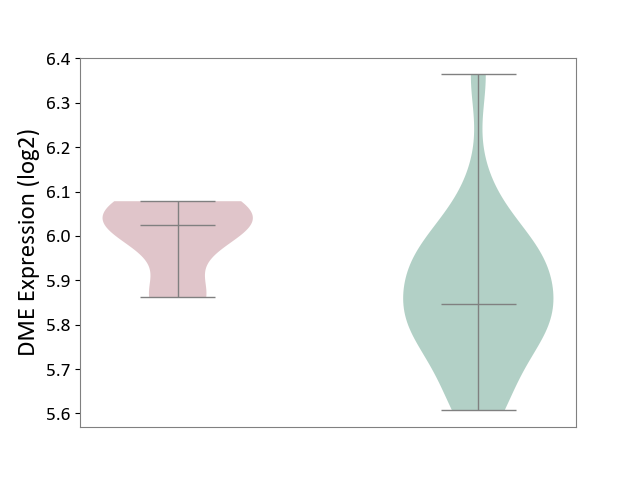
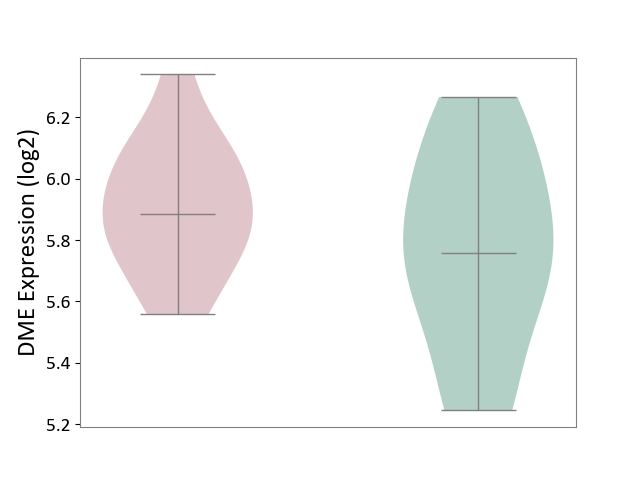
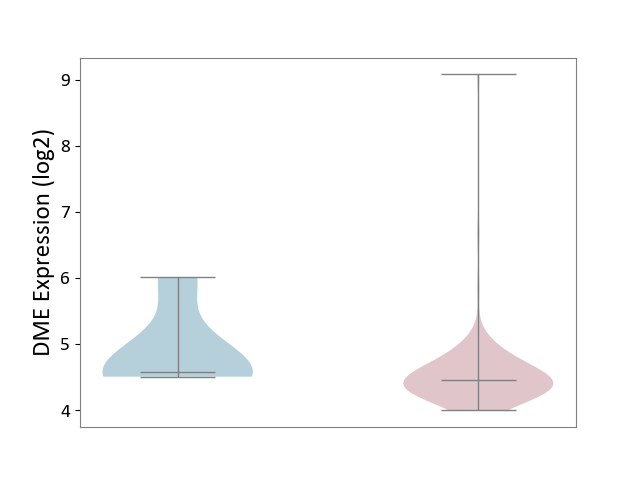
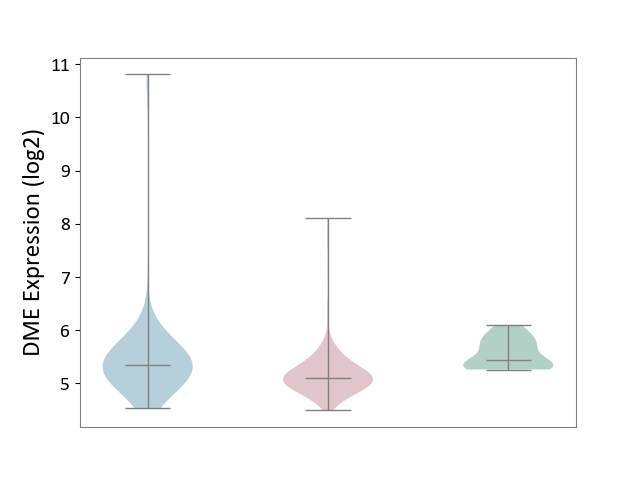
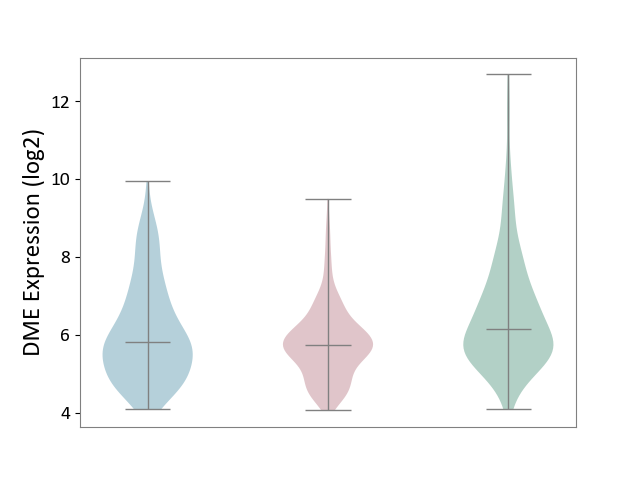
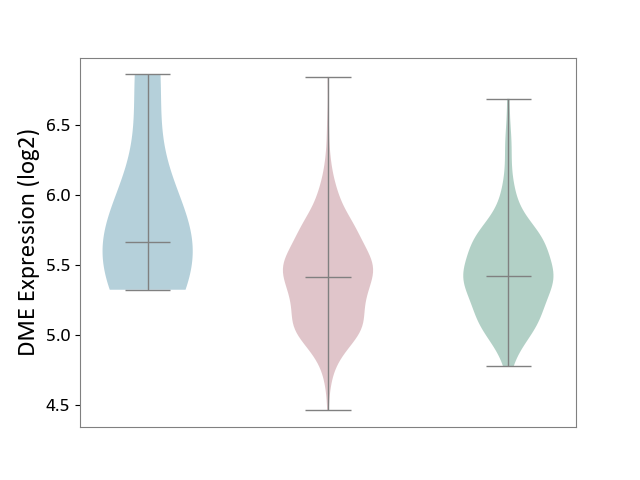
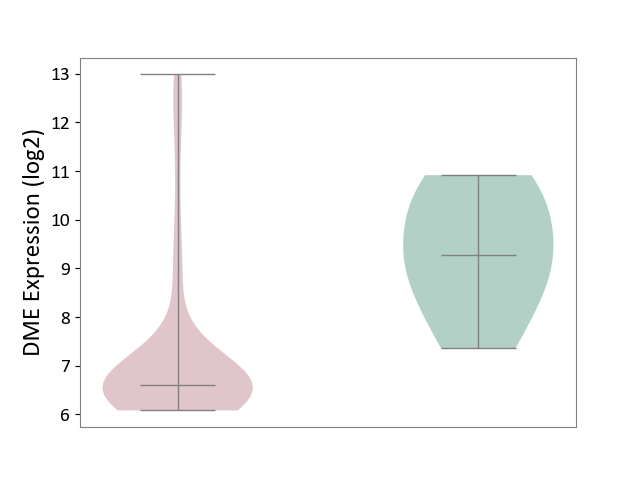
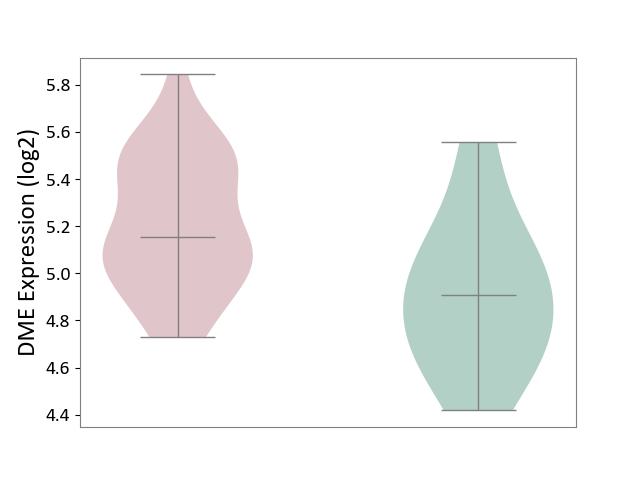
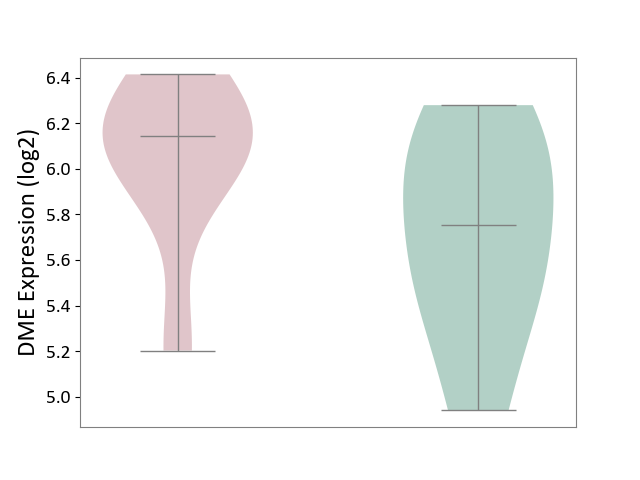
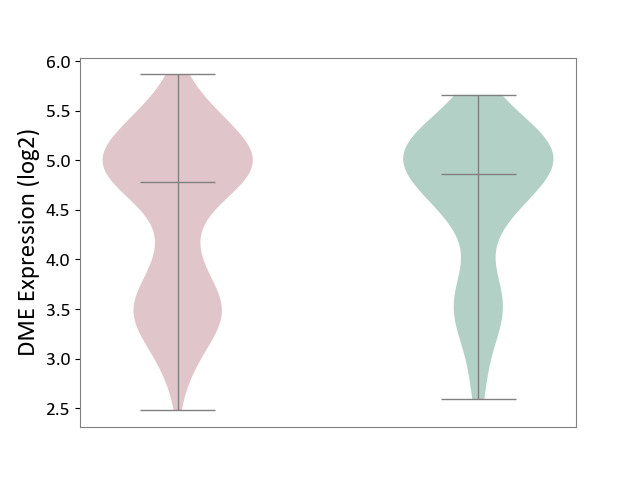
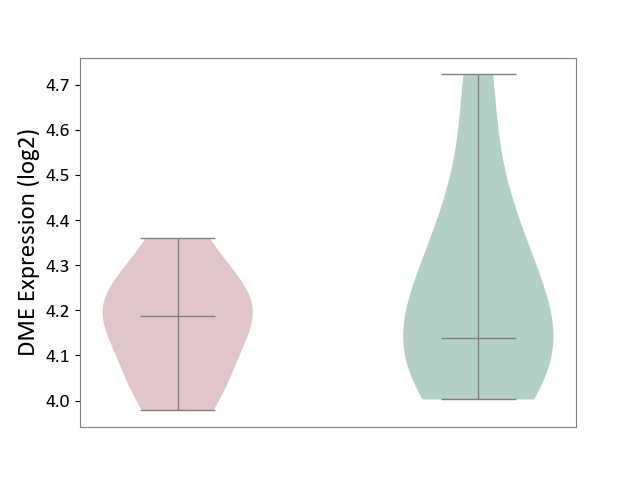
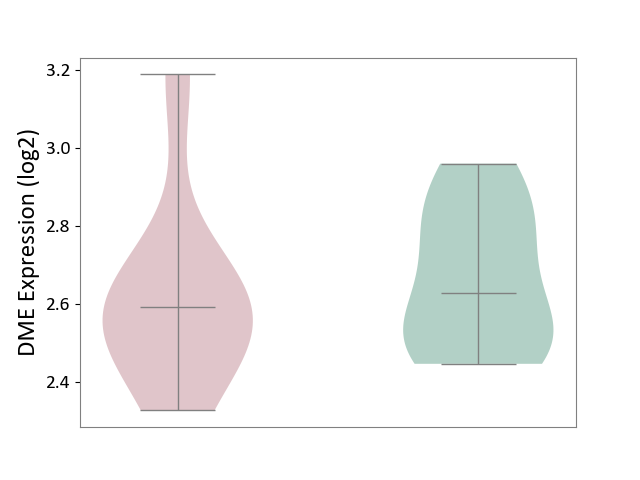
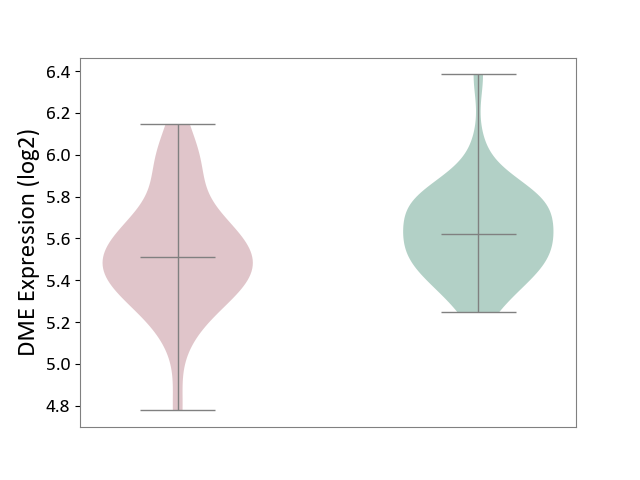
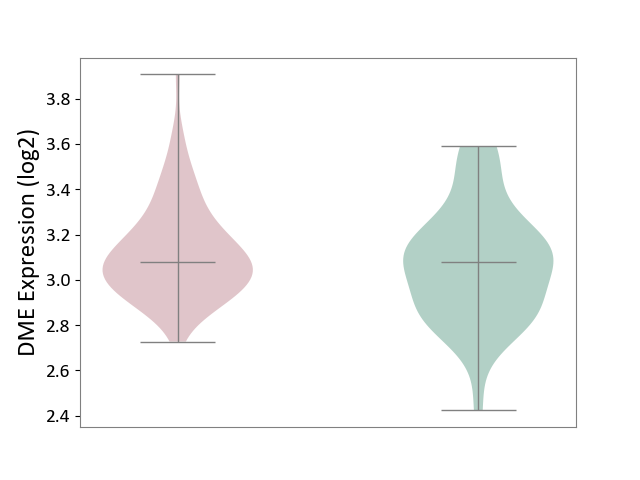
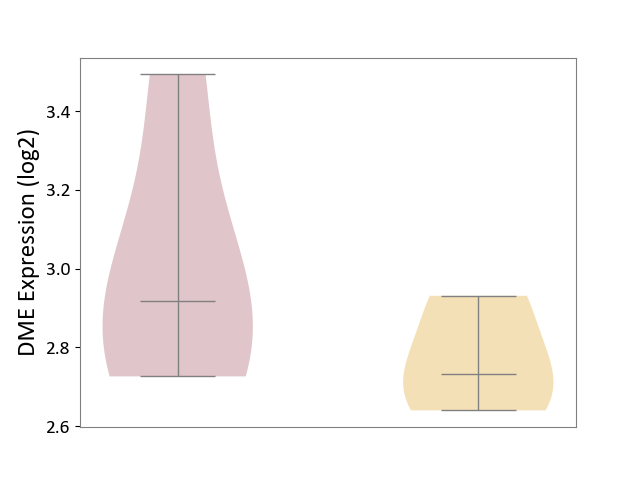
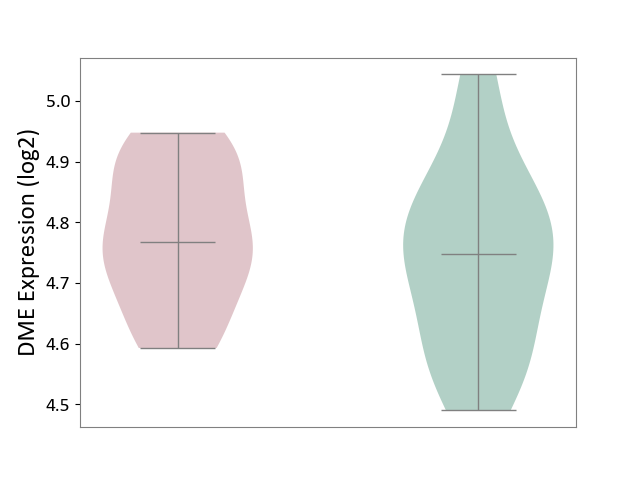
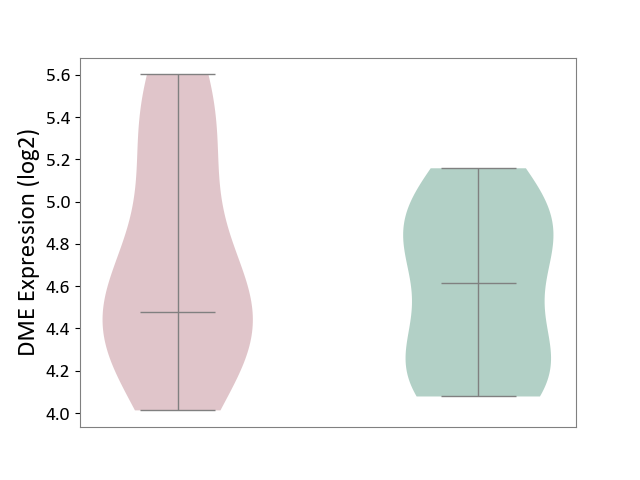
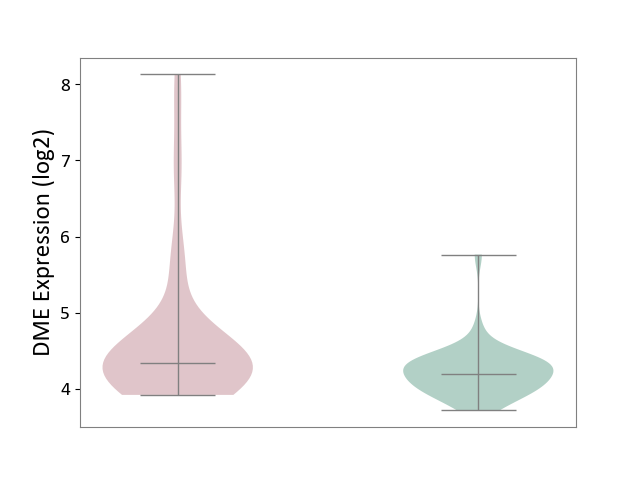
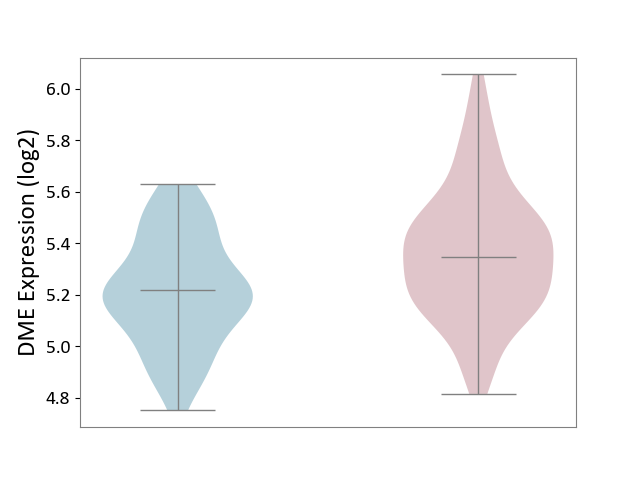
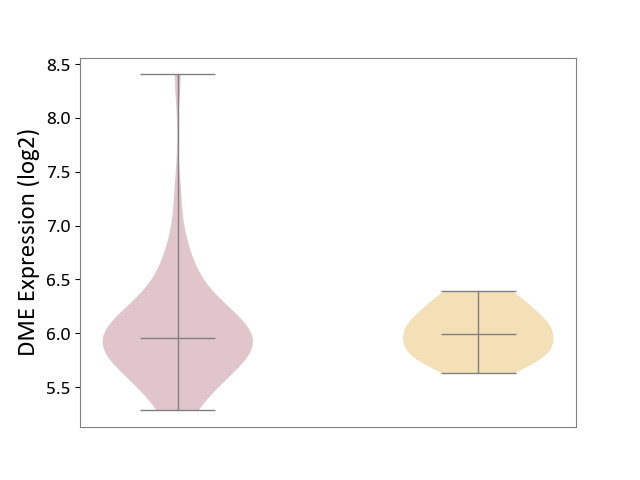
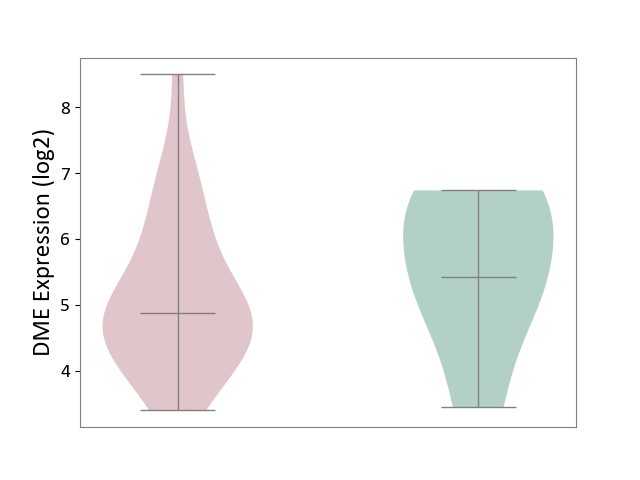
| ICD-11: 1C1H | Necrotising ulcerative gingivitis | Click to Show/Hide | |||
| The Studied Tissue | Gingival tissue | ||||
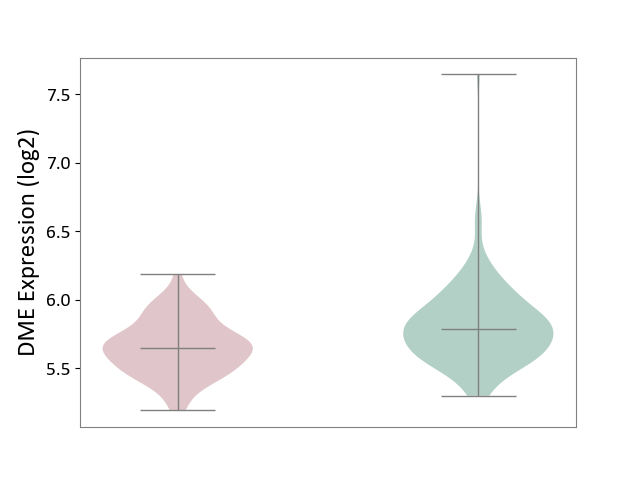
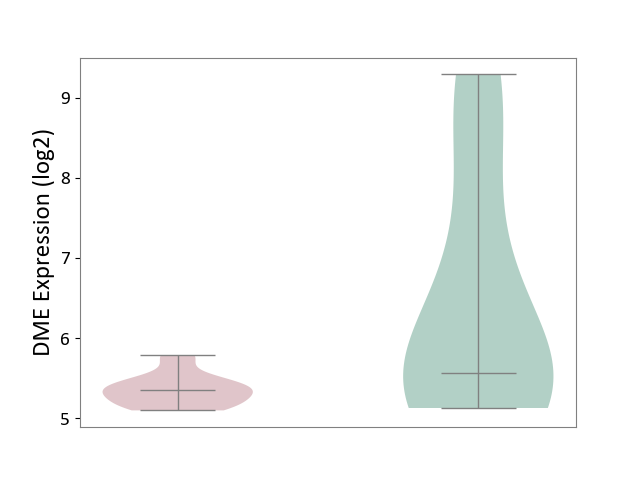
| The Specified Disease | Bacterial infection of gingival [ICD-11:1C1H] | ||||
| The Expression Level of Disease Section Compare with the Healthy Individual Tissue | p-value: 6.86E-05; Fold-change: 1.01E-01; Z-score: 4.55E-01 | ||||
|
DME expression in the diseased tissue of patients
DME expression in the normal tissue of healthy individuals
|
|||||
| Violin Diagram of DME Disease-specific Protein Abundances |
|
Click to View the Clearer Original Diagram | |||
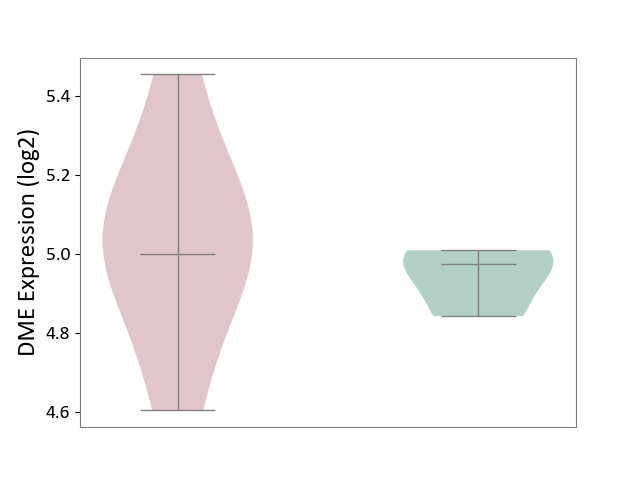
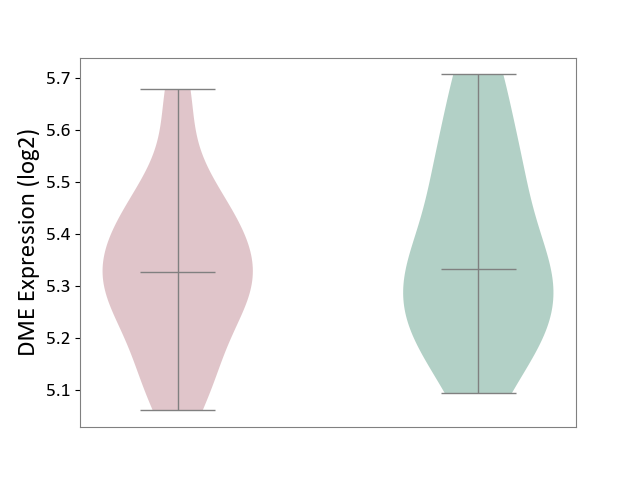
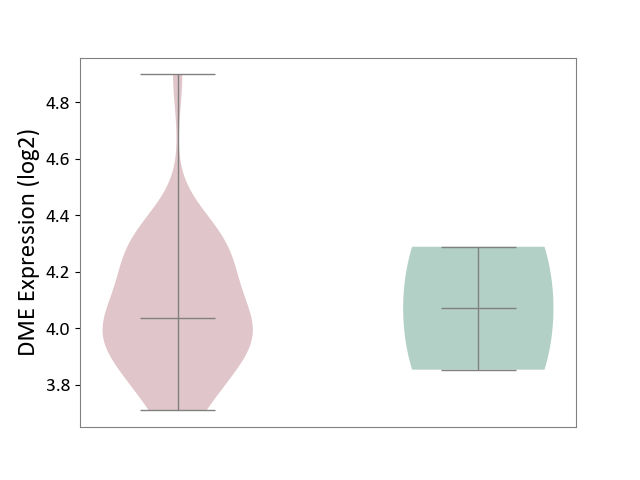
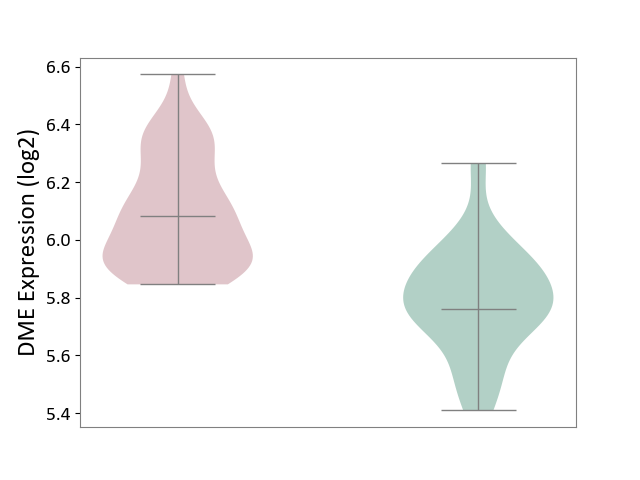
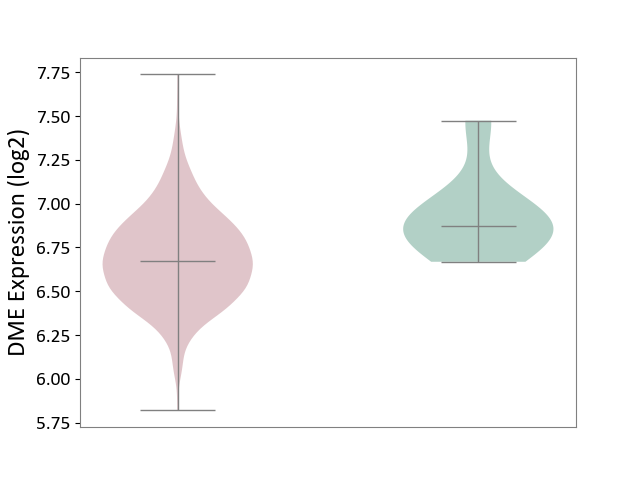
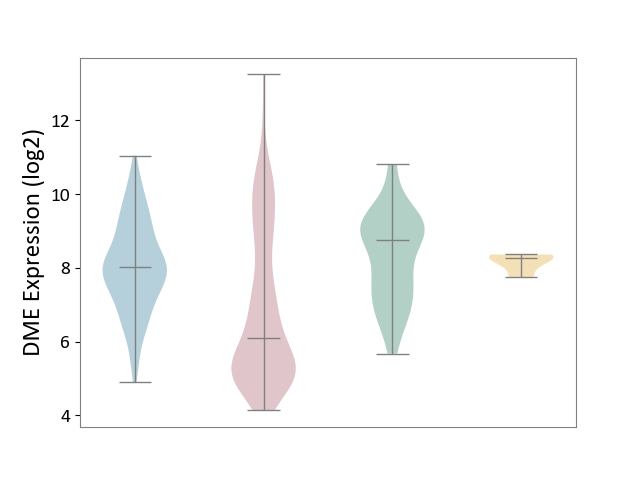
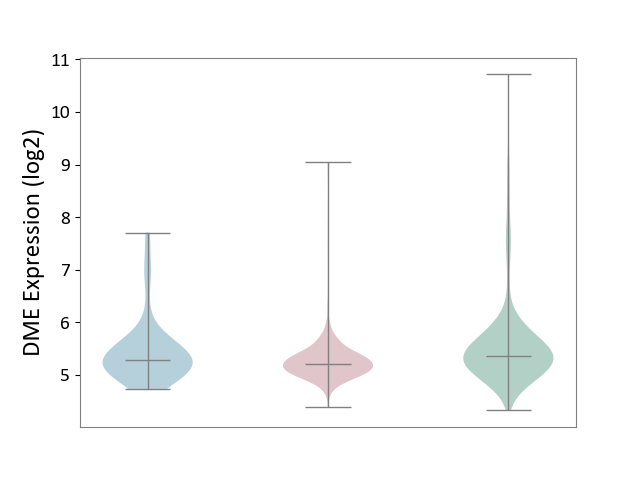
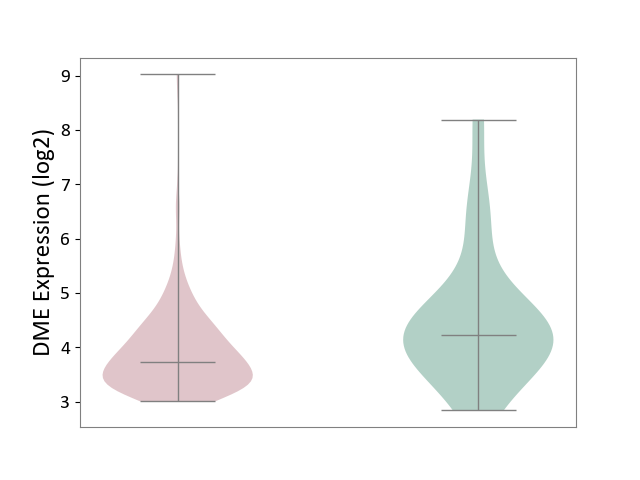
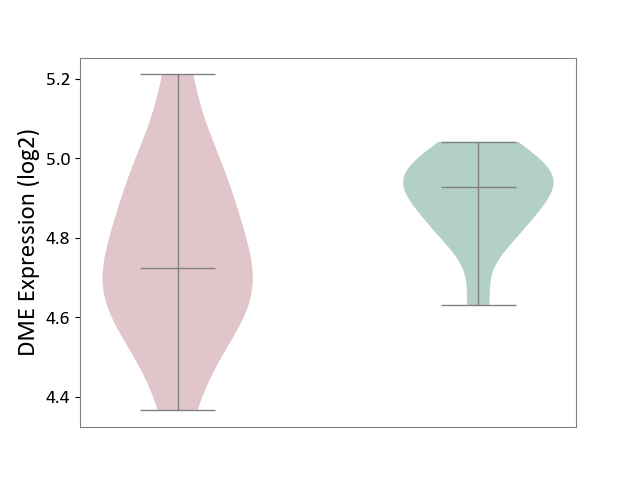
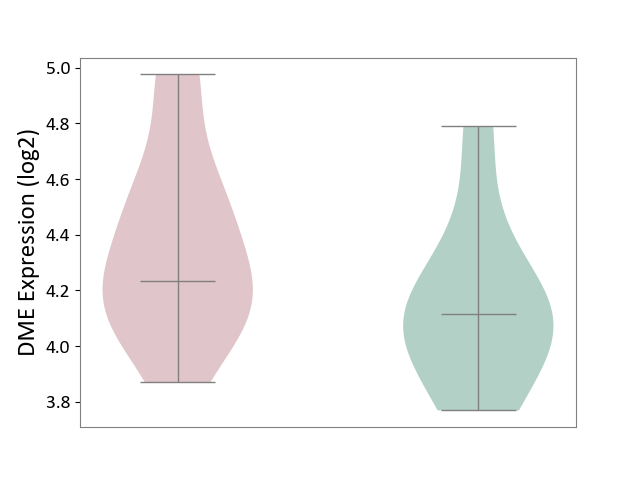
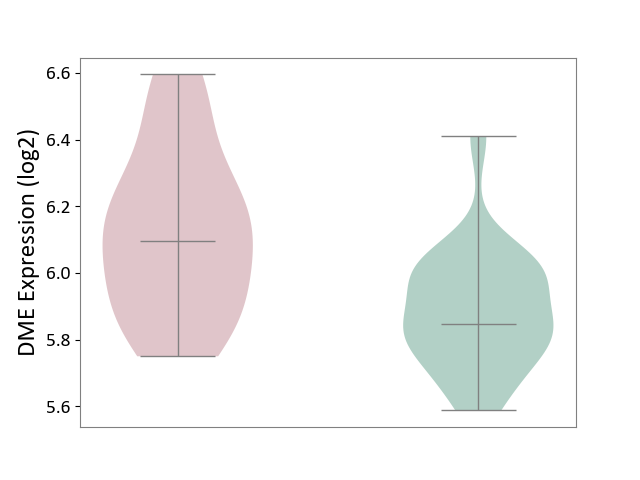
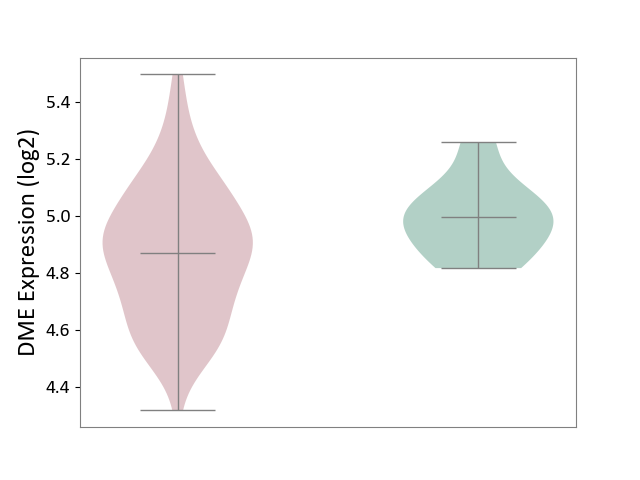
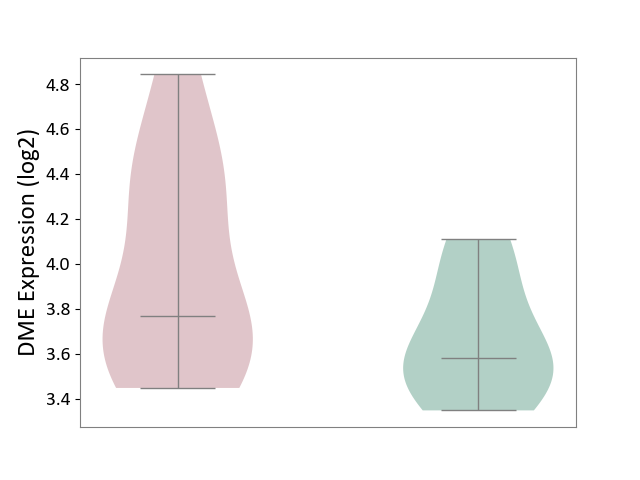
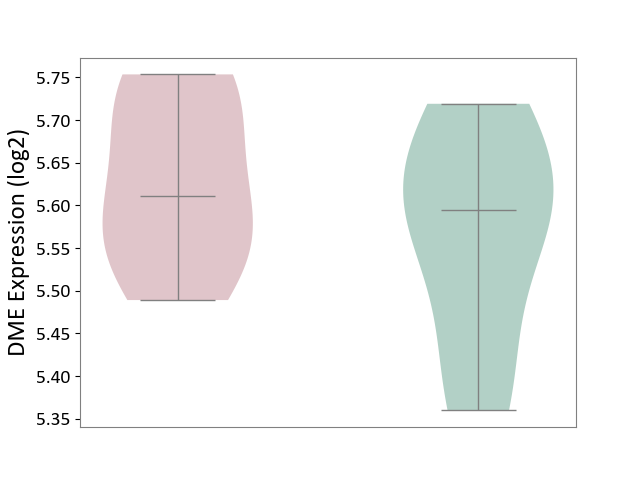
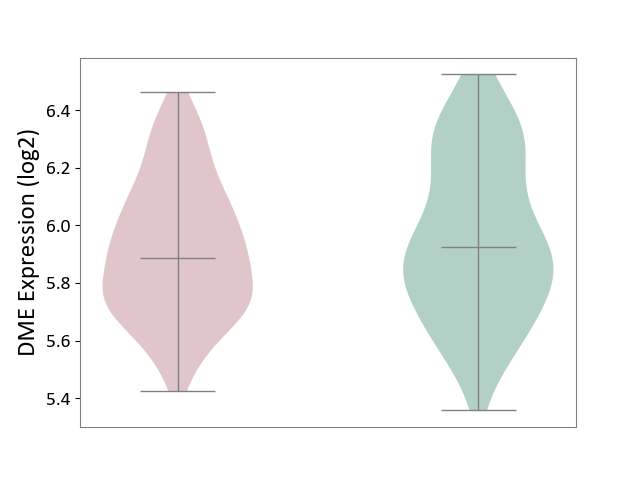
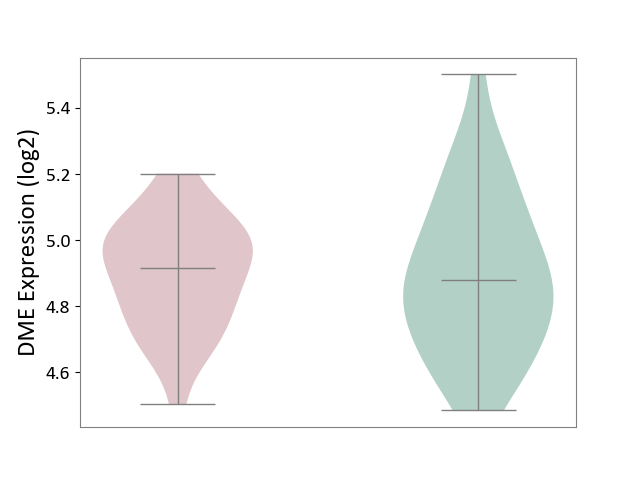
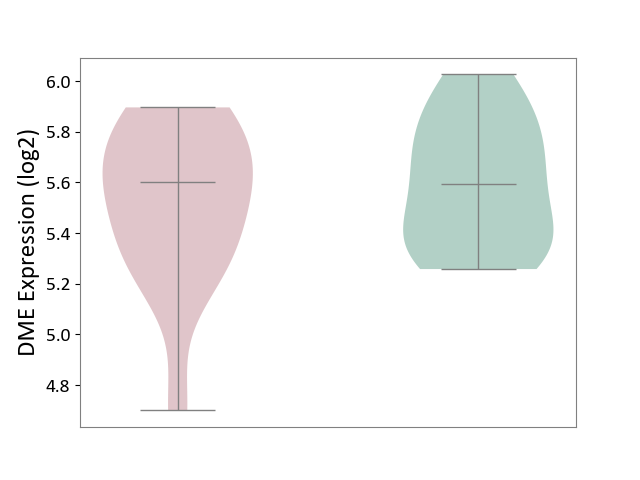
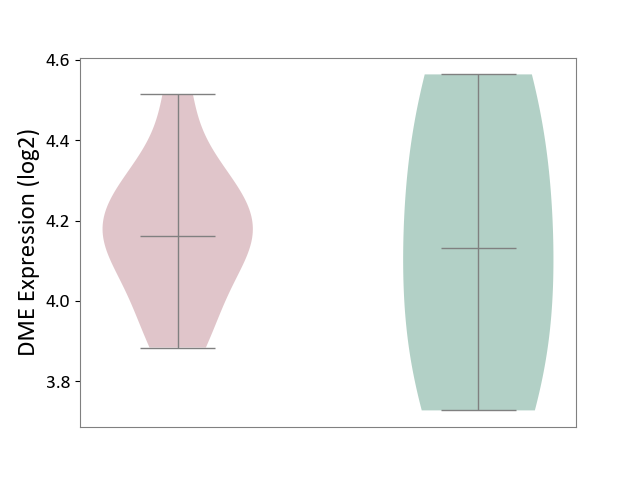
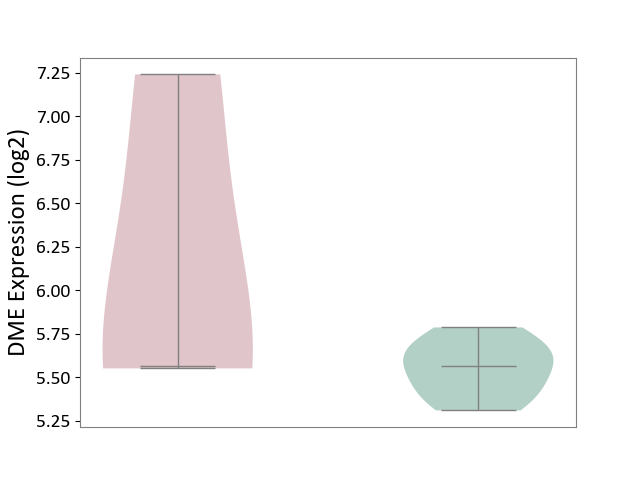
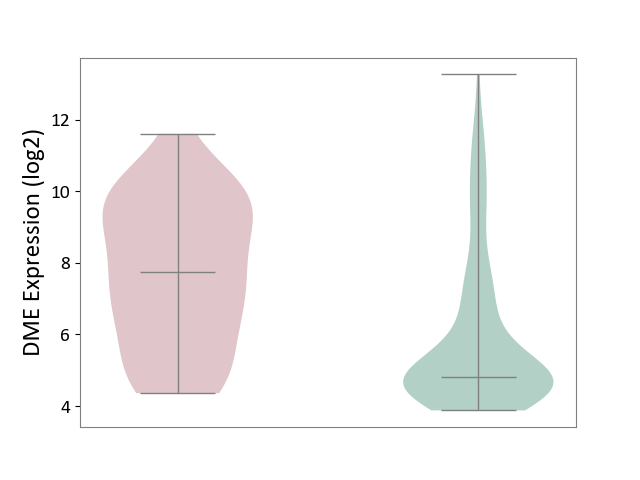
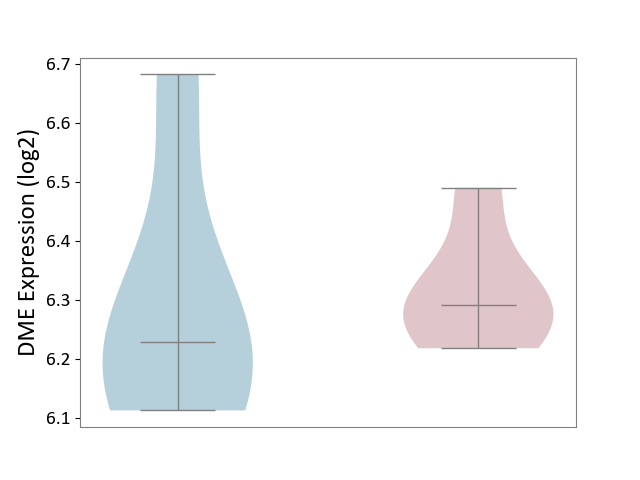
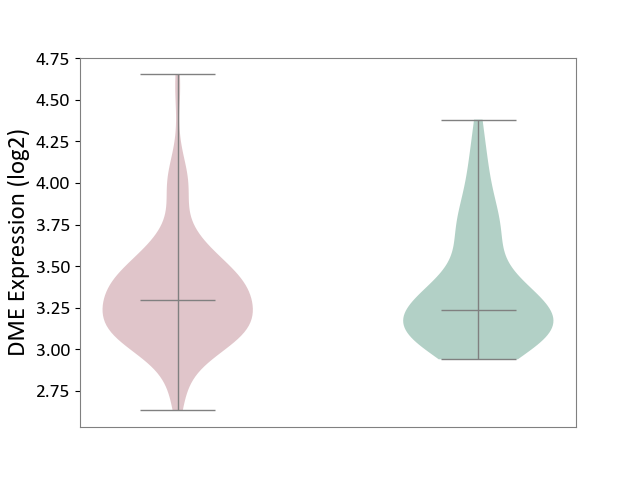
| ICD-11: 1E30 | Influenza | Click to Show/Hide | |||
| The Studied Tissue | Whole blood | ||||
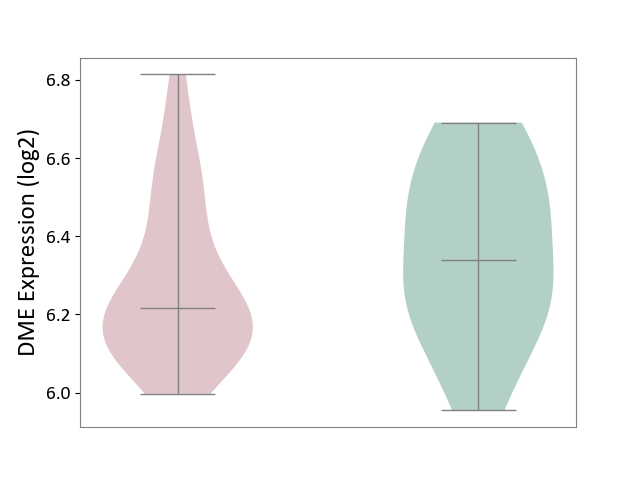
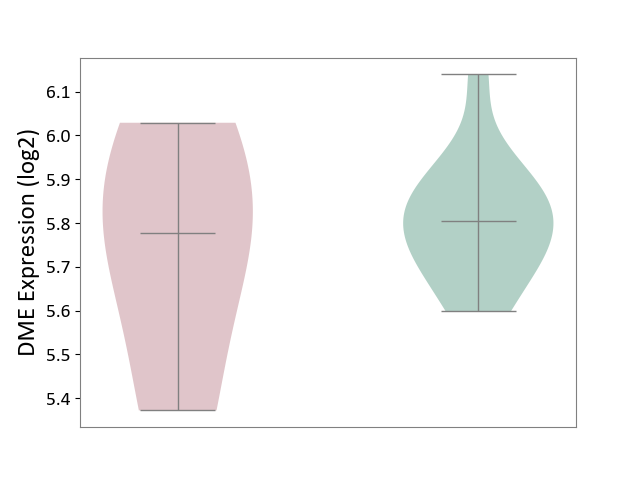
| The Specified Disease | Influenza [ICD-11:1E30] | ||||
| The Expression Level of Disease Section Compare with the Healthy Individual Tissue | p-value: 4.04E-01; Fold-change: 2.59E-02; Z-score: 2.94E-01 | ||||
|
DME expression in the diseased tissue of patients
DME expression in the normal tissue of healthy individuals
|
|||||
| Violin Diagram of DME Disease-specific Protein Abundances |
|
Click to View the Clearer Original Diagram | |||
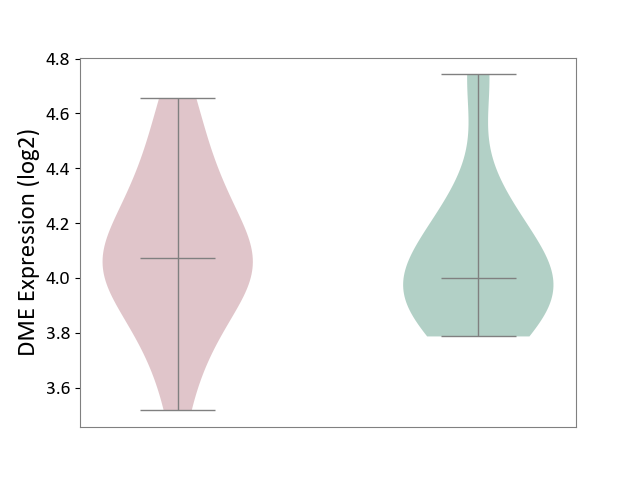
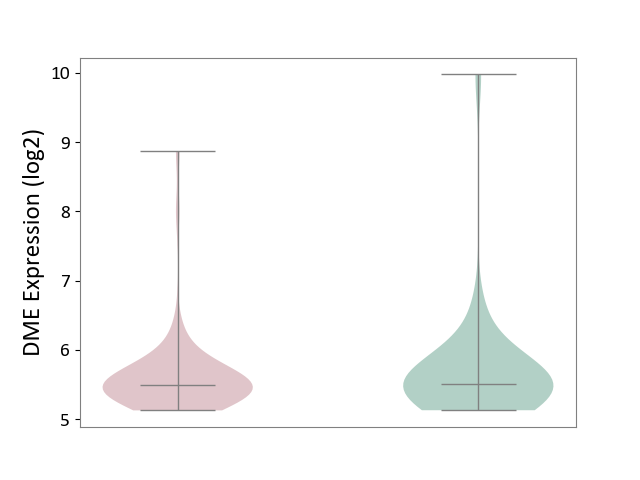
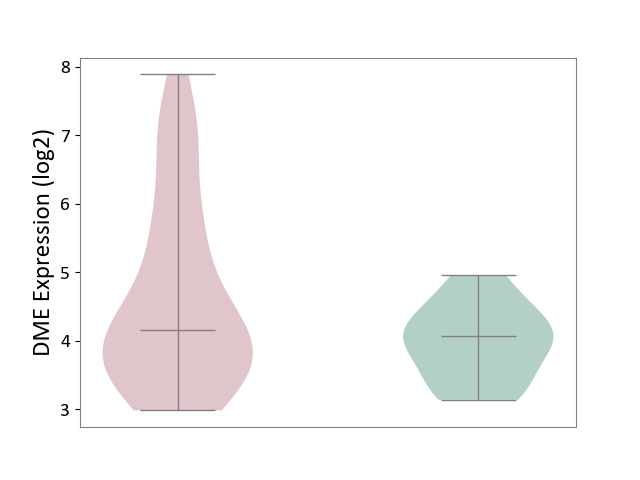
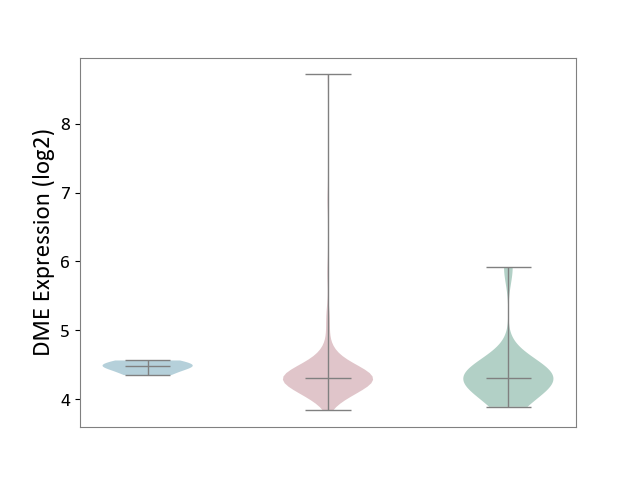
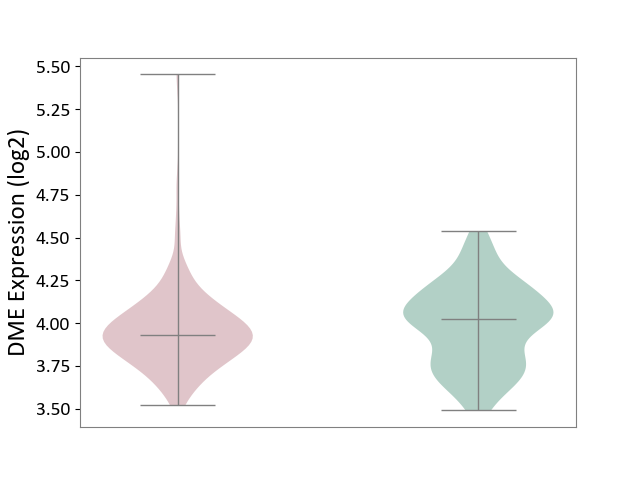
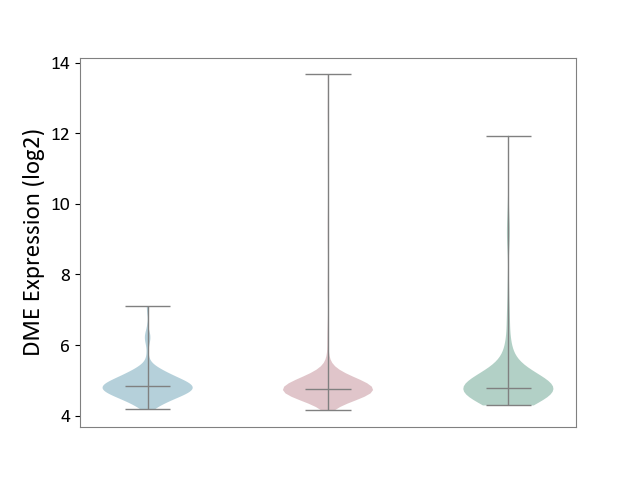
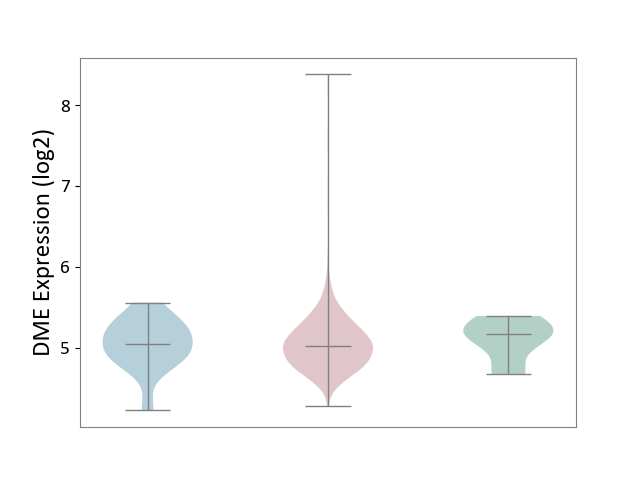
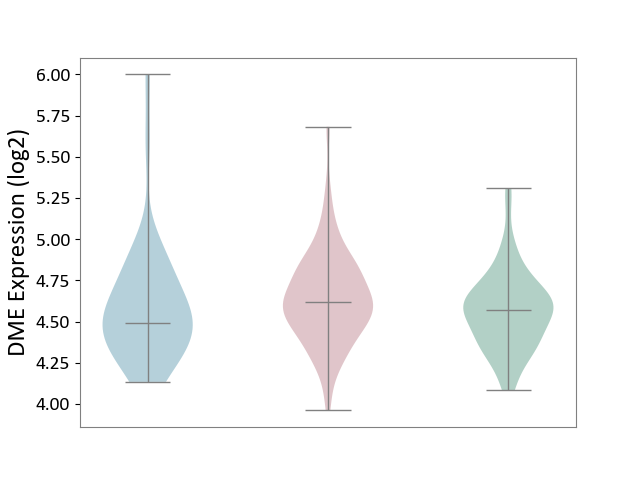
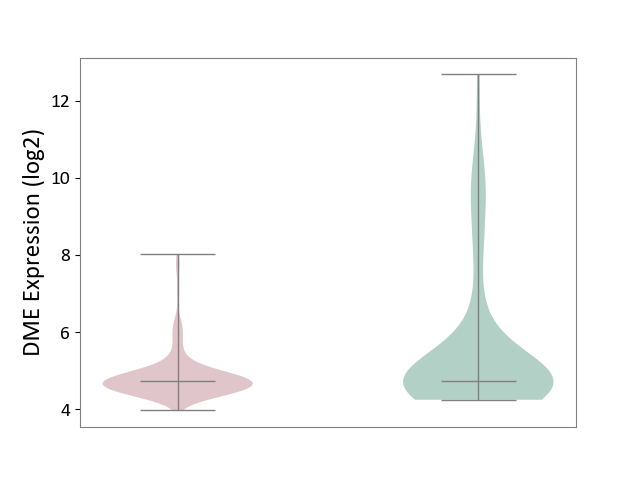
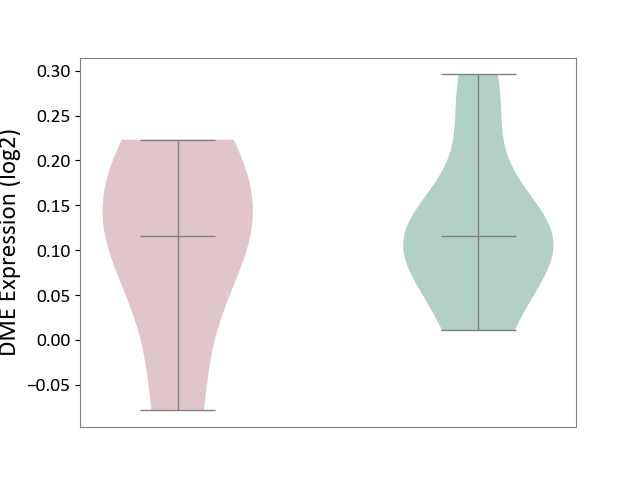
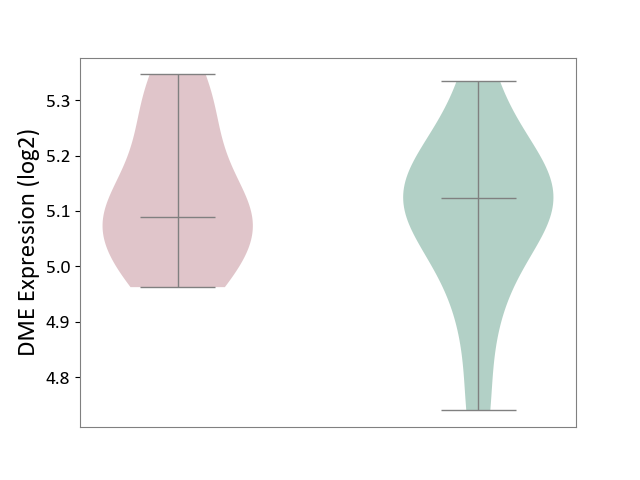
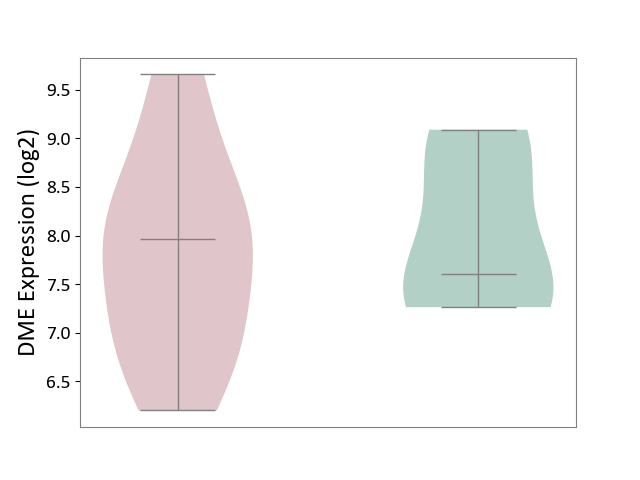
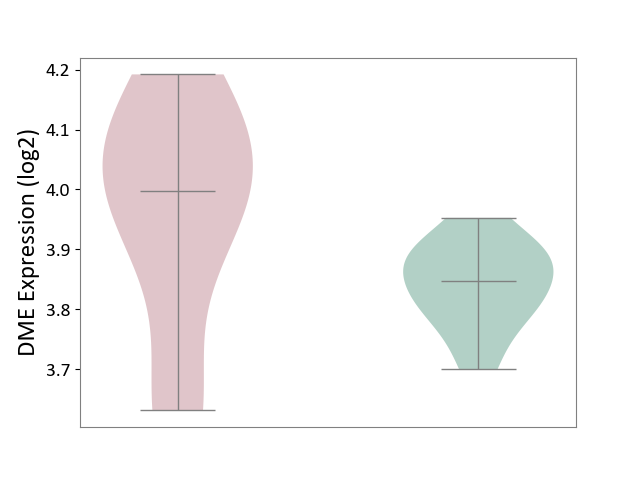
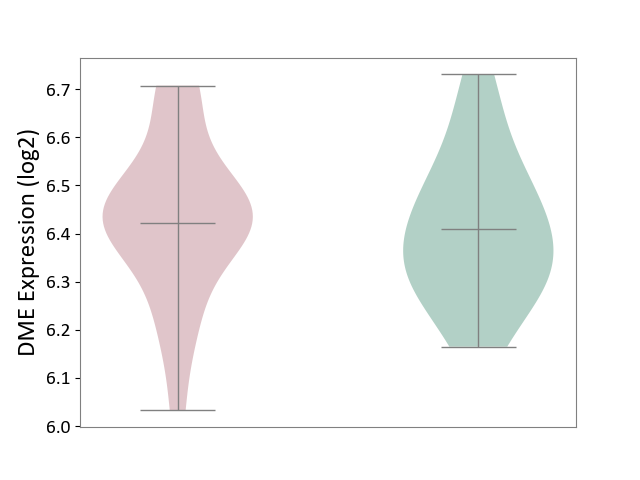
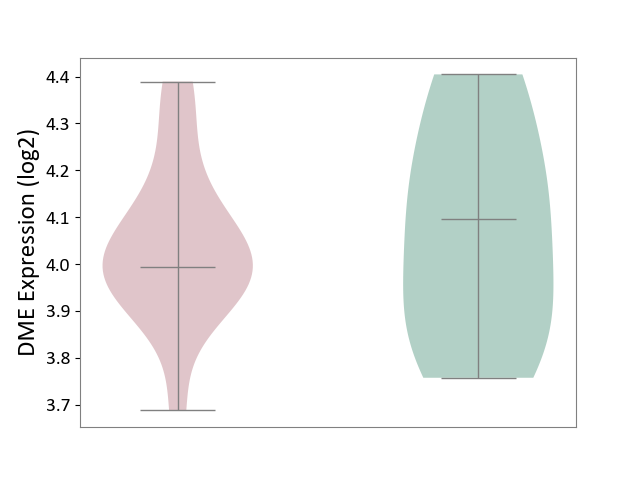
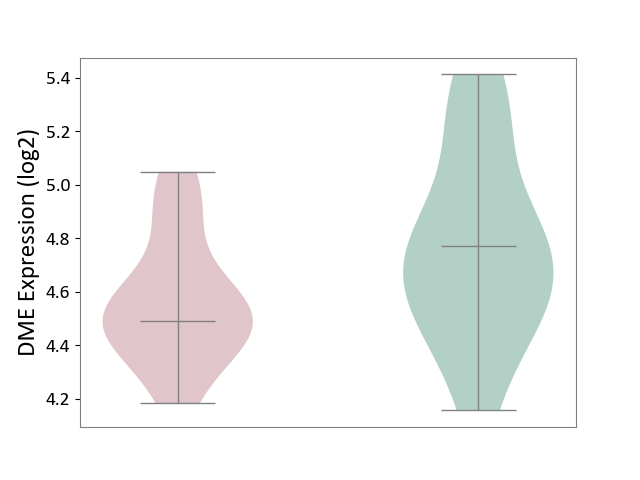
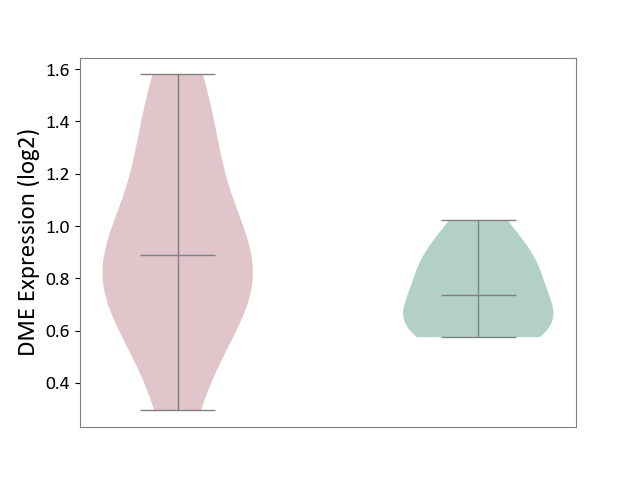
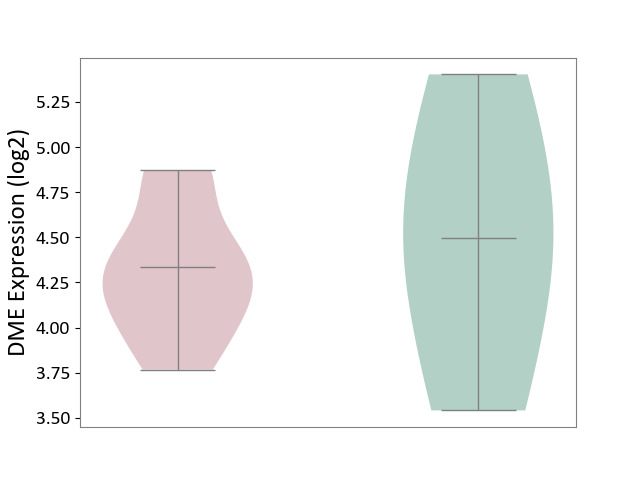
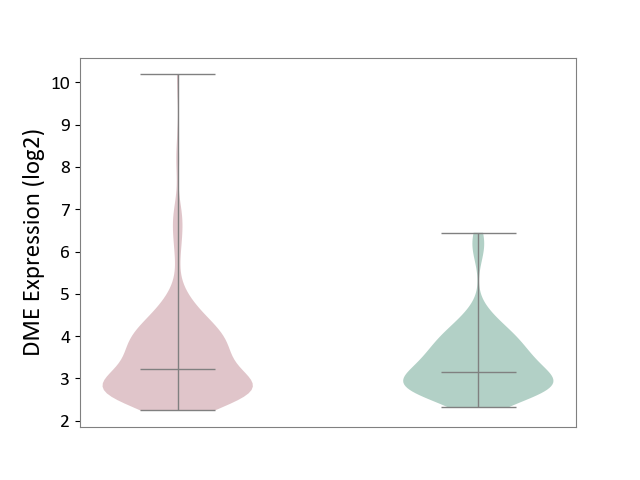
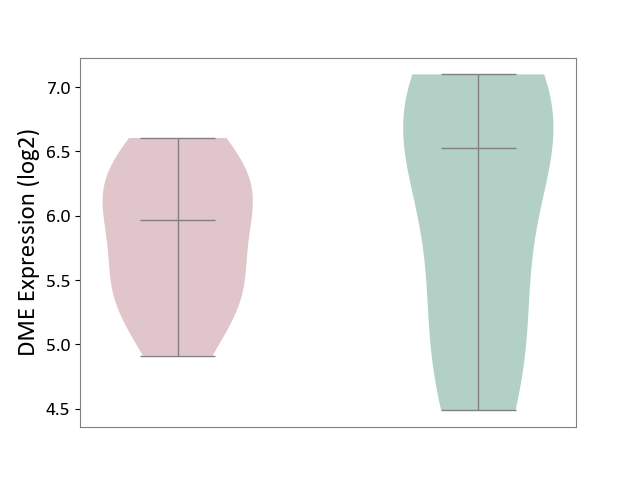
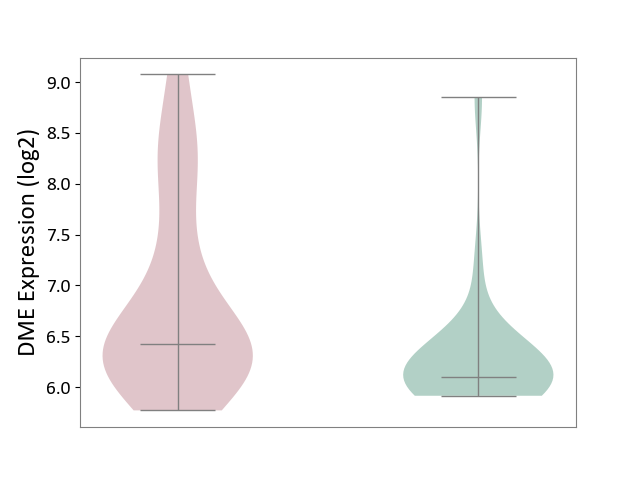
| ICD-11: 1E51 | Chronic viral hepatitis | Click to Show/Hide | |||
| The Studied Tissue | Whole blood | ||||
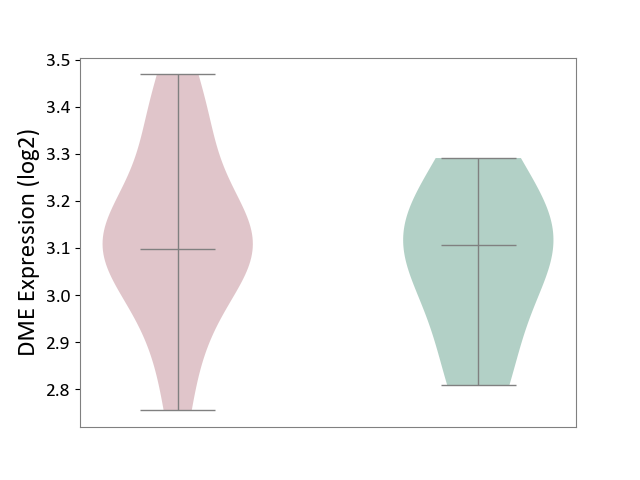
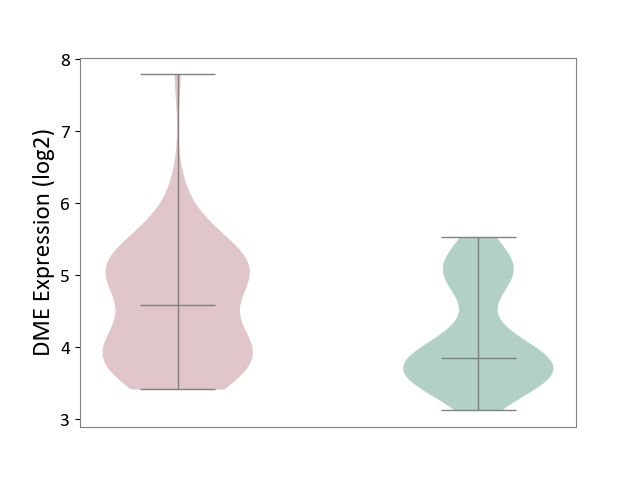
| The Specified Disease | Chronic hepatitis C [ICD-11:1E51.1] | ||||
| The Expression Level of Disease Section Compare with the Healthy Individual Tissue | p-value: 8.24E-01; Fold-change: 7.47E-02; Z-score: 2.73E-01 | ||||
|
DME expression in the diseased tissue of patients
DME expression in the normal tissue of healthy individuals
|
|||||
| Violin Diagram of DME Disease-specific Protein Abundances |
|
Click to View the Clearer Original Diagram | |||
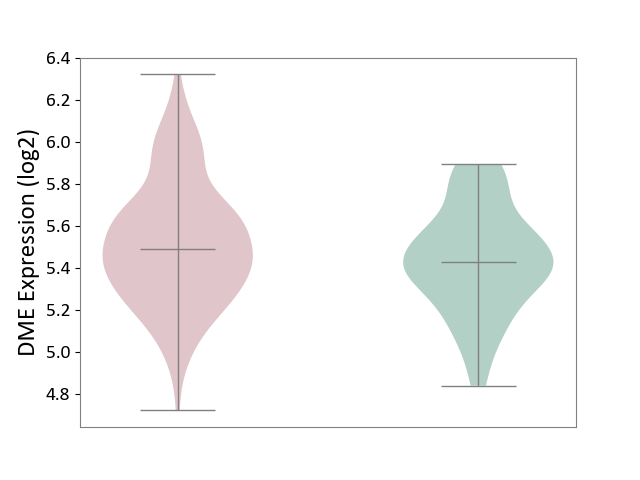
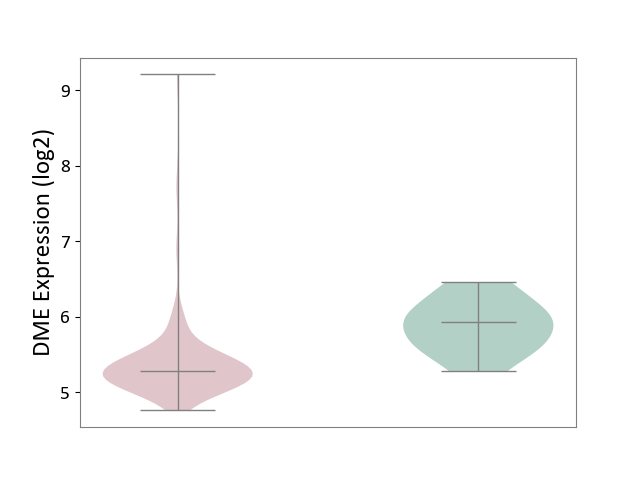
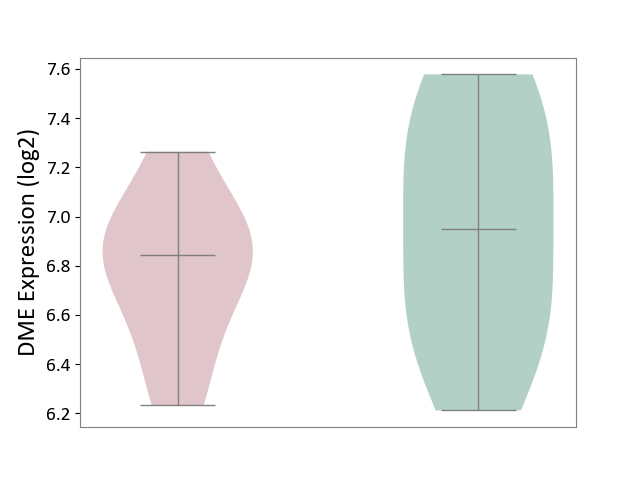
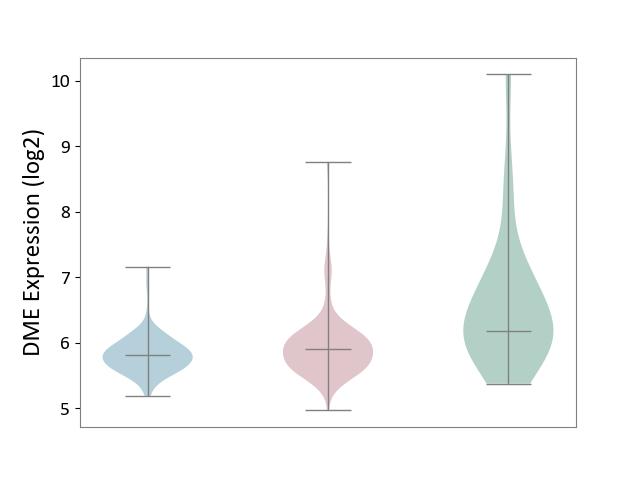
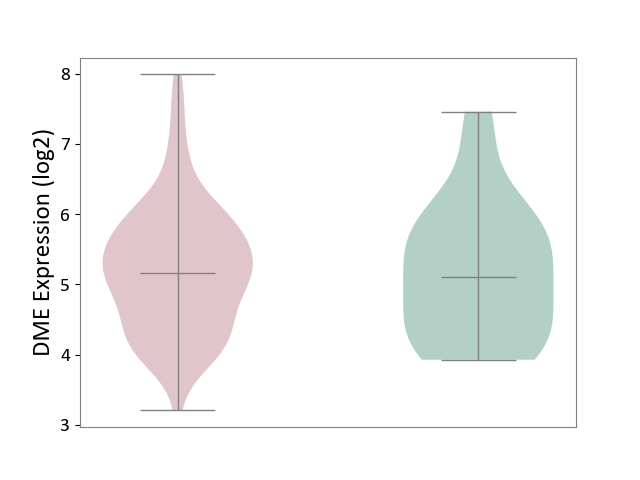
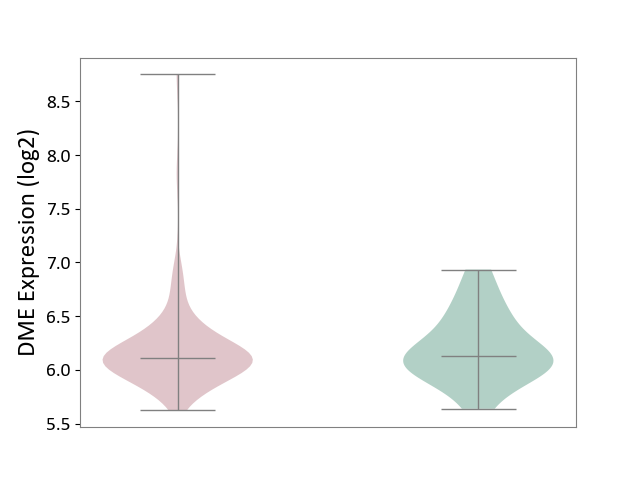
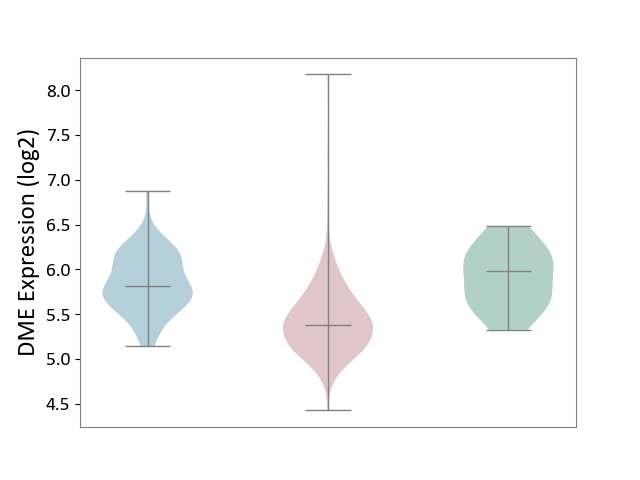
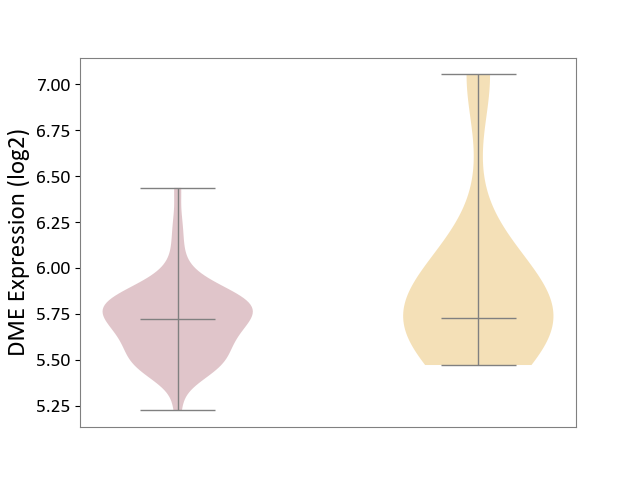
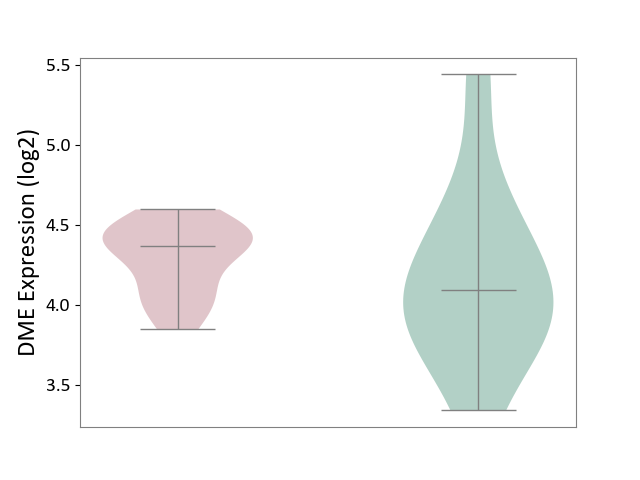
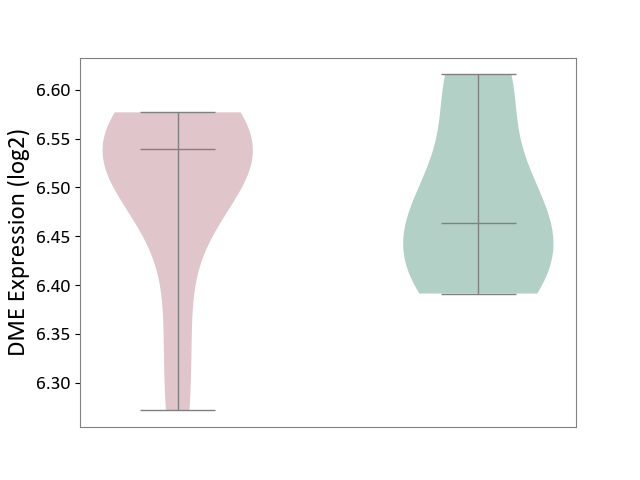
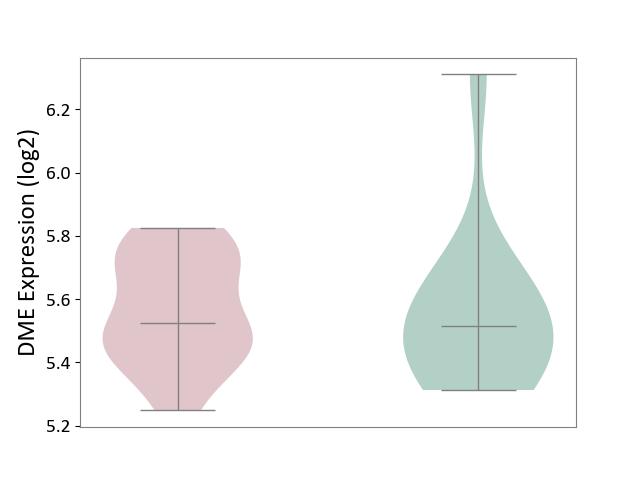
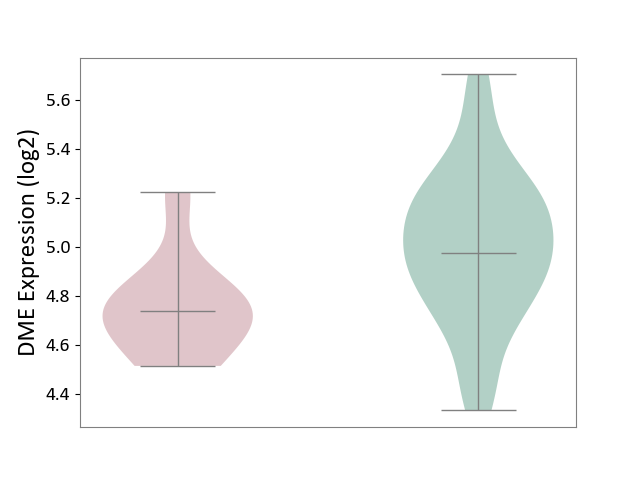
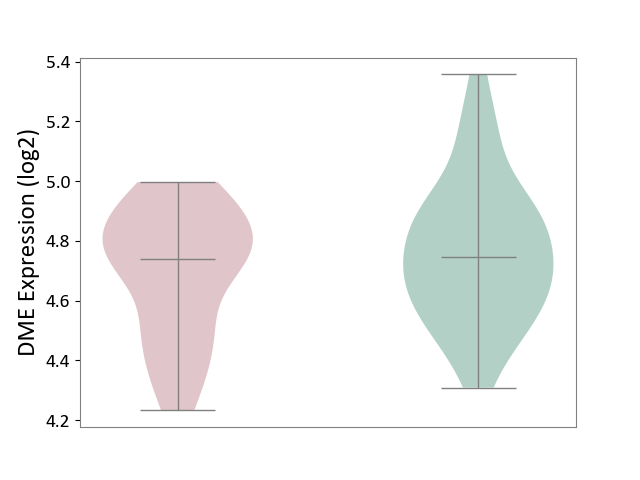
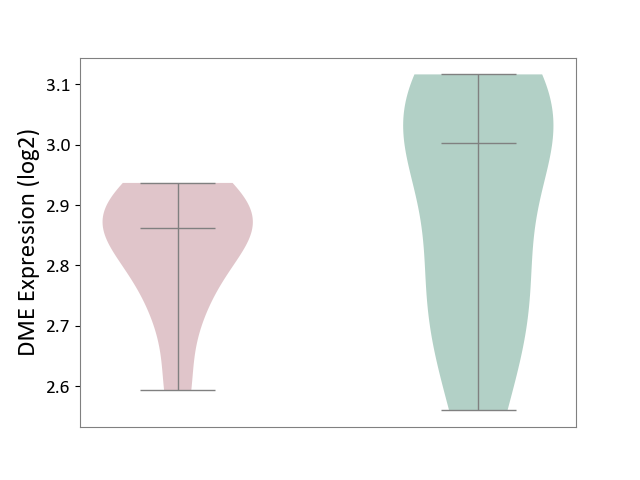
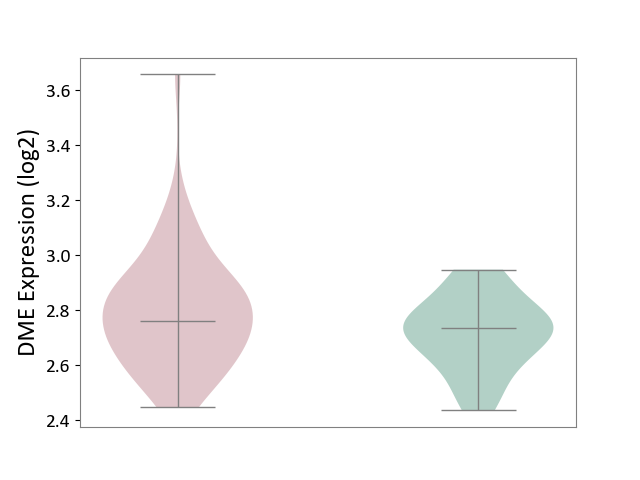
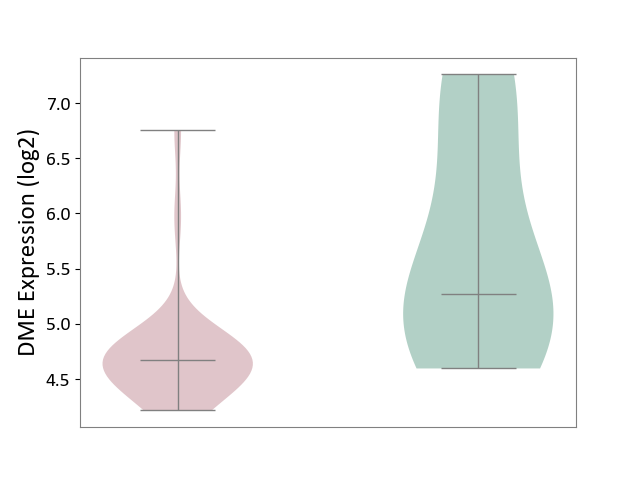
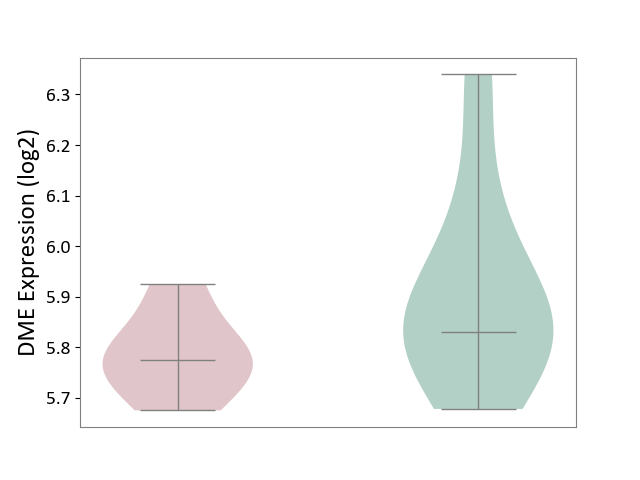
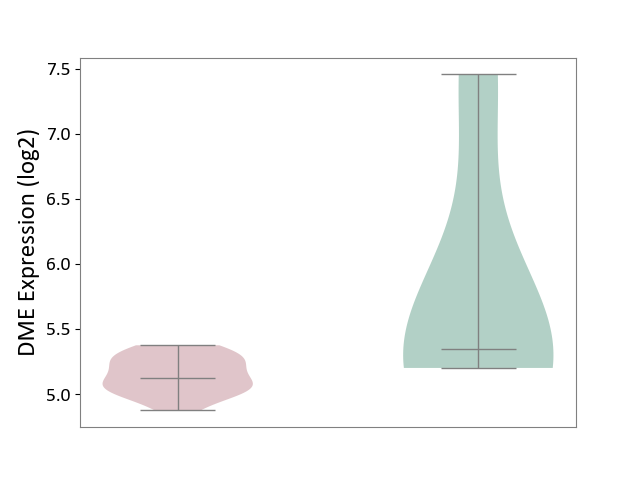
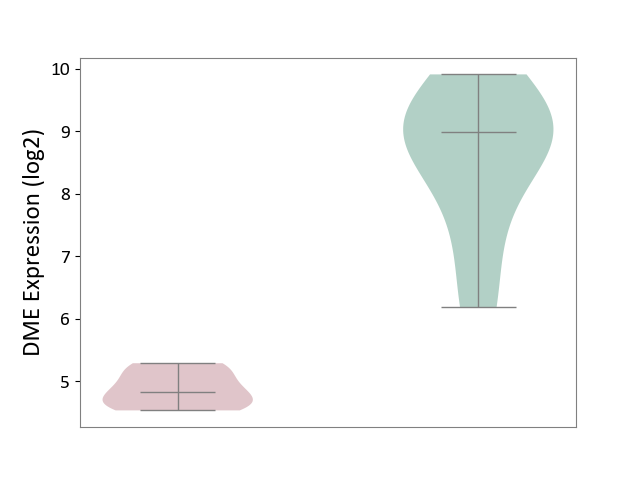
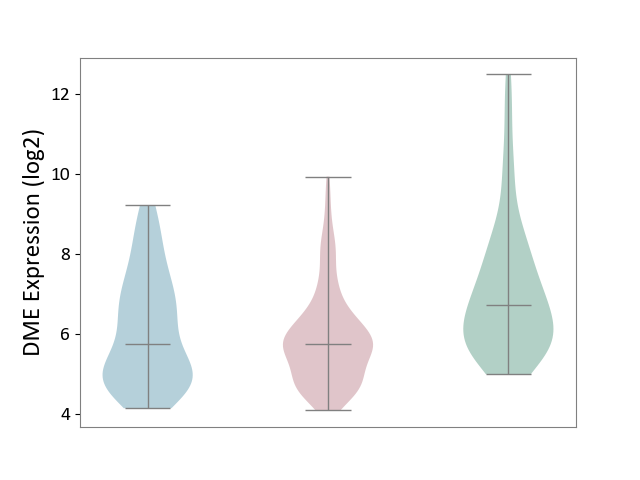
| ICD-11: 1G41 | Sepsis with septic shock | Click to Show/Hide | |||
| The Studied Tissue | Whole blood | ||||
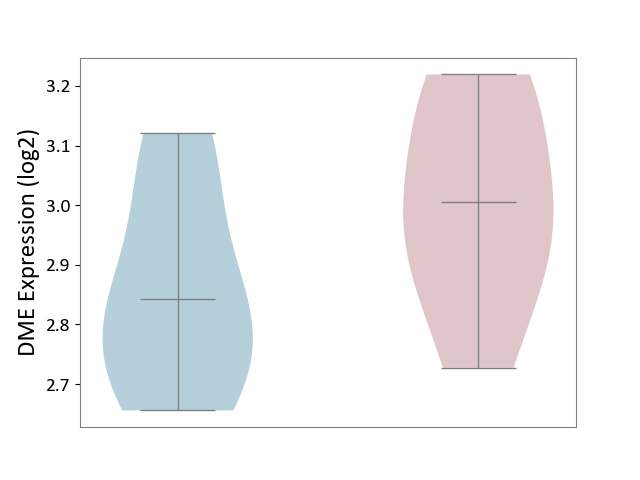
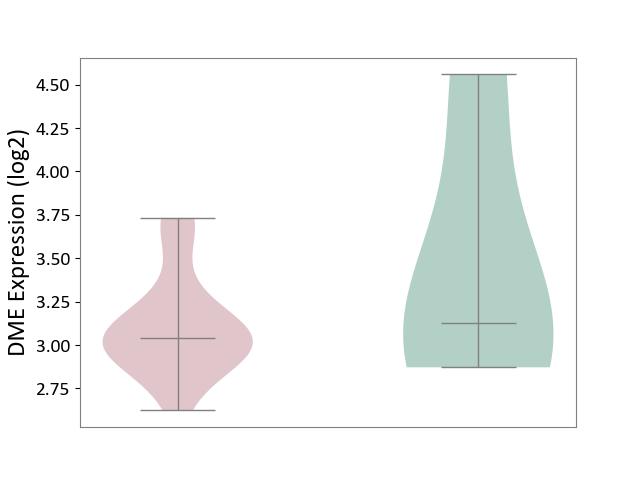
| The Specified Disease | Sepsis with septic shock [ICD-11:1G41] | ||||
| The Expression Level of Disease Section Compare with the Healthy Individual Tissue | p-value: 2.55E-09; Fold-change: 1.64E-01; Z-score: 6.56E-01 | ||||
|
DME expression in the diseased tissue of patients
DME expression in the normal tissue of healthy individuals
|
|||||
| Violin Diagram of DME Disease-specific Protein Abundances |
|
Click to View the Clearer Original Diagram | |||
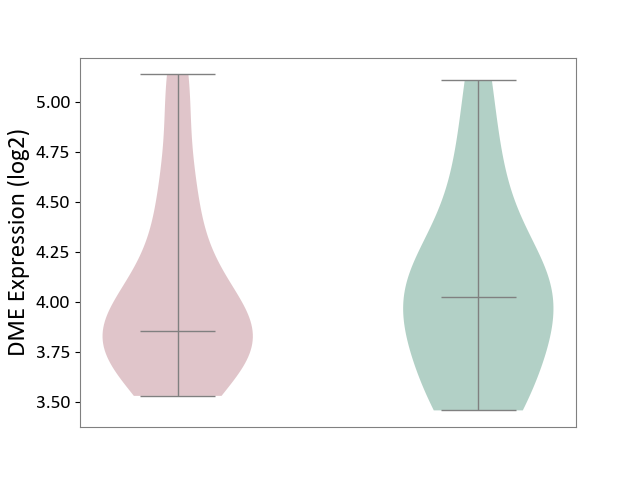
| ICD-11: CA40 | Respiratory syncytial virus infection | Click to Show/Hide | |||
| The Studied Tissue | Peripheral blood | ||||
| The Specified Disease | Pediatric respiratory syncytial virus infection [ICD-11:CA40.11] | ||||
| The Expression Level of Disease Section Compare with the Healthy Individual Tissue | p-value: 4.30E-01; Fold-change: -5.57E-03; Z-score: -3.08E-02 | ||||
|
DME expression in the diseased tissue of patients
DME expression in the normal tissue of healthy individuals
|
|||||
| Violin Diagram of DME Disease-specific Protein Abundances |
|
Click to View the Clearer Original Diagram | |||
| ICD-11: CA42 | Rhinovirus infection | Click to Show/Hide | |||
| The Studied Tissue | Nasal epithelium tissue | ||||
| The Specified Disease | Rhinovirus infection [ICD-11:CA42.1] | ||||
| The Expression Level of Disease Section Compare with the Healthy Individual Tissue | p-value: 6.79E-01; Fold-change: -1.94E-02; Z-score: -2.31E-02 | ||||
|
DME expression in the diseased tissue of patients
DME expression in the normal tissue of healthy individuals
|
|||||
| Violin Diagram of DME Disease-specific Protein Abundances |
|
Click to View the Clearer Original Diagram | |||
| ICD-11: KA60 | Neonatal sepsis | Click to Show/Hide | |||
| The Studied Tissue | Whole blood | ||||
| The Specified Disease | Neonatal sepsis [ICD-11:KA60] | ||||
| The Expression Level of Disease Section Compare with the Healthy Individual Tissue | p-value: 3.28E-02; Fold-change: 6.59E-02; Z-score: 2.63E-01 | ||||
|
DME expression in the diseased tissue of patients
DME expression in the normal tissue of healthy individuals
|
|||||
| Violin Diagram of DME Disease-specific Protein Abundances |
|
Click to View the Clearer Original Diagram | |||
| ICD Disease Classification 02 | Neoplasm | Click to Show/Hide | |||
| ICD-11: 2A00 | Brain cancer | Click to Show/Hide | |||
| The Studied Tissue | Nervous tissue | ||||
| The Specified Disease | Glioblastopma [ICD-11:2A00.00] | ||||
| The Expression Level of Disease Section Compare with the Healthy Individual Tissue | p-value: 5.48E-47; Fold-change: -3.01E-01; Z-score: -8.32E-01 | ||||
|
DME expression in the diseased tissue of patients
DME expression in the normal tissue of healthy individuals
|
|||||
| Violin Diagram of DME Disease-specific Protein Abundances |
|
Click to View the Clearer Original Diagram | |||
| The Studied Tissue | Brain stem tissue | ||||
| The Specified Disease | Glioma [ICD-11:2A00.0Y-2A00.0Z] | ||||
| The Expression Level of Disease Section Compare with the Healthy Individual Tissue | p-value: 9.90E-01; Fold-change: -3.64E-02; Z-score: -1.18E-01 | ||||
|
DME expression in the diseased tissue of patients
DME expression in the normal tissue of healthy individuals
|
|||||
| Violin Diagram of DME Disease-specific Protein Abundances |
|
Click to View the Clearer Original Diagram | |||
| The Studied Tissue | White matter tissue | ||||
| The Specified Disease | Glioma [ICD-11:2A00.0Y-2A00.0Z] | ||||
| The Expression Level of Disease Section Compare with the Healthy Individual Tissue | p-value: 2.46E-02; Fold-change: 9.11E-02; Z-score: 1.61E-01 | ||||
|
DME expression in the diseased tissue of patients
DME expression in the normal tissue of healthy individuals
|
|||||
| Violin Diagram of DME Disease-specific Protein Abundances |
|
Click to View the Clearer Original Diagram | |||
| The Studied Tissue | Brain stem tissue | ||||
| The Specified Disease | Neuroectodermal tumour [ICD-11:2A00.11] | ||||
| The Expression Level of Disease Section Compare with the Healthy Individual Tissue | p-value: 1.22E-03; Fold-change: -6.41E-01; Z-score: -1.80E+00 | ||||
|
DME expression in the diseased tissue of patients
DME expression in the normal tissue of healthy individuals
|
|||||
| Violin Diagram of DME Disease-specific Protein Abundances |
|
Click to View the Clearer Original Diagram | |||
| ICD-11: 2A20 | Myeloproliferative neoplasm | Click to Show/Hide | |||
| The Studied Tissue | Whole blood | ||||
| The Specified Disease | Myelofibrosis [ICD-11:2A20.2] | ||||
| The Expression Level of Disease Section Compare with the Healthy Individual Tissue | p-value: 5.59E-03; Fold-change: 1.79E-01; Z-score: 1.05E+00 | ||||
|
DME expression in the diseased tissue of patients
DME expression in the normal tissue of healthy individuals
|
|||||
| Violin Diagram of DME Disease-specific Protein Abundances |
|
Click to View the Clearer Original Diagram | |||
| The Studied Tissue | Whole blood | ||||
| The Specified Disease | Polycythemia vera [ICD-11:2A20.4] | ||||
| The Expression Level of Disease Section Compare with the Healthy Individual Tissue | p-value: 2.43E-12; Fold-change: 3.21E-01; Z-score: 1.69E+00 | ||||
|
DME expression in the diseased tissue of patients
DME expression in the normal tissue of healthy individuals
|
|||||
| Violin Diagram of DME Disease-specific Protein Abundances |
|
Click to View the Clearer Original Diagram | |||
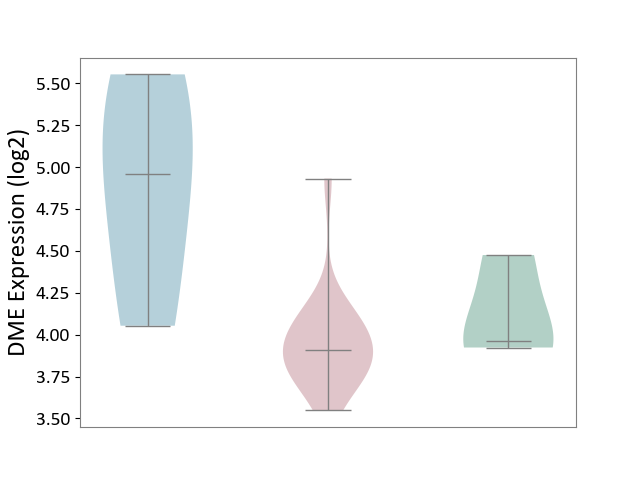
| ICD-11: 2A36 | Myelodysplastic syndrome | Click to Show/Hide | |||
| The Studied Tissue | Bone marrow | ||||
| The Specified Disease | Myelodysplastic syndrome [ICD-11:2A36-2A3Z] | ||||
| The Expression Level of Disease Section Compare with the Healthy Individual Tissue | p-value: 8.93E-01; Fold-change: -4.38E-03; Z-score: -9.40E-03 | ||||
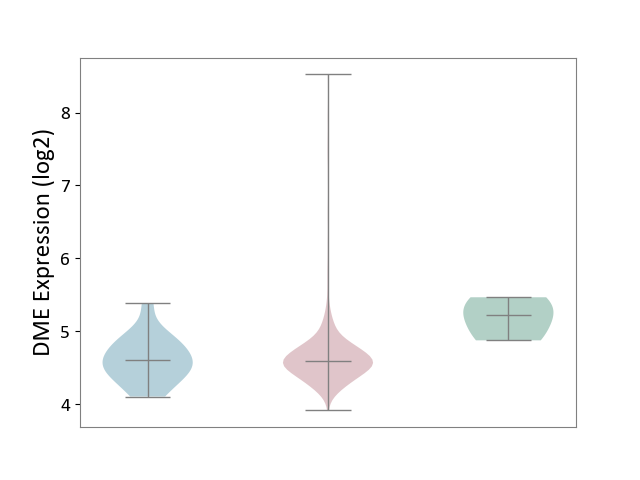
| The Expression Level of Disease Section Compare with the Adjacent Tissue | p-value: 1.31E-01; Fold-change: -1.64E-01; Z-score: -1.87E+00 | ||||
|
DME expression in the diseased tissue of patients
DME expression in the normal tissue adjacent to the diseased tissue of patients
DME expression in the normal tissue of healthy individuals
|
|||||
| Violin Diagram of DME Disease-specific Protein Abundances |
|
Click to View the Clearer Original Diagram | |||
| ICD-11: 2A81 | Diffuse large B-cell lymphoma | Click to Show/Hide | |||
| The Studied Tissue | Tonsil tissue | ||||
| The Specified Disease | Diffuse large B-cell lymphoma [ICD-11:2A81] | ||||
| The Expression Level of Disease Section Compare with the Healthy Individual Tissue | p-value: 3.93E-01; Fold-change: -1.05E-01; Z-score: -2.24E-01 | ||||
|
DME expression in the diseased tissue of patients
DME expression in the normal tissue of healthy individuals
|
|||||
| Violin Diagram of DME Disease-specific Protein Abundances |
|
Click to View the Clearer Original Diagram | |||
| ICD-11: 2A83 | Plasma cell neoplasm | Click to Show/Hide | |||
| The Studied Tissue | Peripheral blood | ||||
| The Specified Disease | Multiple myeloma [ICD-11:2A83.1] | ||||
| The Expression Level of Disease Section Compare with the Healthy Individual Tissue | p-value: 2.33E-01; Fold-change: 1.26E-01; Z-score: 3.83E-01 | ||||
|
DME expression in the diseased tissue of patients
DME expression in the normal tissue of healthy individuals
|
|||||
| Violin Diagram of DME Disease-specific Protein Abundances |
|
Click to View the Clearer Original Diagram | |||
| The Studied Tissue | Bone marrow | ||||
| The Specified Disease | Multiple myeloma [ICD-11:2A83.1] | ||||
| The Expression Level of Disease Section Compare with the Healthy Individual Tissue | p-value: 2.72E-02; Fold-change: -1.97E-01; Z-score: -8.12E-01 | ||||
|
DME expression in the diseased tissue of patients
DME expression in the normal tissue of healthy individuals
|
|||||
| Violin Diagram of DME Disease-specific Protein Abundances |
|
Click to View the Clearer Original Diagram | |||
| ICD-11: 2B33 | Leukaemia | Click to Show/Hide | |||
| The Studied Tissue | Bone marrow | ||||
| The Specified Disease | Acute myelocytic leukaemia [ICD-11:2B33.1] | ||||
| The Expression Level of Disease Section Compare with the Healthy Individual Tissue | p-value: 1.37E-01; Fold-change: -9.49E-02; Z-score: -3.91E-01 | ||||
|
DME expression in the diseased tissue of patients
DME expression in the normal tissue of healthy individuals
|
|||||
| Violin Diagram of DME Disease-specific Protein Abundances |
|
Click to View the Clearer Original Diagram | |||
| ICD-11: 2B6E | Oral cancer | Click to Show/Hide | |||
| The Studied Tissue | Oral tissue | ||||
| The Specified Disease | Oral cancer [ICD-11:2B6E] | ||||
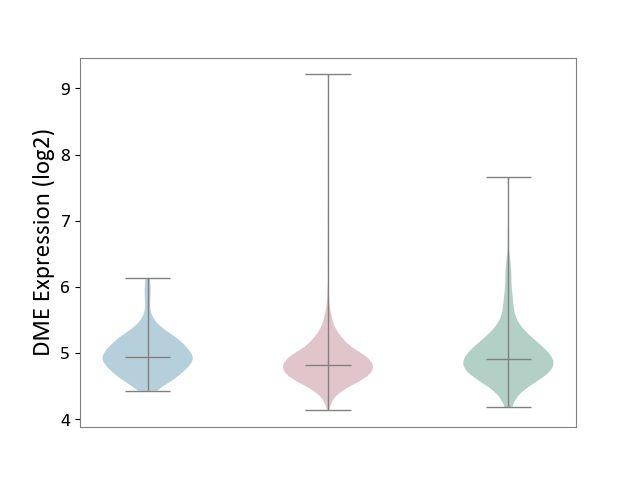
| The Expression Level of Disease Section Compare with the Healthy Individual Tissue | p-value: 4.45E-03; Fold-change: -2.74E-01; Z-score: -2.72E-01 | ||||
| The Expression Level of Disease Section Compare with the Adjacent Tissue | p-value: 5.56E-03; Fold-change: 1.02E-01; Z-score: 3.44E-01 | ||||
|
DME expression in the diseased tissue of patients
DME expression in the normal tissue adjacent to the diseased tissue of patients
DME expression in the normal tissue of healthy individuals
|
|||||
| Violin Diagram of DME Disease-specific Protein Abundances |
|
Click to View the Clearer Original Diagram | |||
| ICD-11: 2B70 | Esophageal cancer | Click to Show/Hide | |||
| The Studied Tissue | Esophagus | ||||
| The Specified Disease | Esophagal cancer [ICD-11:2B70] | ||||
| The Expression Level of Disease Section Compare with the Adjacent Tissue | p-value: 3.21E-01; Fold-change: -1.18E-01; Z-score: -1.83E-01 | ||||
|
DME expression in the diseased tissue of patients
DME expression in the normal tissue adjacent to the diseased tissue of patients
|
|||||
| Violin Diagram of DME Disease-specific Protein Abundances |
|
Click to View the Clearer Original Diagram | |||
| ICD-11: 2B72 | Stomach cancer | Click to Show/Hide | |||
| The Studied Tissue | Gastric tissue | ||||
| The Specified Disease | Gastric cancer [ICD-11:2B72] | ||||
| The Expression Level of Disease Section Compare with the Healthy Individual Tissue | p-value: 8.75E-02; Fold-change: -6.33E-01; Z-score: -2.13E+00 | ||||
| The Expression Level of Disease Section Compare with the Adjacent Tissue | p-value: 6.40E-01; Fold-change: -1.99E-02; Z-score: -6.21E-02 | ||||
|
DME expression in the diseased tissue of patients
DME expression in the normal tissue adjacent to the diseased tissue of patients
DME expression in the normal tissue of healthy individuals
|
|||||
| Violin Diagram of DME Disease-specific Protein Abundances |
|
Click to View the Clearer Original Diagram | |||
| ICD-11: 2B90 | Colon cancer | Click to Show/Hide | |||
| The Studied Tissue | Colon tissue | ||||
| The Specified Disease | Colon cancer [ICD-11:2B90] | ||||
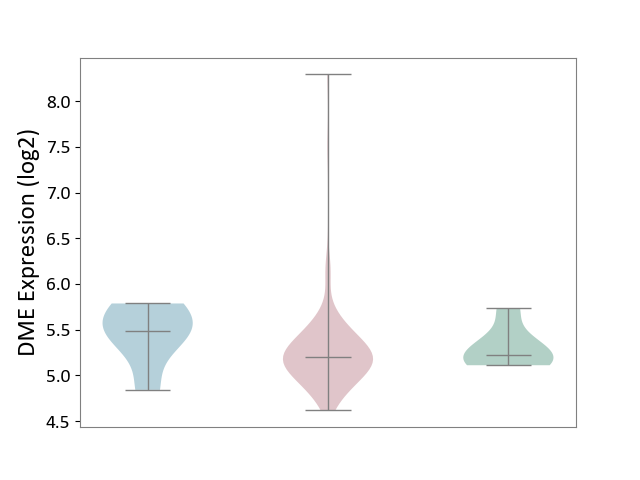
| The Expression Level of Disease Section Compare with the Healthy Individual Tissue | p-value: 2.62E-03; Fold-change: -8.29E-02; Z-score: -1.75E-01 | ||||
| The Expression Level of Disease Section Compare with the Adjacent Tissue | p-value: 8.43E-04; Fold-change: -1.18E-01; Z-score: -3.71E-01 | ||||
|
DME expression in the diseased tissue of patients
DME expression in the normal tissue adjacent to the diseased tissue of patients
DME expression in the normal tissue of healthy individuals
|
|||||
| Violin Diagram of DME Disease-specific Protein Abundances |
|
Click to View the Clearer Original Diagram | |||
| ICD-11: 2B92 | Rectal cancer | Click to Show/Hide | |||
| The Studied Tissue | Rectal colon tissue | ||||
| The Specified Disease | Rectal cancer [ICD-11:2B92] | ||||
| The Expression Level of Disease Section Compare with the Healthy Individual Tissue | p-value: 7.71E-01; Fold-change: -2.82E-02; Z-score: -1.18E-01 | ||||
| The Expression Level of Disease Section Compare with the Adjacent Tissue | p-value: 2.10E-01; Fold-change: -2.84E-01; Z-score: -8.26E-01 | ||||
|
DME expression in the diseased tissue of patients
DME expression in the normal tissue adjacent to the diseased tissue of patients
DME expression in the normal tissue of healthy individuals
|
|||||
| Violin Diagram of DME Disease-specific Protein Abundances |
|
Click to View the Clearer Original Diagram | |||
| ICD-11: 2C10 | Pancreatic cancer | Click to Show/Hide | |||
| The Studied Tissue | Pancreas | ||||
| The Specified Disease | Pancreatic cancer [ICD-11:2C10] | ||||
| The Expression Level of Disease Section Compare with the Healthy Individual Tissue | p-value: 1.38E-04; Fold-change: -3.36E-01; Z-score: -1.19E+00 | ||||
| The Expression Level of Disease Section Compare with the Adjacent Tissue | p-value: 3.89E-02; Fold-change: -2.29E-01; Z-score: -2.85E-01 | ||||
|
DME expression in the diseased tissue of patients
DME expression in the normal tissue adjacent to the diseased tissue of patients
DME expression in the normal tissue of healthy individuals
|
|||||
| Violin Diagram of DME Disease-specific Protein Abundances |
|
Click to View the Clearer Original Diagram | |||
| ICD-11: 2C12 | Liver cancer | Click to Show/Hide | |||
| The Studied Tissue | Liver tissue | ||||
| The Specified Disease | Liver cancer [ICD-11:2C12.0] | ||||
| The Expression Level of Disease Section Compare with the Healthy Individual Tissue | p-value: 2.48E-09; Fold-change: -2.66E+00; Z-score: -2.18E+00 | ||||
| The Expression Level of Disease Section Compare with the Adjacent Tissue | p-value: 2.14E-17; Fold-change: -1.94E+00; Z-score: -1.60E+00 | ||||
| The Expression Level of Disease Section Compare with the Other Disease Section | p-value: 1.10E-04; Fold-change: -2.18E+00; Z-score: -7.89E+00 | ||||
|
DME expression in the diseased tissue of patients
DME expression in the normal tissue adjacent to the diseased tissue of patients
DME expression in the normal tissue of healthy individuals
DME expression in tissue other than the diseased tissue of patients
|
|||||
| Violin Diagram of DME Disease-specific Protein Abundances |
|
Click to View the Clearer Original Diagram | |||
| ICD-11: 2C25 | Lung cancer | Click to Show/Hide | |||
| The Studied Tissue | Lung tissue | ||||
| The Specified Disease | Lung cancer [ICD-11:2C25] | ||||
| The Expression Level of Disease Section Compare with the Healthy Individual Tissue | p-value: 1.99E-02; Fold-change: -3.84E-03; Z-score: -3.55E-03 | ||||
| The Expression Level of Disease Section Compare with the Adjacent Tissue | p-value: 6.88E-01; Fold-change: -5.96E-02; Z-score: -1.38E-01 | ||||
|
DME expression in the diseased tissue of patients
DME expression in the normal tissue adjacent to the diseased tissue of patients
DME expression in the normal tissue of healthy individuals
|
|||||
| Violin Diagram of DME Disease-specific Protein Abundances |
|
Click to View the Clearer Original Diagram | |||
| ICD-11: 2C30 | Skin cancer | Click to Show/Hide | |||
| The Studied Tissue | Skin | ||||
| The Specified Disease | Melanoma [ICD-11:2C30] | ||||
| The Expression Level of Disease Section Compare with the Healthy Individual Tissue | p-value: 8.74E-01; Fold-change: 5.66E-02; Z-score: 5.84E-02 | ||||
|
DME expression in the diseased tissue of patients
DME expression in the normal tissue of healthy individuals
|
|||||
| Violin Diagram of DME Disease-specific Protein Abundances |
|
Click to View the Clearer Original Diagram | |||
| The Studied Tissue | Skin | ||||
| The Specified Disease | Skin cancer [ICD-11:2C30-2C3Z] | ||||
| The Expression Level of Disease Section Compare with the Healthy Individual Tissue | p-value: 1.66E-11; Fold-change: -4.25E-01; Z-score: -2.87E-01 | ||||
| The Expression Level of Disease Section Compare with the Adjacent Tissue | p-value: 8.52E-03; Fold-change: -7.65E-02; Z-score: -6.02E-02 | ||||
|
DME expression in the diseased tissue of patients
DME expression in the normal tissue adjacent to the diseased tissue of patients
DME expression in the normal tissue of healthy individuals
|
|||||
| Violin Diagram of DME Disease-specific Protein Abundances |
|
Click to View the Clearer Original Diagram | |||
| ICD-11: 2C6Z | Breast cancer | Click to Show/Hide | |||
| The Studied Tissue | Breast tissue | ||||
| The Specified Disease | Breast cancer [ICD-11:2C60-2C6Z] | ||||
| The Expression Level of Disease Section Compare with the Healthy Individual Tissue | p-value: 5.28E-09; Fold-change: -1.55E-01; Z-score: -1.78E-01 | ||||
| The Expression Level of Disease Section Compare with the Adjacent Tissue | p-value: 4.62E-02; Fold-change: -6.17E-02; Z-score: -1.01E-01 | ||||
|
DME expression in the diseased tissue of patients
DME expression in the normal tissue adjacent to the diseased tissue of patients
DME expression in the normal tissue of healthy individuals
|
|||||
| Violin Diagram of DME Disease-specific Protein Abundances |
|
Click to View the Clearer Original Diagram | |||
| ICD-11: 2C73 | Ovarian cancer | Click to Show/Hide | |||
| The Studied Tissue | Ovarian tissue | ||||
| The Specified Disease | Ovarian cancer [ICD-11:2C73] | ||||
| The Expression Level of Disease Section Compare with the Healthy Individual Tissue | p-value: 5.71E-01; Fold-change: -1.43E-01; Z-score: -5.46E-01 | ||||
| The Expression Level of Disease Section Compare with the Adjacent Tissue | p-value: 8.98E-01; Fold-change: -2.54E-02; Z-score: -7.86E-02 | ||||
|
DME expression in the diseased tissue of patients
DME expression in the normal tissue adjacent to the diseased tissue of patients
DME expression in the normal tissue of healthy individuals
|
|||||
| Violin Diagram of DME Disease-specific Protein Abundances |
|
Click to View the Clearer Original Diagram | |||
| ICD-11: 2C77 | Cervical cancer | Click to Show/Hide | |||
| The Studied Tissue | Cervical tissue | ||||
| The Specified Disease | Cervical cancer [ICD-11:2C77] | ||||
| The Expression Level of Disease Section Compare with the Healthy Individual Tissue | p-value: 7.17E-01; Fold-change: -1.72E-02; Z-score: -5.33E-02 | ||||
|
DME expression in the diseased tissue of patients
DME expression in the normal tissue of healthy individuals
|
|||||
| Violin Diagram of DME Disease-specific Protein Abundances |
|
Click to View the Clearer Original Diagram | |||
| ICD-11: 2C78 | Uterine cancer | Click to Show/Hide | |||
| The Studied Tissue | Endometrium tissue | ||||
| The Specified Disease | Uterine cancer [ICD-11:2C78] | ||||
| The Expression Level of Disease Section Compare with the Healthy Individual Tissue | p-value: 2.46E-01; Fold-change: -7.08E-03; Z-score: -2.10E-02 | ||||
| The Expression Level of Disease Section Compare with the Adjacent Tissue | p-value: 1.83E-01; Fold-change: -2.45E-01; Z-score: -4.13E-01 | ||||
|
DME expression in the diseased tissue of patients
DME expression in the normal tissue adjacent to the diseased tissue of patients
DME expression in the normal tissue of healthy individuals
|
|||||
| Violin Diagram of DME Disease-specific Protein Abundances |
|
Click to View the Clearer Original Diagram | |||
| ICD-11: 2C82 | Prostate cancer | Click to Show/Hide | |||
| The Studied Tissue | Prostate | ||||
| The Specified Disease | Prostate cancer [ICD-11:2C82] | ||||
| The Expression Level of Disease Section Compare with the Healthy Individual Tissue | p-value: 3.83E-02; Fold-change: -4.91E-01; Z-score: -4.02E-01 | ||||
|
DME expression in the diseased tissue of patients
DME expression in the normal tissue of healthy individuals
|
|||||
| Violin Diagram of DME Disease-specific Protein Abundances |
|
Click to View the Clearer Original Diagram | |||
| ICD-11: 2C90 | Renal cancer | Click to Show/Hide | |||
| The Studied Tissue | Kidney | ||||
| The Specified Disease | Renal cancer [ICD-11:2C90-2C91] | ||||
| The Expression Level of Disease Section Compare with the Healthy Individual Tissue | p-value: 8.34E-04; Fold-change: -6.01E-01; Z-score: -1.73E+00 | ||||
| The Expression Level of Disease Section Compare with the Adjacent Tissue | p-value: 3.55E-16; Fold-change: -4.34E-01; Z-score: -1.31E+00 | ||||
|
DME expression in the diseased tissue of patients
DME expression in the normal tissue adjacent to the diseased tissue of patients
DME expression in the normal tissue of healthy individuals
|
|||||
| Violin Diagram of DME Disease-specific Protein Abundances |
|
Click to View the Clearer Original Diagram | |||
| ICD-11: 2C92 | Ureter cancer | Click to Show/Hide | |||
| The Studied Tissue | Urothelium | ||||
| The Specified Disease | Ureter cancer [ICD-11:2C92] | ||||
| The Expression Level of Disease Section Compare with the Healthy Individual Tissue | p-value: 9.34E-01; Fold-change: -1.74E-01; Z-score: -3.73E-01 | ||||
|
DME expression in the diseased tissue of patients
DME expression in the normal tissue of healthy individuals
|
|||||
| Violin Diagram of DME Disease-specific Protein Abundances |
|
Click to View the Clearer Original Diagram | |||
| ICD-11: 2C94 | Bladder cancer | Click to Show/Hide | |||
| The Studied Tissue | Bladder tissue | ||||
| The Specified Disease | Bladder cancer [ICD-11:2C94] | ||||
| The Expression Level of Disease Section Compare with the Healthy Individual Tissue | p-value: 3.08E-03; Fold-change: -2.68E+00; Z-score: -2.11E+00 | ||||
|
DME expression in the diseased tissue of patients
DME expression in the normal tissue of healthy individuals
|
|||||
| Violin Diagram of DME Disease-specific Protein Abundances |
|
Click to View the Clearer Original Diagram | |||
| ICD-11: 2D02 | Retinal cancer | Click to Show/Hide | |||
| The Studied Tissue | Uvea | ||||
| The Specified Disease | Retinoblastoma [ICD-11:2D02.2] | ||||
| The Expression Level of Disease Section Compare with the Healthy Individual Tissue | p-value: 5.40E-02; Fold-change: -2.03E-01; Z-score: -1.83E+00 | ||||
|
DME expression in the diseased tissue of patients
DME expression in the normal tissue of healthy individuals
|
|||||
| Violin Diagram of DME Disease-specific Protein Abundances |
|
Click to View the Clearer Original Diagram | |||
| ICD-11: 2D10 | Thyroid cancer | Click to Show/Hide | |||
| The Studied Tissue | Thyroid | ||||
| The Specified Disease | Thyroid cancer [ICD-11:2D10] | ||||
| The Expression Level of Disease Section Compare with the Healthy Individual Tissue | p-value: 1.13E-02; Fold-change: 4.75E-02; Z-score: 1.99E-01 | ||||
| The Expression Level of Disease Section Compare with the Adjacent Tissue | p-value: 4.14E-01; Fold-change: 1.22E-01; Z-score: 3.45E-01 | ||||
|
DME expression in the diseased tissue of patients
DME expression in the normal tissue adjacent to the diseased tissue of patients
DME expression in the normal tissue of healthy individuals
|
|||||
| Violin Diagram of DME Disease-specific Protein Abundances |
|
Click to View the Clearer Original Diagram | |||
| ICD-11: 2D11 | Adrenal cancer | Click to Show/Hide | |||
| The Studied Tissue | Adrenal cortex | ||||
| The Specified Disease | Adrenocortical carcinoma [ICD-11:2D11.Z] | ||||
| The Expression Level of Disease Section Compare with the Other Disease Section | p-value: 1.17E-01; Fold-change: -7.18E-03; Z-score: -1.57E-02 | ||||
|
DME expression in the diseased tissue of patients
DME expression in tissue other than the diseased tissue of patients
|
|||||
| Violin Diagram of DME Disease-specific Protein Abundances |
|
Click to View the Clearer Original Diagram | |||
| ICD-11: 2D12 | Endocrine gland neoplasm | Click to Show/Hide | |||
| The Studied Tissue | Pituitary tissue | ||||
| The Specified Disease | Pituitary cancer [ICD-11:2D12] | ||||
| The Expression Level of Disease Section Compare with the Healthy Individual Tissue | p-value: 1.55E-02; Fold-change: 2.48E-01; Z-score: 7.63E-01 | ||||
|
DME expression in the diseased tissue of patients
DME expression in the normal tissue of healthy individuals
|
|||||
| Violin Diagram of DME Disease-specific Protein Abundances |
|
Click to View the Clearer Original Diagram | |||
| The Studied Tissue | Pituitary tissue | ||||
| The Specified Disease | Pituitary gonadotrope tumour [ICD-11:2D12] | ||||
| The Expression Level of Disease Section Compare with the Healthy Individual Tissue | p-value: 1.31E-01; Fold-change: 1.19E-01; Z-score: 3.91E-01 | ||||
|
DME expression in the diseased tissue of patients
DME expression in the normal tissue of healthy individuals
|
|||||
| Violin Diagram of DME Disease-specific Protein Abundances |
|
Click to View the Clearer Original Diagram | |||
| ICD-11: 2D42 | Head and neck cancer | Click to Show/Hide | |||
| The Studied Tissue | Head and neck tissue | ||||
| The Specified Disease | Head and neck cancer [ICD-11:2D42] | ||||
| The Expression Level of Disease Section Compare with the Healthy Individual Tissue | p-value: 1.33E-03; Fold-change: -1.84E-02; Z-score: -1.02E-02 | ||||
|
DME expression in the diseased tissue of patients
DME expression in the normal tissue of healthy individuals
|
|||||
| Violin Diagram of DME Disease-specific Protein Abundances |
|
Click to View the Clearer Original Diagram | |||
| ICD Disease Classification 03 | Blood/blood-forming organ disease | Click to Show/Hide | |||
| ICD-11: 3A51 | Sickle cell disorder | Click to Show/Hide | |||
| The Studied Tissue | Peripheral blood | ||||
| The Specified Disease | Sickle cell disease [ICD-11:3A51.0-3A51.3] | ||||
| The Expression Level of Disease Section Compare with the Healthy Individual Tissue | p-value: 4.92E-01; Fold-change: 2.74E-01; Z-score: 4.93E-01 | ||||
|
DME expression in the diseased tissue of patients
DME expression in the normal tissue of healthy individuals
|
|||||
| Violin Diagram of DME Disease-specific Protein Abundances |
|
Click to View the Clearer Original Diagram | |||
| ICD-11: 3A70 | Aplastic anaemia | Click to Show/Hide | |||
| The Studied Tissue | Bone marrow | ||||
| The Specified Disease | Shwachman-Diamond syndrome [ICD-11:3A70.0] | ||||
| The Expression Level of Disease Section Compare with the Healthy Individual Tissue | p-value: 1.86E-01; Fold-change: 3.91E-01; Z-score: 8.45E-01 | ||||
|
DME expression in the diseased tissue of patients
DME expression in the normal tissue of healthy individuals
|
|||||
| Violin Diagram of DME Disease-specific Protein Abundances |
|
Click to View the Clearer Original Diagram | |||
| ICD-11: 3B63 | Thrombocytosis | Click to Show/Hide | |||
| The Studied Tissue | Whole blood | ||||
| The Specified Disease | Thrombocythemia [ICD-11:3B63] | ||||
| The Expression Level of Disease Section Compare with the Healthy Individual Tissue | p-value: 1.69E-04; Fold-change: 2.49E-01; Z-score: 1.39E+00 | ||||
|
DME expression in the diseased tissue of patients
DME expression in the normal tissue of healthy individuals
|
|||||
| Violin Diagram of DME Disease-specific Protein Abundances |
|
Click to View the Clearer Original Diagram | |||
| ICD-11: 3B64 | Thrombocytopenia | Click to Show/Hide | |||
| The Studied Tissue | Whole blood | ||||
| The Specified Disease | Thrombocytopenia [ICD-11:3B64] | ||||
| The Expression Level of Disease Section Compare with the Healthy Individual Tissue | p-value: 7.49E-01; Fold-change: 0.00E+00; Z-score: 0.00E+00 | ||||
|
DME expression in the diseased tissue of patients
DME expression in the normal tissue of healthy individuals
|
|||||
| Violin Diagram of DME Disease-specific Protein Abundances |
|
Click to View the Clearer Original Diagram | |||
| ICD Disease Classification 04 | Immune system disease | Click to Show/Hide | |||
| ICD-11: 4A00 | Immunodeficiency | Click to Show/Hide | |||
| The Studied Tissue | Peripheral blood | ||||
| The Specified Disease | Immunodeficiency [ICD-11:4A00-4A20] | ||||
| The Expression Level of Disease Section Compare with the Healthy Individual Tissue | p-value: 7.54E-01; Fold-change: 7.57E-02; Z-score: 9.05E-01 | ||||
|
DME expression in the diseased tissue of patients
DME expression in the normal tissue of healthy individuals
|
|||||
| Violin Diagram of DME Disease-specific Protein Abundances |
|
Click to View the Clearer Original Diagram | |||
| ICD-11: 4A40 | Lupus erythematosus | Click to Show/Hide | |||
| The Studied Tissue | Whole blood | ||||
| The Specified Disease | Lupus erythematosus [ICD-11:4A40] | ||||
| The Expression Level of Disease Section Compare with the Healthy Individual Tissue | p-value: 8.79E-02; Fold-change: -8.23E-02; Z-score: -1.08E-01 | ||||
|
DME expression in the diseased tissue of patients
DME expression in the normal tissue of healthy individuals
|
|||||
| Violin Diagram of DME Disease-specific Protein Abundances |
|
Click to View the Clearer Original Diagram | |||
| ICD-11: 4A42 | Systemic sclerosis | Click to Show/Hide | |||
| The Studied Tissue | Whole blood | ||||
| The Specified Disease | Scleroderma [ICD-11:4A42.Z] | ||||
| The Expression Level of Disease Section Compare with the Healthy Individual Tissue | p-value: 2.88E-02; Fold-change: -1.27E-01; Z-score: -9.50E-01 | ||||
|
DME expression in the diseased tissue of patients
DME expression in the normal tissue of healthy individuals
|
|||||
| Violin Diagram of DME Disease-specific Protein Abundances |
|
Click to View the Clearer Original Diagram | |||
| ICD-11: 4A43 | Systemic autoimmune disease | Click to Show/Hide | |||
| The Studied Tissue | Salivary gland tissue | ||||
| The Specified Disease | Sjogren's syndrome [ICD-11:4A43.2] | ||||
| The Expression Level of Disease Section Compare with the Healthy Individual Tissue | p-value: 4.53E-01; Fold-change: -5.22E-02; Z-score: -1.69E-01 | ||||
| The Expression Level of Disease Section Compare with the Adjacent Tissue | p-value: 6.20E-02; Fold-change: -1.05E+00; Z-score: -1.62E+00 | ||||
|
DME expression in the diseased tissue of patients
DME expression in the normal tissue adjacent to the diseased tissue of patients
DME expression in the normal tissue of healthy individuals
|
|||||
| Violin Diagram of DME Disease-specific Protein Abundances |
|
Click to View the Clearer Original Diagram | |||
| ICD-11: 4A62 | Behcet disease | Click to Show/Hide | |||
| The Studied Tissue | Peripheral blood | ||||
| The Specified Disease | Behcet's disease [ICD-11:4A62] | ||||
| The Expression Level of Disease Section Compare with the Healthy Individual Tissue | p-value: 5.27E-01; Fold-change: -3.43E-02; Z-score: -2.24E-01 | ||||
|
DME expression in the diseased tissue of patients
DME expression in the normal tissue of healthy individuals
|
|||||
| Violin Diagram of DME Disease-specific Protein Abundances |
|
Click to View the Clearer Original Diagram | |||
| ICD-11: 4B04 | Monocyte count disorder | Click to Show/Hide | |||
| The Studied Tissue | Whole blood | ||||
| The Specified Disease | Autosomal dominant monocytopenia [ICD-11:4B04] | ||||
| The Expression Level of Disease Section Compare with the Healthy Individual Tissue | p-value: 3.61E-01; Fold-change: 4.78E-02; Z-score: 2.17E-01 | ||||
|
DME expression in the diseased tissue of patients
DME expression in the normal tissue of healthy individuals
|
|||||
| Violin Diagram of DME Disease-specific Protein Abundances |
|
Click to View the Clearer Original Diagram | |||
| ICD Disease Classification 05 | Endocrine/nutritional/metabolic disease | Click to Show/Hide | |||
| ICD-11: 5A11 | Type 2 diabetes mellitus | Click to Show/Hide | |||
| The Studied Tissue | Omental adipose tissue | ||||
| The Specified Disease | Obesity related type 2 diabetes [ICD-11:5A11] | ||||
| The Expression Level of Disease Section Compare with the Healthy Individual Tissue | p-value: 1.25E-01; Fold-change: 1.91E-01; Z-score: 6.80E-01 | ||||
|
DME expression in the diseased tissue of patients
DME expression in the normal tissue of healthy individuals
|
|||||
| Violin Diagram of DME Disease-specific Protein Abundances |
|
Click to View the Clearer Original Diagram | |||
| The Studied Tissue | Liver tissue | ||||
| The Specified Disease | Type 2 diabetes [ICD-11:5A11] | ||||
| The Expression Level of Disease Section Compare with the Healthy Individual Tissue | p-value: 6.63E-01; Fold-change: 3.55E-01; Z-score: 4.13E-01 | ||||
|
DME expression in the diseased tissue of patients
DME expression in the normal tissue of healthy individuals
|
|||||
| Violin Diagram of DME Disease-specific Protein Abundances |
|
Click to View the Clearer Original Diagram | |||
| ICD-11: 5A80 | Ovarian dysfunction | Click to Show/Hide | |||
| The Studied Tissue | Vastus lateralis muscle | ||||
| The Specified Disease | Polycystic ovary syndrome [ICD-11:5A80.1] | ||||
| The Expression Level of Disease Section Compare with the Healthy Individual Tissue | p-value: 8.67E-01; Fold-change: 7.63E-03; Z-score: 2.91E-02 | ||||
|
DME expression in the diseased tissue of patients
DME expression in the normal tissue of healthy individuals
|
|||||
| Violin Diagram of DME Disease-specific Protein Abundances |
|
Click to View the Clearer Original Diagram | |||
| ICD-11: 5C51 | Inborn carbohydrate metabolism disorder | Click to Show/Hide | |||
| The Studied Tissue | Biceps muscle | ||||
| The Specified Disease | Pompe disease [ICD-11:5C51.3] | ||||
| The Expression Level of Disease Section Compare with the Healthy Individual Tissue | p-value: 6.86E-01; Fold-change: -3.43E-02; Z-score: -1.84E-01 | ||||
|
DME expression in the diseased tissue of patients
DME expression in the normal tissue of healthy individuals
|
|||||
| Violin Diagram of DME Disease-specific Protein Abundances |
|
Click to View the Clearer Original Diagram | |||
| ICD-11: 5C56 | Lysosomal disease | Click to Show/Hide | |||
| The Studied Tissue | Whole blood | ||||
| The Specified Disease | Batten disease [ICD-11:5C56.1] | ||||
| The Expression Level of Disease Section Compare with the Healthy Individual Tissue | p-value: 3.47E-01; Fold-change: 1.69E-02; Z-score: 1.33E-01 | ||||
|
DME expression in the diseased tissue of patients
DME expression in the normal tissue of healthy individuals
|
|||||
| Violin Diagram of DME Disease-specific Protein Abundances |
|
Click to View the Clearer Original Diagram | |||
| ICD-11: 5C80 | Hyperlipoproteinaemia | Click to Show/Hide | |||
| The Studied Tissue | Peripheral blood | ||||
| The Specified Disease | Familial hypercholesterolemia [ICD-11:5C80.00] | ||||
| The Expression Level of Disease Section Compare with the Healthy Individual Tissue | p-value: 8.98E-02; Fold-change: 1.50E-01; Z-score: 2.10E+00 | ||||
|
DME expression in the diseased tissue of patients
DME expression in the normal tissue of healthy individuals
|
|||||
| Violin Diagram of DME Disease-specific Protein Abundances |
|
Click to View the Clearer Original Diagram | |||
| The Studied Tissue | Whole blood | ||||
| The Specified Disease | Familial hypercholesterolemia [ICD-11:5C80.00] | ||||
| The Expression Level of Disease Section Compare with the Healthy Individual Tissue | p-value: 7.09E-03; Fold-change: -2.38E-01; Z-score: -7.72E-01 | ||||
|
DME expression in the diseased tissue of patients
DME expression in the normal tissue of healthy individuals
|
|||||
| Violin Diagram of DME Disease-specific Protein Abundances |
|
Click to View the Clearer Original Diagram | |||
| ICD Disease Classification 06 | Mental/behavioural/neurodevelopmental disorder | Click to Show/Hide | |||
| ICD-11: 6A02 | Autism spectrum disorder | Click to Show/Hide | |||
| The Studied Tissue | Whole blood | ||||
| The Specified Disease | Autism [ICD-11:6A02] | ||||
| The Expression Level of Disease Section Compare with the Healthy Individual Tissue | p-value: 1.25E-01; Fold-change: -1.10E-01; Z-score: -4.94E-01 | ||||
|
DME expression in the diseased tissue of patients
DME expression in the normal tissue of healthy individuals
|
|||||
| Violin Diagram of DME Disease-specific Protein Abundances |
|
Click to View the Clearer Original Diagram | |||
| ICD-11: 6A20 | Schizophrenia | Click to Show/Hide | |||
| The Studied Tissue | Prefrontal cortex | ||||
| The Specified Disease | Schizophrenia [ICD-11:6A20] | ||||
| The Expression Level of Disease Section Compare with the Healthy Individual Tissue | p-value: 2.32E-01; Fold-change: -3.66E-02; Z-score: -1.30E-01 | ||||
|
DME expression in the diseased tissue of patients
DME expression in the normal tissue of healthy individuals
|
|||||
| Violin Diagram of DME Disease-specific Protein Abundances |
|
Click to View the Clearer Original Diagram | |||
| The Studied Tissue | Superior temporal cortex | ||||
| The Specified Disease | Schizophrenia [ICD-11:6A20] | ||||
| The Expression Level of Disease Section Compare with the Healthy Individual Tissue | p-value: 6.55E-01; Fold-change: 1.27E-02; Z-score: 8.44E-02 | ||||
|
DME expression in the diseased tissue of patients
DME expression in the normal tissue of healthy individuals
|
|||||
| Violin Diagram of DME Disease-specific Protein Abundances |
|
Click to View the Clearer Original Diagram | |||
| ICD-11: 6A60 | Bipolar disorder | Click to Show/Hide | |||
| The Studied Tissue | Prefrontal cortex | ||||
| The Specified Disease | Bipolar disorder [ICD-11:6A60-6A6Z] | ||||
| The Expression Level of Disease Section Compare with the Healthy Individual Tissue | p-value: 2.16E-01; Fold-change: -9.73E-03; Z-score: -4.11E-02 | ||||
|
DME expression in the diseased tissue of patients
DME expression in the normal tissue of healthy individuals
|
|||||
| Violin Diagram of DME Disease-specific Protein Abundances |
|
Click to View the Clearer Original Diagram | |||
| ICD-11: 6A70 | Depressive disorder | Click to Show/Hide | |||
| The Studied Tissue | Whole blood | ||||
| The Specified Disease | Major depressive disorder [ICD-11:6A70-6A7Z] | ||||
| The Expression Level of Disease Section Compare with the Healthy Individual Tissue | p-value: 2.61E-01; Fold-change: 1.37E-03; Z-score: 5.40E-03 | ||||
|
DME expression in the diseased tissue of patients
DME expression in the normal tissue of healthy individuals
|
|||||
| Violin Diagram of DME Disease-specific Protein Abundances |
|
Click to View the Clearer Original Diagram | |||
| The Studied Tissue | Hippocampus | ||||
| The Specified Disease | Major depressive disorder [ICD-11:6A70-6A7Z] | ||||
| The Expression Level of Disease Section Compare with the Healthy Individual Tissue | p-value: 9.33E-01; Fold-change: 3.62E-02; Z-score: 1.51E-01 | ||||
|
DME expression in the diseased tissue of patients
DME expression in the normal tissue of healthy individuals
|
|||||
| Violin Diagram of DME Disease-specific Protein Abundances |
|
Click to View the Clearer Original Diagram | |||
| ICD Disease Classification 08 | Nervous system disease | Click to Show/Hide | |||
| ICD-11: 8A00 | Parkinsonism | Click to Show/Hide | |||
| The Studied Tissue | Substantia nigra tissue | ||||
| The Specified Disease | Parkinson's disease [ICD-11:8A00.0] | ||||
| The Expression Level of Disease Section Compare with the Healthy Individual Tissue | p-value: 7.84E-01; Fold-change: -1.03E-01; Z-score: -4.48E-01 | ||||
|
DME expression in the diseased tissue of patients
DME expression in the normal tissue of healthy individuals
|
|||||
| Violin Diagram of DME Disease-specific Protein Abundances |
|
Click to View the Clearer Original Diagram | |||
| ICD-11: 8A01 | Choreiform disorder | Click to Show/Hide | |||
| The Studied Tissue | Whole blood | ||||
| The Specified Disease | Huntington's disease [ICD-11:8A01.10] | ||||
| The Expression Level of Disease Section Compare with the Healthy Individual Tissue | p-value: 3.39E-01; Fold-change: -1.41E-01; Z-score: -7.19E-01 | ||||
|
DME expression in the diseased tissue of patients
DME expression in the normal tissue of healthy individuals
|
|||||
| Violin Diagram of DME Disease-specific Protein Abundances |
|
Click to View the Clearer Original Diagram | |||
| ICD-11: 8A20 | Alzheimer disease | Click to Show/Hide | |||
| The Studied Tissue | Entorhinal cortex | ||||
| The Specified Disease | Alzheimer's disease [ICD-11:8A20] | ||||
| The Expression Level of Disease Section Compare with the Healthy Individual Tissue | p-value: 6.83E-06; Fold-change: -1.42E-01; Z-score: -4.93E-01 | ||||
|
DME expression in the diseased tissue of patients
DME expression in the normal tissue of healthy individuals
|
|||||
| Violin Diagram of DME Disease-specific Protein Abundances |
|
Click to View the Clearer Original Diagram | |||
| ICD-11: 8A2Y | Neurocognitive impairment | Click to Show/Hide | |||
| The Studied Tissue | White matter tissue | ||||
| The Specified Disease | HIV-associated neurocognitive impairment [ICD-11:8A2Y-8A2Z] | ||||
| The Expression Level of Disease Section Compare with the Healthy Individual Tissue | p-value: 2.24E-01; Fold-change: -1.24E-01; Z-score: -5.62E-01 | ||||
|
DME expression in the diseased tissue of patients
DME expression in the normal tissue of healthy individuals
|
|||||
| Violin Diagram of DME Disease-specific Protein Abundances |
|
Click to View the Clearer Original Diagram | |||
| ICD-11: 8A40 | Multiple sclerosis | Click to Show/Hide | |||
| The Studied Tissue | Plasmacytoid dendritic cells | ||||
| The Specified Disease | Multiple sclerosis [ICD-11:8A40] | ||||
| The Expression Level of Disease Section Compare with the Healthy Individual Tissue | p-value: 5.01E-01; Fold-change: -1.01E-02; Z-score: -6.05E-02 | ||||
|
DME expression in the diseased tissue of patients
DME expression in the normal tissue of healthy individuals
|
|||||
| Violin Diagram of DME Disease-specific Protein Abundances |
|
Click to View the Clearer Original Diagram | |||
| The Studied Tissue | Spinal cord | ||||
| The Specified Disease | Multiple sclerosis [ICD-11:8A40] | ||||
| The Expression Level of Disease Section Compare with the Adjacent Tissue | p-value: 1.39E-01; Fold-change: 1.62E-01; Z-score: 9.60E-01 | ||||
|
DME expression in the diseased tissue of patients
DME expression in the normal tissue adjacent to the diseased tissue of patients
|
|||||
| Violin Diagram of DME Disease-specific Protein Abundances |
|
Click to View the Clearer Original Diagram | |||
| ICD-11: 8A60 | Epilepsy | Click to Show/Hide | |||
| The Studied Tissue | Peritumoral cortex tissue | ||||
| The Specified Disease | Epilepsy [ICD-11:8A60-8A6Z] | ||||
| The Expression Level of Disease Section Compare with the Other Disease Section | p-value: 2.30E-01; Fold-change: 1.86E-01; Z-score: 1.25E+00 | ||||
|
DME expression in the diseased tissue of patients
DME expression in tissue other than the diseased tissue of patients
|
|||||
| Violin Diagram of DME Disease-specific Protein Abundances |
|
Click to View the Clearer Original Diagram | |||
| The Studied Tissue | Whole blood | ||||
| The Specified Disease | Seizure [ICD-11:8A60-8A6Z] | ||||
| The Expression Level of Disease Section Compare with the Healthy Individual Tissue | p-value: 4.82E-01; Fold-change: 9.24E-03; Z-score: 3.62E-02 | ||||
|
DME expression in the diseased tissue of patients
DME expression in the normal tissue of healthy individuals
|
|||||
| Violin Diagram of DME Disease-specific Protein Abundances |
|
Click to View the Clearer Original Diagram | |||
| ICD-11: 8B01 | Subarachnoid haemorrhage | Click to Show/Hide | |||
| The Studied Tissue | Intracranial artery | ||||
| The Specified Disease | Intracranial aneurysm [ICD-11:8B01.0] | ||||
| The Expression Level of Disease Section Compare with the Healthy Individual Tissue | p-value: 9.97E-02; Fold-change: -2.81E-01; Z-score: -7.92E-01 | ||||
|
DME expression in the diseased tissue of patients
DME expression in the normal tissue of healthy individuals
|
|||||
| Violin Diagram of DME Disease-specific Protein Abundances |
|
Click to View the Clearer Original Diagram | |||
| ICD-11: 8B11 | Cerebral ischaemic stroke | Click to Show/Hide | |||
| The Studied Tissue | Whole blood | ||||
| The Specified Disease | Cardioembolic stroke [ICD-11:8B11.20] | ||||
| The Expression Level of Disease Section Compare with the Healthy Individual Tissue | p-value: 5.24E-02; Fold-change: 2.60E-02; Z-score: 1.93E-01 | ||||
|
DME expression in the diseased tissue of patients
DME expression in the normal tissue of healthy individuals
|
|||||
| Violin Diagram of DME Disease-specific Protein Abundances |
|
Click to View the Clearer Original Diagram | |||
| The Studied Tissue | Peripheral blood | ||||
| The Specified Disease | Ischemic stroke [ICD-11:8B11] | ||||
| The Expression Level of Disease Section Compare with the Healthy Individual Tissue | p-value: 4.00E-01; Fold-change: 1.96E-02; Z-score: 1.29E-01 | ||||
|
DME expression in the diseased tissue of patients
DME expression in the normal tissue of healthy individuals
|
|||||
| Violin Diagram of DME Disease-specific Protein Abundances |
|
Click to View the Clearer Original Diagram | |||
| ICD-11: 8B60 | Motor neuron disease | Click to Show/Hide | |||
| The Studied Tissue | Skin | ||||
| The Specified Disease | Lateral sclerosis [ICD-11:8B60.4] | ||||
| The Expression Level of Disease Section Compare with the Healthy Individual Tissue | p-value: 8.86E-01; Fold-change: 3.14E-02; Z-score: 8.69E-02 | ||||
|
DME expression in the diseased tissue of patients
DME expression in the normal tissue of healthy individuals
|
|||||
| Violin Diagram of DME Disease-specific Protein Abundances |
|
Click to View the Clearer Original Diagram | |||
| The Studied Tissue | Cervical spinal cord | ||||
| The Specified Disease | Lateral sclerosis [ICD-11:8B60.4] | ||||
| The Expression Level of Disease Section Compare with the Healthy Individual Tissue | p-value: 1.89E-01; Fold-change: 1.53E-01; Z-score: 9.88E-01 | ||||
|
DME expression in the diseased tissue of patients
DME expression in the normal tissue of healthy individuals
|
|||||
| Violin Diagram of DME Disease-specific Protein Abundances |
|
Click to View the Clearer Original Diagram | |||
| ICD-11: 8C70 | Muscular dystrophy | Click to Show/Hide | |||
| The Studied Tissue | Muscle tissue | ||||
| The Specified Disease | Myopathy [ICD-11:8C70.6] | ||||
| The Expression Level of Disease Section Compare with the Healthy Individual Tissue | p-value: 3.18E-02; Fold-change: -5.95E-01; Z-score: -5.76E-01 | ||||
|
DME expression in the diseased tissue of patients
DME expression in the normal tissue of healthy individuals
|
|||||
| Violin Diagram of DME Disease-specific Protein Abundances |
|
Click to View the Clearer Original Diagram | |||
| ICD-11: 8C75 | Distal myopathy | Click to Show/Hide | |||
| The Studied Tissue | Muscle tissue | ||||
| The Specified Disease | Tibial muscular dystrophy [ICD-11:8C75] | ||||
| The Expression Level of Disease Section Compare with the Healthy Individual Tissue | p-value: 2.71E-02; Fold-change: -2.19E-01; Z-score: -1.44E-01 | ||||
|
DME expression in the diseased tissue of patients
DME expression in the normal tissue of healthy individuals
|
|||||
| Violin Diagram of DME Disease-specific Protein Abundances |
|
Click to View the Clearer Original Diagram | |||
| ICD Disease Classification 09 | Visual system disease | Click to Show/Hide | |||
| ICD-11: 9A96 | Anterior uveitis | Click to Show/Hide | |||
| The Studied Tissue | Peripheral monocyte | ||||
| The Specified Disease | Autoimmune uveitis [ICD-11:9A96] | ||||
| The Expression Level of Disease Section Compare with the Healthy Individual Tissue | p-value: 6.75E-01; Fold-change: -2.61E-02; Z-score: -1.86E-01 | ||||
|
DME expression in the diseased tissue of patients
DME expression in the normal tissue of healthy individuals
|
|||||
| Violin Diagram of DME Disease-specific Protein Abundances |
|
Click to View the Clearer Original Diagram | |||
| ICD Disease Classification 11 | Circulatory system disease | Click to Show/Hide | |||
| ICD-11: BA41 | Myocardial infarction | Click to Show/Hide | |||
| The Studied Tissue | Peripheral blood | ||||
| The Specified Disease | Myocardial infarction [ICD-11:BA41-BA50] | ||||
| The Expression Level of Disease Section Compare with the Healthy Individual Tissue | p-value: 1.73E-03; Fold-change: 7.35E-01; Z-score: 1.07E+00 | ||||
|
DME expression in the diseased tissue of patients
DME expression in the normal tissue of healthy individuals
|
|||||
| Violin Diagram of DME Disease-specific Protein Abundances |
|
Click to View the Clearer Original Diagram | |||
| ICD-11: BA80 | Coronary artery disease | Click to Show/Hide | |||
| The Studied Tissue | Peripheral blood | ||||
| The Specified Disease | Coronary artery disease [ICD-11:BA80-BA8Z] | ||||
| The Expression Level of Disease Section Compare with the Healthy Individual Tissue | p-value: 4.81E-01; Fold-change: -8.88E-02; Z-score: -1.15E-01 | ||||
|
DME expression in the diseased tissue of patients
DME expression in the normal tissue of healthy individuals
|
|||||
| Violin Diagram of DME Disease-specific Protein Abundances |
|
Click to View the Clearer Original Diagram | |||
| ICD-11: BB70 | Aortic valve stenosis | Click to Show/Hide | |||
| The Studied Tissue | Calcified aortic valve | ||||
| The Specified Disease | Aortic stenosis [ICD-11:BB70] | ||||
| The Expression Level of Disease Section Compare with the Healthy Individual Tissue | p-value: 5.11E-01; Fold-change: -1.37E-01; Z-score: -3.55E-01 | ||||
|
DME expression in the diseased tissue of patients
DME expression in the normal tissue of healthy individuals
|
|||||
| Violin Diagram of DME Disease-specific Protein Abundances |
|
Click to View the Clearer Original Diagram | |||
| ICD Disease Classification 12 | Respiratory system disease | Click to Show/Hide | |||
| ICD-11: 7A40 | Central sleep apnoea | Click to Show/Hide | |||
| The Studied Tissue | Hyperplastic tonsil | ||||
| The Specified Disease | Apnea [ICD-11:7A40] | ||||
| The Expression Level of Disease Section Compare with the Healthy Individual Tissue | p-value: 4.19E-01; Fold-change: -2.85E-03; Z-score: -1.72E-02 | ||||
|
DME expression in the diseased tissue of patients
DME expression in the normal tissue of healthy individuals
|
|||||
| Violin Diagram of DME Disease-specific Protein Abundances |
|
Click to View the Clearer Original Diagram | |||
| ICD-11: CA08 | Vasomotor or allergic rhinitis | Click to Show/Hide | |||
| The Studied Tissue | Peripheral blood | ||||
| The Specified Disease | Olive pollen allergy [ICD-11:CA08.00] | ||||
| The Expression Level of Disease Section Compare with the Healthy Individual Tissue | p-value: 6.85E-01; Fold-change: -1.63E-01; Z-score: -2.11E-01 | ||||
|
DME expression in the diseased tissue of patients
DME expression in the normal tissue of healthy individuals
|
|||||
| Violin Diagram of DME Disease-specific Protein Abundances |
|
Click to View the Clearer Original Diagram | |||
| ICD-11: CA0A | Chronic rhinosinusitis | Click to Show/Hide | |||
| The Studied Tissue | Sinus mucosa tissue | ||||
| The Specified Disease | Chronic rhinosinusitis [ICD-11:CA0A] | ||||
| The Expression Level of Disease Section Compare with the Healthy Individual Tissue | p-value: 1.28E-01; Fold-change: -5.67E-02; Z-score: -2.90E-01 | ||||
|
DME expression in the diseased tissue of patients
DME expression in the normal tissue of healthy individuals
|
|||||
| Violin Diagram of DME Disease-specific Protein Abundances |
|
Click to View the Clearer Original Diagram | |||
| ICD-11: CA22 | Chronic obstructive pulmonary disease | Click to Show/Hide | |||
| The Studied Tissue | Lung tissue | ||||
| The Specified Disease | Chronic obstructive pulmonary disease [ICD-11:CA22] | ||||
| The Expression Level of Disease Section Compare with the Healthy Individual Tissue | p-value: 5.56E-03; Fold-change: 1.38E-01; Z-score: 4.04E-01 | ||||
|
DME expression in the diseased tissue of patients
DME expression in the normal tissue of healthy individuals
|
|||||
| Violin Diagram of DME Disease-specific Protein Abundances |
|
Click to View the Clearer Original Diagram | |||
| The Studied Tissue | Small airway epithelium | ||||
| The Specified Disease | Chronic obstructive pulmonary disease [ICD-11:CA22] | ||||
| The Expression Level of Disease Section Compare with the Healthy Individual Tissue | p-value: 6.48E-06; Fold-change: 2.92E+00; Z-score: 1.40E+00 | ||||
|
DME expression in the diseased tissue of patients
DME expression in the normal tissue of healthy individuals
|
|||||
| Violin Diagram of DME Disease-specific Protein Abundances |
|
Click to View the Clearer Original Diagram | |||
| ICD-11: CA23 | Asthma | Click to Show/Hide | |||
| The Studied Tissue | Nasal and bronchial airway | ||||
| The Specified Disease | Asthma [ICD-11:CA23] | ||||
| The Expression Level of Disease Section Compare with the Healthy Individual Tissue | p-value: 1.94E-01; Fold-change: 4.89E-02; Z-score: 5.93E-02 | ||||
|
DME expression in the diseased tissue of patients
DME expression in the normal tissue of healthy individuals
|
|||||
| Violin Diagram of DME Disease-specific Protein Abundances |
|
Click to View the Clearer Original Diagram | |||
| ICD-11: CB03 | Idiopathic interstitial pneumonitis | Click to Show/Hide | |||
| The Studied Tissue | Lung tissue | ||||
| The Specified Disease | Idiopathic pulmonary fibrosis [ICD-11:CB03.4] | ||||
| The Expression Level of Disease Section Compare with the Healthy Individual Tissue | p-value: 2.52E-01; Fold-change: -2.19E-01; Z-score: -2.26E-01 | ||||
|
DME expression in the diseased tissue of patients
DME expression in the normal tissue of healthy individuals
|
|||||
| Violin Diagram of DME Disease-specific Protein Abundances |
|
Click to View the Clearer Original Diagram | |||
| ICD Disease Classification 13 | Digestive system disease | Click to Show/Hide | |||
| ICD-11: DA0C | Periodontal disease | Click to Show/Hide | |||
| The Studied Tissue | Gingival tissue | ||||
| The Specified Disease | Periodontal disease [ICD-11:DA0C] | ||||
| The Expression Level of Disease Section Compare with the Adjacent Tissue | p-value: 2.71E-05; Fold-change: 1.27E-01; Z-score: 5.98E-01 | ||||
|
DME expression in the diseased tissue of patients
DME expression in the normal tissue adjacent to the diseased tissue of patients
|
|||||
| Violin Diagram of DME Disease-specific Protein Abundances |
|
Click to View the Clearer Original Diagram | |||
| ICD-11: DA42 | Gastritis | Click to Show/Hide | |||
| The Studied Tissue | Gastric antrum tissue | ||||
| The Specified Disease | Eosinophilic gastritis [ICD-11:DA42.2] | ||||
| The Expression Level of Disease Section Compare with the Adjacent Tissue | p-value: 8.14E-01; Fold-change: 6.17E-02; Z-score: 2.73E-01 | ||||
|
DME expression in the diseased tissue of patients
DME expression in the normal tissue adjacent to the diseased tissue of patients
|
|||||
| Violin Diagram of DME Disease-specific Protein Abundances |
|
Click to View the Clearer Original Diagram | |||
| ICD-11: DB92 | Non-alcoholic fatty liver disease | Click to Show/Hide | |||
| The Studied Tissue | Liver tissue | ||||
| The Specified Disease | Non-alcoholic fatty liver disease [ICD-11:DB92] | ||||
| The Expression Level of Disease Section Compare with the Healthy Individual Tissue | p-value: 6.25E-01; Fold-change: -5.57E-01; Z-score: -5.51E-01 | ||||
|
DME expression in the diseased tissue of patients
DME expression in the normal tissue of healthy individuals
|
|||||
| Violin Diagram of DME Disease-specific Protein Abundances |
|
Click to View the Clearer Original Diagram | |||
| ICD-11: DB99 | Hepatic failure | Click to Show/Hide | |||
| The Studied Tissue | Liver tissue | ||||
| The Specified Disease | Liver failure [ICD-11:DB99.7-DB99.8] | ||||
| The Expression Level of Disease Section Compare with the Healthy Individual Tissue | p-value: 3.24E-05; Fold-change: -4.16E+00; Z-score: -3.50E+00 | ||||
|
DME expression in the diseased tissue of patients
DME expression in the normal tissue of healthy individuals
|
|||||
| Violin Diagram of DME Disease-specific Protein Abundances |
|
Click to View the Clearer Original Diagram | |||
| ICD-11: DD71 | Ulcerative colitis | Click to Show/Hide | |||
| The Studied Tissue | Colon mucosal tissue | ||||
| The Specified Disease | Ulcerative colitis [ICD-11:DD71] | ||||
| The Expression Level of Disease Section Compare with the Adjacent Tissue | p-value: 7.32E-01; Fold-change: -3.62E-02; Z-score: -1.57E-01 | ||||
|
DME expression in the diseased tissue of patients
DME expression in tissue other than the diseased tissue of patients
|
|||||
| Violin Diagram of DME Disease-specific Protein Abundances |
|
Click to View the Clearer Original Diagram | |||
| ICD-11: DD91 | Irritable bowel syndrome | Click to Show/Hide | |||
| The Studied Tissue | Rectal colon tissue | ||||
| The Specified Disease | Irritable bowel syndrome [ICD-11:DD91.0] | ||||
| The Expression Level of Disease Section Compare with the Healthy Individual Tissue | p-value: 7.16E-01; Fold-change: 5.65E-02; Z-score: 1.66E-01 | ||||
|
DME expression in the diseased tissue of patients
DME expression in the normal tissue of healthy individuals
|
|||||
| Violin Diagram of DME Disease-specific Protein Abundances |
|
Click to View the Clearer Original Diagram | |||
| ICD Disease Classification 14 | Skin disease | Click to Show/Hide | |||
| ICD-11: EA80 | Atopic eczema | Click to Show/Hide | |||
| The Studied Tissue | Skin | ||||
| The Specified Disease | Atopic dermatitis [ICD-11:EA80] | ||||
| The Expression Level of Disease Section Compare with the Healthy Individual Tissue | p-value: 6.65E-03; Fold-change: 3.22E-01; Z-score: 5.38E-01 | ||||
|
DME expression in the diseased tissue of patients
DME expression in the normal tissue of healthy individuals
|
|||||
| Violin Diagram of DME Disease-specific Protein Abundances |
|
Click to View the Clearer Original Diagram | |||
| ICD-11: EA90 | Psoriasis | Click to Show/Hide | |||
| The Studied Tissue | Skin | ||||
| The Specified Disease | Psoriasis [ICD-11:EA90] | ||||
| The Expression Level of Disease Section Compare with the Healthy Individual Tissue | p-value: 7.81E-09; Fold-change: -9.88E-01; Z-score: -6.02E-01 | ||||
| The Expression Level of Disease Section Compare with the Adjacent Tissue | p-value: 2.46E-01; Fold-change: -1.23E-02; Z-score: -8.92E-03 | ||||
|
DME expression in the diseased tissue of patients
DME expression in the normal tissue adjacent to the diseased tissue of patients
DME expression in the normal tissue of healthy individuals
|
|||||
| Violin Diagram of DME Disease-specific Protein Abundances |
|
Click to View the Clearer Original Diagram | |||
| ICD-11: ED63 | Acquired hypomelanotic disorder | Click to Show/Hide | |||
| The Studied Tissue | Skin | ||||
| The Specified Disease | Vitiligo [ICD-11:ED63.0] | ||||
| The Expression Level of Disease Section Compare with the Healthy Individual Tissue | p-value: 4.32E-01; Fold-change: -5.47E-01; Z-score: -4.60E-01 | ||||
|
DME expression in the diseased tissue of patients
DME expression in the normal tissue of healthy individuals
|
|||||
| Violin Diagram of DME Disease-specific Protein Abundances |
|
Click to View the Clearer Original Diagram | |||
| ICD-11: ED70 | Alopecia or hair loss | Click to Show/Hide | |||
| The Studied Tissue | Skin from scalp | ||||
| The Specified Disease | Alopecia [ICD-11:ED70] | ||||
| The Expression Level of Disease Section Compare with the Healthy Individual Tissue | p-value: 8.44E-02; Fold-change: 3.45E-01; Z-score: 2.95E-01 | ||||
|
DME expression in the diseased tissue of patients
DME expression in the normal tissue of healthy individuals
|
|||||
| Violin Diagram of DME Disease-specific Protein Abundances |
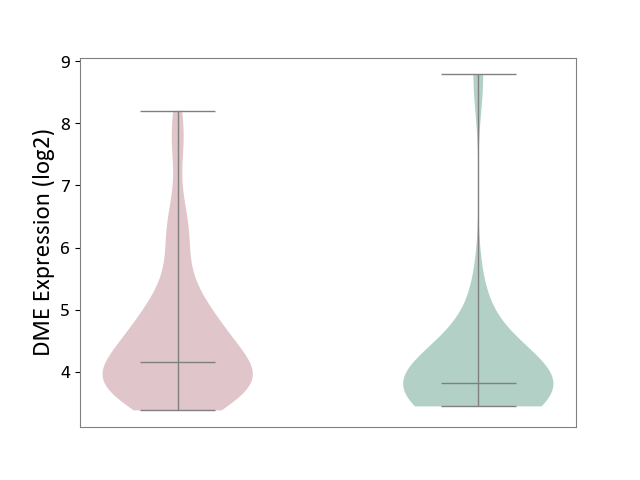
|
Click to View the Clearer Original Diagram | |||
| ICD-11: EK0Z | Contact dermatitis | Click to Show/Hide | |||
| The Studied Tissue | Skin | ||||
| The Specified Disease | Sensitive skin [ICD-11:EK0Z] | ||||
| The Expression Level of Disease Section Compare with the Healthy Individual Tissue | p-value: 5.77E-01; Fold-change: -2.08E-01; Z-score: -2.56E-01 | ||||
|
DME expression in the diseased tissue of patients
DME expression in the normal tissue of healthy individuals
|
|||||
| Violin Diagram of DME Disease-specific Protein Abundances |
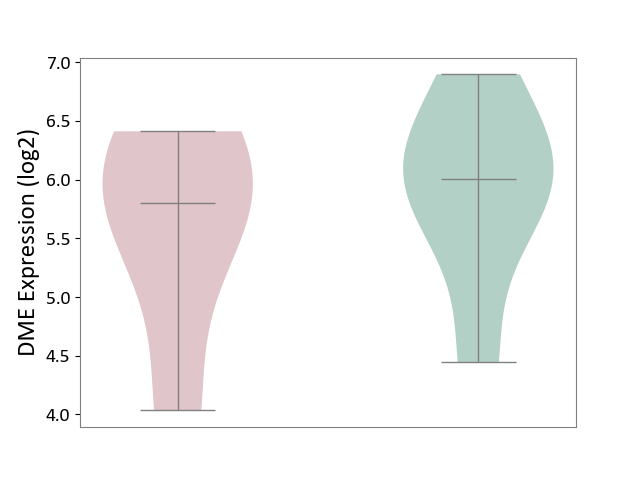
|
Click to View the Clearer Original Diagram | |||
| ICD Disease Classification 15 | Musculoskeletal system/connective tissue disease | Click to Show/Hide | |||
| ICD-11: FA00 | Osteoarthritis | Click to Show/Hide | |||
| The Studied Tissue | Peripheral blood | ||||
| The Specified Disease | Arthropathy [ICD-11:FA00-FA5Z] | ||||
| The Expression Level of Disease Section Compare with the Healthy Individual Tissue | p-value: 5.24E-01; Fold-change: 6.33E-02; Z-score: 3.33E-01 | ||||
|
DME expression in the diseased tissue of patients
DME expression in the normal tissue of healthy individuals
|
|||||
| Violin Diagram of DME Disease-specific Protein Abundances |
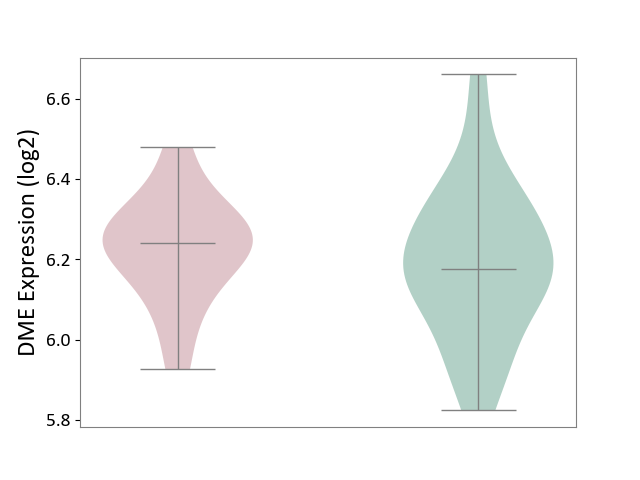
|
Click to View the Clearer Original Diagram | |||
| The Studied Tissue | Synovial tissue | ||||
| The Specified Disease | Osteoarthritis [ICD-11:FA00-FA0Z] | ||||
| The Expression Level of Disease Section Compare with the Healthy Individual Tissue | p-value: 3.84E-02; Fold-change: -9.06E-01; Z-score: -8.94E-01 | ||||
|
DME expression in the diseased tissue of patients
DME expression in the normal tissue of healthy individuals
|
|||||
| Violin Diagram of DME Disease-specific Protein Abundances |
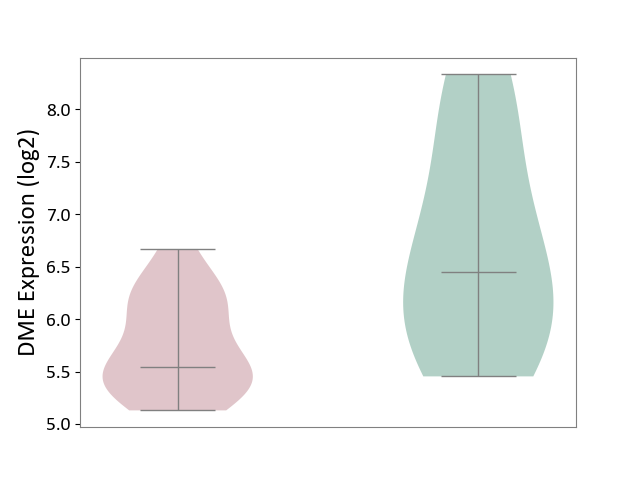
|
Click to View the Clearer Original Diagram | |||
| ICD-11: FA20 | Rheumatoid arthritis | Click to Show/Hide | |||
| The Studied Tissue | Peripheral blood | ||||
| The Specified Disease | Childhood onset rheumatic disease [ICD-11:FA20.Z] | ||||
| The Expression Level of Disease Section Compare with the Healthy Individual Tissue | p-value: 6.80E-01; Fold-change: 3.43E-02; Z-score: 1.05E-01 | ||||
|
DME expression in the diseased tissue of patients
DME expression in the normal tissue of healthy individuals
|
|||||
| Violin Diagram of DME Disease-specific Protein Abundances |
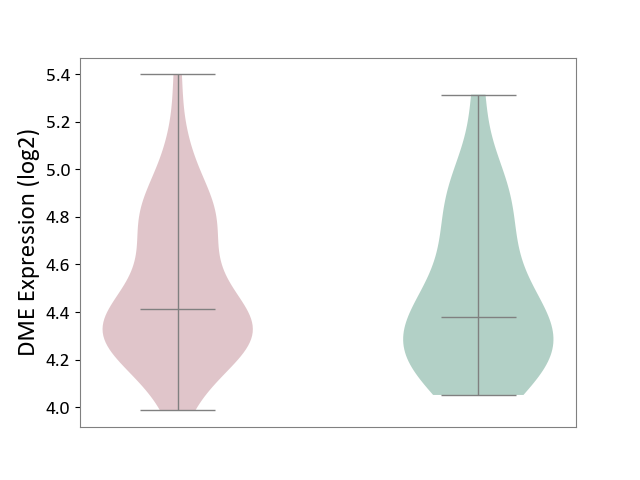
|
Click to View the Clearer Original Diagram | |||
| The Studied Tissue | Synovial tissue | ||||
| The Specified Disease | Rheumatoid arthritis [ICD-11:FA20] | ||||
| The Expression Level of Disease Section Compare with the Healthy Individual Tissue | p-value: 3.71E-02; Fold-change: -9.79E-01; Z-score: -1.13E+00 | ||||
|
DME expression in the diseased tissue of patients
DME expression in the normal tissue of healthy individuals
|
|||||
| Violin Diagram of DME Disease-specific Protein Abundances |
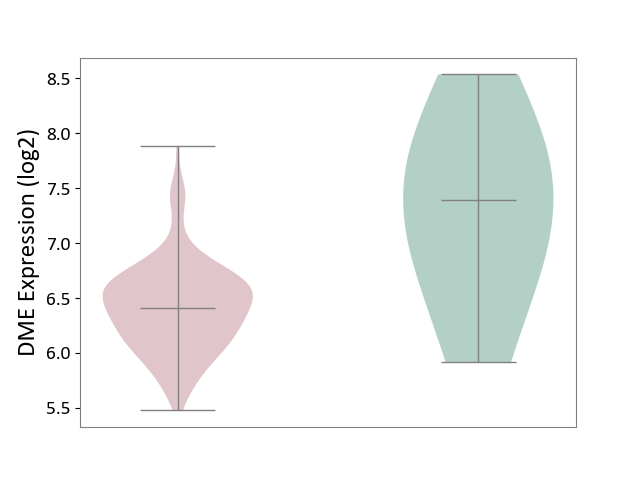
|
Click to View the Clearer Original Diagram | |||
| ICD-11: FA24 | Juvenile idiopathic arthritis | Click to Show/Hide | |||
| The Studied Tissue | Peripheral blood | ||||
| The Specified Disease | Juvenile idiopathic arthritis [ICD-11:FA24] | ||||
| The Expression Level of Disease Section Compare with the Healthy Individual Tissue | p-value: 2.98E-02; Fold-change: 8.63E-02; Z-score: 3.41E-01 | ||||
|
DME expression in the diseased tissue of patients
DME expression in the normal tissue of healthy individuals
|
|||||
| Violin Diagram of DME Disease-specific Protein Abundances |
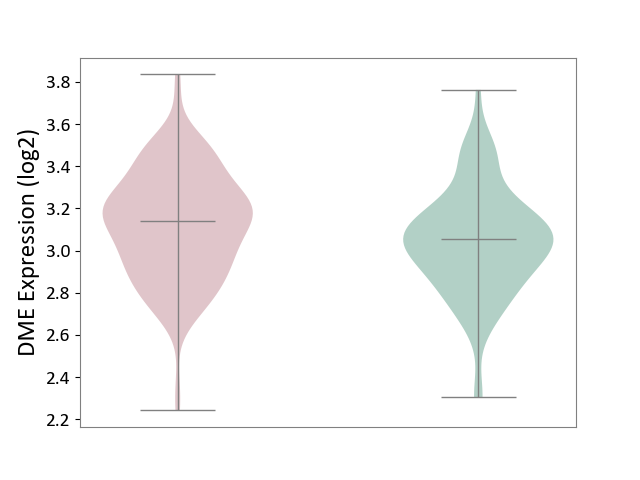
|
Click to View the Clearer Original Diagram | |||
| ICD-11: FA92 | Inflammatory spondyloarthritis | Click to Show/Hide | |||
| The Studied Tissue | Pheripheral blood | ||||
| The Specified Disease | Ankylosing spondylitis [ICD-11:FA92.0Z] | ||||
| The Expression Level of Disease Section Compare with the Healthy Individual Tissue | p-value: 7.18E-01; Fold-change: 7.18E-03; Z-score: 6.40E-02 | ||||
|
DME expression in the diseased tissue of patients
DME expression in the normal tissue of healthy individuals
|
|||||
| Violin Diagram of DME Disease-specific Protein Abundances |
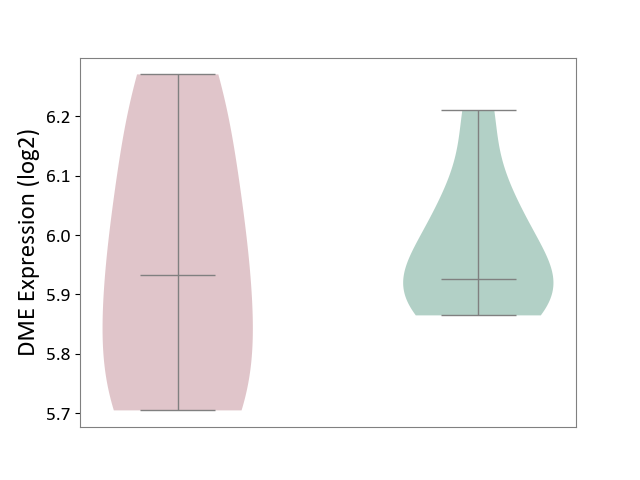
|
Click to View the Clearer Original Diagram | |||
| ICD-11: FB83 | Low bone mass disorder | Click to Show/Hide | |||
| The Studied Tissue | Bone marrow | ||||
| The Specified Disease | Osteoporosis [ICD-11:FB83.1] | ||||
| The Expression Level of Disease Section Compare with the Healthy Individual Tissue | p-value: 7.99E-01; Fold-change: 1.82E-01; Z-score: 2.45E-01 | ||||
|
DME expression in the diseased tissue of patients
DME expression in the normal tissue of healthy individuals
|
|||||
| Violin Diagram of DME Disease-specific Protein Abundances |
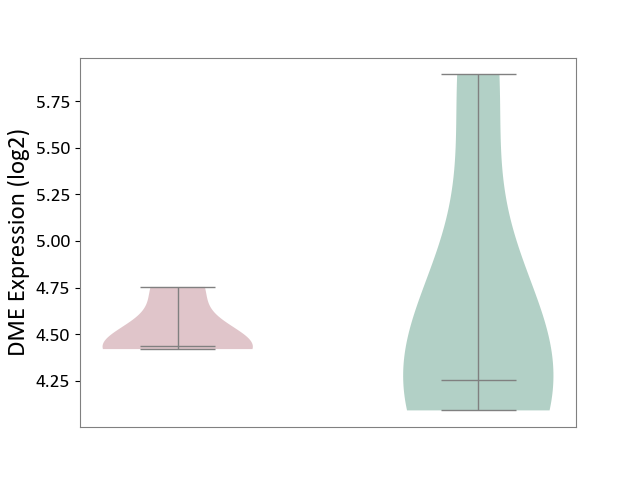
|
Click to View the Clearer Original Diagram | |||
| ICD Disease Classification 16 | Genitourinary system disease | Click to Show/Hide | |||
| ICD-11: GA10 | Endometriosis | Click to Show/Hide | |||
| The Studied Tissue | Endometrium tissue | ||||
| The Specified Disease | Endometriosis [ICD-11:GA10] | ||||
| The Expression Level of Disease Section Compare with the Healthy Individual Tissue | p-value: 1.09E-01; Fold-change: -9.50E-02; Z-score: -2.41E-01 | ||||
|
DME expression in the diseased tissue of patients
DME expression in the normal tissue of healthy individuals
|
|||||
| Violin Diagram of DME Disease-specific Protein Abundances |
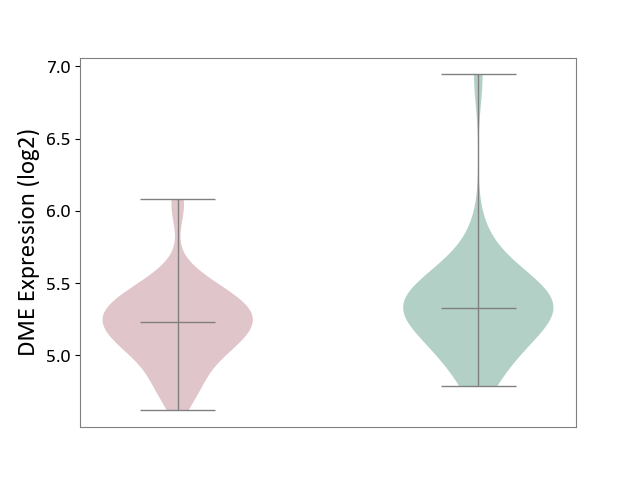
|
Click to View the Clearer Original Diagram | |||
| ICD-11: GC00 | Cystitis | Click to Show/Hide | |||
| The Studied Tissue | Bladder tissue | ||||
| The Specified Disease | Interstitial cystitis [ICD-11:GC00.3] | ||||
| The Expression Level of Disease Section Compare with the Healthy Individual Tissue | p-value: 1.25E-02; Fold-change: -2.09E+00; Z-score: -2.00E+00 | ||||
|
DME expression in the diseased tissue of patients
DME expression in the normal tissue of healthy individuals
|
|||||
| Violin Diagram of DME Disease-specific Protein Abundances |
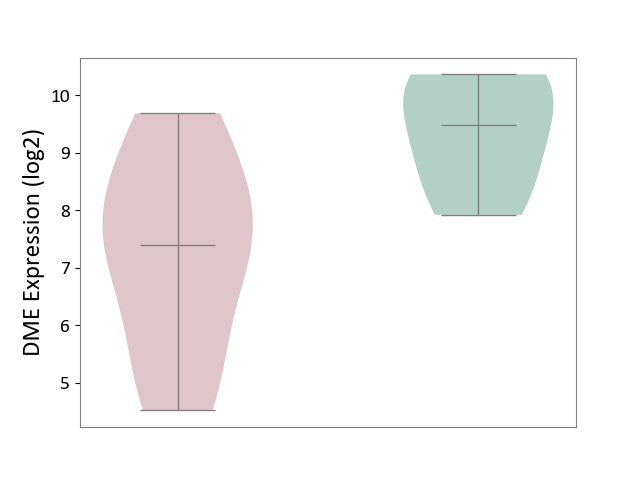
|
Click to View the Clearer Original Diagram | |||
| ICD Disease Classification 19 | Condition originating in perinatal period | Click to Show/Hide | |||
| ICD-11: KA21 | Short gestation disorder | Click to Show/Hide | |||
| The Studied Tissue | Myometrium | ||||
| The Specified Disease | Preterm birth [ICD-11:KA21.4Z] | ||||
| The Expression Level of Disease Section Compare with the Healthy Individual Tissue | p-value: 3.01E-01; Fold-change: -2.66E-02; Z-score: -1.35E-01 | ||||
|
DME expression in the diseased tissue of patients
DME expression in the normal tissue of healthy individuals
|
|||||
| Violin Diagram of DME Disease-specific Protein Abundances |
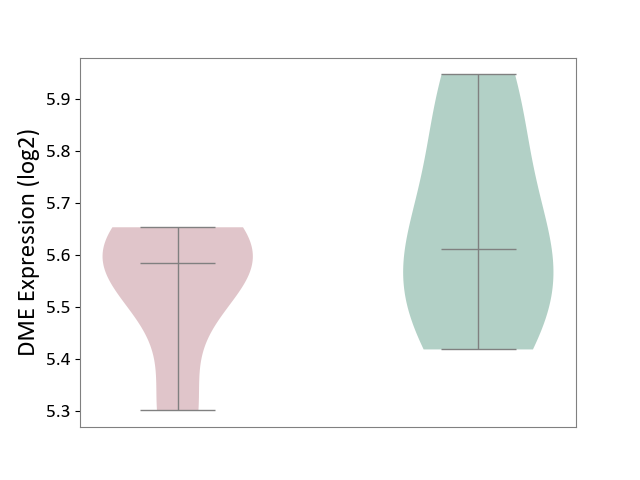
|
Click to View the Clearer Original Diagram | |||
| ICD Disease Classification 20 | Developmental anomaly | Click to Show/Hide | |||
| ICD-11: LD2C | Overgrowth syndrome | Click to Show/Hide | |||
| The Studied Tissue | Adipose tissue | ||||
| The Specified Disease | Simpson golabi behmel syndrome [ICD-11:LD2C] | ||||
| The Expression Level of Disease Section Compare with the Healthy Individual Tissue | p-value: 3.01E-01; Fold-change: -5.79E-02; Z-score: -6.41E-01 | ||||
|
DME expression in the diseased tissue of patients
DME expression in the normal tissue of healthy individuals
|
|||||
| Violin Diagram of DME Disease-specific Protein Abundances |
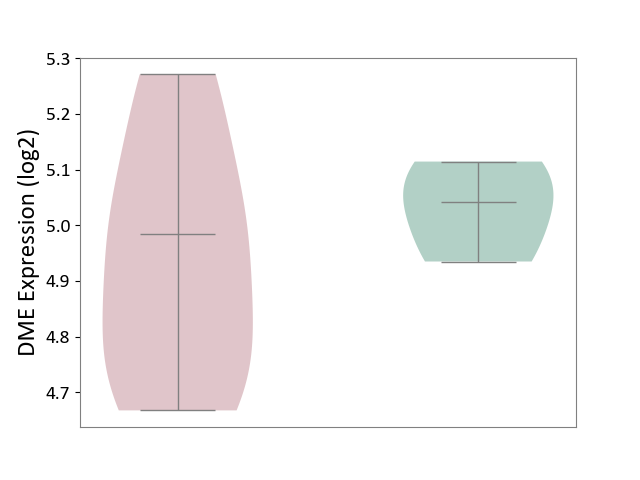
|
Click to View the Clearer Original Diagram | |||
| ICD-11: LD2D | Phakomatoses/hamartoneoplastic syndrome | Click to Show/Hide | |||
| The Studied Tissue | Perituberal tissue | ||||
| The Specified Disease | Tuberous sclerosis complex [ICD-11:LD2D.2] | ||||
| The Expression Level of Disease Section Compare with the Healthy Individual Tissue | p-value: 8.45E-01; Fold-change: 5.81E-02; Z-score: 2.32E-01 | ||||
|
DME expression in the diseased tissue of patients
DME expression in the normal tissue of healthy individuals
|
|||||
| Violin Diagram of DME Disease-specific Protein Abundances |
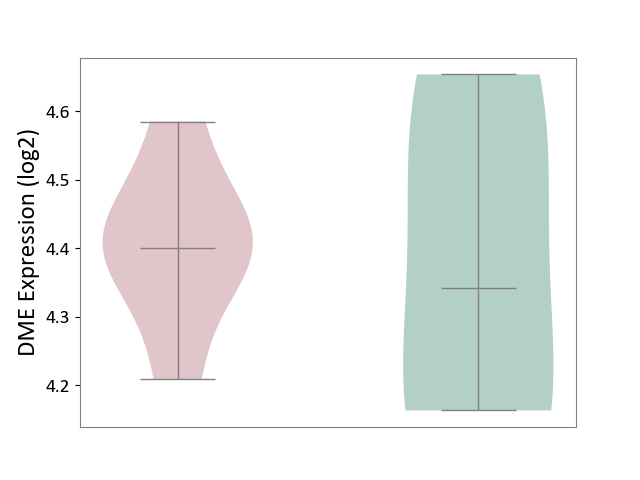
|
Click to View the Clearer Original Diagram | |||
| References | |||||
|---|---|---|---|---|---|
| 1 | Substrates, inducers, inhibitors and structure-activity relationships of human Cytochrome P450 2C9 and implications in drug development. Curr Med Chem. 2009;16(27):3480-675. | ||||
| 2 | Thalidomide metabolism and hydrolysis: mechanisms and implications | ||||
| 3 | Metabolism of tamoxifen by recombinant human cytochrome P450 enzymes: formation of the 4-hydroxy, 4'-hydroxy and N-desmethyl metabolites and isomerization of trans-4-hydroxytamoxifen. Drug Metab Dispos. 2002 Aug;30(8):869-74. | ||||
| 4 | Synthetic and natural compounds that interact with human cytochrome P450 1A2 and implications in drug development. Curr Med Chem. 2009;16(31):4066-218. | ||||
| 5 | Cytochrome P450-mediated metabolism of estrogens and its regulation in human Cancer Lett. 2005 Sep 28;227(2):115-24. doi: 10.1016/j.canlet.2004.10.007. | ||||
| 6 | Functional characterization of human and cynomolgus monkey UDP-glucuronosyltransferase 1A1 enzymes Life Sci. 2010 Aug 14;87(7-8):261-8. doi: 10.1016/j.lfs.2010.07.001. | ||||
| 7 | A common CYP1B1 polymorphism is associated with 2-OHE1/16-OHE1 urinary estrone ratio. Clin Chem Lab Med. 2005;43(7):702-6. | ||||
| 8 | Roles of CYP2A6 and CYP2B6 in nicotine C-oxidation by human liver microsomes. Arch Toxicol. 1999 Mar;73(2):65-70. | ||||
| 9 | Absorption, Distribution, Metabolism, and Excretion of Capmatinib (INC280) in Healthy Male Volunteers and In Vitro Aldehyde Oxidase Phenotyping of the Major Metabolite | ||||
| 10 | Increasing the intracellular availability of all-trans retinoic acid in neuroblastoma cells. Br J Cancer. 2005 Feb 28;92(4):696-704. | ||||
| 11 | Absorption, Metabolism, and Excretion, In Vitro Pharmacology, and Clinical Pharmacokinetics of Ozanimod, a Novel Sphingosine 1-Phosphate Receptor Modulator | ||||
| 12 | Diclofenac and its derivatives as tools for studying human cytochromes P450 active sites: particular efficiency and regioselectivity of P450 2Cs. Biochemistry. 1999 Oct 26;38(43):14264-70. | ||||
| 13 | Role of adrenoceptor-linked signaling pathways in the regulation of CYP1A1 gene expression. Biochem Pharmacol. 2005 Jan 15;69(2):277-87. | ||||
| 14 | Allelic variants of human cytochrome P450 1A1 (CYP1A1): effect of T461N and I462V substitutions on steroid hydroxylase specificity. Pharmacogenetics. 2000 Aug;10(6):519-30. | ||||
| 15 | Participation of CYP2C8 and CYP3A4 in the N-demethylation of imatinib in human hepatic microsomes | ||||
| 16 | In vitro biotransformation of imatinib by the tumor expressed CYP1A1 and CYP1B1 | ||||
| 17 | Metabolism of capsaicin by cytochrome P450 produces novel dehydrogenated metabolites and decreases cytotoxicity to lung and liver cells Chem Res Toxicol. 2003 Mar;16(3):336-49. doi: 10.1021/tx025599q. | ||||
| 18 | Metabolism of capsaicin by cytochrome P450 produces novel dehydrogenated metabolites and decreases cytotoxicity to lung and liver cells. Chem Res Toxicol. 2003 Mar;16(3):336-49. | ||||
| 19 | The involvement of CYP3A4 and CYP2C9 in the metabolism of 17 alpha-ethinylestradiol. Drug Metab Dispos. 2004 Nov;32(11):1209-12. | ||||
| 20 | Cytochromes P450 1A2 and 3A4 Catalyze the Metabolic Activation of Sunitinib | ||||
| 21 | Human cytochrome P450s involved in the metabolism of 9-cis- and 13-cis-retinoic acids | ||||
| 22 | The effect of new lipophilic chelators on the activities of cytosolic reductases and P450 cytochromes involved in the metabolism of anthracycline antibiotics: studies in vitro. Physiol Res. 2004;53(6):683-91. | ||||
| 23 | In vitro drug-drug interaction studies with febuxostat, a novel non-purine selective inhibitor of xanthine oxidase: plasma protein binding, identification of metabolic enzymes and cytochrome P450 inhibition Xenobiotica. 2008 May;38(5):496-510. doi: 10.1080/00498250801956350. | ||||
| 24 | FDA label of Copanlisib. The 2020 official website of the U.S. Food and Drug Administration. | ||||
| 25 | DailyMed : Alitretinoin | ||||
| 26 | Metabolism of carvedilol in dogs, rats, and mice Drug Metab Dispos. 1998 Oct;26(10):958-69. | ||||
| 27 | Human CYP1B1 and anticancer agent metabolism: mechanism for tumor-specific drug inactivation? J Pharmacol Exp Ther. 2001 Feb;296(2):537-41. | ||||
| 28 | In vitro characterization of the metabolism of haloperidol using recombinant cytochrome p450 enzymes and human liver microsomes. Drug Metab Dispos. 2001 Dec;29(12):1638-43. | ||||
| 29 | Sulfation of 12-hydroxy-nevirapine by human SULTs and the effects of genetic polymorphisms of SULT1A1 and SULT2A1. Biochem Pharmacol. 2022 Oct;204:115243. doi: 10.1016/j.bcp.2022.115243. | ||||
| 30 | Brain accumulation of tivozanib is restricted by ABCB1 (P-glycoprotein) and ABCG2 (breast cancer resistance protein) in mice | ||||
| 31 | Involvement of cytochrome P450 3A enzyme family in the major metabolic pathways of toremifene in human liver microsomes. Biochem Pharmacol. 1994 May 18;47(10):1883-95. | ||||
| 32 | CLINICAL PHARMACOLOGY AND BIOPHARMACEUTICS REVIEW: Umeclidinium Bromide | ||||
| 33 | Regulation of cytochrome P450 expression by inhibitors of hydroxymethylglutaryl-coenzyme A reductase in primary cultured rat hepatocytes and in rat liver. Drug Metab Dispos. 1996 Nov;24(11):1197-204. | ||||
| 34 | Characterization of Stereoselective Metabolism, Inhibitory Effect on Uric Acid Uptake Transporters, and Pharmacokinetics of Lesinurad Atropisomers Drug Metab Dispos. 2019 Feb;47(2):104-113. doi: 10.1124/dmd.118.080549. | ||||
| 35 | Pharmacogenomics in drug-metabolizing enzymes catalyzing anticancer drugs for personalized cancer chemotherapy. Curr Drug Metab. 2007 Aug;8(6):554-62. | ||||
| 36 | Summary of information on human CYP enzymes: human P450 metabolism data. Drug Metab Rev. 2002 Feb-May;34(1-2):83-448. | ||||
| 37 | A significant role of human cytochrome P450 2C8 in amiodarone N-deethylation: an approach to predict the contribution with relative activity factor. Drug Metab Dispos. 2000 Nov;28(11):1303-10. | ||||
| 38 | CYP2D6 mediates 4-hydroxylation of clonidine in vitro: implication for pregnancy-induced changes in clonidine clearance. Drug Metab Dispos. 2010 Sep;38(9):1393-6. | ||||
| 39 | In vitro identification of the human cytochrome p450 enzymes involved in the oxidative metabolism of loxapine. Biopharm Drug Dispos. 2011 Oct;32(7):398-407. | ||||
| 40 | Novel Pathways of Ponatinib Disposition Catalyzed By CYP1A1 Involving Generation of Potentially Toxic Metabolites J Pharmacol Exp Ther. 2017 Oct;363(1):12-19. doi: 10.1124/jpet.117.243246. | ||||
| 41 | Clinical pharmacokinetics and pharmacodynamics of solifenacin. Clin Pharmacokinet. 2009;48(5):281-302. | ||||
| 42 | Clinical assessment of drug-drug interactions of tasimelteon, a novel dual melatonin receptor agonist J Clin Pharmacol. 2015 Sep;55(9):1004-11. doi: 10.1002/jcph.507. | ||||
| 43 | Specificity of substrate and inhibitor probes for human cytochromes P450 1A1 and 1A2. J Pharmacol Exp Ther. 1993 Apr;265(1):401-7. | ||||
| 44 | Cytochrome P450-mediated metabolism of triclosan attenuates its cytotoxicity in hepatic cells | ||||
| 45 | Preferred orientations in the binding of 4'-hydroxyacetanilide (acetaminophen) to cytochrome P450 1A1 and 2B1 isoforms as determined by 13C- and 15N-NMR relaxation studies. J Med Chem. 1994 Mar 18;37(6):860-7. | ||||
| 46 | The impact of individual human cytochrome P450 enzymes on oxidative metabolism of anticancer drug lenvatinib | ||||
| 47 | In vitro and in vivo evidence for the formation of methyl radical from procarbazine: a spin-trapping study. Carcinogenesis. 1992 May;13(5):799-805. | ||||
| 48 | Riociguat (adempas): a novel agent for the treatment of pulmonary arterial hypertension and chronic thromboembolic pulmonary hypertension. P T. 2014 Nov;39(11):749-58. | ||||
| 49 | Oxidation of troglitazone to a quinone-type metabolite catalyzed by cytochrome P-450 2C8 and P-450 3A4 in human liver microsomes. Drug Metab Dispos. 1999 Nov;27(11):1260-6. | ||||
| 50 | Drug Interactions with Angiotensin Receptor Blockers: Role of Human Cytochromes P450 | ||||
| 51 | Lithium Intoxication in the Elderly: A Possible Interaction between Azilsartan, Fluvoxamine, and Lithium | ||||
| 52 | Oxidative metabolism of flunarizine and cinnarizine by microsomes from B-lymphoblastoid cell lines expressing human cytochrome P450 enzymes. Biol Pharm Bull. 1996 Nov;19(11):1511-4. | ||||
| 53 | CYP1A1 is a major enzyme responsible for the metabolism of granisetron in human liver microsomes. Curr Drug Metab. 2005 Oct;6(5):469-80. | ||||
| 54 | The influence of metabolic gene polymorphisms on urinary 1-hydroxypyrene concentrations in Chinese coke oven workers. Sci Total Environ. 2007 Aug 1;381(1-3):38-46. | ||||
| 55 | Identification of human cytochrome P(450)s that metabolise anti-parasitic drugs and predictions of in vivo drug hepatic clearance from in vitro data Eur J Clin Pharmacol. 2003 Sep;59(5-6):429-42. doi: 10.1007/s00228-003-0636-9. | ||||
| 56 | Studies on the metabolism and biological activity of the epimers of sulindac | ||||
| 57 | In vitro metabolism of chloroquine: identification of CYP2C8, CYP3A4, and CYP2D6 as the main isoforms catalyzing N-desethylchloroquine formation. Drug Metab Dispos. 2003 Jun;31(6):748-54. | ||||
| 58 | Metabolic activation of dacarbazine by human cytochromes P450: the role of CYP1A1, CYP1A2, and CYP2E1. Clin Cancer Res. 1999 Aug;5(8):2192-7. | ||||
| 59 | Cytochromes P450 in crustacea. Comp Biochem Physiol C Pharmacol Toxicol Endocrinol. 1998 Nov;121(1-3):157-72. | ||||
| 60 | Metabolism of Meloxicam in human liver involves cytochromes P4502C9 and 3A4. Xenobiotica. 1998 Jan;28(1):1-13. | ||||
| 61 | Discovery of 2-{4-[(3S)-piperidin-3-yl]phenyl}-2H-indazole-7-carboxamide (MK-4827): a novel oral poly(ADP-ribose)polymerase (PARP) inhibitor efficacious in BRCA-1 and -2 mutant tumors. J Med Chem. 2009 Nov 26;52(22):7170-85. | ||||
| 62 | Exposure-related effects of atazanavir on the pharmacokinetics of raltegravir in HIV-1-infected patients. Ther Drug Monit. 2010 Dec;32(6):782-6. | ||||
| 63 | Estimation of FMO3 Ontogeny by Mechanistic Population Pharmacokinetic Modelling of Risdiplam and Its Impact on Drug-Drug Interactions in Children | ||||
| 64 | PubChem:Risdiplam | ||||
| 65 | Identification of cytochrome P450 enzymes involved in the metabolism of FK228, a potent histone deacetylase inhibitor, in human liver microsomes. Biol Pharm Bull. 2005 Jan;28(1):124-9. | ||||
| 66 | Rat hepatic CYP1A1 and CYP1A2 induction by menadione. Toxicol Lett. 2005 Feb 15;155(2):253-8. | ||||
| 67 | Disruption of endogenous regulator homeostasis underlies the mechanism of rat CYP1A1 mRNA induction by metyrapone. Biochem J. 1998 Apr 1;331 ( Pt 1):273-81. | ||||
| 68 | Amodiaquine clearance and its metabolism to N-desethylamodiaquine is mediated by CYP2C8: a new high affinity and turnover enzyme-specific probe substrate. J Pharmacol Exp Ther. 2002 Feb;300(2):399-407. | ||||
| 69 | Metabolism of melatonin by human cytochromes p450. Drug Metab Dispos. 2005 Apr;33(4):489-94. | ||||
| 70 | Identification of cytochrome P450 enzymes involved in the metabolism of zotepine, an antipsychotic drug, in human liver microsomes. Xenobiotica. 1999 Mar;29(3):217-29. | ||||
| 71 | Identification of CYP3A4 as the enzyme involved in the mono-N-dealkylation of disopyramide enantiomers in humans. Drug Metab Dispos. 2000 Aug;28(8):937-44. | ||||
| 72 | The metabolism of the piperazine-type phenothiazine neuroleptic perazine by the human cytochrome P-450 isoenzymes. Eur Neuropsychopharmacol. 2004 May;14(3):199-208. | ||||
| 73 | Retigabine N-glucuronidation and its potential role in enterohepatic circulation. Drug Metab Dispos. 1999 May;27(5):605-12. | ||||
| 74 | Cytochrome P450 isoforms catalyze formation of catechol estrogen quinones that react with DNA. Metabolism. 2007 Jul;56(7):887-94. | ||||
| 75 | Biotransformation of Finerenone, a Novel Nonsteroidal Mineralocorticoid Receptor Antagonist, in Dogs, Rats, and Humans, In Vivo and In Vitro | ||||
| 76 | DrugBank(Pharmacology-Metabolism):Finerenone | ||||
| 77 | The metabolic profile of azimilide in man: in vivo and in vitro evaluations. J Pharm Sci. 2005 Sep;94(9):2084-95. | ||||
| 78 | Identification of human cytochrome P450s involved in the formation of all-trans-retinoic acid principal metabolites. Mol Pharmacol. 2000 Dec;58(6):1341-8. | ||||
| 79 | CYP26C1 is a hydroxylase of multiple active retinoids and interacts with cellular retinoic acid binding proteins. Mol Pharmacol. 2018 May;93(5):489-503. | ||||
| 80 | Metabolism and Disposition of [(14)C]Pevonedistat, a First-in-Class NEDD8-Activating Enzyme Inhibitor, after Intravenous Infusion to Patients with Advanced Solid Tumors | ||||
| 81 | Cytochrome P450 CYP1B1 interacts with 8-methoxypsoralen (8-MOP) and influences psoralen-ultraviolet A (PUVA) sensitivity. PLoS One. 2013 Sep 23;8(9):e75494. | ||||
| 82 | Xenobiotic metabolizing and antioxidant enzymes in normal and neoplastic human breast tissue. Eur J Drug Metab Pharmacokinet. 1998 Oct-Dec;23(4):497-500. | ||||
| 83 | Methods to Assess Pulmonary Metabolism. | ||||
| 84 | CYP3A but not P-gp plays a relevant role in the in vivo intestinal and hepatic clearance of the delta-specific phosphoinositide-3 kinase inhibitor leniolisib | ||||
| 85 | Pharmacokinetics, metabolism, and excretion of licogliflozin, a dual inhibitor of SGLT1/2, in rats, dogs, and humans | ||||
| 86 | 4-Hydroxylation of debrisoquine by human CYP1A1 and its inhibition by quinidine and quinine. J Pharmacol Exp Ther. 2002 Jun;301(3):1025-32. | ||||
| 87 | Metabolic pathways of the camptothecin analog AR-67 | ||||
| 88 | Pharmacokinetics, tissue distribution and identification of putative metabolites of JI-101 - a novel triple kinase inhibitor in rats | ||||
| 89 | Beta-adrenergic receptor modulation of the LPS-mediated depression in CYP1A activity in astrocytes. Biochem Pharmacol. 2005 Mar 1;69(5):741-50. | ||||
| 90 | Isolation, Structural Identification, Synthesis, and Pharmacological Profiling of 1,2-trans-Dihydro-1,2-diol Metabolites of the Utrophin Modulator Ezutromid | ||||
| 91 | Cytochrome P450 3A-mediated metabolism of the topoisomerase I inhibitor 9-aminocamptothecin: impact on cancer therapy. Int J Oncol. 2014 Aug;45(2):877-86. | ||||
| 92 | Role of 2-methoxyestradiol, an Endogenous Estrogen Metabolite, in Health and Disease. Mini Rev Med Chem. 2015;15(5):427-38. | ||||
| 93 | Metabolism and bioactivation of famitinib, a novel inhibitor of receptor tyrosine kinase, in cancer patients. Br J Pharmacol. 2013 Apr;168(7):1687-706. | ||||
| 94 | Metabolic map and bioactivation of the anti-tumour drug noscapine | ||||
| 95 | Effects of enzyme inducers and inhibitors on the pharmacokinetics of intravenous ipriflavone in rats. J Pharm Pharmacol. 2006 Apr;58(4):449-57. | ||||
| 96 | Investigating the Contribution of Drug-Metabolizing Enzymes in Drug-Drug Interactions of Dapivirine and Miconazole | ||||
| 97 | Comparative Metabolism of Batracylin (NSC 320846) and N-acetylbatracylin (NSC 611001) Using Human, Dog, and Rat Preparations In Vitro | ||||
| 98 | Steady-state pharmacokinetics of a new antipsychotic agent perospirone and its active metabolite, and its relationship with prolactin response. Ther Drug Monit. 2004 Aug;26(4):361-5. | ||||
| 99 | The wide variability of perospirone metabolism and the effect of perospirone on prolactin in psychiatric patients | ||||
| 100 | In vitro and in vivo clinical pharmacology of dimethyl benzoylphenylurea, a novel oral tubulin-interactive agent | ||||
| 101 | Phase I study of continuous weekly dosing of dimethylamino benzoylphenylurea (BPU) in patients with solid tumours | ||||
| 102 | Evaluation of the transport, in vitro metabolism and pharmacokinetics of Salvinorin A, a potent hallucinogen. Eur J Pharm Biopharm. 2009 Jun;72(2):471-7. | ||||
| 103 | In vitro metabolism of the novel, highly selective oral angiogenesis inhibitor motesanib diphosphate in preclinical species and in humans | ||||
| 104 | An assessment of human liver-derived in vitro systems to predict the in vivo metabolism and clearance of almokalant | ||||
| 105 | Glucuronidation of the nonsteroidal antiestrogen EM-652 (SCH 57068), by human and monkey steroid conjugating UDP-glucuronosyltransferase enzymes | ||||
| 106 | Identification of cytochrome P450 isoform involved in the metabolism of YM992, a novel selective serotonin re-uptake inhibitor, in human liver microsomes | ||||
| 107 | Pharmacokinetics and metabolism of TR-14035, a novel antagonist of a4ss1/a4ss7 integrin mediated cell adhesion, in rat and dog | ||||
| 108 | In vitro evaluation of potential in vivo probes for human flavin-containing monooxygenase (FMO): metabolism of benzydamine and caffeine by FMO and P450 isoforms. Br J Clin Pharmacol. 2000 Oct;50(4):311-4. | ||||
| 109 | Effects of cytokine-induced macrophages on the response of tumor cells to banoxantrone (AQ4N) | ||||
| 110 | Bioreductively activated antitumor N-oxides: the case of AQ4N, a unique approach to hypoxia-activated cancer chemotherapy | ||||
| 111 | CYP2S1 is negatively regulated by corticosteroids in human cell lines. Toxicol Lett. 2012 Feb 25;209(1):30-4. | ||||
| 112 | Identification of the cytochromes P450 that catalyze coumarin 3,4-epoxidation and 3-hydroxylation | ||||
| 113 | Carcinogenic 3-nitrobenzanthrone but not 2-nitrobenzanthrone is metabolised to an unusual mercapturic acid in rats | ||||
| 114 | Sudan I is a potential carcinogen for humans: evidence for its metabolic activation and detoxication by human recombinant cytochrome P450 1A1 and liver microsomes | ||||
| 115 | Activation of the antitumor agent aminoflavone (NSC 686288) is mediated by induction of tumor cell cytochrome P450 1A1/1A2. Mol Pharmacol. 2002 Jul;62(1):143-53. | ||||
| 116 | Metabolism of equilenin in MCF-7 and MDA-MB-231 human breast cancer cells | ||||
| 117 | Role of cytochrome P450 isoenzymes in metabolism of O(6)-benzylguanine: implications for dacarbazine activation. Clin Cancer Res. 2001 Dec;7(12):4239-44. | ||||
| 118 | Simultaneous determination of blonanserin and its metabolite in human plasma and urine by liquid chromatography-tandem mass spectrometry: application to a pharmacokinetic study | ||||
| 119 | Blonanserin: a review of its use in the management of schizophrenia | ||||
| 120 | Simultaneous determination of blonanserin and its four metabolites in human plasma using ultra-performance liquid chromatography-tandem mass spectrometry | ||||
| 121 | Determination of the cardiac drug amiodarone and its N-desethyl metabolite in sludge samples | ||||
| 122 | Amiodarone and concurrent antiretroviral therapy: a case report and review of the literature | ||||
| 123 | The metabolism of amiodarone by various CYP isoenzymes of human and rat, and the inhibitory influence of ketoconazole. J Pharm Pharm Sci. 2008;11(1):147-59. | ||||
| 124 | Role of CYP3A in bromperidol metabolism in rat in vitro and in vivo Xenobiotica. 1999 Aug;29(8):839-46. doi: 10.1080/004982599238281. | ||||
| 125 | Species differences and interindividual variation in liver microsomal cytochrome P450 2A enzymes: effects on coumarin, dicumarol, and testosterone oxidation | ||||
| 126 | Coumarin metabolism by rat esophageal microsomes and cytochrome P450 2A3 | ||||
| 127 | Assessment of the pulmonary CYP1A1 metabolism of mavoglurant (AFQ056) in rat | ||||
| 128 | Pharmacokinetics of dacarbazine (DTIC) in pregnancy | ||||
| 129 | In vitro characterization and pharmacokinetics of dapagliflozin (BMS-512148), a potent sodium-glucose cotransporter type II inhibitor, in animals and humans Drug Metab Dispos. 2010 Mar;38(3):405-14. doi: 10.1124/dmd.109.029165. | ||||
| 130 | Pharmacokinetics and metabolism of delamanid, a novel anti-tuberculosis drug, in animals and humans: importance of albumin metabolism in vivo. Drug Metab Dispos. 2015 Aug;43(8):1267-76. | ||||
| 131 | Metabolism, excretion, and mass balance of the HIV-1 integrase inhibitor dolutegravir in humans | ||||
| 132 | DrugBank(Pharmacology-Metabolism)Estradiol acetate | ||||
| 133 | Cytochrome P450-mediated metabolism of estrogens and its regulation in human. Cancer Lett. 2005 Sep 28;227(2):115-24. | ||||
| 134 | Clinical pharmacokinetics of tyrosine kinase inhibitors. Cancer Treat Rev. 2009 Dec;35(8):692-706. | ||||
| 135 | The metabolism of estradiol; oral compared to intravenous administration J Steroid Biochem. 1985 Dec;23(6A):1065-70. doi: 10.1016/0022-4731(85)90068-8. | ||||
| 136 | Cytochromes P450: a structure-based summary of biotransformations using representative substrates Drug Metab Rev. 2008;40(1):1-100. doi: 10.1080/03602530802309742. | ||||
| 137 | In vitro drug-drug interaction studies with febuxostat, a novel non-purine selective inhibitor of xanthine oxidase: plasma protein binding, identification of metabolic enzymes and cytochrome P450 inhibition. Xenobiotica. 2008 May;38(5):496-510. | ||||
| 138 | Roles of different CYP enzymes in the formation of specific fluvastatin metabolites by human liver microsomes. Basic Clin Pharmacol Toxicol. 2009 Nov;105(5):327-32. | ||||
| 139 | Reactive metabolite of gefitinib activates inflammasomes: implications for gefitinib-induced idiosyncratic reaction J Toxicol Sci. 2020;45(11):673-680. doi: 10.2131/jts.45.673. | ||||
| 140 | Characterisation of the cytochrome P450 enzymes involved in the in vitro metabolism of granisetron. Br J Clin Pharmacol. 1994 Dec;38(6):557-66. | ||||
| 141 | Roles of human CYP2A6 and 2B6 and rat CYP2C11 and 2B1 in the 10-hydroxylation of (-)-verbenone by liver microsomes. Drug Metab Dispos. 2003 Aug;31(8):1049-53. | ||||
| 142 | Advances in high-resolution MS and hepatocyte models solve a long-standing metabolism challenge: the loratadine story. Bioanalysis. 2016 Aug;8(16):1645-62. | ||||
| 143 | Identification of human cytochrome P450 and flavin-containing monooxygenase enzymes involved in the metabolism of lorcaserin, a novel selective human 5-hydroxytryptamine 2C agonist. Drug Metab Dispos. 2012 Apr;40(4):761-71. | ||||
| 144 | In vitro metabolism of perospirone in rat, monkey and human liver microsomes | ||||
| 145 | A prospective longitudinal study of growth in twin gestations compared with growth in singleton pregnancies. I. The fetal head J Ultrasound Med. 1991 Aug;10(8):439-43. doi: 10.7863/jum.1991.10.8.439. | ||||
| 146 | Population pharmacokinetic modeling of motesanib and its active metabolite, M4, in cancer patients | ||||
| 147 | Inhibitory effects of nicardipine to cytochrome P450 (CYP) in human liver microsomes. Biol Pharm Bull. 2005 May;28(5):882-5. | ||||
| 148 | Metabolic pro?ling of tyrosine kinase inhibitor nintedanib using metabolomics J Pharm Biomed Anal. 2020 Feb 20;180:113045. doi: 10.1016/j.jpba.2019.113045. | ||||
| 149 | Activation of 3-nitrobenzanthrone and its metabolites by human acetyltransferases, sulfotransferases and cytochrome P450 expressed in Chinese hamster V79 cells | ||||
| 150 | Identification of human cytochrome P(450)s that metabolise anti-parasitic drugs and predictions of in vivo drug hepatic clearance from in vitro data. Eur J Clin Pharmacol. 2003 Sep;59(5-6):429-42. | ||||
| 151 | Value of preemptive CYP2C19 genotyping in allogeneic stem cell transplant patients considered for pentamidine administration. Clin Transplant. 2011 May-Jun;25(3):E271-5. | ||||
| 152 | DrugBank(Pharmacology-Metabolism)Phenacetin | ||||
| 153 | Tumour cytochrome P450 and drug activation. Curr Pharm Des. 2002;8(15):1335-47. | ||||
| 154 | Plasma kinetics of procarbazine and azo-procarbazine in humans Anticancer Drugs. 2006 Jan;17(1):75-80. doi: 10.1097/01.cad.0000181591.85476.aa. | ||||
| 155 | Metabolic Profiling of the Novel Hypoxia-Inducible Factor 2 Inhibitor PT2385 In Vivo and In Vitro | ||||
| 156 | Population pharmacokinetics of riociguat and its metabolite in patients with chronic thromboembolic pulmonary hypertension from routine clinical practice | ||||
| 157 | Clinical Pharmacokinetic and Pharmacodynamic Profile of Riociguat | ||||
| 158 | Pharmacokinetics, distribution, and metabolism of [14C]sunitinib in rats, monkeys, and humans | ||||
| 159 | Endoxifen and other metabolites of tamoxifen inhibit human hydroxysteroid sulfotransferase 2A1 (hSULT2A1). Drug Metab Dispos. 2014 Nov;42(11):1843-50. | ||||
| 160 | Metabolism and transport of tamoxifen in relation to its effectiveness: new perspectives on an ongoing controversy. Future Oncol. 2014 Jan;10(1):107-22. | ||||
| 161 | Identification and biological activity of tamoxifen metabolites in human serum Biochem Pharmacol. 1983 Jul 1;32(13):2045-52. doi: 10.1016/0006-2952(83)90425-2. | ||||
| 162 | PharmGKB summary: tamoxifen pathway, pharmacokinetics Pharmacogenet Genomics. 2013 Nov;23(11):643-7. doi: 10.1097/FPC.0b013e3283656bc1. | ||||
| 163 | Clinical assessment of drug-drug interactions of tasimelteon, a novel dual melatonin receptor agonist. J Clin Pharmacol. 2015 Sep;55(9):1004-11. | ||||
| 164 | Retinoic acid metabolism and mechanism of action: a review | ||||
| 165 | Total determination of triclabendazole and its metabolites in bovine tissues using liquid chromatography-tandem mass spectrometry J Chromatogr B Analyt Technol Biomed Life Sci. 2019 Mar 1;1109:54-59. doi: 10.1016/j.jchromb.2019.01.021. | ||||
| 166 | Egaten FDA label | ||||
| 167 | Norzotepine, a major metabolite of zotepine, exerts atypical antipsychotic-like and antidepressant-like actions through its potent inhibition of norepinephrine reuptake | ||||
If you find any error in data or bug in web service, please kindly report it to Dr. Yin and Dr. Li.