

Details of Drug-Metabolizing Enzyme (DME)
| Full List of Drug(s) Metabolized by This DME | |||||
|---|---|---|---|---|---|
| Drugs Approved by FDA | Click to Show/Hide the Full List of Drugs: 106 Drugs | ||||
Thalidomide |
Drug Info | Approved | Breast cancer | ICD11: 2C60 | [1] |
Bupropion |
Drug Info | Approved | Nicotine dependence | ICD11: 6C4A | [2] |
Tamoxifen citrate |
Drug Info | Approved | Breast cancer | ICD11: 2C60 | [3] |
Estrone |
Drug Info | Approved | Menopausal disorder | ICD11: GA30 | [4] |
Nicotine |
Drug Info | Approved | Nicotine dependence | ICD11: 6C4A | [5] |
Diclofenac sodium |
Drug Info | Approved | Osteoarthritis | ICD11: FA00 | [6] |
Hydrocodone |
Drug Info | Approved | Pain | ICD11: MG30-MG3Z | [7] |
Amlodipine besylate |
Drug Info | Approved | Essential hypertension | ICD11: BA00 | [8] |
Fospropofol disodium |
Drug Info | Approved | Monitored anaesthesia care | ICD11: N.A. | [9] |
Lidocaine |
Drug Info | Approved | Anaesthesia | ICD11: 8E22 | [10] |
Brivaracetam |
Drug Info | Approved | Focal seizure | ICD11: 8A68 | [11] |
Cannabidiol |
Drug Info | Approved | Lennox-Gastaut syndrome | ICD11: 8A62 | [12] |
Capsaicin |
Drug Info | Approved | Herpes zoster | ICD11: 1E91 | [13] |
Ifosfamide |
Drug Info | Approved | Lung cancer | ICD11: 2C25 | [14] |
Terbinafine hydrochloride |
Drug Info | Approved | Pityriasis versicolor | ICD11: 1F2D | [15] |
Ticlopidine |
Drug Info | Approved | Cerebral stroke | ICD11: 8B11 | [16] |
Tretinoin |
Drug Info | Approved | Acne vulgaris | ICD11: ED80 | [17] |
Valproic acid |
Drug Info | Approved | Epilepsy | ICD11: 8A60 | [10] |
Disulfiram |
Drug Info | Approved | Alcohol dependence | ICD11: 6C40 | [18] |
Ixazomib |
Drug Info | Approved | Amyloidosis | ICD11: 5D00 | [19] |
Methyltestosterone |
Drug Info | Approved | Breast cancer | ICD11: 2C60 | [20] |
Apomorphine |
Drug Info | Approved | Parkinsonism | ICD11: 8A00 | [21] |
Clomiphene citrate |
Drug Info | Approved | Female infertility | ICD11: GA31 | [22] |
Halothane |
Drug Info | Approved | Anaesthesia | ICD11: 8E22 | [23] |
Hydrocodone bitartrate |
Drug Info | Approved | Neuropathic pain | ICD11: 8E43 | [24] |
Ketamine |
Drug Info | Approved | Anaesthesia | ICD11: 8E22 | [25] |
Meperidine |
Drug Info | Approved | Anaesthesia | ICD11: 8E22 | [10] |
Perampanel |
Drug Info | Approved | Focal seizure | ICD11: 8A68 | [26] |
Arteether |
Drug Info | Approved | Malaria | ICD11: 1F40-1F45 | [27] |
Benzphetamine |
Drug Info | Approved | Obesity | ICD11: 5B81 | [28] |
Cisapride |
Drug Info | Approved | Gastro-oesophageal reflux disease | ICD11: DA22 | [29] |
Dextromethorphan hydrobromide |
Drug Info | Approved | Atherosclerosis | ICD11: BA80 | [30] |
Diazepam |
Drug Info | Approved | Epilepsy | ICD11: 8A60 | [31] |
Lorcaserin |
Drug Info | Approved | Obesity | ICD11: 5B81 | [32] |
Nevirapine |
Drug Info | Approved | Human immunodeficiency virus infection | ICD11: 1C60 | [33] |
Verapamil hydrochloride |
Drug Info | Approved | Essential hypertension | ICD11: BA00 | [17] |
Amitriptyline hydrochloride |
Drug Info | Approved | Depression | ICD11: 6A71 | [34] |
Artemether |
Drug Info | Approved | Malaria | ICD11: 1F40 | [10] |
Bromfenac |
Drug Info | Approved | Cataract | ICD11: 9B10 | [35] |
Carbamazepine |
Drug Info | Approved | Epilepsy | ICD11: 8A60 | [36] |
Cenobamate |
Drug Info | Approved | Focal seizure | ICD11: 8A68 | [37] |
Clobazam |
Drug Info | Approved | Lennox-Gastaut syndrome | ICD11: 8A62 | [38] |
Cyclophosphamide |
Drug Info | Approved | Multiple myeloma | ICD11: 2A83 | [39] |
Efavirenz |
Drug Info | Approved | Human immunodeficiency virus infection | ICD11: 1C60 | [40] |
Fluoxetine hydrochloride |
Drug Info | Approved | Depression | ICD11: 6A71 | [41] |
Imipramine hydrochloride |
Drug Info | Approved | Depression | ICD11: 6A71 | [42] |
Isotretinoin |
Drug Info | Approved | Acne vulgaris | ICD11: ED80 | [43] |
Istradefylline |
Drug Info | Approved | Parkinsonism | ICD11: 8A00 | [44] |
Midazolam hydrochloride |
Drug Info | Approved | Anxiety disorder | ICD11: 6B00 | [45] |
Phenytoin |
Drug Info | Approved | Epilepsy | ICD11: 8A60 | [46] |
Ropivacaine hydrochloride |
Drug Info | Approved | Anaesthesia | ICD11: 8E22 | [17] |
Exemestane |
Drug Info | Approved | Breast cancer | ICD11: 2C60 | [47] |
Loxapine succinate |
Drug Info | Approved | Schizophrenia | ICD11: 6A20 | [48] |
Malathion |
Drug Info | Approved | Pediculosis | ICD11: 1G00 | [49] |
Ospemifene |
Drug Info | Approved | Dyspareunia | ICD11: GA12 | [50] |
Propofol |
Drug Info | Approved | Anaesthesia | ICD11: 8E22 | [51] |
Ritonavir |
Drug Info | Approved | Human immunodeficiency virus infection | ICD11: 1C60 | [40] |
Testosterone undecanoate |
Drug Info | Approved | Hypogonadism | ICD11: 5A61 | [10] |
Tramadol hydrochloride |
Drug Info | Approved | Neuropathic pain | ICD11: 8E43 | [52] |
Triclosan |
Drug Info | Approved | Malaria | ICD11: 1F40-1F45 | [53] |
Vortioxetine hydrobromide |
Drug Info | Approved | Depression | ICD11: 6A71 | [54] |
Benzocaine |
Drug Info | Approved | Anaesthesia | ICD11: 9A76-9A78 | [55] |
Irinotecan hydrochloride |
Drug Info | Approved | Colon cancer | ICD11: 2B90 | [56] |
Lenvatinib |
Drug Info | Approved | Thyroid cancer | ICD11: 2D10 | [57] |
Levomethadyl acetate hydrochloride |
Drug Info | Approved | Opiate dependence | ICD11: 6C43 | [58] |
Loperamide hydrochloride |
Drug Info | Approved | Irritable bowel syndrome | ICD11: DD91 | [59] |
Methadone |
Drug Info | Approved | Anaesthesia | ICD11: 8E22 | [60] |
Mexiletine hydrochloride |
Drug Info | Approved | Ventricular tachyarrhythmia | ICD11: BC71 | [61] |
Olopatadine |
Drug Info | Approved | Conjunctivitis | ICD11: 9A60 | [62] |
Phenobarbital |
Drug Info | Approved | Epilepsy | ICD11: 8A60 | [36] |
Promethazine |
Drug Info | Approved | Functional nausea/vomiting | ICD11: DD90 | [23] |
Timolol maleate |
Drug Info | Approved | Essential hypertension | ICD11: BA00 | [63] |
Azilsartan |
Drug Info | Approved | Hypertension | ICD11: BA00-BA04 | [64] |
Azilsartan |
Drug Info | Approved | Hypertension | ICD11: BA00-BA04 | [65], [66] |
Azilsartan medoxomil |
Drug Info | Approved | Essential hypertension | ICD11: BA00 | [67] |
Clofibrate |
Drug Info | Approved | Hypertriglyceridaemia | ICD11: 5C80 | [68] |
Clopidogrel bisulfate |
Drug Info | Approved | Acute coronary syndrome | ICD11: BA4Z | [69] |
Flibanserin |
Drug Info | Approved | Inhibited sexual desire | ICD11: HA00 | [70] |
Levomethadyl Acetate |
Drug Info | Approved | Opiate dependence | ICD11: 6C43 | [71] |
Lomitapide mesylate |
Drug Info | Approved | Hypertriglyceridaemia | ICD11: 5C80 | [72] |
Loratadine |
Drug Info | Approved | Allergic rhinitis | ICD11: CA08 | [73] |
Mephenytoin |
Drug Info | Approved | Epilepsy | ICD11: 8A60 | [16] |
Moxidectin |
Drug Info | Approved | Onchocerciasis | ICD11: 1F6A | [74] |
Prasugrel hydrochloride |
Drug Info | Approved | Acute coronary syndrome | ICD11: BA4Z | [75] |
Selegiline |
Drug Info | Approved | Major depressive disorder | ICD11: 6A70-6A7Z | [76] |
Selegiline hydrochloride |
Drug Info | Approved | Parkinsonism | ICD11: 8A00 | [77] |
Sertraline hydrochloride |
Drug Info | Approved | Depression | ICD11: 6A71 | [78] |
Temazepam |
Drug Info | Approved | Insomnia | ICD11: 7A00 | [79] |
Voxelotor |
Drug Info | Approved | Sickle-cell anaemia | ICD11: 3A51 | [80] |
Desipramine |
Drug Info | Approved | Attention deficit hyperactivity disorder | ICD11: 6A05 | [56] |
Enasidenib |
Drug Info | Approved | Acute myeloid leukaemia | ICD11: 2A60 | [81] |
Epinastine |
Drug Info | Approved | Conjunctivitis | ICD11: 9A60 | [82] |
Ibudilast |
Drug Info | Approved | Castleman's disease | ICD11: 4B2Y | [83] |
Isoflurane |
Drug Info | Approved | Anaesthesia | ICD11: 8E22 | [17] |
Meloxicam |
Drug Info | Approved | Osteoarthritis | ICD11: FA00 | [84] |
Permethrin |
Drug Info | Approved | Scabies | ICD11: 1G04 | [85] |
Rifampicin |
Drug Info | Approved | Osteoporosis | ICD11: FB83 | [86] |
Romidepsin |
Drug Info | Approved | Cutaneous T-cell lymphoma | ICD11: 2B01 | [87] |
Sevoflurane |
Drug Info | Approved | Anaesthesia | ICD11: 8E22 | [17] |
Testosterone cypionate |
Drug Info | Approved | Testosterone deficiency | ICD11: 5A81 | [10] |
Testosterone enanthate |
Drug Info | Approved | Testosterone deficiency | ICD11: 5A81 | [10] |
Velpatasvir |
Drug Info | Approved | Viral hepatitis | ICD11: 1E51 | [88] |
Velpatasvir |
Drug Info | Approved | Viral hepatitis | ICD11: 1E51 | [89] |
Methoxyflurane |
Drug Info | Approved | Anaesthesia | ICD11: 8E22 | [90] |
Testosterone |
Drug Info | Approved | Osteoporosis | ICD11: FB83 | [45] |
Trifarotene |
Drug Info | Approved | Acne vulgaris | ICD11: ED80 | [91] |
| Drugs in Phase 4 Clinical Trial | Click to Show/Hide the Full List of Drugs: 9 Drugs | ||||
Artemisinin |
Drug Info | Phase 4 | Malaria | ICD11: 1F40 | [92] |
Cinnarizine |
Drug Info | Phase 4 | Haemorrhagic stroke | ICD11: 8B20 | [16] |
Ketobemidone |
Drug Info | Phase 4 | Anaesthesia | ICD11: 8E22 | [93] |
Mianserin |
Drug Info | Phase 4 | Depression | ICD11: 6A71 | [23] |
Vonoprazan |
Drug Info | Phase 4 | Gastro-oesophageal reflux disease | ICD11: DA22 | [94] |
Vonoprazan |
Drug Info | Phase 4 | Gastro-oesophageal reflux disease | ICD11: DA22 | [95] |
Zotepine |
Drug Info | Phase 4 | Schizophrenia | ICD11: 6A20 | [96] |
Clotiazepam |
Drug Info | Phase 4 | Anxiety disorder | ICD11: 6B00 | [97] |
Flunitrazepam |
Drug Info | Phase 4 | Insomnia | ICD11: 7A00 | [98] |
| Drugs in Phase 3 Clinical Trial | Click to Show/Hide the Full List of Drugs: 13 Drugs | ||||
BMS-650032 |
Drug Info | Phase 3 | Viral hepatitis | ICD11: 1E51 | [99] |
KW-5338 |
Drug Info | Phase 3 | Gastroparesis | ICD11: DA41 | [100] |
BMS-986165 |
Drug Info | Phase 3 | Psoriasis vulgaris | ICD11: EA90 | [101] |
LY-450139 |
Drug Info | Phase 3 | Alzheimer disease | ICD11: 8A20 | [102] |
WSM-3978G |
Drug Info | Phase 3 | Hypertrophic cardiomyopathy | ICD11: BC43 | [103] |
CR-2017 |
Drug Info | Phase 3 | Irritable bowel syndrome | ICD11: DD91 | [104] |
Fenfluramine |
Drug Info | Phase 3 | Dravet syndrome | ICD11: 8A61-8A6Z | [105] |
TAK-491 |
Drug Info | Phase 3 | Hypertension | ICD11: BA00-BA04 | [106] |
Ganaxolone |
Drug Info | Phase 3 | Complex partial seizure | ICD11: 8A61-8A6Z | [107] |
JNJ-54135419 |
Drug Info | Phase 3 | Depression | ICD11: 6A71 | [25] |
MRTX849 |
Drug Info | Phase 3 | Lung cancer | ICD11: 2C25 | [108] |
WY-1485 |
Drug Info | Phase 3 | Haemorrhagic stroke | ICD11: 8B20 | [17] |
Ag-221 |
Drug Info | Phase 3 | Acute myelogenous leukaemia | ICD11: 2A41 | [109] |
| Drugs in Phase 2 Clinical Trial | Click to Show/Hide the Full List of Drugs: 8 Drugs | ||||
Fexinidazole |
Drug Info | Phase 2/3 | Trypanosomiasis | ICD11: 1D51-1F53 | [110], [111] |
Fexinidazole |
Drug Info | Phase 2/3 | Trypanosomiasis | ICD11: 1D51-1F53 | [111] |
HOE-239 |
Drug Info | Phase 2/3 | Trypanosomiasis | ICD11: 1F51 | [111] |
CYC-202 |
Drug Info | Phase 2 | Lung cancer | ICD11: 2C25 | [112] |
Z-4828 |
Drug Info | Phase 2 | Histiocytic sarcoma | ICD11: 2B31 | [113] |
Piclamilast |
Drug Info | Phase 2 | Rheumatoid arthritis | ICD11: FA20 | [114] |
TAK-906 |
Drug Info | Phase 2 | Gastroparesis | ICD11: DA41 | [115] |
Encequidar |
Drug Info | Phase 2 | Metastatic breast cancer | ICD11: 2C60-2C6Y | [116] |
| Drugs in Phase 1 Clinical Trial | Click to Show/Hide the Full List of Drugs: 2 Drugs | ||||
H3B-6545 |
Drug Info | Phase 1 | Breast cancer | ICD11: 2C60 | [117] |
OSI-930 |
Drug Info | Phase 1 | Solid tumour/cancer | ICD11: 2A00-2F9Z | [118] |
| Discontinued/withdrawn Drugs | Click to Show/Hide the Full List of Drugs: 7 Drugs | ||||
Almokalant |
Drug Info | Discontinued in Phase 3 | Cardiac arrhythmias | ICD11: BC9Z | [119] |
AZD0328 |
Drug Info | Discontinued in Phase 2 | Alzheimer disease | ICD11: 8A20 | [120] |
TAK-802 |
Drug Info | Discontinued in Phase 2 | Urinary dysfunction | ICD11: GC2Z | [121] |
Nomifensine |
Drug Info | Discontinued | Depression | ICD11: 6A71 | [122] |
ABT-001 |
Drug Info | Discontinued | Asthma | ICD11: CA23 | [16] |
DEA-2250 |
Drug Info | Discontinued | Epilepsy | ICD11: 8A60 | [123] |
AN-16649 |
Drug Info | Discontinued | Acute lymphoblastic leukemia | ICD11: 2B33 | [124] |
| Preclinical/investigative Agents | Click to Show/Hide the Full List of Drugs: 7 Drugs | ||||
Coumarin |
Drug Info | Investigative | Discovery agent | ICD: N.A. | [125], [126] |
Ethylmorphine |
Drug Info | Investigative | Discovery agent | ICD: N.A. | [31] |
Flavone |
Drug Info | Investigative | Colon cancer | ICD11: 2B90 | [127] |
Antipyrine |
Drug Info | Investigative | Discovery agent | ICD: N.A. | [128] |
Beta-ionone |
Drug Info | Investigative | Breast cancer | ICD11: 2C60 | [129] |
Lauric acid |
Drug Info | Investigative | Alzheimer disease | ICD11: 8A20 | [130], [131] |
Levoverbenone |
Drug Info | Investigative | Pulmonary tuberculosis | ICD11: 1B10 | [132] |
| Tissue/Disease-Specific Protein Abundances of This DME | |||||
|---|---|---|---|---|---|
| ICD Disease Classification 01 | Infectious/parasitic disease | Click to Show/Hide | |||
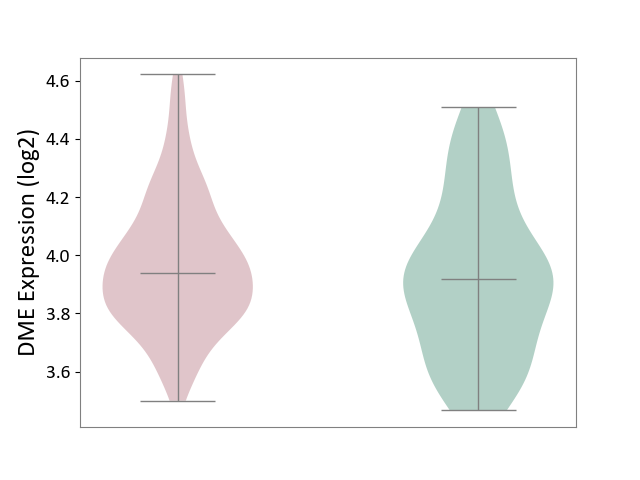
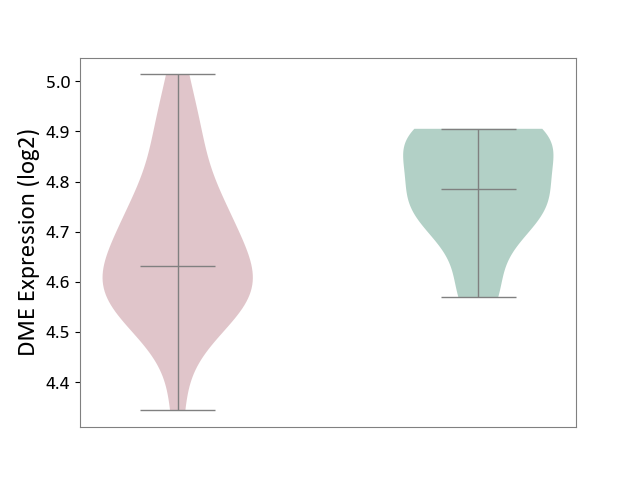
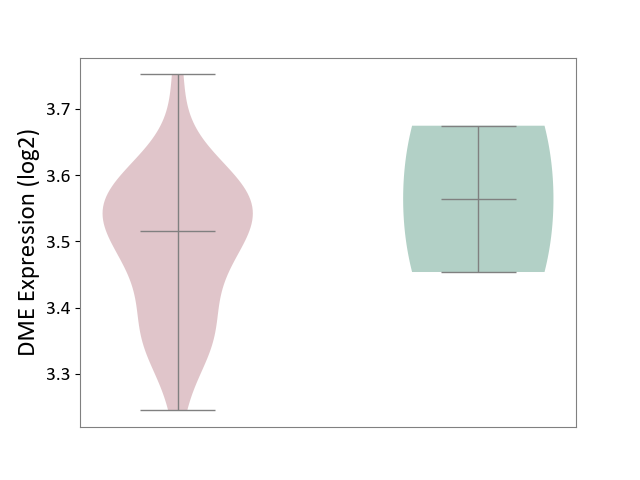
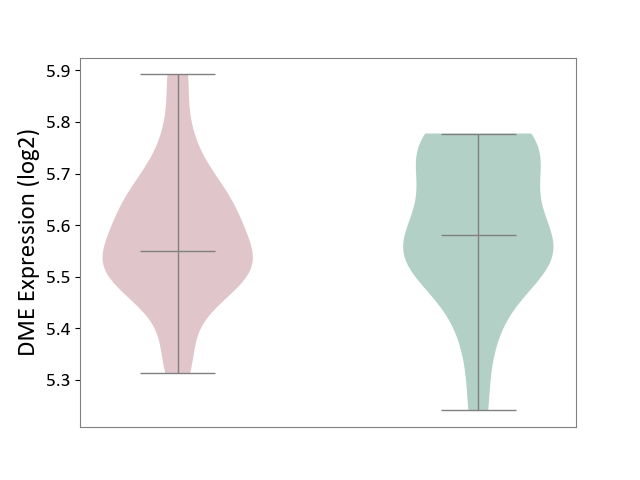
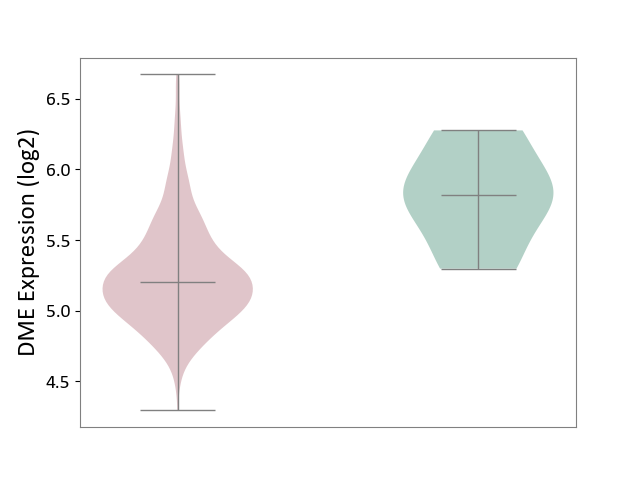
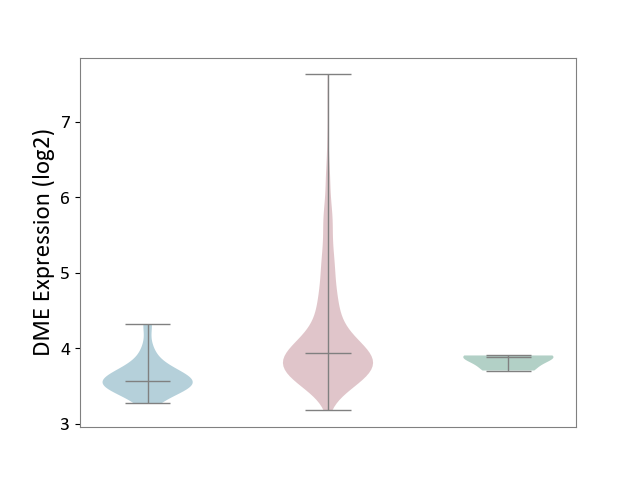
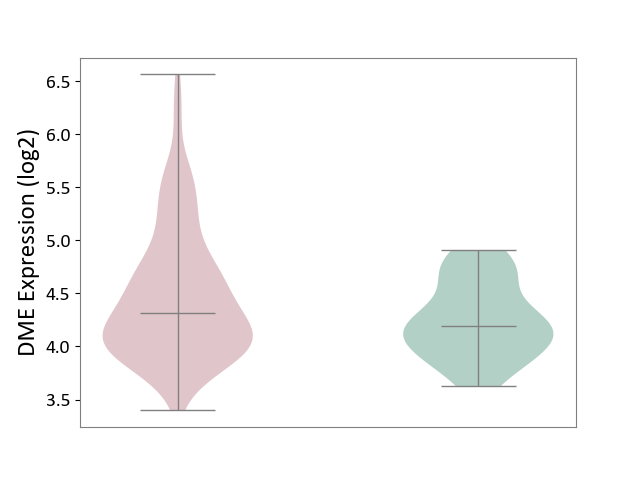
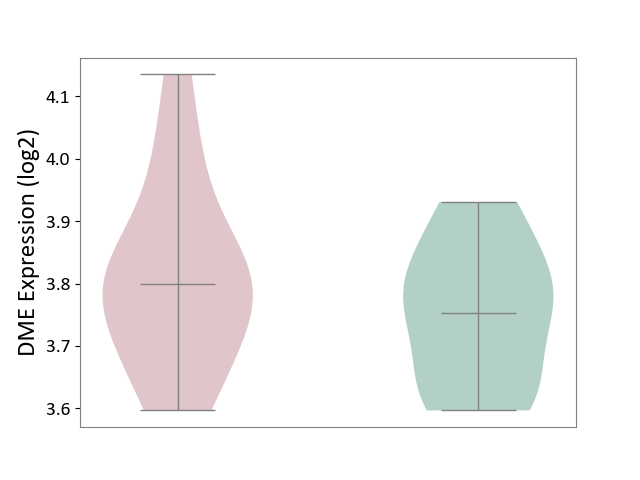
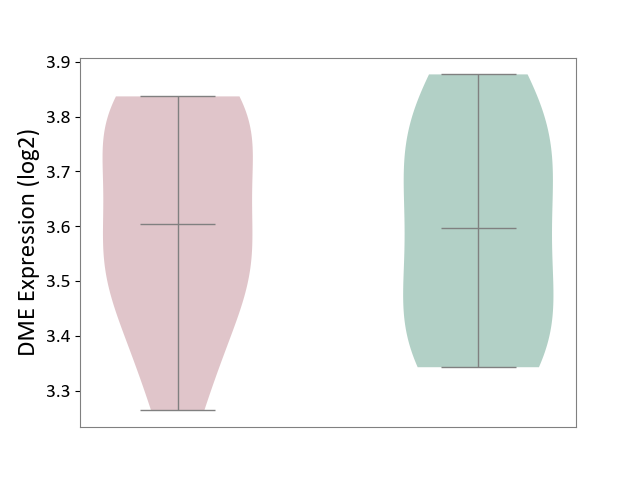
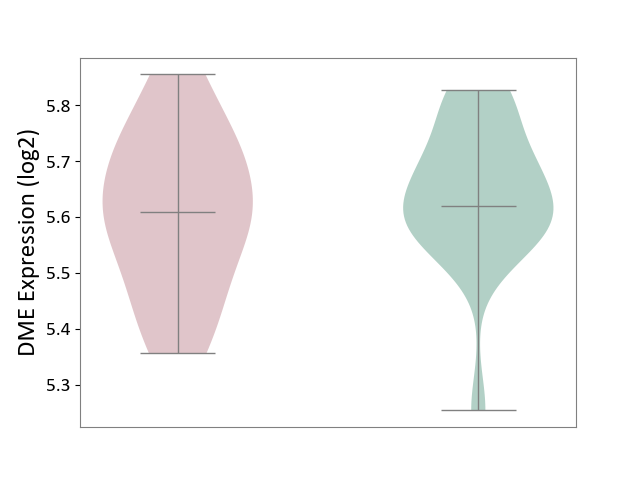
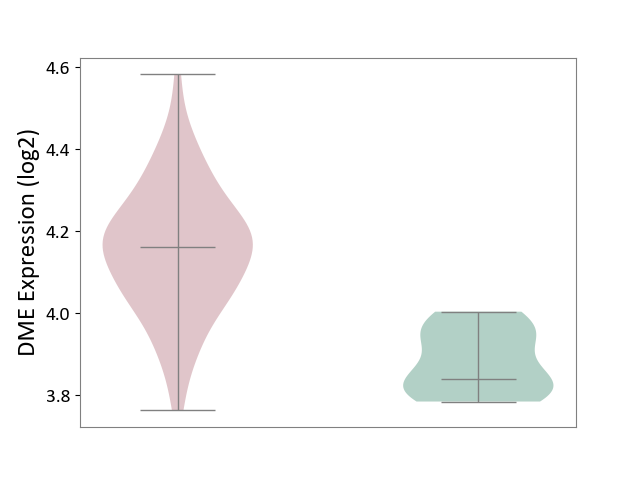
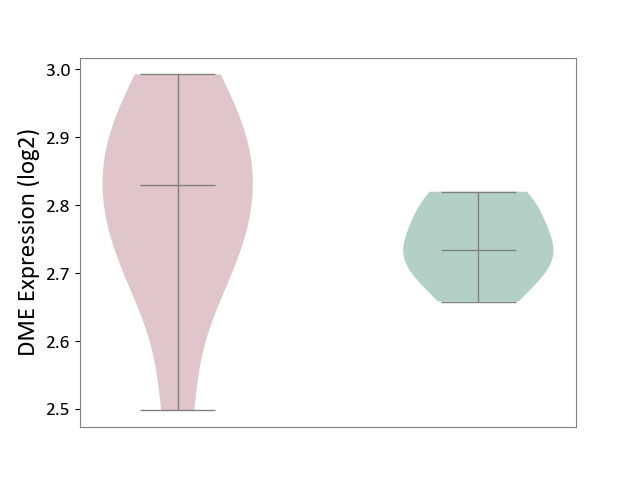
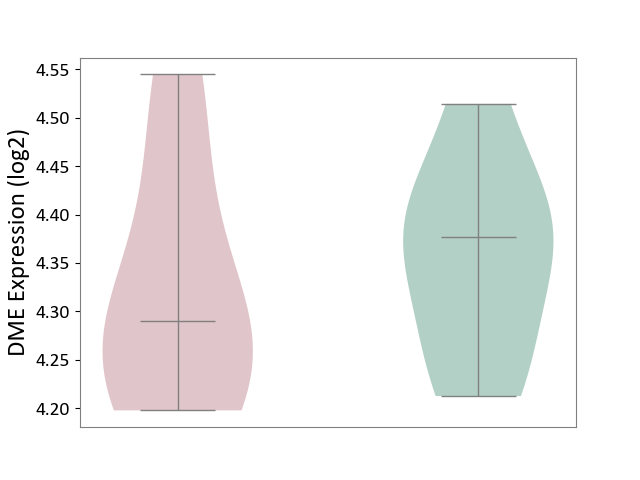
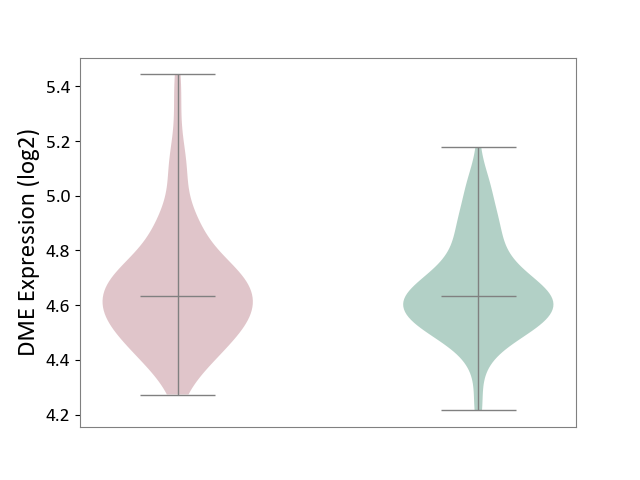
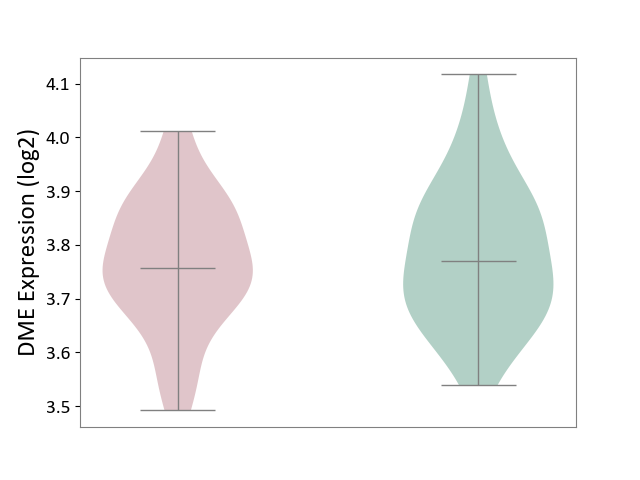
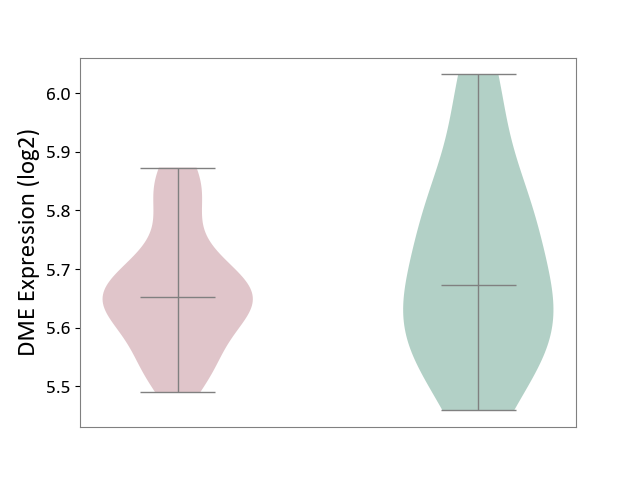
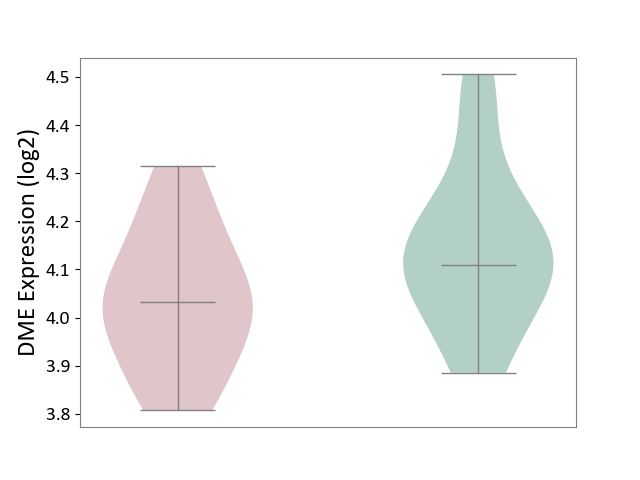
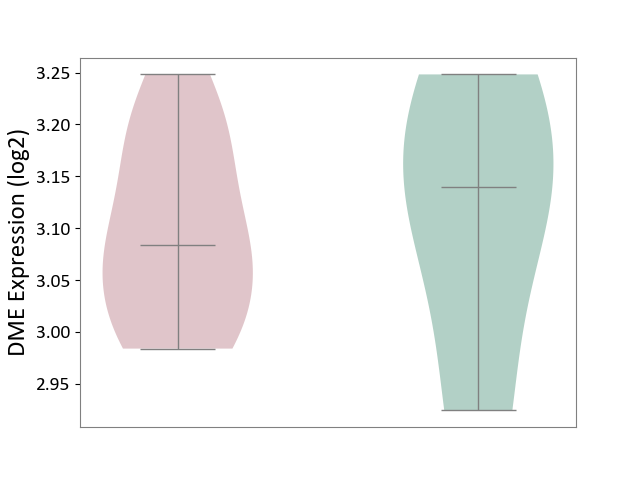
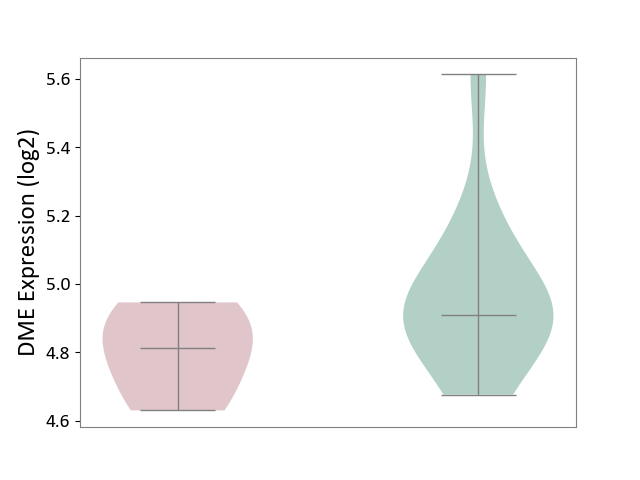
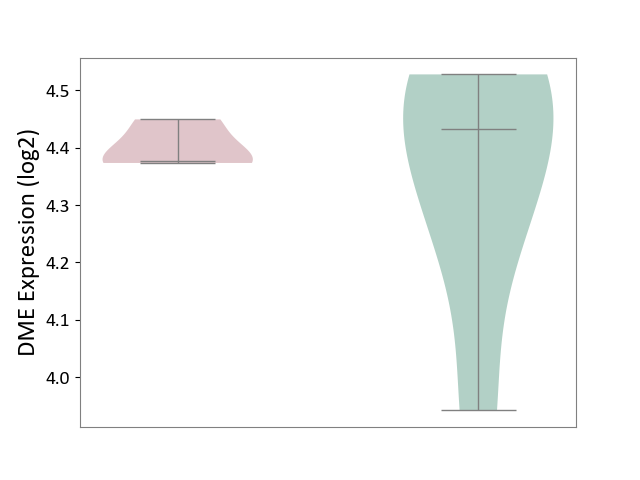
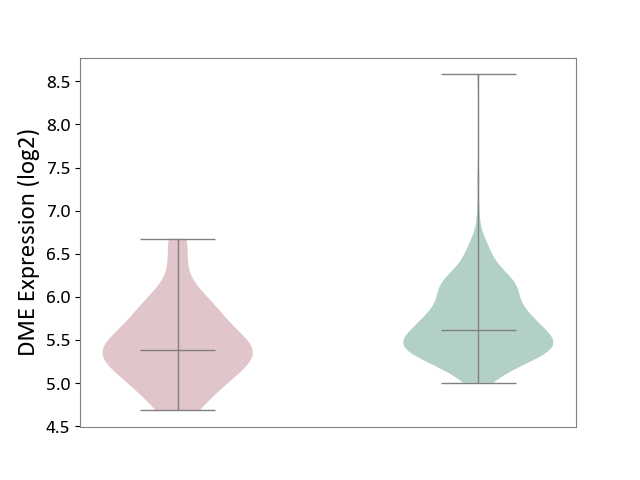
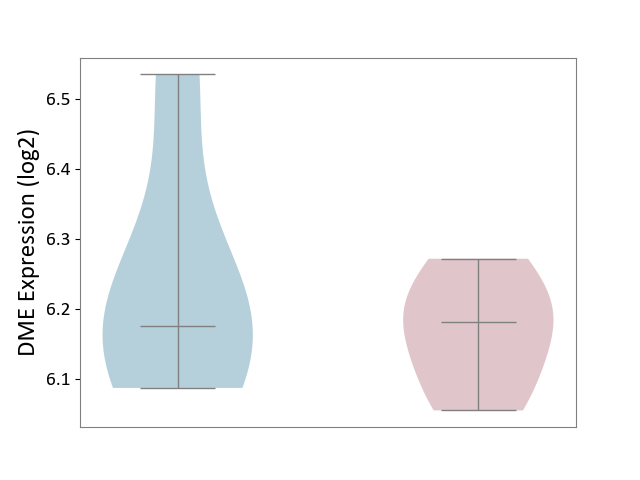
| ICD-11: 1C1H | Necrotising ulcerative gingivitis | Click to Show/Hide | |||
| The Studied Tissue | Gingival tissue | ||||
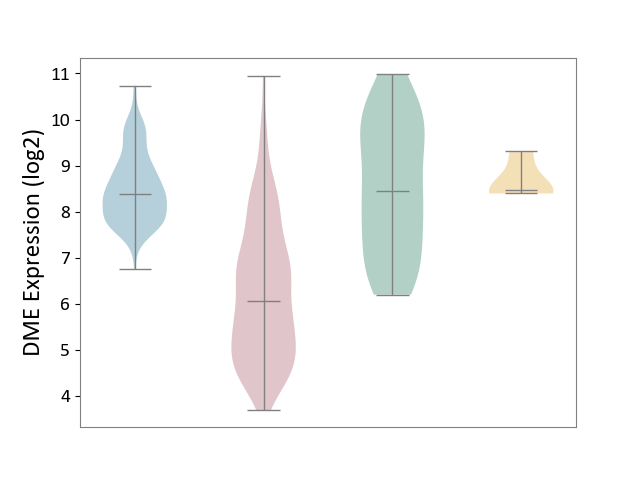
| The Specified Disease | Bacterial infection of gingival [ICD-11:1C1H] | ||||
| The Expression Level of Disease Section Compare with the Healthy Individual Tissue | p-value: 2.84E-01; Fold-change: 2.08E-02; Z-score: 7.58E-02 | ||||
|
DME expression in the diseased tissue of patients
DME expression in the normal tissue of healthy individuals
|
|||||
| Violin Diagram of DME Disease-specific Protein Abundances |
|
Click to View the Clearer Original Diagram | |||
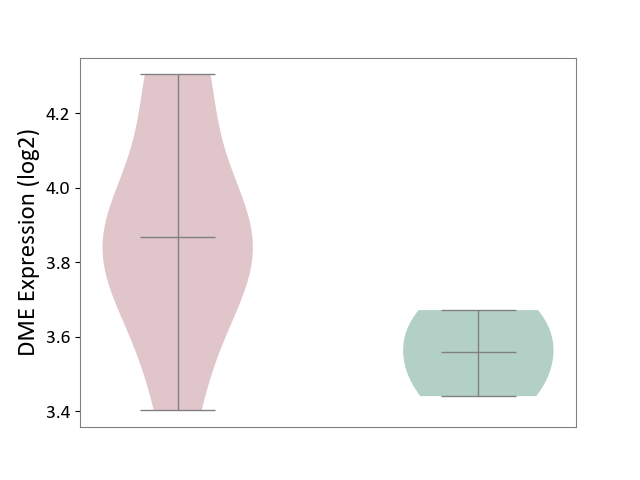
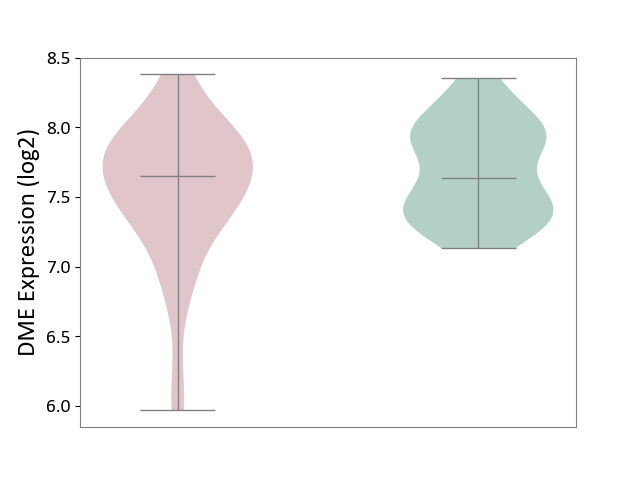
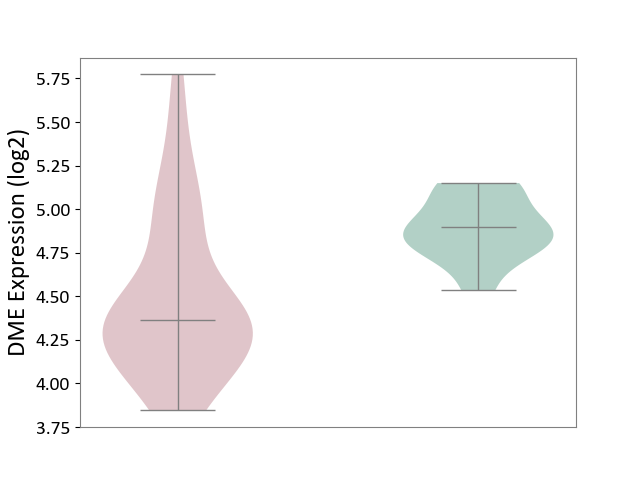
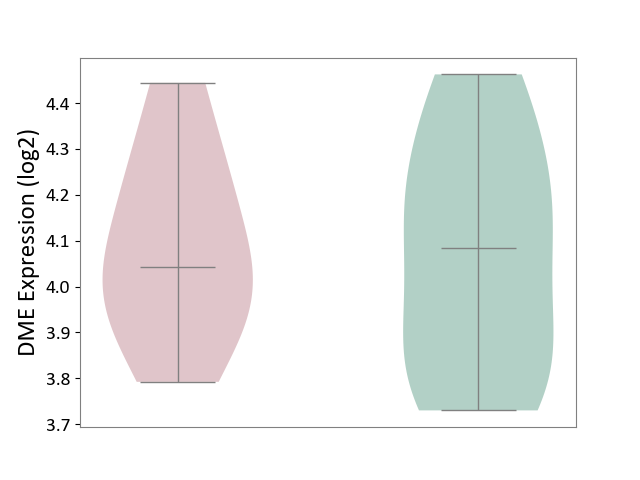
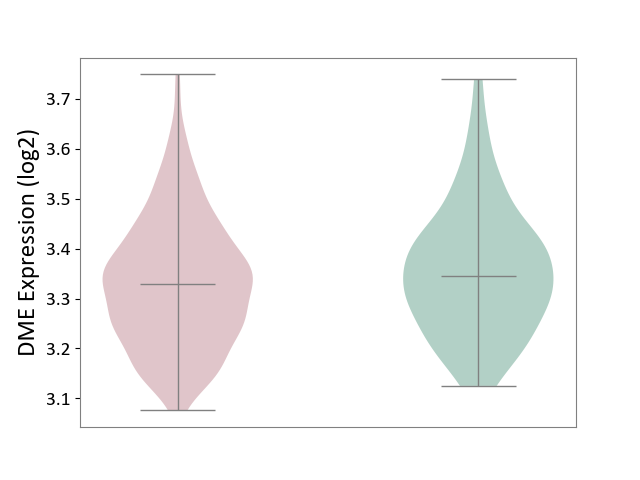
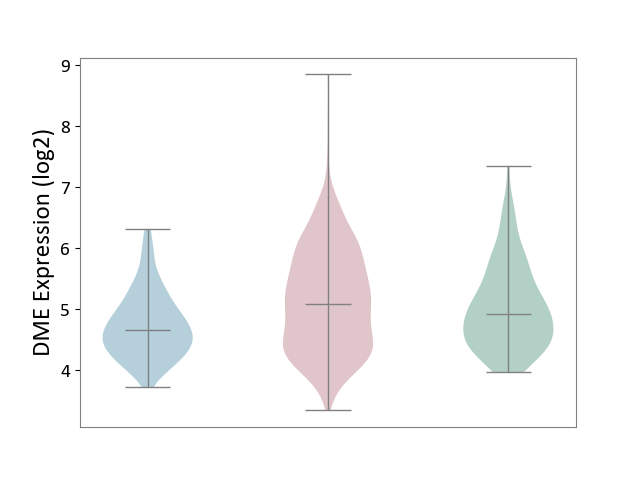
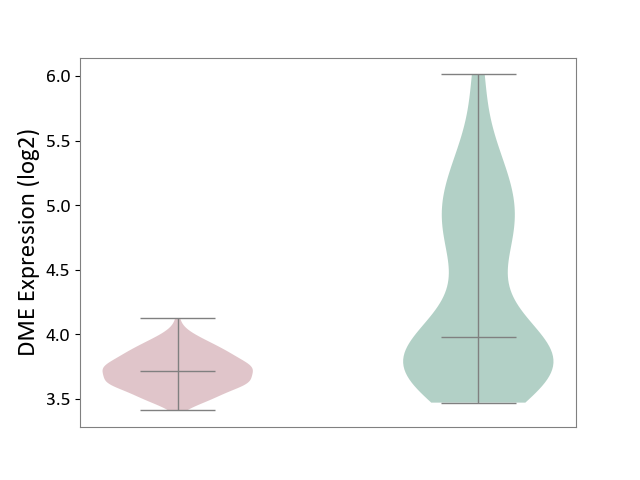
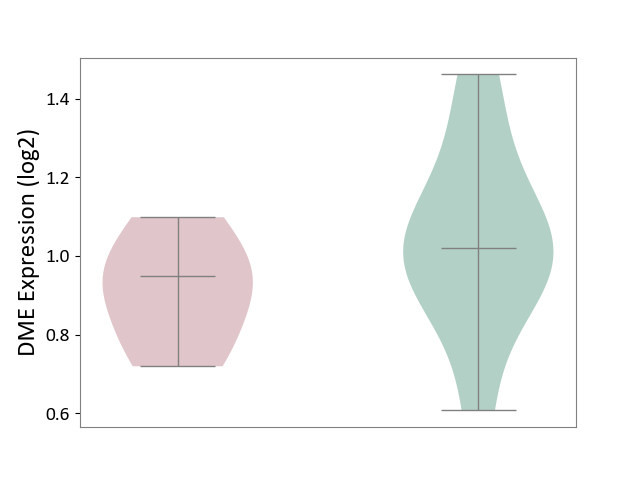
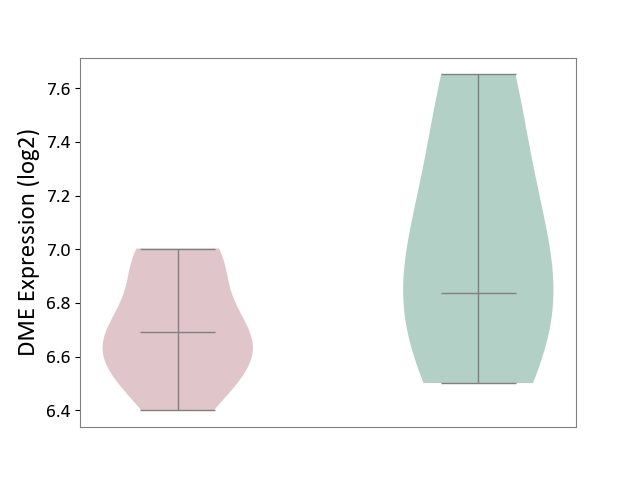
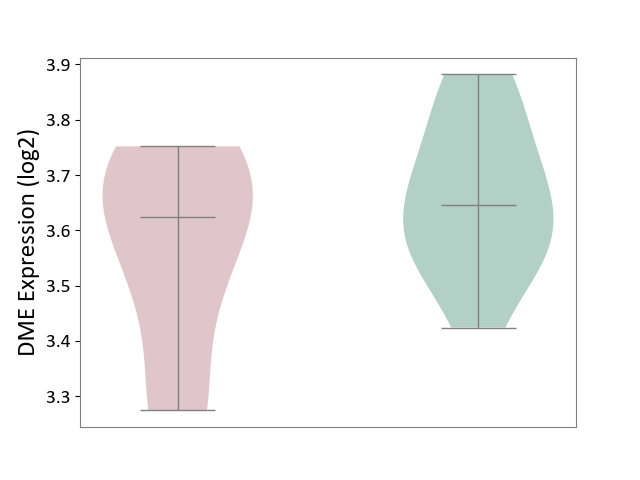
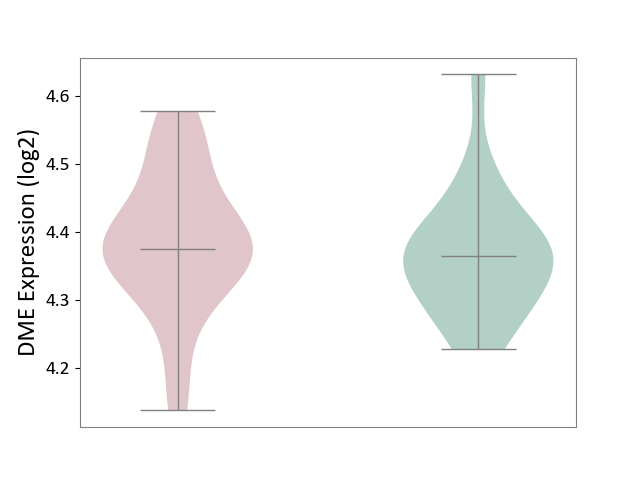
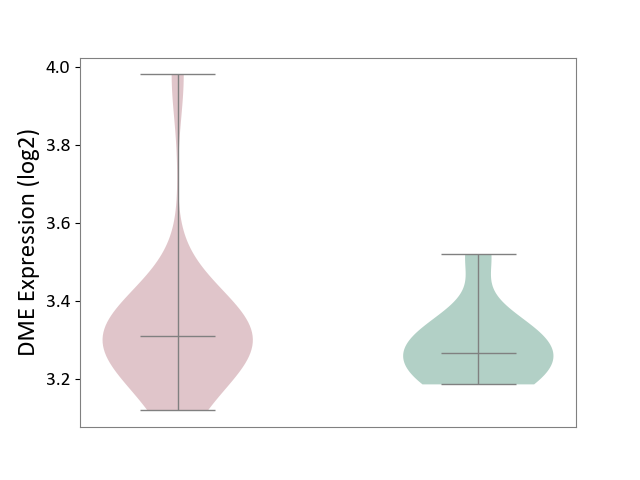
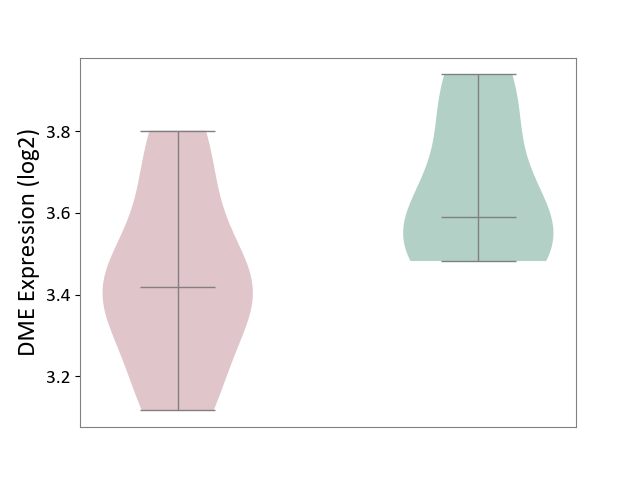
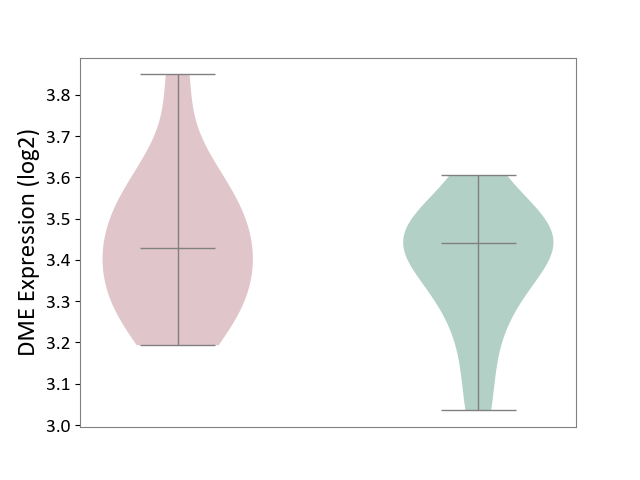
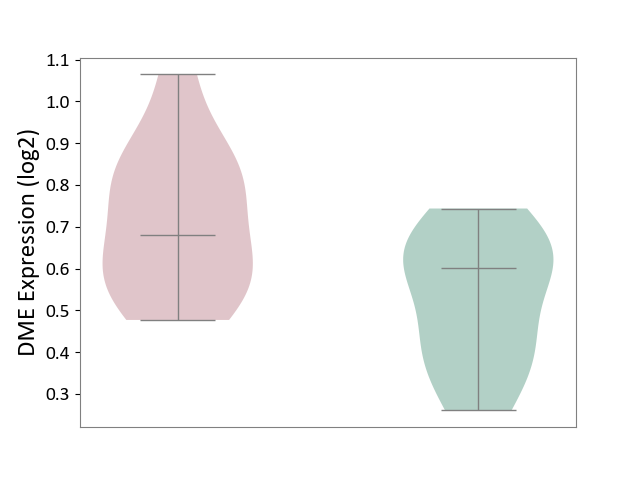
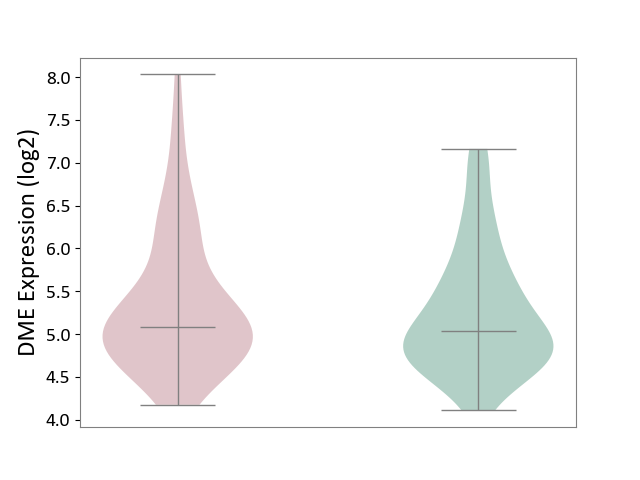
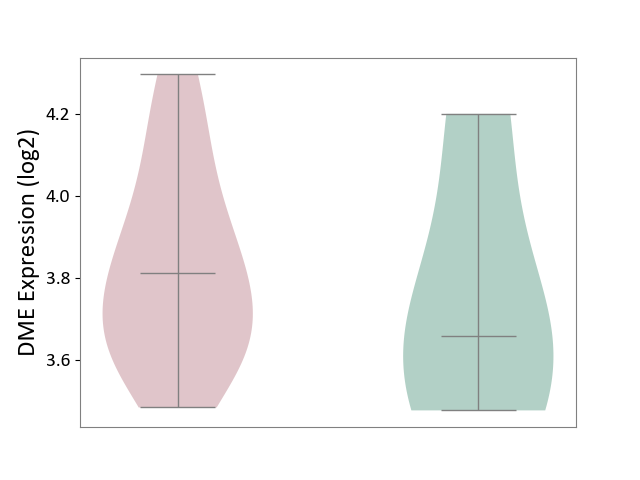
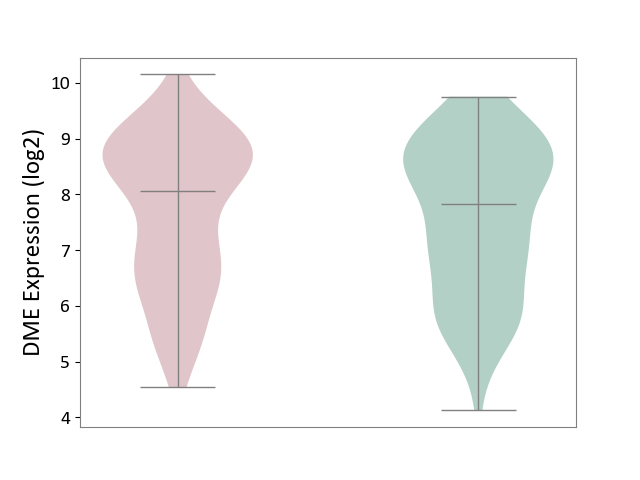
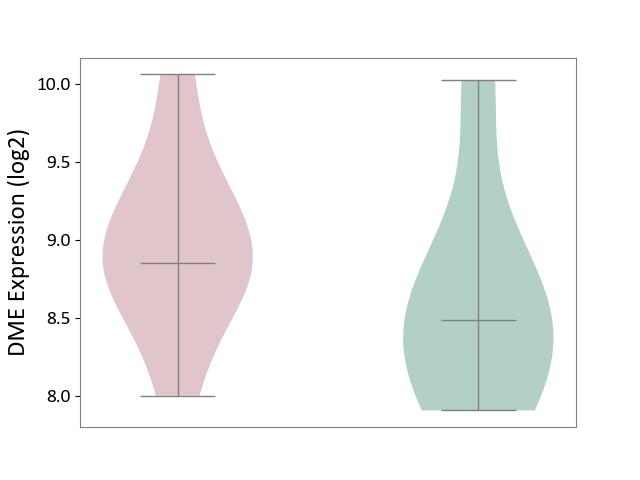
| ICD-11: 1E30 | Influenza | Click to Show/Hide | |||
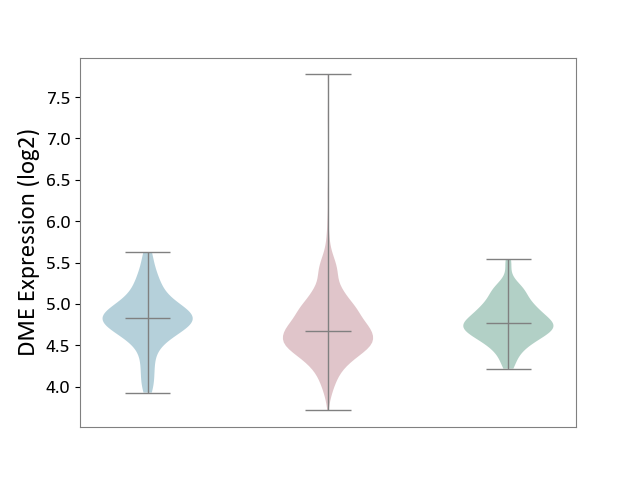
| The Studied Tissue | Whole blood | ||||
| The Specified Disease | Influenza [ICD-11:1E30] | ||||
| The Expression Level of Disease Section Compare with the Healthy Individual Tissue | p-value: 2.05E-02; Fold-change: 3.08E-01; Z-score: 2.67E+00 | ||||
|
DME expression in the diseased tissue of patients
DME expression in the normal tissue of healthy individuals
|
|||||
| Violin Diagram of DME Disease-specific Protein Abundances |
|
Click to View the Clearer Original Diagram | |||
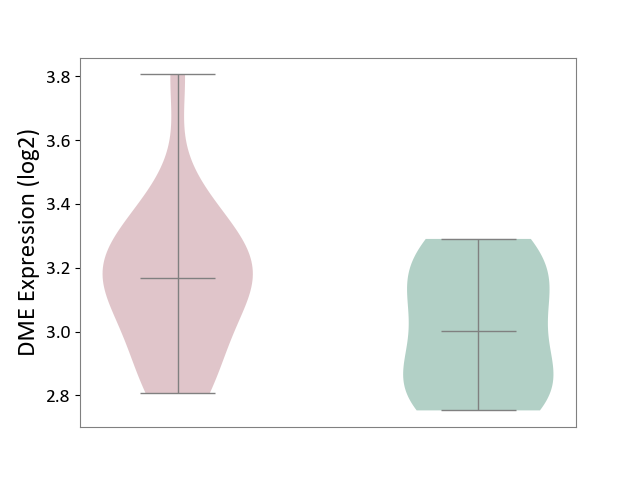
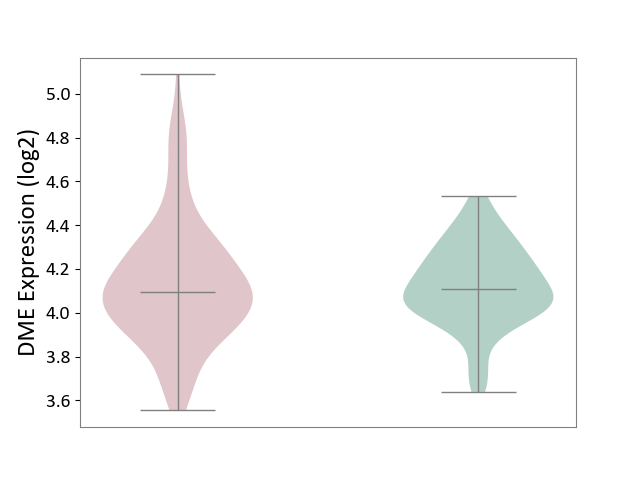
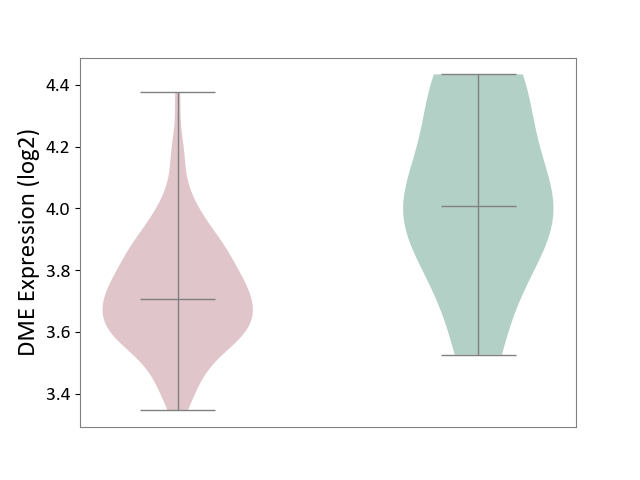
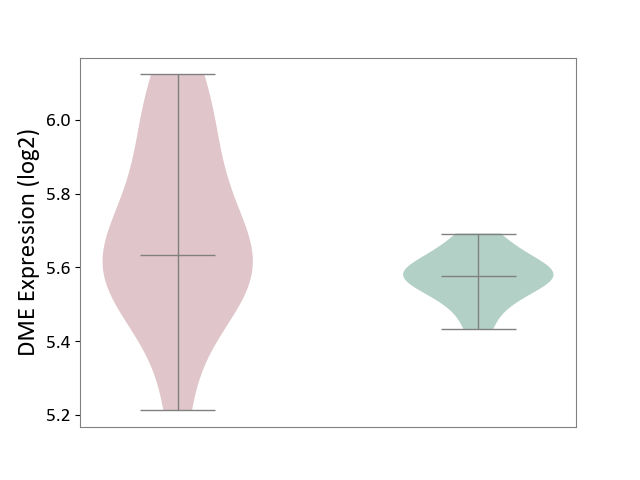
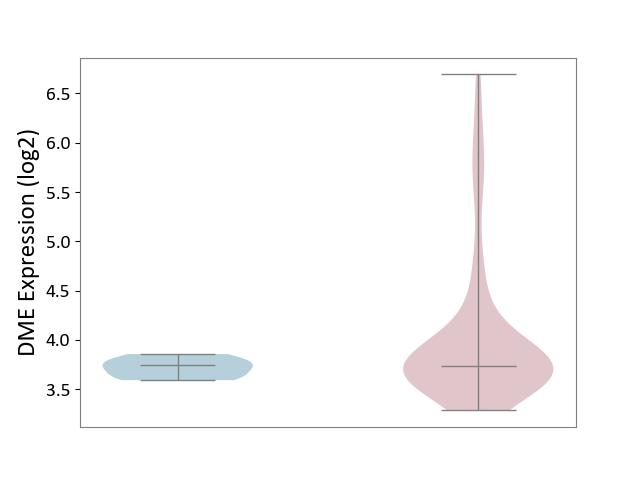
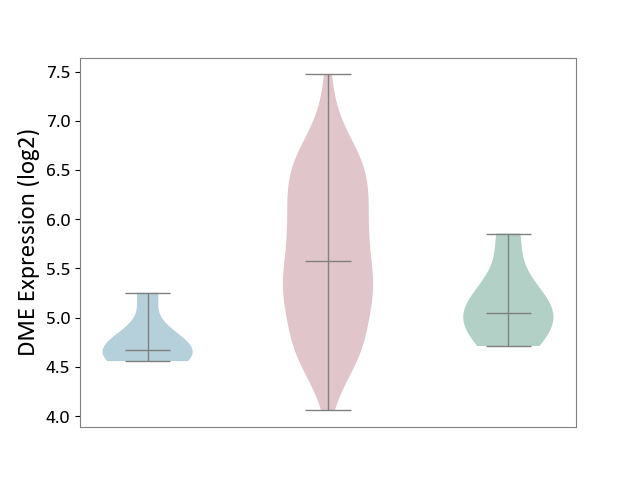
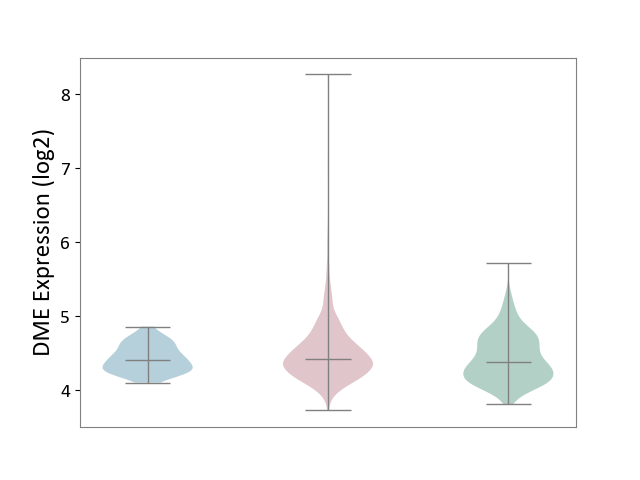
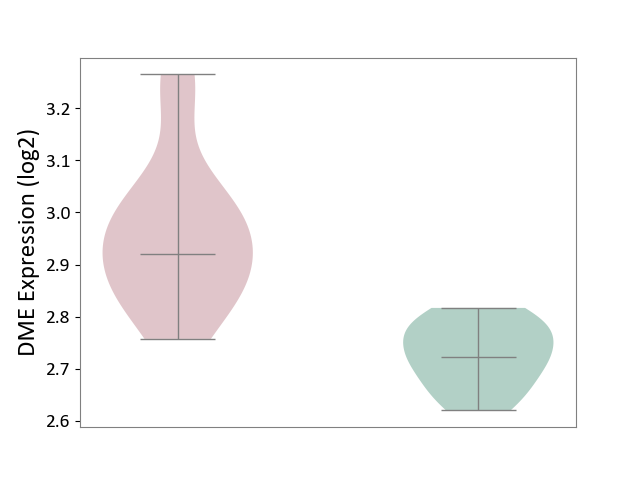
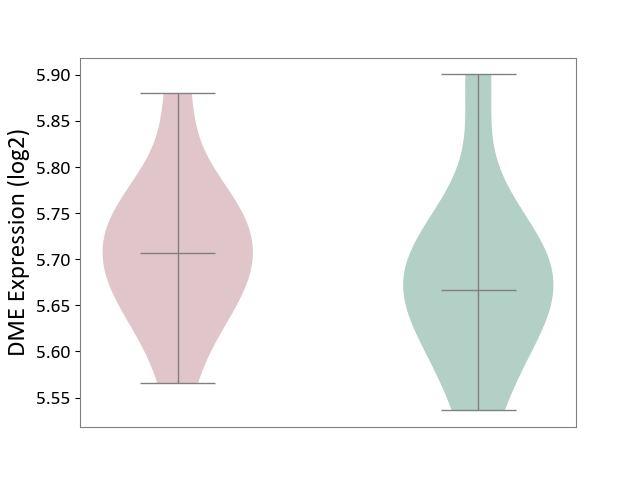
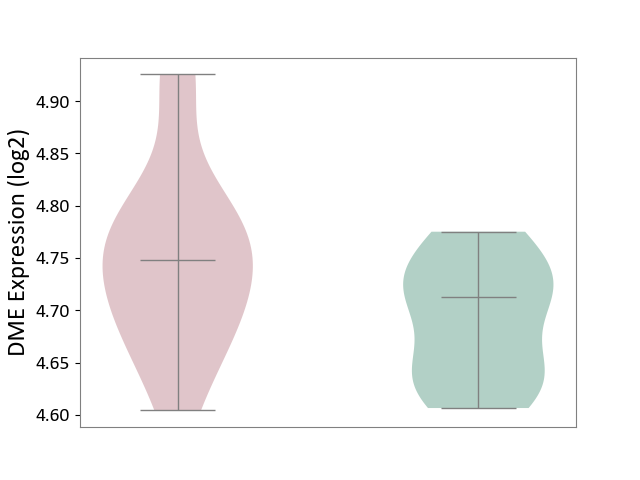
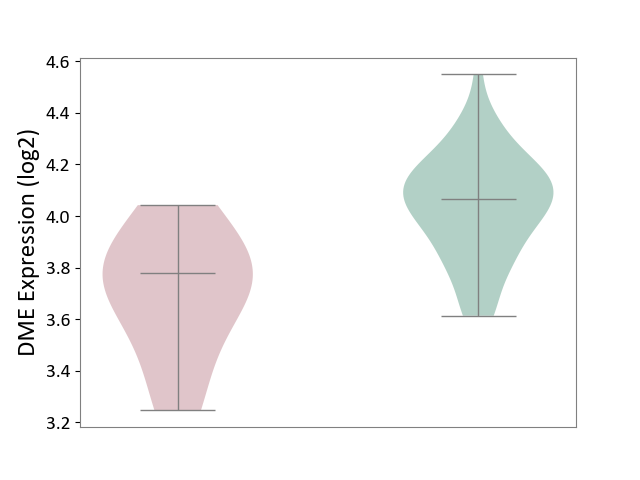
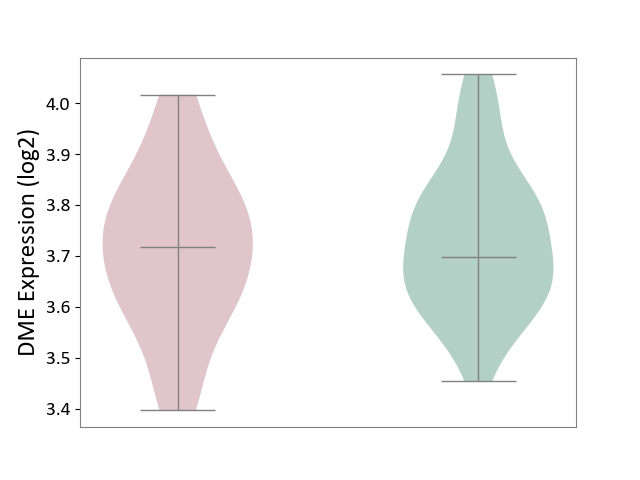
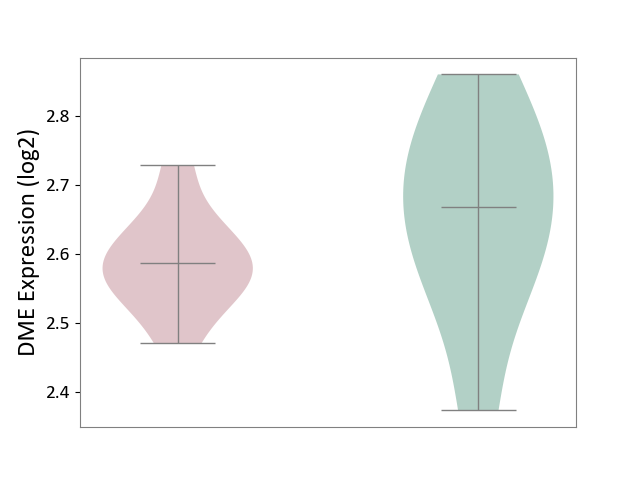
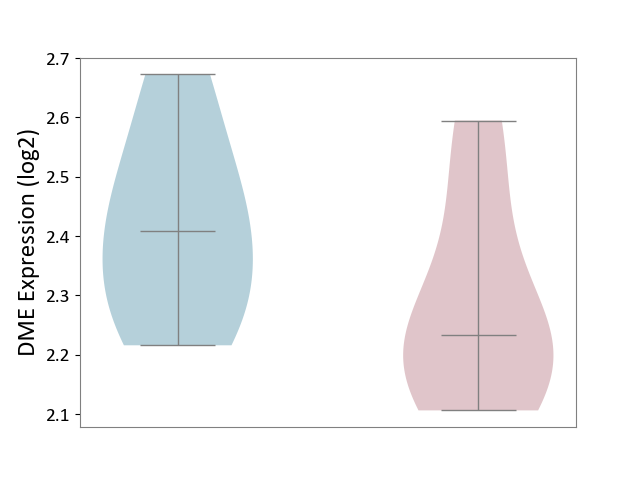
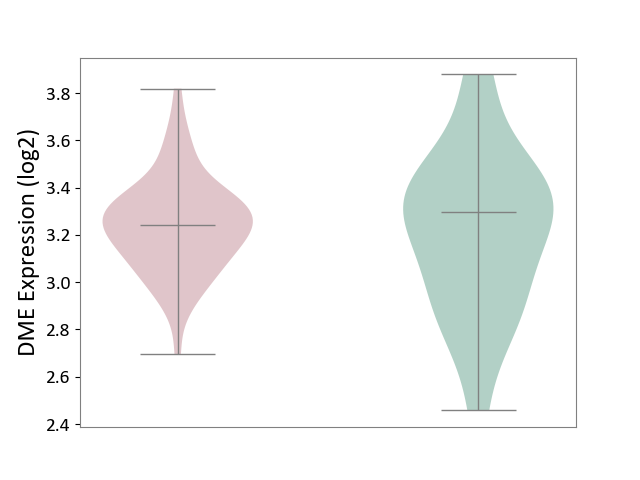
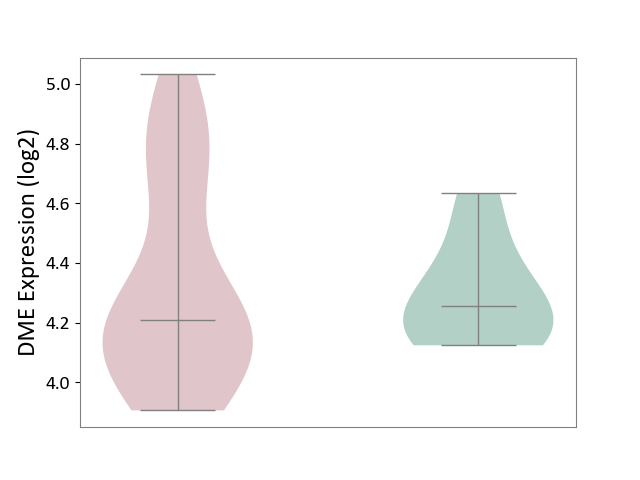
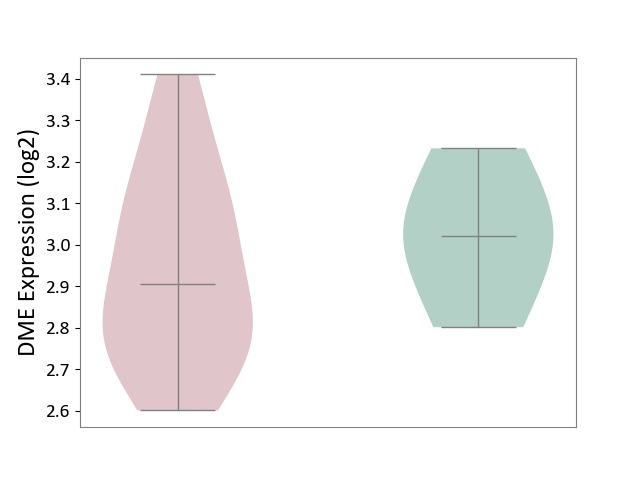
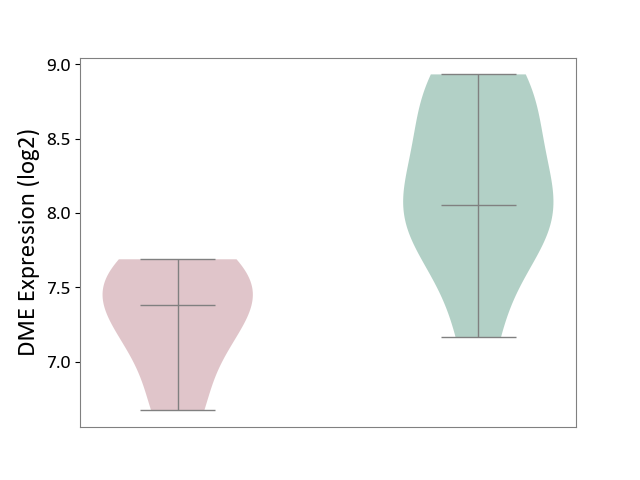
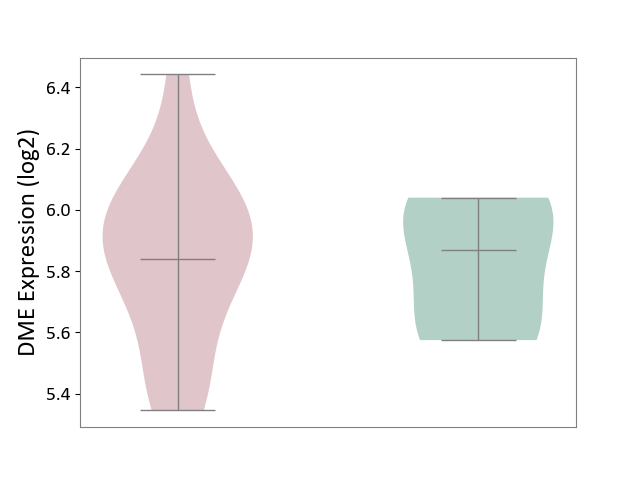
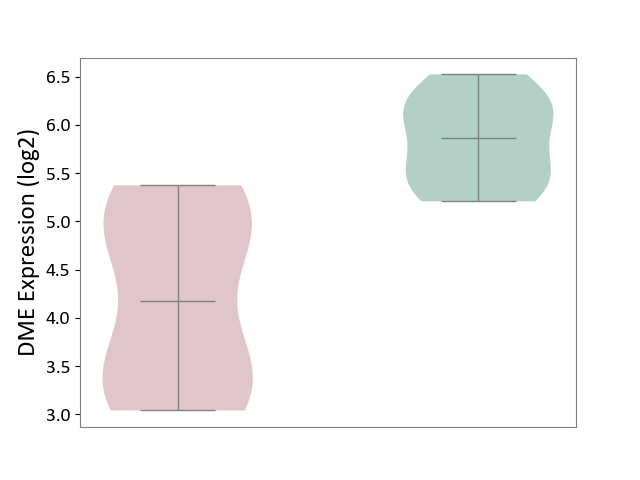
| ICD-11: 1E51 | Chronic viral hepatitis | Click to Show/Hide | |||
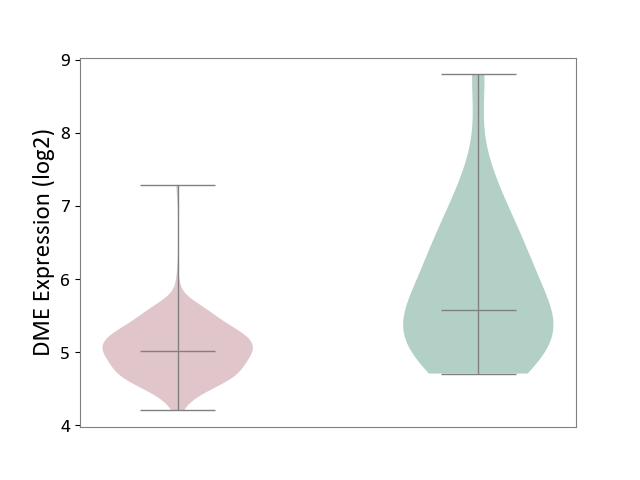
| The Studied Tissue | Whole blood | ||||
| The Specified Disease | Chronic hepatitis C [ICD-11:1E51.1] | ||||
| The Expression Level of Disease Section Compare with the Healthy Individual Tissue | p-value: 8.60E-02; Fold-change: 1.65E-01; Z-score: 8.28E-01 | ||||
|
DME expression in the diseased tissue of patients
DME expression in the normal tissue of healthy individuals
|
|||||
| Violin Diagram of DME Disease-specific Protein Abundances |
|
Click to View the Clearer Original Diagram | |||
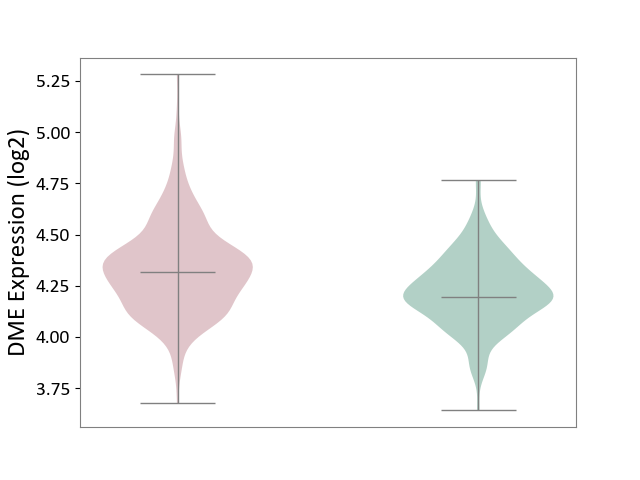
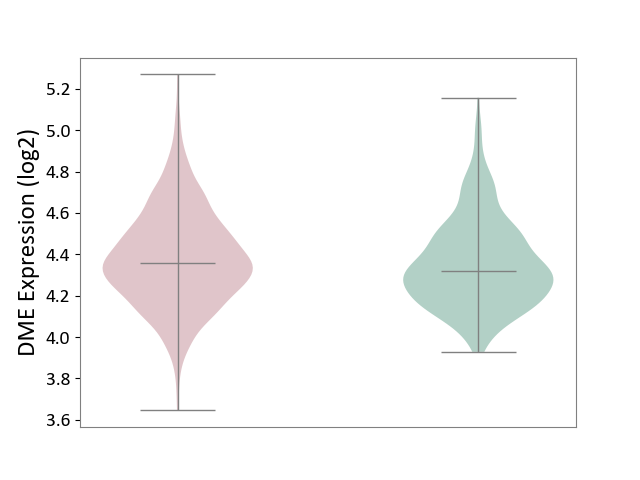
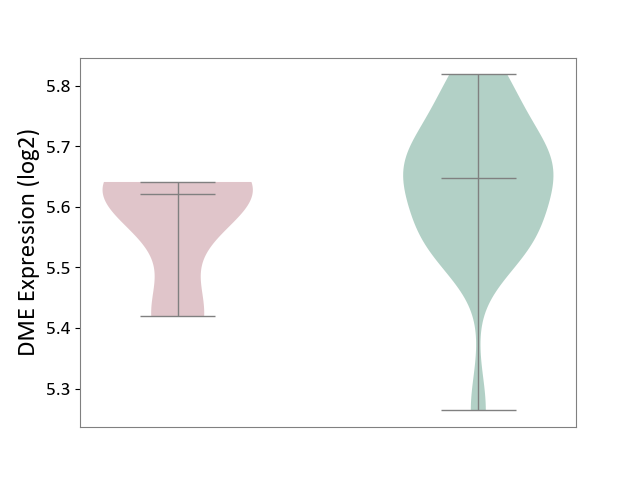
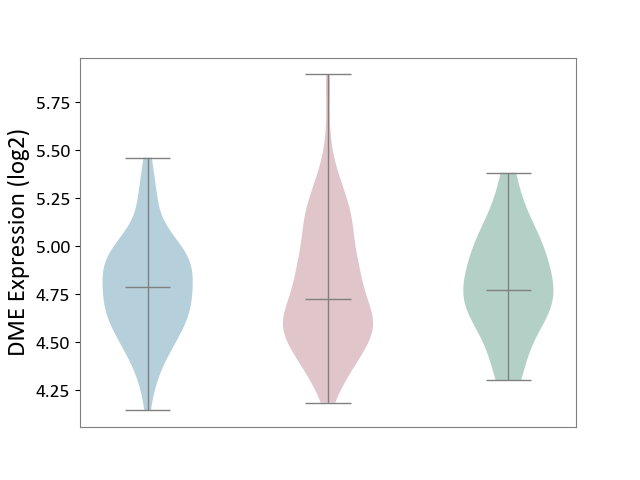
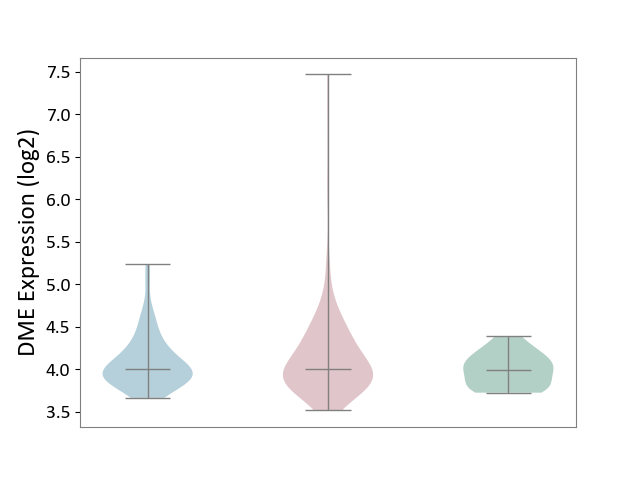
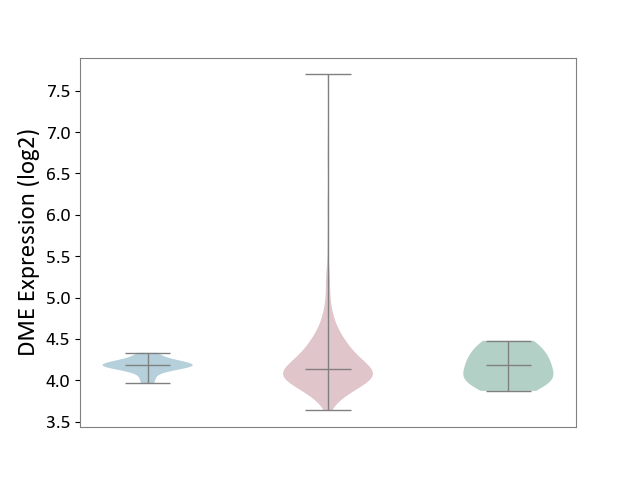
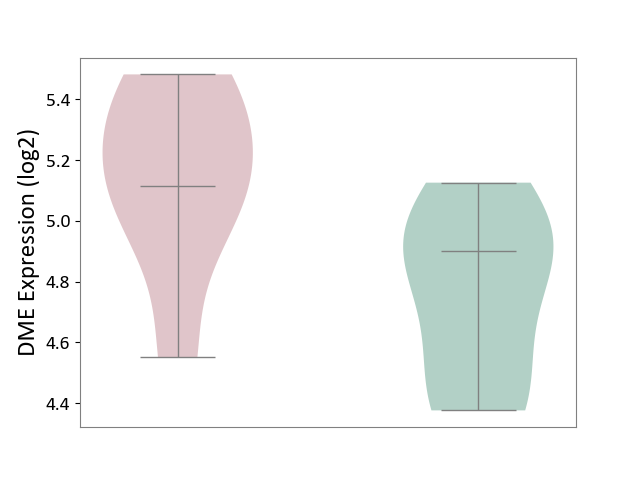
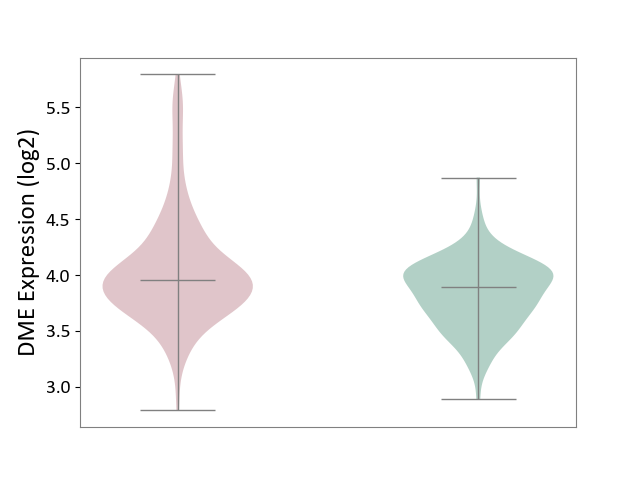
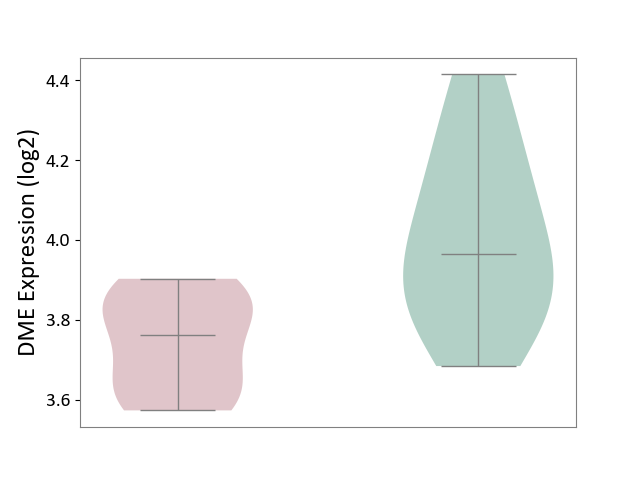
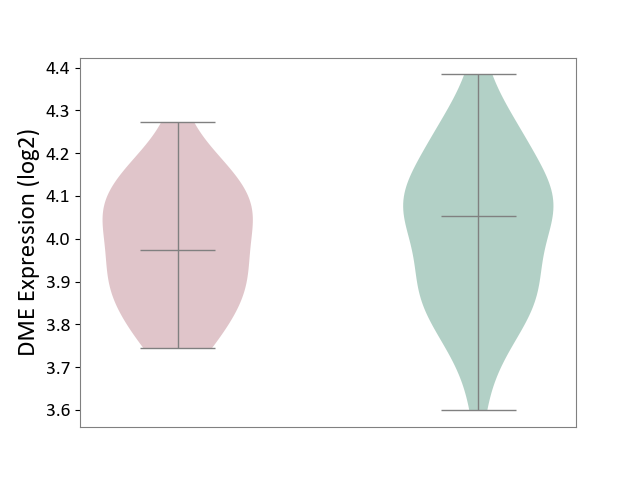
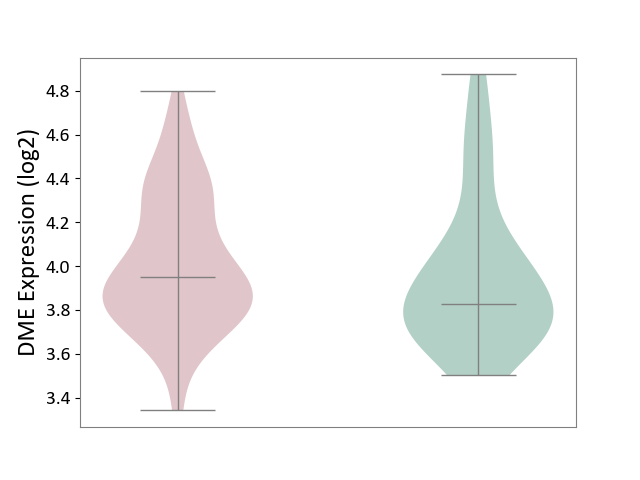
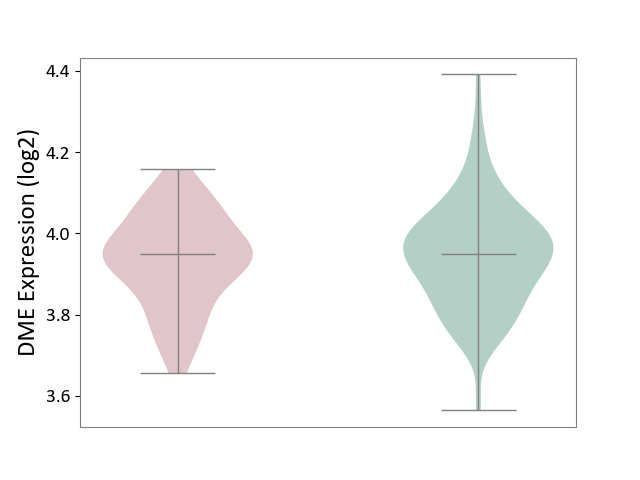
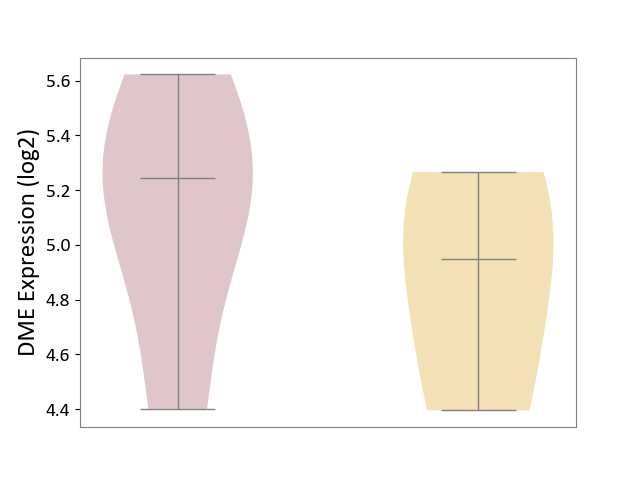
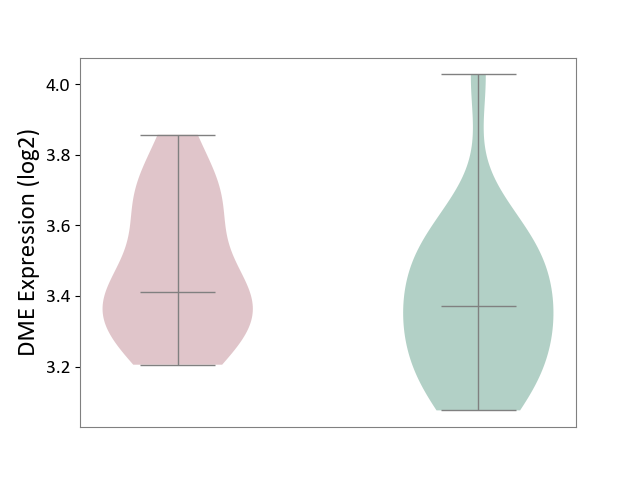
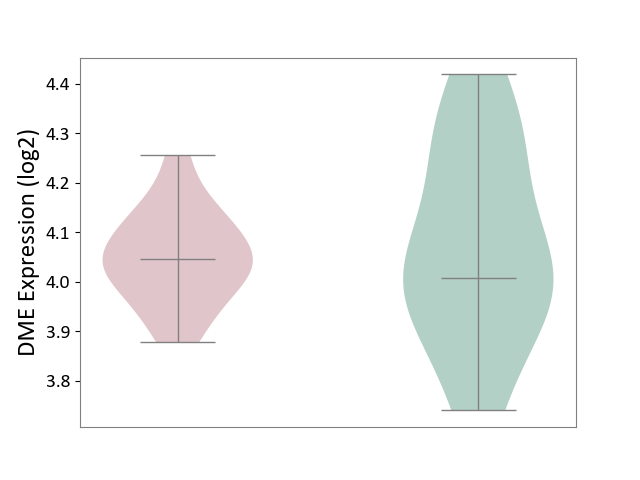
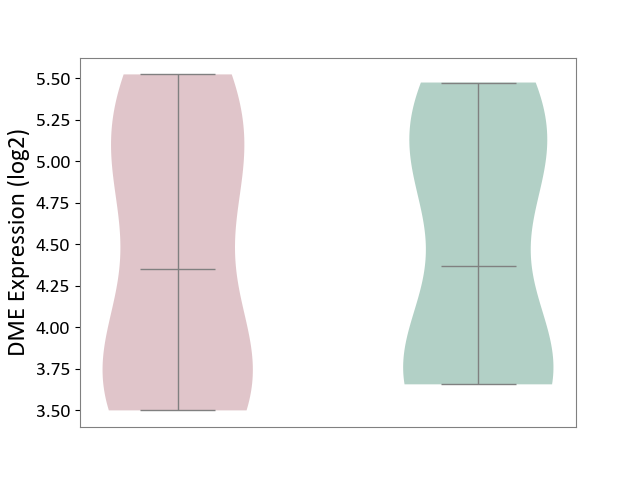
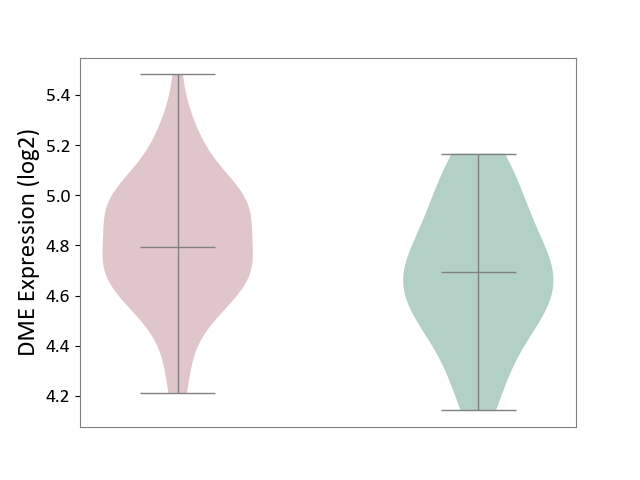
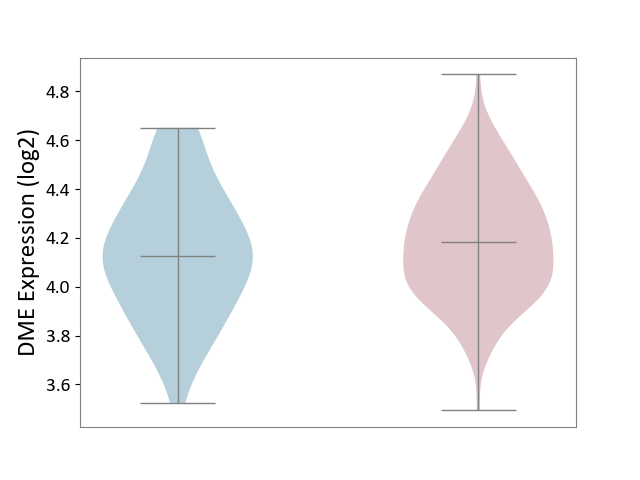
| ICD-11: 1G41 | Sepsis with septic shock | Click to Show/Hide | |||
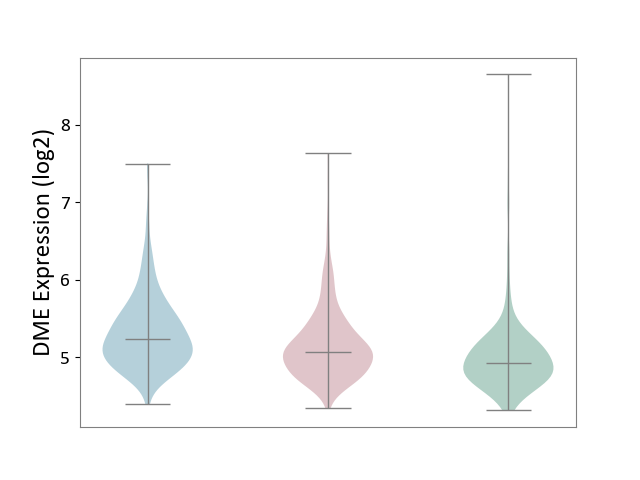
| The Studied Tissue | Whole blood | ||||
| The Specified Disease | Sepsis with septic shock [ICD-11:1G41] | ||||
| The Expression Level of Disease Section Compare with the Healthy Individual Tissue | p-value: 5.42E-11; Fold-change: 1.25E-01; Z-score: 7.17E-01 | ||||
|
DME expression in the diseased tissue of patients
DME expression in the normal tissue of healthy individuals
|
|||||
| Violin Diagram of DME Disease-specific Protein Abundances |
|
Click to View the Clearer Original Diagram | |||
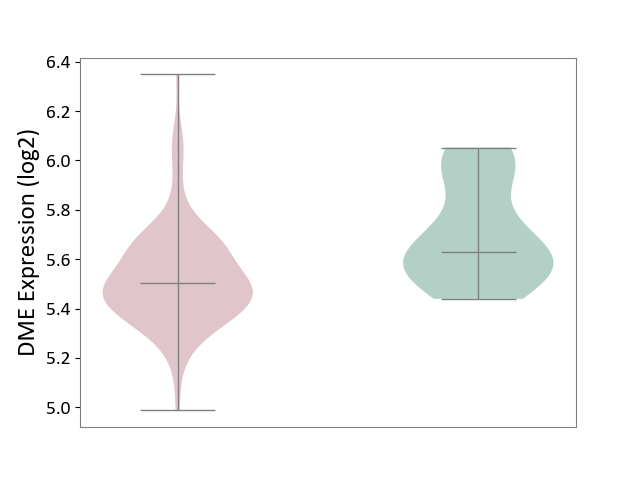
| ICD-11: CA40 | Respiratory syncytial virus infection | Click to Show/Hide | |||
| The Studied Tissue | Peripheral blood | ||||
| The Specified Disease | Pediatric respiratory syncytial virus infection [ICD-11:CA40.11] | ||||
| The Expression Level of Disease Section Compare with the Healthy Individual Tissue | p-value: 4.96E-03; Fold-change: -1.55E-01; Z-score: -1.47E+00 | ||||
|
DME expression in the diseased tissue of patients
DME expression in the normal tissue of healthy individuals
|
|||||
| Violin Diagram of DME Disease-specific Protein Abundances |
|
Click to View the Clearer Original Diagram | |||
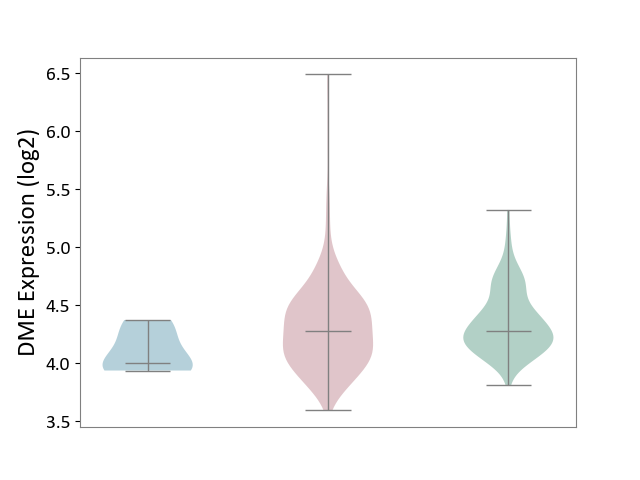
| ICD-11: CA42 | Rhinovirus infection | Click to Show/Hide | |||
| The Studied Tissue | Nasal epithelium tissue | ||||
| The Specified Disease | Rhinovirus infection [ICD-11:CA42.1] | ||||
| The Expression Level of Disease Section Compare with the Healthy Individual Tissue | p-value: 1.43E-01; Fold-change: 1.84E-02; Z-score: 5.34E-02 | ||||
|
DME expression in the diseased tissue of patients
DME expression in the normal tissue of healthy individuals
|
|||||
| Violin Diagram of DME Disease-specific Protein Abundances |
|
Click to View the Clearer Original Diagram | |||
| ICD-11: KA60 | Neonatal sepsis | Click to Show/Hide | |||
| The Studied Tissue | Whole blood | ||||
| The Specified Disease | Neonatal sepsis [ICD-11:KA60] | ||||
| The Expression Level of Disease Section Compare with the Healthy Individual Tissue | p-value: 8.52E-01; Fold-change: -9.47E-03; Z-score: -5.16E-02 | ||||
|
DME expression in the diseased tissue of patients
DME expression in the normal tissue of healthy individuals
|
|||||
| Violin Diagram of DME Disease-specific Protein Abundances |
|
Click to View the Clearer Original Diagram | |||
| ICD Disease Classification 02 | Neoplasm | Click to Show/Hide | |||
| ICD-11: 2A00 | Brain cancer | Click to Show/Hide | |||
| The Studied Tissue | Nervous tissue | ||||
| The Specified Disease | Glioblastopma [ICD-11:2A00.00] | ||||
| The Expression Level of Disease Section Compare with the Healthy Individual Tissue | p-value: 4.78E-02; Fold-change: 4.13E-02; Z-score: 1.93E-01 | ||||
|
DME expression in the diseased tissue of patients
DME expression in the normal tissue of healthy individuals
|
|||||
| Violin Diagram of DME Disease-specific Protein Abundances |
|
Click to View the Clearer Original Diagram | |||
| The Studied Tissue | Brain stem tissue | ||||
| The Specified Disease | Glioma [ICD-11:2A00.0Y-2A00.0Z] | ||||
| The Expression Level of Disease Section Compare with the Healthy Individual Tissue | p-value: 6.41E-01; Fold-change: -4.80E-02; Z-score: -3.07E-01 | ||||
|
DME expression in the diseased tissue of patients
DME expression in the normal tissue of healthy individuals
|
|||||
| Violin Diagram of DME Disease-specific Protein Abundances |
|
Click to View the Clearer Original Diagram | |||
| The Studied Tissue | White matter tissue | ||||
| The Specified Disease | Glioma [ICD-11:2A00.0Y-2A00.0Z] | ||||
| The Expression Level of Disease Section Compare with the Healthy Individual Tissue | p-value: 5.69E-05; Fold-change: -5.35E-01; Z-score: -2.88E+00 | ||||
|
DME expression in the diseased tissue of patients
DME expression in the normal tissue of healthy individuals
|
|||||
| Violin Diagram of DME Disease-specific Protein Abundances |
|
Click to View the Clearer Original Diagram | |||
| The Studied Tissue | Brain stem tissue | ||||
| The Specified Disease | Neuroectodermal tumour [ICD-11:2A00.11] | ||||
| The Expression Level of Disease Section Compare with the Healthy Individual Tissue | p-value: 7.27E-03; Fold-change: -3.02E-01; Z-score: -1.04E+00 | ||||
|
DME expression in the diseased tissue of patients
DME expression in the normal tissue of healthy individuals
|
|||||
| Violin Diagram of DME Disease-specific Protein Abundances |
|
Click to View the Clearer Original Diagram | |||
| ICD-11: 2A20 | Myeloproliferative neoplasm | Click to Show/Hide | |||
| The Studied Tissue | Whole blood | ||||
| The Specified Disease | Myelofibrosis [ICD-11:2A20.2] | ||||
| The Expression Level of Disease Section Compare with the Healthy Individual Tissue | p-value: 1.66E-01; Fold-change: -2.64E-02; Z-score: -2.16E-01 | ||||
|
DME expression in the diseased tissue of patients
DME expression in the normal tissue of healthy individuals
|
|||||
| Violin Diagram of DME Disease-specific Protein Abundances |
|
Click to View the Clearer Original Diagram | |||
| The Studied Tissue | Whole blood | ||||
| The Specified Disease | Polycythemia vera [ICD-11:2A20.4] | ||||
| The Expression Level of Disease Section Compare with the Healthy Individual Tissue | p-value: 5.18E-01; Fold-change: -3.02E-02; Z-score: -2.12E-01 | ||||
|
DME expression in the diseased tissue of patients
DME expression in the normal tissue of healthy individuals
|
|||||
| Violin Diagram of DME Disease-specific Protein Abundances |
|
Click to View the Clearer Original Diagram | |||
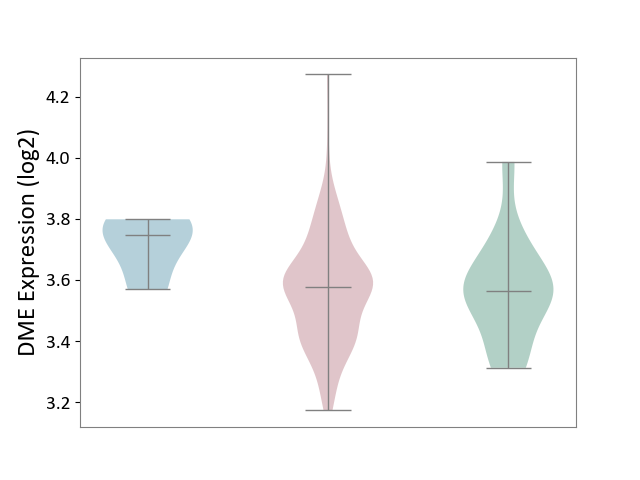
| ICD-11: 2A36 | Myelodysplastic syndrome | Click to Show/Hide | |||
| The Studied Tissue | Bone marrow | ||||
| The Specified Disease | Myelodysplastic syndrome [ICD-11:2A36-2A3Z] | ||||
| The Expression Level of Disease Section Compare with the Healthy Individual Tissue | p-value: 9.02E-01; Fold-change: 1.35E-02; Z-score: 7.95E-02 | ||||
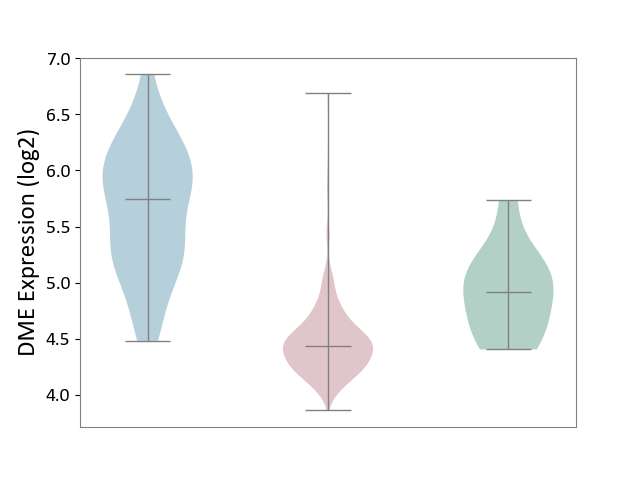
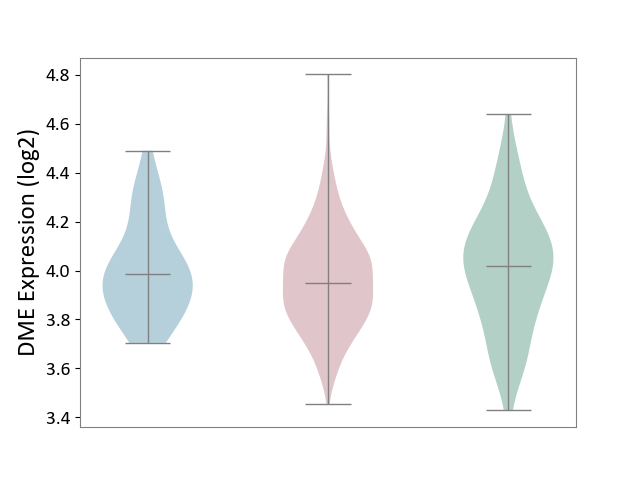
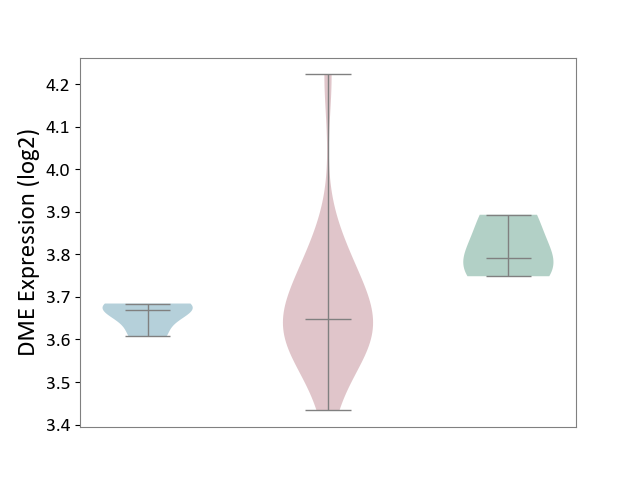
| The Expression Level of Disease Section Compare with the Adjacent Tissue | p-value: 5.95E-02; Fold-change: -1.70E-01; Z-score: -1.64E+00 | ||||
|
DME expression in the diseased tissue of patients
DME expression in the normal tissue adjacent to the diseased tissue of patients
DME expression in the normal tissue of healthy individuals
|
|||||
| Violin Diagram of DME Disease-specific Protein Abundances |
|
Click to View the Clearer Original Diagram | |||
| ICD-11: 2A81 | Diffuse large B-cell lymphoma | Click to Show/Hide | |||
| The Studied Tissue | Tonsil tissue | ||||
| The Specified Disease | Diffuse large B-cell lymphoma [ICD-11:2A81] | ||||
| The Expression Level of Disease Section Compare with the Healthy Individual Tissue | p-value: 8.81E-01; Fold-change: -4.25E-02; Z-score: -1.66E-01 | ||||
|
DME expression in the diseased tissue of patients
DME expression in the normal tissue of healthy individuals
|
|||||
| Violin Diagram of DME Disease-specific Protein Abundances |
|
Click to View the Clearer Original Diagram | |||
| ICD-11: 2A83 | Plasma cell neoplasm | Click to Show/Hide | |||
| The Studied Tissue | Peripheral blood | ||||
| The Specified Disease | Multiple myeloma [ICD-11:2A83.1] | ||||
| The Expression Level of Disease Section Compare with the Healthy Individual Tissue | p-value: 1.01E-01; Fold-change: 5.77E-02; Z-score: 8.39E-01 | ||||
|
DME expression in the diseased tissue of patients
DME expression in the normal tissue of healthy individuals
|
|||||
| Violin Diagram of DME Disease-specific Protein Abundances |
|
Click to View the Clearer Original Diagram | |||
| The Studied Tissue | Bone marrow | ||||
| The Specified Disease | Multiple myeloma [ICD-11:2A83.1] | ||||
| The Expression Level of Disease Section Compare with the Healthy Individual Tissue | p-value: 2.88E-03; Fold-change: -6.19E-01; Z-score: -1.74E+00 | ||||
|
DME expression in the diseased tissue of patients
DME expression in the normal tissue of healthy individuals
|
|||||
| Violin Diagram of DME Disease-specific Protein Abundances |
|
Click to View the Clearer Original Diagram | |||
| ICD-11: 2B33 | Leukaemia | Click to Show/Hide | |||
| The Studied Tissue | Bone marrow | ||||
| The Specified Disease | Acute myelocytic leukaemia [ICD-11:2B33.1] | ||||
| The Expression Level of Disease Section Compare with the Healthy Individual Tissue | p-value: 7.30E-02; Fold-change: -1.59E-02; Z-score: -1.23E-01 | ||||
|
DME expression in the diseased tissue of patients
DME expression in the normal tissue of healthy individuals
|
|||||
| Violin Diagram of DME Disease-specific Protein Abundances |
|
Click to View the Clearer Original Diagram | |||
| ICD-11: 2B6E | Oral cancer | Click to Show/Hide | |||
| The Studied Tissue | Oral tissue | ||||
| The Specified Disease | Oral cancer [ICD-11:2B6E] | ||||
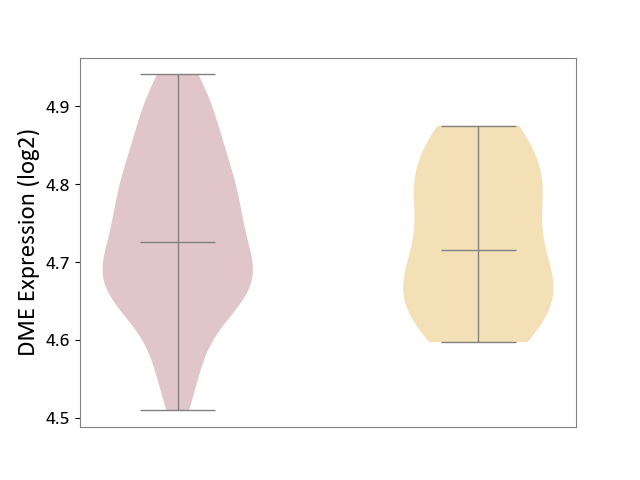
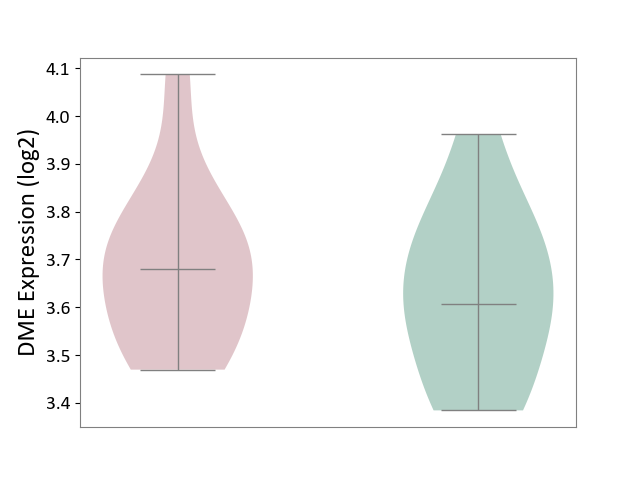
| The Expression Level of Disease Section Compare with the Healthy Individual Tissue | p-value: 8.41E-01; Fold-change: -4.49E-02; Z-score: -1.67E-01 | ||||
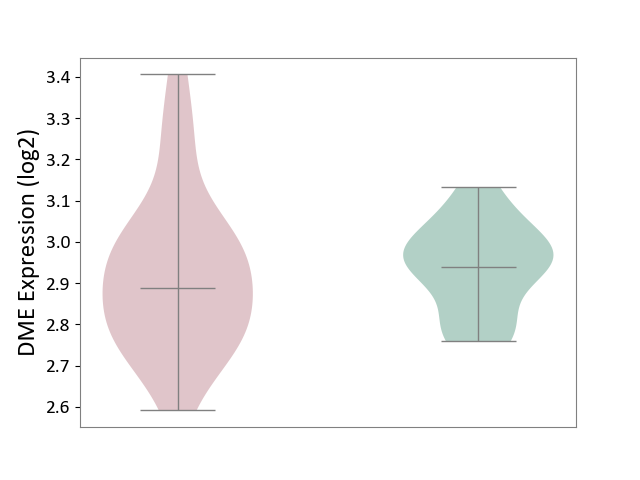
| The Expression Level of Disease Section Compare with the Adjacent Tissue | p-value: 8.56E-01; Fold-change: -6.42E-02; Z-score: -2.45E-01 | ||||
|
DME expression in the diseased tissue of patients
DME expression in the normal tissue adjacent to the diseased tissue of patients
DME expression in the normal tissue of healthy individuals
|
|||||
| Violin Diagram of DME Disease-specific Protein Abundances |
|
Click to View the Clearer Original Diagram | |||
| ICD-11: 2B70 | Esophageal cancer | Click to Show/Hide | |||
| The Studied Tissue | Esophagus | ||||
| The Specified Disease | Esophagal cancer [ICD-11:2B70] | ||||
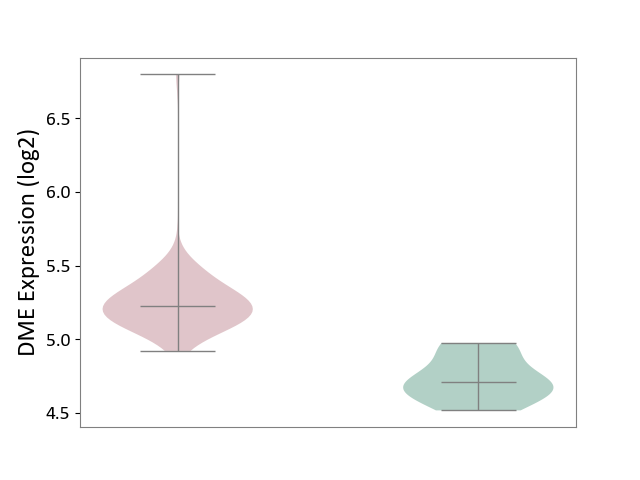
| The Expression Level of Disease Section Compare with the Adjacent Tissue | p-value: 1.68E-03; Fold-change: -3.01E-03; Z-score: -2.83E-02 | ||||
|
DME expression in the diseased tissue of patients
DME expression in the normal tissue adjacent to the diseased tissue of patients
|
|||||
| Violin Diagram of DME Disease-specific Protein Abundances |
|
Click to View the Clearer Original Diagram | |||
| ICD-11: 2B72 | Stomach cancer | Click to Show/Hide | |||
| The Studied Tissue | Gastric tissue | ||||
| The Specified Disease | Gastric cancer [ICD-11:2B72] | ||||
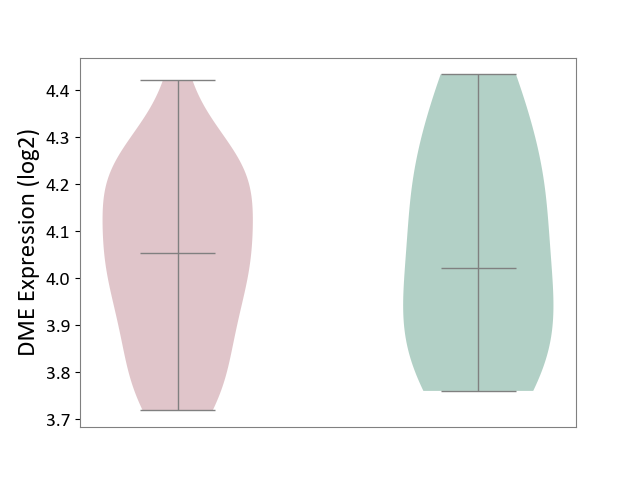
| The Expression Level of Disease Section Compare with the Healthy Individual Tissue | p-value: 1.70E-02; Fold-change: 5.52E-02; Z-score: 5.02E-01 | ||||
| The Expression Level of Disease Section Compare with the Adjacent Tissue | p-value: 6.11E-09; Fold-change: 3.73E-01; Z-score: 1.55E+00 | ||||
|
DME expression in the diseased tissue of patients
DME expression in the normal tissue adjacent to the diseased tissue of patients
DME expression in the normal tissue of healthy individuals
|
|||||
| Violin Diagram of DME Disease-specific Protein Abundances |
|
Click to View the Clearer Original Diagram | |||
| ICD-11: 2B90 | Colon cancer | Click to Show/Hide | |||
| The Studied Tissue | Colon tissue | ||||
| The Specified Disease | Colon cancer [ICD-11:2B90] | ||||
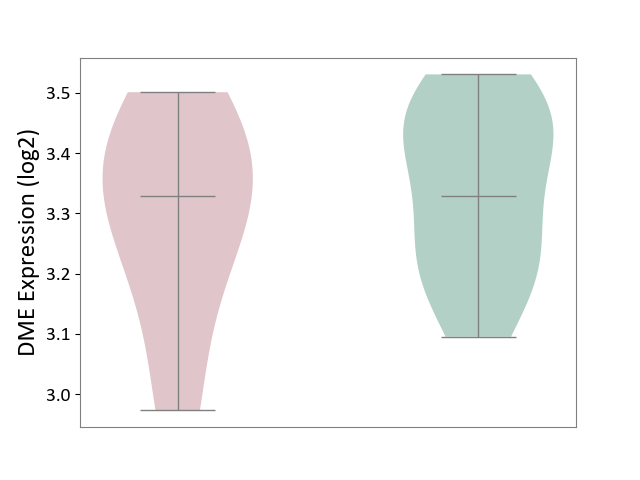
| The Expression Level of Disease Section Compare with the Healthy Individual Tissue | p-value: 7.11E-02; Fold-change: 1.77E-01; Z-score: 2.56E-01 | ||||
| The Expression Level of Disease Section Compare with the Adjacent Tissue | p-value: 1.86E-12; Fold-change: 4.36E-01; Z-score: 8.09E-01 | ||||
|
DME expression in the diseased tissue of patients
DME expression in the normal tissue adjacent to the diseased tissue of patients
DME expression in the normal tissue of healthy individuals
|
|||||
| Violin Diagram of DME Disease-specific Protein Abundances |
|
Click to View the Clearer Original Diagram | |||
| ICD-11: 2B92 | Rectal cancer | Click to Show/Hide | |||
| The Studied Tissue | Rectal colon tissue | ||||
| The Specified Disease | Rectal cancer [ICD-11:2B92] | ||||
| The Expression Level of Disease Section Compare with the Healthy Individual Tissue | p-value: 2.22E-02; Fold-change: 5.21E-01; Z-score: 1.32E+00 | ||||
| The Expression Level of Disease Section Compare with the Adjacent Tissue | p-value: 2.85E-05; Fold-change: 9.00E-01; Z-score: 3.50E+00 | ||||
|
DME expression in the diseased tissue of patients
DME expression in the normal tissue adjacent to the diseased tissue of patients
DME expression in the normal tissue of healthy individuals
|
|||||
| Violin Diagram of DME Disease-specific Protein Abundances |
|
Click to View the Clearer Original Diagram | |||
| ICD-11: 2C10 | Pancreatic cancer | Click to Show/Hide | |||
| The Studied Tissue | Pancreas | ||||
| The Specified Disease | Pancreatic cancer [ICD-11:2C10] | ||||
| The Expression Level of Disease Section Compare with the Healthy Individual Tissue | p-value: 1.10E-02; Fold-change: 1.91E-02; Z-score: 9.50E-02 | ||||
| The Expression Level of Disease Section Compare with the Adjacent Tissue | p-value: 1.73E-01; Fold-change: 5.76E-03; Z-score: 1.80E-02 | ||||
|
DME expression in the diseased tissue of patients
DME expression in the normal tissue adjacent to the diseased tissue of patients
DME expression in the normal tissue of healthy individuals
|
|||||
| Violin Diagram of DME Disease-specific Protein Abundances |
|
Click to View the Clearer Original Diagram | |||
| ICD-11: 2C12 | Liver cancer | Click to Show/Hide | |||
| The Studied Tissue | Liver tissue | ||||
| The Specified Disease | Liver cancer [ICD-11:2C12.0] | ||||
| The Expression Level of Disease Section Compare with the Healthy Individual Tissue | p-value: 2.38E-13; Fold-change: -2.40E+00; Z-score: -1.69E+00 | ||||
| The Expression Level of Disease Section Compare with the Adjacent Tissue | p-value: 1.84E-93; Fold-change: -2.32E+00; Z-score: -3.11E+00 | ||||
| The Expression Level of Disease Section Compare with the Other Disease Section | p-value: 6.93E-04; Fold-change: -2.41E+00; Z-score: -5.50E+00 | ||||
|
DME expression in the diseased tissue of patients
DME expression in the normal tissue adjacent to the diseased tissue of patients
DME expression in the normal tissue of healthy individuals
DME expression in tissue other than the diseased tissue of patients
|
|||||
| Violin Diagram of DME Disease-specific Protein Abundances |
|
Click to View the Clearer Original Diagram | |||
| ICD-11: 2C25 | Lung cancer | Click to Show/Hide | |||
| The Studied Tissue | Lung tissue | ||||
| The Specified Disease | Lung cancer [ICD-11:2C25] | ||||
| The Expression Level of Disease Section Compare with the Healthy Individual Tissue | p-value: 2.81E-03; Fold-change: -9.34E-02; Z-score: -3.57E-01 | ||||
| The Expression Level of Disease Section Compare with the Adjacent Tissue | p-value: 5.06E-03; Fold-change: -1.60E-01; Z-score: -4.62E-01 | ||||
|
DME expression in the diseased tissue of patients
DME expression in the normal tissue adjacent to the diseased tissue of patients
DME expression in the normal tissue of healthy individuals
|
|||||
| Violin Diagram of DME Disease-specific Protein Abundances |
|
Click to View the Clearer Original Diagram | |||
| ICD-11: 2C30 | Skin cancer | Click to Show/Hide | |||
| The Studied Tissue | Skin | ||||
| The Specified Disease | Melanoma [ICD-11:2C30] | ||||
| The Expression Level of Disease Section Compare with the Healthy Individual Tissue | p-value: 5.29E-04; Fold-change: -5.51E-01; Z-score: -5.60E-01 | ||||
|
DME expression in the diseased tissue of patients
DME expression in the normal tissue of healthy individuals
|
|||||
| Violin Diagram of DME Disease-specific Protein Abundances |
|
Click to View the Clearer Original Diagram | |||
| The Studied Tissue | Skin | ||||
| The Specified Disease | Skin cancer [ICD-11:2C30-2C3Z] | ||||
| The Expression Level of Disease Section Compare with the Healthy Individual Tissue | p-value: 8.25E-05; Fold-change: 1.47E-01; Z-score: 3.09E-01 | ||||
| The Expression Level of Disease Section Compare with the Adjacent Tissue | p-value: 3.90E-04; Fold-change: -1.61E-01; Z-score: -3.51E-01 | ||||
|
DME expression in the diseased tissue of patients
DME expression in the normal tissue adjacent to the diseased tissue of patients
DME expression in the normal tissue of healthy individuals
|
|||||
| Violin Diagram of DME Disease-specific Protein Abundances |
|
Click to View the Clearer Original Diagram | |||
| ICD-11: 2C6Z | Breast cancer | Click to Show/Hide | |||
| The Studied Tissue | Breast tissue | ||||
| The Specified Disease | Breast cancer [ICD-11:2C60-2C6Z] | ||||
| The Expression Level of Disease Section Compare with the Healthy Individual Tissue | p-value: 5.71E-03; Fold-change: 5.36E-02; Z-score: 1.63E-01 | ||||
| The Expression Level of Disease Section Compare with the Adjacent Tissue | p-value: 1.30E-02; Fold-change: 2.23E-02; Z-score: 1.20E-01 | ||||
|
DME expression in the diseased tissue of patients
DME expression in the normal tissue adjacent to the diseased tissue of patients
DME expression in the normal tissue of healthy individuals
|
|||||
| Violin Diagram of DME Disease-specific Protein Abundances |
|
Click to View the Clearer Original Diagram | |||
| ICD-11: 2C73 | Ovarian cancer | Click to Show/Hide | |||
| The Studied Tissue | Ovarian tissue | ||||
| The Specified Disease | Ovarian cancer [ICD-11:2C73] | ||||
| The Expression Level of Disease Section Compare with the Healthy Individual Tissue | p-value: 3.79E-01; Fold-change: -3.97E-02; Z-score: -1.93E-01 | ||||
| The Expression Level of Disease Section Compare with the Adjacent Tissue | p-value: 4.80E-02; Fold-change: -3.92E-02; Z-score: -4.37E-01 | ||||
|
DME expression in the diseased tissue of patients
DME expression in the normal tissue adjacent to the diseased tissue of patients
DME expression in the normal tissue of healthy individuals
|
|||||
| Violin Diagram of DME Disease-specific Protein Abundances |
|
Click to View the Clearer Original Diagram | |||
| ICD-11: 2C77 | Cervical cancer | Click to Show/Hide | |||
| The Studied Tissue | Cervical tissue | ||||
| The Specified Disease | Cervical cancer [ICD-11:2C77] | ||||
| The Expression Level of Disease Section Compare with the Healthy Individual Tissue | p-value: 2.02E-03; Fold-change: -1.26E-01; Z-score: -6.18E-01 | ||||
|
DME expression in the diseased tissue of patients
DME expression in the normal tissue of healthy individuals
|
|||||
| Violin Diagram of DME Disease-specific Protein Abundances |
|
Click to View the Clearer Original Diagram | |||
| ICD-11: 2C78 | Uterine cancer | Click to Show/Hide | |||
| The Studied Tissue | Endometrium tissue | ||||
| The Specified Disease | Uterine cancer [ICD-11:2C78] | ||||
| The Expression Level of Disease Section Compare with the Healthy Individual Tissue | p-value: 2.28E-01; Fold-change: 2.15E-03; Z-score: 7.85E-03 | ||||
| The Expression Level of Disease Section Compare with the Adjacent Tissue | p-value: 6.16E-02; Fold-change: 2.74E-01; Z-score: 1.42E+00 | ||||
|
DME expression in the diseased tissue of patients
DME expression in the normal tissue adjacent to the diseased tissue of patients
DME expression in the normal tissue of healthy individuals
|
|||||
| Violin Diagram of DME Disease-specific Protein Abundances |
|
Click to View the Clearer Original Diagram | |||
| ICD-11: 2C82 | Prostate cancer | Click to Show/Hide | |||
| The Studied Tissue | Prostate | ||||
| The Specified Disease | Prostate cancer [ICD-11:2C82] | ||||
| The Expression Level of Disease Section Compare with the Healthy Individual Tissue | p-value: 1.97E-02; Fold-change: 1.25E-01; Z-score: 3.51E-01 | ||||
|
DME expression in the diseased tissue of patients
DME expression in the normal tissue of healthy individuals
|
|||||
| Violin Diagram of DME Disease-specific Protein Abundances |
|
Click to View the Clearer Original Diagram | |||
| ICD-11: 2C90 | Renal cancer | Click to Show/Hide | |||
| The Studied Tissue | Kidney | ||||
| The Specified Disease | Renal cancer [ICD-11:2C90-2C91] | ||||
| The Expression Level of Disease Section Compare with the Healthy Individual Tissue | p-value: 3.82E-03; Fold-change: -4.83E-01; Z-score: -1.24E+00 | ||||
| The Expression Level of Disease Section Compare with the Adjacent Tissue | p-value: 1.82E-27; Fold-change: -1.31E+00; Z-score: -2.29E+00 | ||||
|
DME expression in the diseased tissue of patients
DME expression in the normal tissue adjacent to the diseased tissue of patients
DME expression in the normal tissue of healthy individuals
|
|||||
| Violin Diagram of DME Disease-specific Protein Abundances |
|
Click to View the Clearer Original Diagram | |||
| ICD-11: 2C92 | Ureter cancer | Click to Show/Hide | |||
| The Studied Tissue | Urothelium | ||||
| The Specified Disease | Ureter cancer [ICD-11:2C92] | ||||
| The Expression Level of Disease Section Compare with the Healthy Individual Tissue | p-value: 7.19E-01; Fold-change: -5.25E-02; Z-score: -4.77E-01 | ||||
|
DME expression in the diseased tissue of patients
DME expression in the normal tissue of healthy individuals
|
|||||
| Violin Diagram of DME Disease-specific Protein Abundances |
|
Click to View the Clearer Original Diagram | |||
| ICD-11: 2C94 | Bladder cancer | Click to Show/Hide | |||
| The Studied Tissue | Bladder tissue | ||||
| The Specified Disease | Bladder cancer [ICD-11:2C94] | ||||
| The Expression Level of Disease Section Compare with the Healthy Individual Tissue | p-value: 6.20E-05; Fold-change: 5.17E-01; Z-score: 3.18E+00 | ||||
|
DME expression in the diseased tissue of patients
DME expression in the normal tissue of healthy individuals
|
|||||
| Violin Diagram of DME Disease-specific Protein Abundances |
|
Click to View the Clearer Original Diagram | |||
| ICD-11: 2D02 | Retinal cancer | Click to Show/Hide | |||
| The Studied Tissue | Uvea | ||||
| The Specified Disease | Retinoblastoma [ICD-11:2D02.2] | ||||
| The Expression Level of Disease Section Compare with the Healthy Individual Tissue | p-value: 2.84E-01; Fold-change: 4.60E-02; Z-score: 4.01E-01 | ||||
|
DME expression in the diseased tissue of patients
DME expression in the normal tissue of healthy individuals
|
|||||
| Violin Diagram of DME Disease-specific Protein Abundances |
|
Click to View the Clearer Original Diagram | |||
| ICD-11: 2D10 | Thyroid cancer | Click to Show/Hide | |||
| The Studied Tissue | Thyroid | ||||
| The Specified Disease | Thyroid cancer [ICD-11:2D10] | ||||
| The Expression Level of Disease Section Compare with the Healthy Individual Tissue | p-value: 1.25E-01; Fold-change: -7.02E-02; Z-score: -2.81E-01 | ||||
| The Expression Level of Disease Section Compare with the Adjacent Tissue | p-value: 2.50E-01; Fold-change: -3.52E-02; Z-score: -1.80E-01 | ||||
|
DME expression in the diseased tissue of patients
DME expression in the normal tissue adjacent to the diseased tissue of patients
DME expression in the normal tissue of healthy individuals
|
|||||
| Violin Diagram of DME Disease-specific Protein Abundances |
|
Click to View the Clearer Original Diagram | |||
| ICD-11: 2D11 | Adrenal cancer | Click to Show/Hide | |||
| The Studied Tissue | Adrenal cortex | ||||
| The Specified Disease | Adrenocortical carcinoma [ICD-11:2D11.Z] | ||||
| The Expression Level of Disease Section Compare with the Other Disease Section | p-value: 7.30E-01; Fold-change: 1.07E-02; Z-score: 1.16E-01 | ||||
|
DME expression in the diseased tissue of patients
DME expression in tissue other than the diseased tissue of patients
|
|||||
| Violin Diagram of DME Disease-specific Protein Abundances |
|
Click to View the Clearer Original Diagram | |||
| ICD-11: 2D12 | Endocrine gland neoplasm | Click to Show/Hide | |||
| The Studied Tissue | Pituitary tissue | ||||
| The Specified Disease | Pituitary cancer [ICD-11:2D12] | ||||
| The Expression Level of Disease Section Compare with the Healthy Individual Tissue | p-value: 7.65E-01; Fold-change: 3.20E-02; Z-score: 1.39E-01 | ||||
|
DME expression in the diseased tissue of patients
DME expression in the normal tissue of healthy individuals
|
|||||
| Violin Diagram of DME Disease-specific Protein Abundances |
|
Click to View the Clearer Original Diagram | |||
| The Studied Tissue | Pituitary tissue | ||||
| The Specified Disease | Pituitary gonadotrope tumour [ICD-11:2D12] | ||||
| The Expression Level of Disease Section Compare with the Healthy Individual Tissue | p-value: 8.71E-01; Fold-change: 7.12E-03; Z-score: 3.68E-02 | ||||
|
DME expression in the diseased tissue of patients
DME expression in the normal tissue of healthy individuals
|
|||||
| Violin Diagram of DME Disease-specific Protein Abundances |
|
Click to View the Clearer Original Diagram | |||
| ICD-11: 2D42 | Head and neck cancer | Click to Show/Hide | |||
| The Studied Tissue | Head and neck tissue | ||||
| The Specified Disease | Head and neck cancer [ICD-11:2D42] | ||||
| The Expression Level of Disease Section Compare with the Healthy Individual Tissue | p-value: 7.41E-12; Fold-change: -2.61E-01; Z-score: -3.81E-01 | ||||
|
DME expression in the diseased tissue of patients
DME expression in the normal tissue of healthy individuals
|
|||||
| Violin Diagram of DME Disease-specific Protein Abundances |
|
Click to View the Clearer Original Diagram | |||
| ICD Disease Classification 03 | Blood/blood-forming organ disease | Click to Show/Hide | |||
| ICD-11: 3A51 | Sickle cell disorder | Click to Show/Hide | |||
| The Studied Tissue | Peripheral blood | ||||
| The Specified Disease | Sickle cell disease [ICD-11:3A51.0-3A51.3] | ||||
| The Expression Level of Disease Section Compare with the Healthy Individual Tissue | p-value: 1.52E-05; Fold-change: 1.99E-01; Z-score: 3.17E+00 | ||||
|
DME expression in the diseased tissue of patients
DME expression in the normal tissue of healthy individuals
|
|||||
| Violin Diagram of DME Disease-specific Protein Abundances |
|
Click to View the Clearer Original Diagram | |||
| ICD-11: 3A70 | Aplastic anaemia | Click to Show/Hide | |||
| The Studied Tissue | Bone marrow | ||||
| The Specified Disease | Shwachman-Diamond syndrome [ICD-11:3A70.0] | ||||
| The Expression Level of Disease Section Compare with the Healthy Individual Tissue | p-value: 3.47E-02; Fold-change: 2.12E-01; Z-score: 7.38E-01 | ||||
|
DME expression in the diseased tissue of patients
DME expression in the normal tissue of healthy individuals
|
|||||
| Violin Diagram of DME Disease-specific Protein Abundances |
|
Click to View the Clearer Original Diagram | |||
| ICD-11: 3B63 | Thrombocytosis | Click to Show/Hide | |||
| The Studied Tissue | Whole blood | ||||
| The Specified Disease | Thrombocythemia [ICD-11:3B63] | ||||
| The Expression Level of Disease Section Compare with the Healthy Individual Tissue | p-value: 3.39E-01; Fold-change: -1.22E-02; Z-score: -9.58E-02 | ||||
|
DME expression in the diseased tissue of patients
DME expression in the normal tissue of healthy individuals
|
|||||
| Violin Diagram of DME Disease-specific Protein Abundances |
|
Click to View the Clearer Original Diagram | |||
| ICD-11: 3B64 | Thrombocytopenia | Click to Show/Hide | |||
| The Studied Tissue | Whole blood | ||||
| The Specified Disease | Thrombocytopenia [ICD-11:3B64] | ||||
| The Expression Level of Disease Section Compare with the Healthy Individual Tissue | p-value: 2.11E-01; Fold-change: -7.34E-02; Z-score: -3.14E-01 | ||||
|
DME expression in the diseased tissue of patients
DME expression in the normal tissue of healthy individuals
|
|||||
| Violin Diagram of DME Disease-specific Protein Abundances |
|
Click to View the Clearer Original Diagram | |||
| ICD Disease Classification 04 | Immune system disease | Click to Show/Hide | |||
| ICD-11: 4A00 | Immunodeficiency | Click to Show/Hide | |||
| The Studied Tissue | Peripheral blood | ||||
| The Specified Disease | Immunodeficiency [ICD-11:4A00-4A20] | ||||
| The Expression Level of Disease Section Compare with the Healthy Individual Tissue | p-value: 5.27E-01; Fold-change: 3.96E-02; Z-score: 3.97E-01 | ||||
|
DME expression in the diseased tissue of patients
DME expression in the normal tissue of healthy individuals
|
|||||
| Violin Diagram of DME Disease-specific Protein Abundances |
|
Click to View the Clearer Original Diagram | |||
| ICD-11: 4A40 | Lupus erythematosus | Click to Show/Hide | |||
| The Studied Tissue | Whole blood | ||||
| The Specified Disease | Lupus erythematosus [ICD-11:4A40] | ||||
| The Expression Level of Disease Section Compare with the Healthy Individual Tissue | p-value: 2.36E-06; Fold-change: 6.59E-02; Z-score: 2.11E-01 | ||||
|
DME expression in the diseased tissue of patients
DME expression in the normal tissue of healthy individuals
|
|||||
| Violin Diagram of DME Disease-specific Protein Abundances |
|
Click to View the Clearer Original Diagram | |||
| ICD-11: 4A42 | Systemic sclerosis | Click to Show/Hide | |||
| The Studied Tissue | Whole blood | ||||
| The Specified Disease | Scleroderma [ICD-11:4A42.Z] | ||||
| The Expression Level of Disease Section Compare with the Healthy Individual Tissue | p-value: 4.10E-07; Fold-change: 3.21E-01; Z-score: 3.95E+00 | ||||
|
DME expression in the diseased tissue of patients
DME expression in the normal tissue of healthy individuals
|
|||||
| Violin Diagram of DME Disease-specific Protein Abundances |
|
Click to View the Clearer Original Diagram | |||
| ICD-11: 4A43 | Systemic autoimmune disease | Click to Show/Hide | |||
| The Studied Tissue | Salivary gland tissue | ||||
| The Specified Disease | Sjogren's syndrome [ICD-11:4A43.2] | ||||
| The Expression Level of Disease Section Compare with the Healthy Individual Tissue | p-value: 6.09E-02; Fold-change: -1.44E-01; Z-score: -1.93E+00 | ||||
| The Expression Level of Disease Section Compare with the Adjacent Tissue | p-value: 6.23E-01; Fold-change: -2.34E-02; Z-score: -6.58E-01 | ||||
|
DME expression in the diseased tissue of patients
DME expression in the normal tissue adjacent to the diseased tissue of patients
DME expression in the normal tissue of healthy individuals
|
|||||
| Violin Diagram of DME Disease-specific Protein Abundances |
|
Click to View the Clearer Original Diagram | |||
| ICD-11: 4A62 | Behcet disease | Click to Show/Hide | |||
| The Studied Tissue | Peripheral blood | ||||
| The Specified Disease | Behcet's disease [ICD-11:4A62] | ||||
| The Expression Level of Disease Section Compare with the Healthy Individual Tissue | p-value: 4.32E-01; Fold-change: 7.38E-02; Z-score: 4.17E-01 | ||||
|
DME expression in the diseased tissue of patients
DME expression in the normal tissue of healthy individuals
|
|||||
| Violin Diagram of DME Disease-specific Protein Abundances |
|
Click to View the Clearer Original Diagram | |||
| ICD-11: 4B04 | Monocyte count disorder | Click to Show/Hide | |||
| The Studied Tissue | Whole blood | ||||
| The Specified Disease | Autosomal dominant monocytopenia [ICD-11:4B04] | ||||
| The Expression Level of Disease Section Compare with the Healthy Individual Tissue | p-value: 5.55E-01; Fold-change: 3.64E-04; Z-score: 2.57E-03 | ||||
|
DME expression in the diseased tissue of patients
DME expression in the normal tissue of healthy individuals
|
|||||
| Violin Diagram of DME Disease-specific Protein Abundances |
|
Click to View the Clearer Original Diagram | |||
| ICD Disease Classification 05 | Endocrine/nutritional/metabolic disease | Click to Show/Hide | |||
| ICD-11: 5A11 | Type 2 diabetes mellitus | Click to Show/Hide | |||
| The Studied Tissue | Omental adipose tissue | ||||
| The Specified Disease | Obesity related type 2 diabetes [ICD-11:5A11] | ||||
| The Expression Level of Disease Section Compare with the Healthy Individual Tissue | p-value: 3.11E-01; Fold-change: 9.55E-02; Z-score: 1.62E+00 | ||||
|
DME expression in the diseased tissue of patients
DME expression in the normal tissue of healthy individuals
|
|||||
| Violin Diagram of DME Disease-specific Protein Abundances |
|
Click to View the Clearer Original Diagram | |||
| The Studied Tissue | Liver tissue | ||||
| The Specified Disease | Type 2 diabetes [ICD-11:5A11] | ||||
| The Expression Level of Disease Section Compare with the Healthy Individual Tissue | p-value: 2.05E-01; Fold-change: -1.49E-01; Z-score: -3.36E-01 | ||||
|
DME expression in the diseased tissue of patients
DME expression in the normal tissue of healthy individuals
|
|||||
| Violin Diagram of DME Disease-specific Protein Abundances |
|
Click to View the Clearer Original Diagram | |||
| ICD-11: 5A80 | Ovarian dysfunction | Click to Show/Hide | |||
| The Studied Tissue | Vastus lateralis muscle | ||||
| The Specified Disease | Polycystic ovary syndrome [ICD-11:5A80.1] | ||||
| The Expression Level of Disease Section Compare with the Healthy Individual Tissue | p-value: 3.86E-02; Fold-change: 3.52E-02; Z-score: 6.08E-01 | ||||
|
DME expression in the diseased tissue of patients
DME expression in the normal tissue of healthy individuals
|
|||||
| Violin Diagram of DME Disease-specific Protein Abundances |
|
Click to View the Clearer Original Diagram | |||
| ICD-11: 5C51 | Inborn carbohydrate metabolism disorder | Click to Show/Hide | |||
| The Studied Tissue | Biceps muscle | ||||
| The Specified Disease | Pompe disease [ICD-11:5C51.3] | ||||
| The Expression Level of Disease Section Compare with the Healthy Individual Tissue | p-value: 7.33E-03; Fold-change: -2.03E-01; Z-score: -8.96E-01 | ||||
|
DME expression in the diseased tissue of patients
DME expression in the normal tissue of healthy individuals
|
|||||
| Violin Diagram of DME Disease-specific Protein Abundances |
|
Click to View the Clearer Original Diagram | |||
| ICD-11: 5C56 | Lysosomal disease | Click to Show/Hide | |||
| The Studied Tissue | Whole blood | ||||
| The Specified Disease | Batten disease [ICD-11:5C56.1] | ||||
| The Expression Level of Disease Section Compare with the Healthy Individual Tissue | p-value: 5.75E-01; Fold-change: -8.69E-02; Z-score: -8.50E-01 | ||||
|
DME expression in the diseased tissue of patients
DME expression in the normal tissue of healthy individuals
|
|||||
| Violin Diagram of DME Disease-specific Protein Abundances |
|
Click to View the Clearer Original Diagram | |||
| ICD-11: 5C80 | Hyperlipoproteinaemia | Click to Show/Hide | |||
| The Studied Tissue | Peripheral blood | ||||
| The Specified Disease | Familial hypercholesterolemia [ICD-11:5C80.00] | ||||
| The Expression Level of Disease Section Compare with the Healthy Individual Tissue | p-value: 1.93E-01; Fold-change: -2.22E-02; Z-score: -1.61E-01 | ||||
|
DME expression in the diseased tissue of patients
DME expression in the normal tissue of healthy individuals
|
|||||
| Violin Diagram of DME Disease-specific Protein Abundances |
|
Click to View the Clearer Original Diagram | |||
| The Studied Tissue | Whole blood | ||||
| The Specified Disease | Familial hypercholesterolemia [ICD-11:5C80.00] | ||||
| The Expression Level of Disease Section Compare with the Healthy Individual Tissue | p-value: 2.88E-03; Fold-change: -2.88E-01; Z-score: -1.41E+00 | ||||
|
DME expression in the diseased tissue of patients
DME expression in the normal tissue of healthy individuals
|
|||||
| Violin Diagram of DME Disease-specific Protein Abundances |
|
Click to View the Clearer Original Diagram | |||
| ICD Disease Classification 06 | Mental/behavioural/neurodevelopmental disorder | Click to Show/Hide | |||
| ICD-11: 6A02 | Autism spectrum disorder | Click to Show/Hide | |||
| The Studied Tissue | Whole blood | ||||
| The Specified Disease | Autism [ICD-11:6A02] | ||||
| The Expression Level of Disease Section Compare with the Healthy Individual Tissue | p-value: 4.08E-01; Fold-change: -7.97E-02; Z-score: -4.43E-01 | ||||
|
DME expression in the diseased tissue of patients
DME expression in the normal tissue of healthy individuals
|
|||||
| Violin Diagram of DME Disease-specific Protein Abundances |
|
Click to View the Clearer Original Diagram | |||
| ICD-11: 6A20 | Schizophrenia | Click to Show/Hide | |||
| The Studied Tissue | Prefrontal cortex | ||||
| The Specified Disease | Schizophrenia [ICD-11:6A20] | ||||
| The Expression Level of Disease Section Compare with the Healthy Individual Tissue | p-value: 9.90E-01; Fold-change: 3.10E-03; Z-score: 1.75E-02 | ||||
|
DME expression in the diseased tissue of patients
DME expression in the normal tissue of healthy individuals
|
|||||
| Violin Diagram of DME Disease-specific Protein Abundances |
|
Click to View the Clearer Original Diagram | |||
| The Studied Tissue | Superior temporal cortex | ||||
| The Specified Disease | Schizophrenia [ICD-11:6A20] | ||||
| The Expression Level of Disease Section Compare with the Healthy Individual Tissue | p-value: 5.35E-01; Fold-change: 1.10E-02; Z-score: 1.19E-01 | ||||
|
DME expression in the diseased tissue of patients
DME expression in the normal tissue of healthy individuals
|
|||||
| Violin Diagram of DME Disease-specific Protein Abundances |
|
Click to View the Clearer Original Diagram | |||
| ICD-11: 6A60 | Bipolar disorder | Click to Show/Hide | |||
| The Studied Tissue | Prefrontal cortex | ||||
| The Specified Disease | Bipolar disorder [ICD-11:6A60-6A6Z] | ||||
| The Expression Level of Disease Section Compare with the Healthy Individual Tissue | p-value: 5.99E-01; Fold-change: 1.92E-02; Z-score: 1.35E-01 | ||||
|
DME expression in the diseased tissue of patients
DME expression in the normal tissue of healthy individuals
|
|||||
| Violin Diagram of DME Disease-specific Protein Abundances |
|
Click to View the Clearer Original Diagram | |||
| ICD-11: 6A70 | Depressive disorder | Click to Show/Hide | |||
| The Studied Tissue | Whole blood | ||||
| The Specified Disease | Major depressive disorder [ICD-11:6A70-6A7Z] | ||||
| The Expression Level of Disease Section Compare with the Healthy Individual Tissue | p-value: 3.00E-01; Fold-change: 1.26E-01; Z-score: 3.74E-01 | ||||
|
DME expression in the diseased tissue of patients
DME expression in the normal tissue of healthy individuals
|
|||||
| Violin Diagram of DME Disease-specific Protein Abundances |
|
Click to View the Clearer Original Diagram | |||
| The Studied Tissue | Hippocampus | ||||
| The Specified Disease | Major depressive disorder [ICD-11:6A70-6A7Z] | ||||
| The Expression Level of Disease Section Compare with the Healthy Individual Tissue | p-value: 5.79E-01; Fold-change: -1.30E-02; Z-score: -9.78E-02 | ||||
|
DME expression in the diseased tissue of patients
DME expression in the normal tissue of healthy individuals
|
|||||
| Violin Diagram of DME Disease-specific Protein Abundances |
|
Click to View the Clearer Original Diagram | |||
| ICD Disease Classification 08 | Nervous system disease | Click to Show/Hide | |||
| ICD-11: 8A00 | Parkinsonism | Click to Show/Hide | |||
| The Studied Tissue | Substantia nigra tissue | ||||
| The Specified Disease | Parkinson's disease [ICD-11:8A00.0] | ||||
| The Expression Level of Disease Section Compare with the Healthy Individual Tissue | p-value: 4.32E-01; Fold-change: 4.39E-02; Z-score: 4.30E-01 | ||||
|
DME expression in the diseased tissue of patients
DME expression in the normal tissue of healthy individuals
|
|||||
| Violin Diagram of DME Disease-specific Protein Abundances |
|
Click to View the Clearer Original Diagram | |||
| ICD-11: 8A01 | Choreiform disorder | Click to Show/Hide | |||
| The Studied Tissue | Whole blood | ||||
| The Specified Disease | Huntington's disease [ICD-11:8A01.10] | ||||
| The Expression Level of Disease Section Compare with the Healthy Individual Tissue | p-value: 2.40E-01; Fold-change: -8.11E-02; Z-score: -5.50E-01 | ||||
|
DME expression in the diseased tissue of patients
DME expression in the normal tissue of healthy individuals
|
|||||
| Violin Diagram of DME Disease-specific Protein Abundances |
|
Click to View the Clearer Original Diagram | |||
| ICD-11: 8A20 | Alzheimer disease | Click to Show/Hide | |||
| The Studied Tissue | Entorhinal cortex | ||||
| The Specified Disease | Alzheimer's disease [ICD-11:8A20] | ||||
| The Expression Level of Disease Section Compare with the Healthy Individual Tissue | p-value: 4.88E-01; Fold-change: -1.69E-05; Z-score: -1.28E-04 | ||||
|
DME expression in the diseased tissue of patients
DME expression in the normal tissue of healthy individuals
|
|||||
| Violin Diagram of DME Disease-specific Protein Abundances |
|
Click to View the Clearer Original Diagram | |||
| ICD-11: 8A2Y | Neurocognitive impairment | Click to Show/Hide | |||
| The Studied Tissue | White matter tissue | ||||
| The Specified Disease | HIV-associated neurocognitive impairment [ICD-11:8A2Y-8A2Z] | ||||
| The Expression Level of Disease Section Compare with the Healthy Individual Tissue | p-value: 3.54E-01; Fold-change: -2.05E-02; Z-score: -1.25E-01 | ||||
|
DME expression in the diseased tissue of patients
DME expression in the normal tissue of healthy individuals
|
|||||
| Violin Diagram of DME Disease-specific Protein Abundances |
|
Click to View the Clearer Original Diagram | |||
| ICD-11: 8A40 | Multiple sclerosis | Click to Show/Hide | |||
| The Studied Tissue | Plasmacytoid dendritic cells | ||||
| The Specified Disease | Multiple sclerosis [ICD-11:8A40] | ||||
| The Expression Level of Disease Section Compare with the Healthy Individual Tissue | p-value: 3.97E-02; Fold-change: -1.72E-01; Z-score: -9.29E-01 | ||||
|
DME expression in the diseased tissue of patients
DME expression in the normal tissue of healthy individuals
|
|||||
| Violin Diagram of DME Disease-specific Protein Abundances |
|
Click to View the Clearer Original Diagram | |||
| The Studied Tissue | Spinal cord | ||||
| The Specified Disease | Multiple sclerosis [ICD-11:8A40] | ||||
| The Expression Level of Disease Section Compare with the Adjacent Tissue | p-value: 1.72E-01; Fold-change: -1.75E-01; Z-score: -1.09E+00 | ||||
|
DME expression in the diseased tissue of patients
DME expression in the normal tissue adjacent to the diseased tissue of patients
|
|||||
| Violin Diagram of DME Disease-specific Protein Abundances |
|
Click to View the Clearer Original Diagram | |||
| ICD-11: 8A60 | Epilepsy | Click to Show/Hide | |||
| The Studied Tissue | Peritumoral cortex tissue | ||||
| The Specified Disease | Epilepsy [ICD-11:8A60-8A6Z] | ||||
| The Expression Level of Disease Section Compare with the Other Disease Section | p-value: 4.95E-01; Fold-change: 2.97E-01; Z-score: 6.74E-01 | ||||
|
DME expression in the diseased tissue of patients
DME expression in tissue other than the diseased tissue of patients
|
|||||
| Violin Diagram of DME Disease-specific Protein Abundances |
|
Click to View the Clearer Original Diagram | |||
| The Studied Tissue | Whole blood | ||||
| The Specified Disease | Seizure [ICD-11:8A60-8A6Z] | ||||
| The Expression Level of Disease Section Compare with the Healthy Individual Tissue | p-value: 7.40E-02; Fold-change: -7.76E-02; Z-score: -4.64E-01 | ||||
|
DME expression in the diseased tissue of patients
DME expression in the normal tissue of healthy individuals
|
|||||
| Violin Diagram of DME Disease-specific Protein Abundances |
|
Click to View the Clearer Original Diagram | |||
| ICD-11: 8B01 | Subarachnoid haemorrhage | Click to Show/Hide | |||
| The Studied Tissue | Intracranial artery | ||||
| The Specified Disease | Intracranial aneurysm [ICD-11:8B01.0] | ||||
| The Expression Level of Disease Section Compare with the Healthy Individual Tissue | p-value: 3.93E-01; Fold-change: -1.08E-02; Z-score: -7.09E-02 | ||||
|
DME expression in the diseased tissue of patients
DME expression in the normal tissue of healthy individuals
|
|||||
| Violin Diagram of DME Disease-specific Protein Abundances |
|
Click to View the Clearer Original Diagram | |||
| ICD-11: 8B11 | Cerebral ischaemic stroke | Click to Show/Hide | |||
| The Studied Tissue | Whole blood | ||||
| The Specified Disease | Cardioembolic stroke [ICD-11:8B11.20] | ||||
| The Expression Level of Disease Section Compare with the Healthy Individual Tissue | p-value: 7.07E-01; Fold-change: -5.57E-02; Z-score: -1.64E-01 | ||||
|
DME expression in the diseased tissue of patients
DME expression in the normal tissue of healthy individuals
|
|||||
| Violin Diagram of DME Disease-specific Protein Abundances |
|
Click to View the Clearer Original Diagram | |||
| The Studied Tissue | Peripheral blood | ||||
| The Specified Disease | Ischemic stroke [ICD-11:8B11] | ||||
| The Expression Level of Disease Section Compare with the Healthy Individual Tissue | p-value: 1.88E-01; Fold-change: 3.80E-02; Z-score: 1.69E-01 | ||||
|
DME expression in the diseased tissue of patients
DME expression in the normal tissue of healthy individuals
|
|||||
| Violin Diagram of DME Disease-specific Protein Abundances |
|
Click to View the Clearer Original Diagram | |||
| ICD-11: 8B60 | Motor neuron disease | Click to Show/Hide | |||
| The Studied Tissue | Skin | ||||
| The Specified Disease | Lateral sclerosis [ICD-11:8B60.4] | ||||
| The Expression Level of Disease Section Compare with the Healthy Individual Tissue | p-value: 8.28E-01; Fold-change: -5.54E-02; Z-score: -4.08E-01 | ||||
|
DME expression in the diseased tissue of patients
DME expression in the normal tissue of healthy individuals
|
|||||
| Violin Diagram of DME Disease-specific Protein Abundances |
|
Click to View the Clearer Original Diagram | |||
| The Studied Tissue | Cervical spinal cord | ||||
| The Specified Disease | Lateral sclerosis [ICD-11:8B60.4] | ||||
| The Expression Level of Disease Section Compare with the Healthy Individual Tissue | p-value: 2.35E-02; Fold-change: 7.82E-02; Z-score: 4.89E-01 | ||||
|
DME expression in the diseased tissue of patients
DME expression in the normal tissue of healthy individuals
|
|||||
| Violin Diagram of DME Disease-specific Protein Abundances |
|
Click to View the Clearer Original Diagram | |||
| ICD-11: 8C70 | Muscular dystrophy | Click to Show/Hide | |||
| The Studied Tissue | Muscle tissue | ||||
| The Specified Disease | Myopathy [ICD-11:8C70.6] | ||||
| The Expression Level of Disease Section Compare with the Healthy Individual Tissue | p-value: 7.06E-01; Fold-change: -4.55E-02; Z-score: -2.54E-01 | ||||
|
DME expression in the diseased tissue of patients
DME expression in the normal tissue of healthy individuals
|
|||||
| Violin Diagram of DME Disease-specific Protein Abundances |
|
Click to View the Clearer Original Diagram | |||
| ICD-11: 8C75 | Distal myopathy | Click to Show/Hide | |||
| The Studied Tissue | Muscle tissue | ||||
| The Specified Disease | Tibial muscular dystrophy [ICD-11:8C75] | ||||
| The Expression Level of Disease Section Compare with the Healthy Individual Tissue | p-value: 7.03E-01; Fold-change: 3.69E-02; Z-score: 1.86E-01 | ||||
|
DME expression in the diseased tissue of patients
DME expression in the normal tissue of healthy individuals
|
|||||
| Violin Diagram of DME Disease-specific Protein Abundances |
|
Click to View the Clearer Original Diagram | |||
| ICD Disease Classification 09 | Visual system disease | Click to Show/Hide | |||
| ICD-11: 9A96 | Anterior uveitis | Click to Show/Hide | |||
| The Studied Tissue | Peripheral monocyte | ||||
| The Specified Disease | Autoimmune uveitis [ICD-11:9A96] | ||||
| The Expression Level of Disease Section Compare with the Healthy Individual Tissue | p-value: 1.09E-01; Fold-change: -9.75E-02; Z-score: -4.25E-01 | ||||
|
DME expression in the diseased tissue of patients
DME expression in the normal tissue of healthy individuals
|
|||||
| Violin Diagram of DME Disease-specific Protein Abundances |
|
Click to View the Clearer Original Diagram | |||
| ICD Disease Classification 11 | Circulatory system disease | Click to Show/Hide | |||
| ICD-11: BA41 | Myocardial infarction | Click to Show/Hide | |||
| The Studied Tissue | Peripheral blood | ||||
| The Specified Disease | Myocardial infarction [ICD-11:BA41-BA50] | ||||
| The Expression Level of Disease Section Compare with the Healthy Individual Tissue | p-value: 5.14E-01; Fold-change: 5.05E-02; Z-score: 6.99E-02 | ||||
|
DME expression in the diseased tissue of patients
DME expression in the normal tissue of healthy individuals
|
|||||
| Violin Diagram of DME Disease-specific Protein Abundances |
|
Click to View the Clearer Original Diagram | |||
| ICD-11: BA80 | Coronary artery disease | Click to Show/Hide | |||
| The Studied Tissue | Peripheral blood | ||||
| The Specified Disease | Coronary artery disease [ICD-11:BA80-BA8Z] | ||||
| The Expression Level of Disease Section Compare with the Healthy Individual Tissue | p-value: 4.85E-01; Fold-change: -1.16E-01; Z-score: -6.57E-01 | ||||
|
DME expression in the diseased tissue of patients
DME expression in the normal tissue of healthy individuals
|
|||||
| Violin Diagram of DME Disease-specific Protein Abundances |
|
Click to View the Clearer Original Diagram | |||
| ICD-11: BB70 | Aortic valve stenosis | Click to Show/Hide | |||
| The Studied Tissue | Calcified aortic valve | ||||
| The Specified Disease | Aortic stenosis [ICD-11:BB70] | ||||
| The Expression Level of Disease Section Compare with the Healthy Individual Tissue | p-value: 9.45E-01; Fold-change: -1.69E-02; Z-score: -2.18E-02 | ||||
|
DME expression in the diseased tissue of patients
DME expression in the normal tissue of healthy individuals
|
|||||
| Violin Diagram of DME Disease-specific Protein Abundances |
|
Click to View the Clearer Original Diagram | |||
| ICD Disease Classification 12 | Respiratory system disease | Click to Show/Hide | |||
| ICD-11: 7A40 | Central sleep apnoea | Click to Show/Hide | |||
| The Studied Tissue | Hyperplastic tonsil | ||||
| The Specified Disease | Apnea [ICD-11:7A40] | ||||
| The Expression Level of Disease Section Compare with the Healthy Individual Tissue | p-value: 6.10E-01; Fold-change: -5.59E-02; Z-score: -2.63E-01 | ||||
|
DME expression in the diseased tissue of patients
DME expression in the normal tissue of healthy individuals
|
|||||
| Violin Diagram of DME Disease-specific Protein Abundances |
|
Click to View the Clearer Original Diagram | |||
| ICD-11: CA08 | Vasomotor or allergic rhinitis | Click to Show/Hide | |||
| The Studied Tissue | Peripheral blood | ||||
| The Specified Disease | Olive pollen allergy [ICD-11:CA08.00] | ||||
| The Expression Level of Disease Section Compare with the Healthy Individual Tissue | p-value: 6.86E-01; Fold-change: 1.54E-01; Z-score: 4.86E-01 | ||||
|
DME expression in the diseased tissue of patients
DME expression in the normal tissue of healthy individuals
|
|||||
| Violin Diagram of DME Disease-specific Protein Abundances |
|
Click to View the Clearer Original Diagram | |||
| ICD-11: CA0A | Chronic rhinosinusitis | Click to Show/Hide | |||
| The Studied Tissue | Sinus mucosa tissue | ||||
| The Specified Disease | Chronic rhinosinusitis [ICD-11:CA0A] | ||||
| The Expression Level of Disease Section Compare with the Healthy Individual Tissue | p-value: 2.73E-03; Fold-change: -6.73E-01; Z-score: -1.20E+00 | ||||
|
DME expression in the diseased tissue of patients
DME expression in the normal tissue of healthy individuals
|
|||||
| Violin Diagram of DME Disease-specific Protein Abundances |
|
Click to View the Clearer Original Diagram | |||
| ICD-11: CA22 | Chronic obstructive pulmonary disease | Click to Show/Hide | |||
| The Studied Tissue | Lung tissue | ||||
| The Specified Disease | Chronic obstructive pulmonary disease [ICD-11:CA22] | ||||
| The Expression Level of Disease Section Compare with the Healthy Individual Tissue | p-value: 2.10E-02; Fold-change: 9.95E-02; Z-score: 3.65E-01 | ||||
|
DME expression in the diseased tissue of patients
DME expression in the normal tissue of healthy individuals
|
|||||
| Violin Diagram of DME Disease-specific Protein Abundances |
|
Click to View the Clearer Original Diagram | |||
| The Studied Tissue | Small airway epithelium | ||||
| The Specified Disease | Chronic obstructive pulmonary disease [ICD-11:CA22] | ||||
| The Expression Level of Disease Section Compare with the Healthy Individual Tissue | p-value: 2.07E-03; Fold-change: -2.31E-01; Z-score: -5.10E-01 | ||||
|
DME expression in the diseased tissue of patients
DME expression in the normal tissue of healthy individuals
|
|||||
| Violin Diagram of DME Disease-specific Protein Abundances |
|
Click to View the Clearer Original Diagram | |||
| ICD-11: CA23 | Asthma | Click to Show/Hide | |||
| The Studied Tissue | Nasal and bronchial airway | ||||
| The Specified Disease | Asthma [ICD-11:CA23] | ||||
| The Expression Level of Disease Section Compare with the Healthy Individual Tissue | p-value: 4.74E-01; Fold-change: 2.25E-01; Z-score: 1.65E-01 | ||||
|
DME expression in the diseased tissue of patients
DME expression in the normal tissue of healthy individuals
|
|||||
| Violin Diagram of DME Disease-specific Protein Abundances |
|
Click to View the Clearer Original Diagram | |||
| ICD-11: CB03 | Idiopathic interstitial pneumonitis | Click to Show/Hide | |||
| The Studied Tissue | Lung tissue | ||||
| The Specified Disease | Idiopathic pulmonary fibrosis [ICD-11:CB03.4] | ||||
| The Expression Level of Disease Section Compare with the Healthy Individual Tissue | p-value: 8.91E-01; Fold-change: -3.14E-02; Z-score: -1.42E-01 | ||||
|
DME expression in the diseased tissue of patients
DME expression in the normal tissue of healthy individuals
|
|||||
| Violin Diagram of DME Disease-specific Protein Abundances |
|
Click to View the Clearer Original Diagram | |||
| ICD Disease Classification 13 | Digestive system disease | Click to Show/Hide | |||
| ICD-11: DA0C | Periodontal disease | Click to Show/Hide | |||
| The Studied Tissue | Gingival tissue | ||||
| The Specified Disease | Periodontal disease [ICD-11:DA0C] | ||||
| The Expression Level of Disease Section Compare with the Adjacent Tissue | p-value: 1.75E-01; Fold-change: 5.79E-02; Z-score: 2.19E-01 | ||||
|
DME expression in the diseased tissue of patients
DME expression in the normal tissue adjacent to the diseased tissue of patients
|
|||||
| Violin Diagram of DME Disease-specific Protein Abundances |
|
Click to View the Clearer Original Diagram | |||
| ICD-11: DA42 | Gastritis | Click to Show/Hide | |||
| The Studied Tissue | Gastric antrum tissue | ||||
| The Specified Disease | Eosinophilic gastritis [ICD-11:DA42.2] | ||||
| The Expression Level of Disease Section Compare with the Adjacent Tissue | p-value: 4.59E-01; Fold-change: 5.69E-03; Z-score: 3.26E-02 | ||||
|
DME expression in the diseased tissue of patients
DME expression in the normal tissue adjacent to the diseased tissue of patients
|
|||||
| Violin Diagram of DME Disease-specific Protein Abundances |
|
Click to View the Clearer Original Diagram | |||
| ICD-11: DB92 | Non-alcoholic fatty liver disease | Click to Show/Hide | |||
| The Studied Tissue | Liver tissue | ||||
| The Specified Disease | Non-alcoholic fatty liver disease [ICD-11:DB92] | ||||
| The Expression Level of Disease Section Compare with the Healthy Individual Tissue | p-value: 2.98E-01; Fold-change: 3.67E-01; Z-score: 5.18E-01 | ||||
|
DME expression in the diseased tissue of patients
DME expression in the normal tissue of healthy individuals
|
|||||
| Violin Diagram of DME Disease-specific Protein Abundances |
|
Click to View the Clearer Original Diagram | |||
| ICD-11: DB99 | Hepatic failure | Click to Show/Hide | |||
| The Studied Tissue | Liver tissue | ||||
| The Specified Disease | Liver failure [ICD-11:DB99.7-DB99.8] | ||||
| The Expression Level of Disease Section Compare with the Healthy Individual Tissue | p-value: 1.22E-03; Fold-change: -1.69E+00; Z-score: -3.55E+00 | ||||
|
DME expression in the diseased tissue of patients
DME expression in the normal tissue of healthy individuals
|
|||||
| Violin Diagram of DME Disease-specific Protein Abundances |
|
Click to View the Clearer Original Diagram | |||
| ICD-11: DD71 | Ulcerative colitis | Click to Show/Hide | |||
| The Studied Tissue | Colon mucosal tissue | ||||
| The Specified Disease | Ulcerative colitis [ICD-11:DD71] | ||||
| The Expression Level of Disease Section Compare with the Adjacent Tissue | p-value: 4.78E-01; Fold-change: -1.34E-01; Z-score: -2.67E-01 | ||||
|
DME expression in the diseased tissue of patients
DME expression in tissue other than the diseased tissue of patients
|
|||||
| Violin Diagram of DME Disease-specific Protein Abundances |
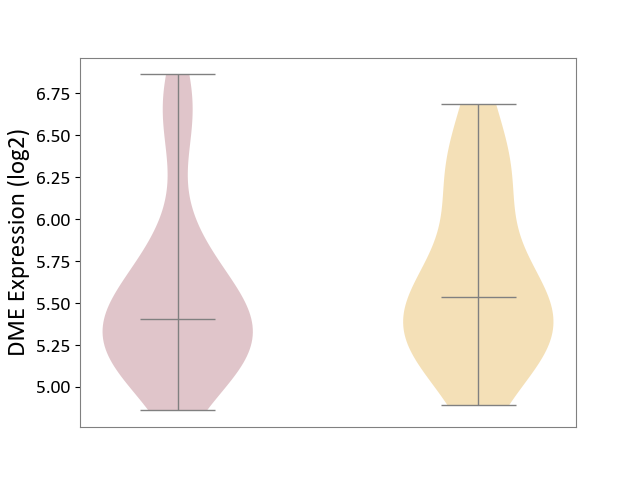
|
Click to View the Clearer Original Diagram | |||
| ICD-11: DD91 | Irritable bowel syndrome | Click to Show/Hide | |||
| The Studied Tissue | Rectal colon tissue | ||||
| The Specified Disease | Irritable bowel syndrome [ICD-11:DD91.0] | ||||
| The Expression Level of Disease Section Compare with the Healthy Individual Tissue | p-value: 8.55E-01; Fold-change: 7.99E-02; Z-score: 2.21E-01 | ||||
|
DME expression in the diseased tissue of patients
DME expression in the normal tissue of healthy individuals
|
|||||
| Violin Diagram of DME Disease-specific Protein Abundances |
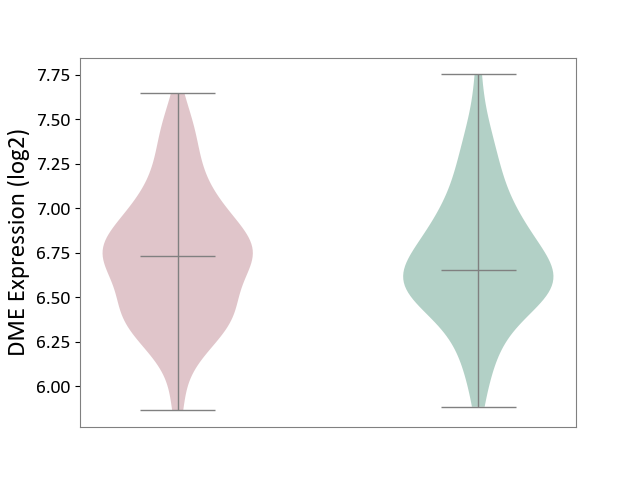
|
Click to View the Clearer Original Diagram | |||
| ICD Disease Classification 14 | Skin disease | Click to Show/Hide | |||
| ICD-11: EA80 | Atopic eczema | Click to Show/Hide | |||
| The Studied Tissue | Skin | ||||
| The Specified Disease | Atopic dermatitis [ICD-11:EA80] | ||||
| The Expression Level of Disease Section Compare with the Healthy Individual Tissue | p-value: 3.49E-03; Fold-change: 2.21E-02; Z-score: 2.17E-01 | ||||
|
DME expression in the diseased tissue of patients
DME expression in the normal tissue of healthy individuals
|
|||||
| Violin Diagram of DME Disease-specific Protein Abundances |
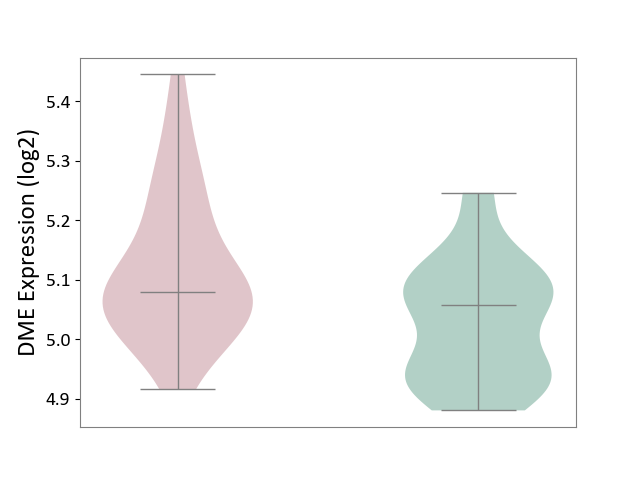
|
Click to View the Clearer Original Diagram | |||
| ICD-11: EA90 | Psoriasis | Click to Show/Hide | |||
| The Studied Tissue | Skin | ||||
| The Specified Disease | Psoriasis [ICD-11:EA90] | ||||
| The Expression Level of Disease Section Compare with the Healthy Individual Tissue | p-value: 1.62E-02; Fold-change: 1.07E-01; Z-score: 4.44E-01 | ||||
| The Expression Level of Disease Section Compare with the Adjacent Tissue | p-value: 6.12E-22; Fold-change: -5.81E-01; Z-score: -1.40E+00 | ||||
|
DME expression in the diseased tissue of patients
DME expression in the normal tissue adjacent to the diseased tissue of patients
DME expression in the normal tissue of healthy individuals
|
|||||
| Violin Diagram of DME Disease-specific Protein Abundances |
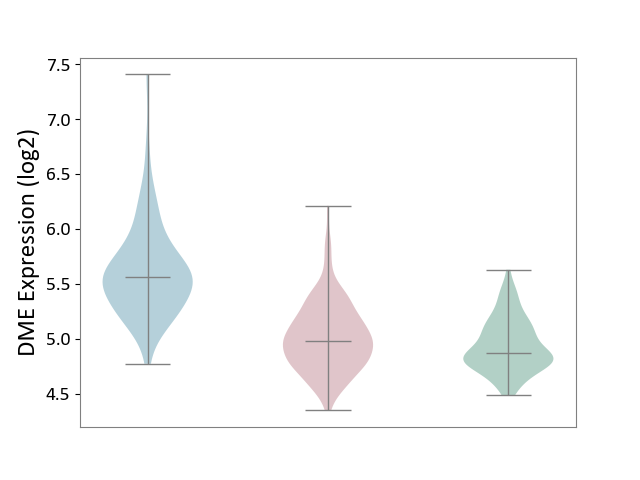
|
Click to View the Clearer Original Diagram | |||
| ICD-11: ED63 | Acquired hypomelanotic disorder | Click to Show/Hide | |||
| The Studied Tissue | Skin | ||||
| The Specified Disease | Vitiligo [ICD-11:ED63.0] | ||||
| The Expression Level of Disease Section Compare with the Healthy Individual Tissue | p-value: 7.19E-01; Fold-change: -2.31E-01; Z-score: -1.10E+00 | ||||
|
DME expression in the diseased tissue of patients
DME expression in the normal tissue of healthy individuals
|
|||||
| Violin Diagram of DME Disease-specific Protein Abundances |
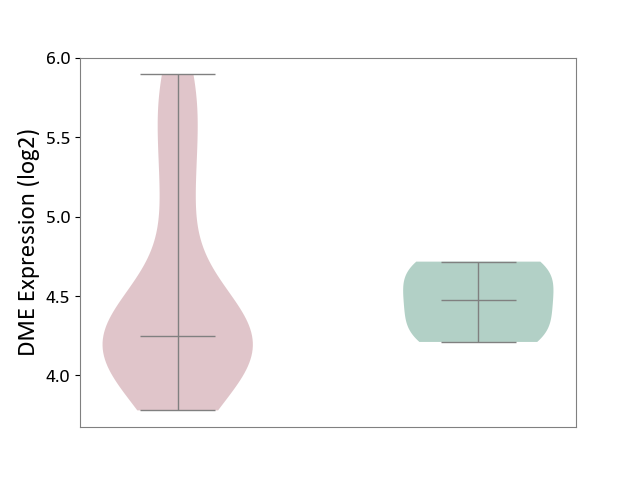
|
Click to View the Clearer Original Diagram | |||
| ICD-11: ED70 | Alopecia or hair loss | Click to Show/Hide | |||
| The Studied Tissue | Skin from scalp | ||||
| The Specified Disease | Alopecia [ICD-11:ED70] | ||||
| The Expression Level of Disease Section Compare with the Healthy Individual Tissue | p-value: 5.59E-02; Fold-change: 3.00E-01; Z-score: 3.61E-01 | ||||
|
DME expression in the diseased tissue of patients
DME expression in the normal tissue of healthy individuals
|
|||||
| Violin Diagram of DME Disease-specific Protein Abundances |
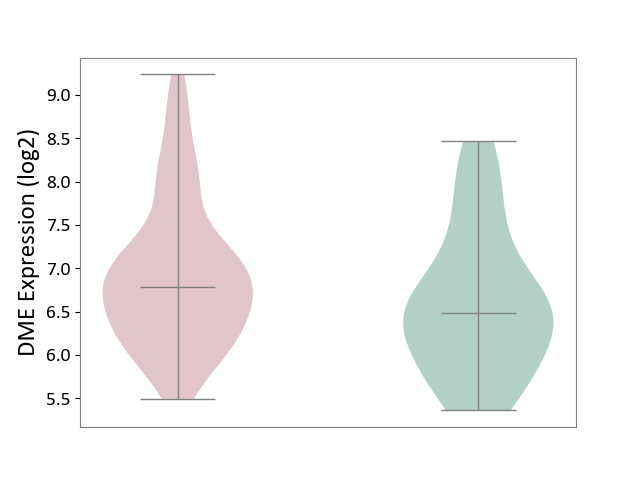
|
Click to View the Clearer Original Diagram | |||
| ICD-11: EK0Z | Contact dermatitis | Click to Show/Hide | |||
| The Studied Tissue | Skin | ||||
| The Specified Disease | Sensitive skin [ICD-11:EK0Z] | ||||
| The Expression Level of Disease Section Compare with the Healthy Individual Tissue | p-value: 5.29E-01; Fold-change: -2.88E-02; Z-score: -7.39E-02 | ||||
|
DME expression in the diseased tissue of patients
DME expression in the normal tissue of healthy individuals
|
|||||
| Violin Diagram of DME Disease-specific Protein Abundances |
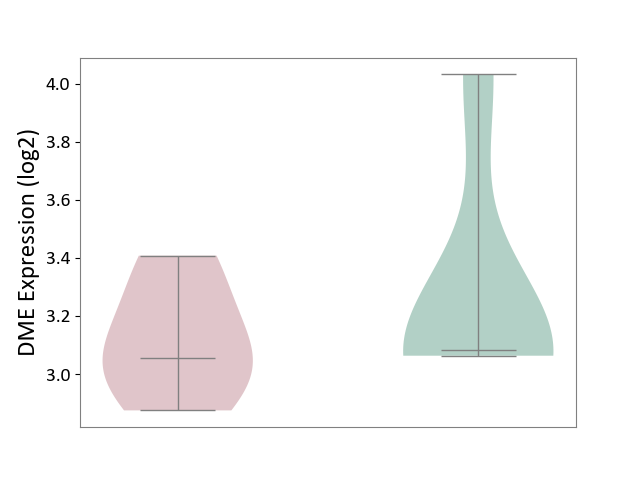
|
Click to View the Clearer Original Diagram | |||
| ICD Disease Classification 15 | Musculoskeletal system/connective tissue disease | Click to Show/Hide | |||
| ICD-11: FA00 | Osteoarthritis | Click to Show/Hide | |||
| The Studied Tissue | Peripheral blood | ||||
| The Specified Disease | Arthropathy [ICD-11:FA00-FA5Z] | ||||
| The Expression Level of Disease Section Compare with the Healthy Individual Tissue | p-value: 5.28E-02; Fold-change: 9.71E-02; Z-score: 9.67E-01 | ||||
|
DME expression in the diseased tissue of patients
DME expression in the normal tissue of healthy individuals
|
|||||
| Violin Diagram of DME Disease-specific Protein Abundances |
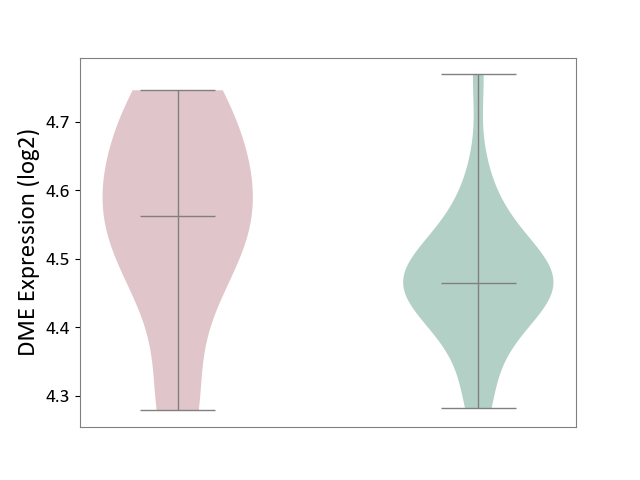
|
Click to View the Clearer Original Diagram | |||
| The Studied Tissue | Synovial tissue | ||||
| The Specified Disease | Osteoarthritis [ICD-11:FA00-FA0Z] | ||||
| The Expression Level of Disease Section Compare with the Healthy Individual Tissue | p-value: 1.64E-01; Fold-change: 1.53E-01; Z-score: 1.14E+00 | ||||
|
DME expression in the diseased tissue of patients
DME expression in the normal tissue of healthy individuals
|
|||||
| Violin Diagram of DME Disease-specific Protein Abundances |
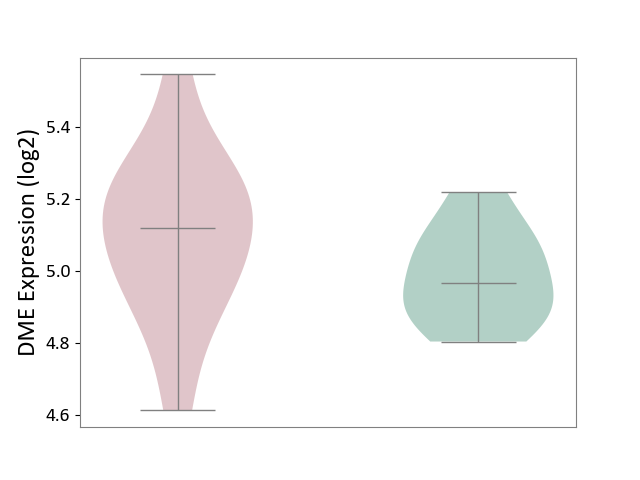
|
Click to View the Clearer Original Diagram | |||
| ICD-11: FA20 | Rheumatoid arthritis | Click to Show/Hide | |||
| The Studied Tissue | Peripheral blood | ||||
| The Specified Disease | Childhood onset rheumatic disease [ICD-11:FA20.Z] | ||||
| The Expression Level of Disease Section Compare with the Healthy Individual Tissue | p-value: 7.58E-01; Fold-change: 9.97E-03; Z-score: 6.67E-02 | ||||
|
DME expression in the diseased tissue of patients
DME expression in the normal tissue of healthy individuals
|
|||||
| Violin Diagram of DME Disease-specific Protein Abundances |
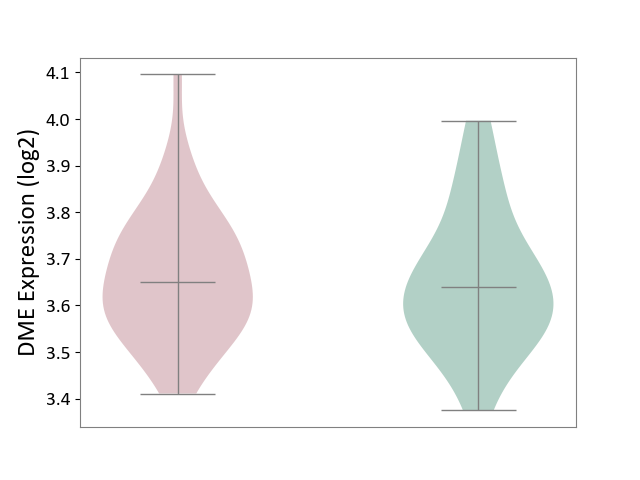
|
Click to View the Clearer Original Diagram | |||
| The Studied Tissue | Synovial tissue | ||||
| The Specified Disease | Rheumatoid arthritis [ICD-11:FA20] | ||||
| The Expression Level of Disease Section Compare with the Healthy Individual Tissue | p-value: 7.53E-01; Fold-change: 1.26E-01; Z-score: 4.92E-01 | ||||
|
DME expression in the diseased tissue of patients
DME expression in the normal tissue of healthy individuals
|
|||||
| Violin Diagram of DME Disease-specific Protein Abundances |
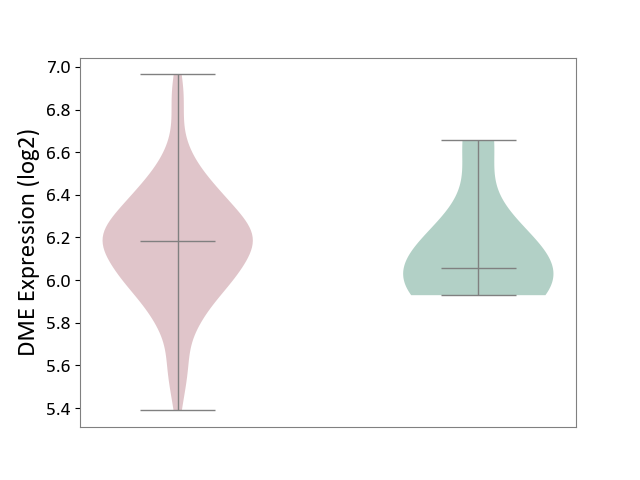
|
Click to View the Clearer Original Diagram | |||
| ICD-11: FA24 | Juvenile idiopathic arthritis | Click to Show/Hide | |||
| The Studied Tissue | Peripheral blood | ||||
| The Specified Disease | Juvenile idiopathic arthritis [ICD-11:FA24] | ||||
| The Expression Level of Disease Section Compare with the Healthy Individual Tissue | p-value: 1.46E-01; Fold-change: -4.36E-02; Z-score: -1.36E-01 | ||||
|
DME expression in the diseased tissue of patients
DME expression in the normal tissue of healthy individuals
|
|||||
| Violin Diagram of DME Disease-specific Protein Abundances |
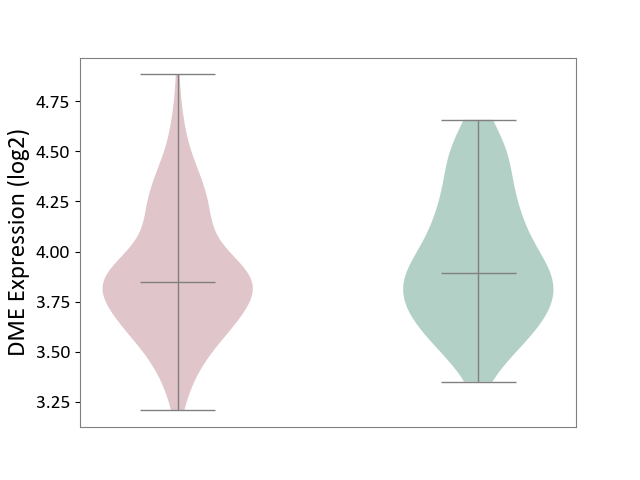
|
Click to View the Clearer Original Diagram | |||
| ICD-11: FA92 | Inflammatory spondyloarthritis | Click to Show/Hide | |||
| The Studied Tissue | Pheripheral blood | ||||
| The Specified Disease | Ankylosing spondylitis [ICD-11:FA92.0Z] | ||||
| The Expression Level of Disease Section Compare with the Healthy Individual Tissue | p-value: 8.71E-02; Fold-change: -5.85E-02; Z-score: -7.69E-01 | ||||
|
DME expression in the diseased tissue of patients
DME expression in the normal tissue of healthy individuals
|
|||||
| Violin Diagram of DME Disease-specific Protein Abundances |
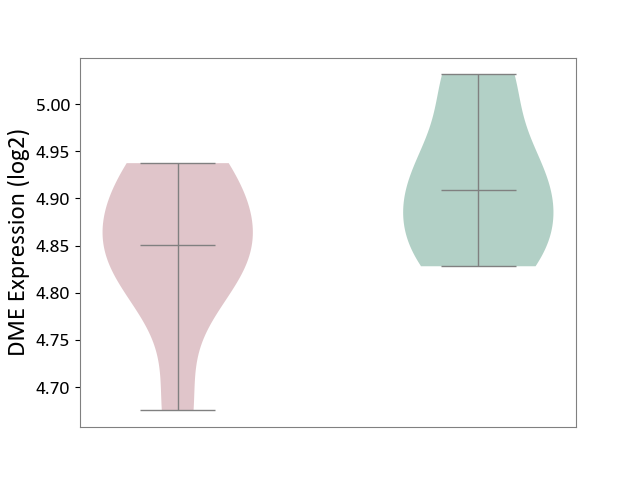
|
Click to View the Clearer Original Diagram | |||
| ICD-11: FB83 | Low bone mass disorder | Click to Show/Hide | |||
| The Studied Tissue | Bone marrow | ||||
| The Specified Disease | Osteoporosis [ICD-11:FB83.1] | ||||
| The Expression Level of Disease Section Compare with the Healthy Individual Tissue | p-value: 4.17E-01; Fold-change: -2.70E-02; Z-score: -2.65E-01 | ||||
|
DME expression in the diseased tissue of patients
DME expression in the normal tissue of healthy individuals
|
|||||
| Violin Diagram of DME Disease-specific Protein Abundances |
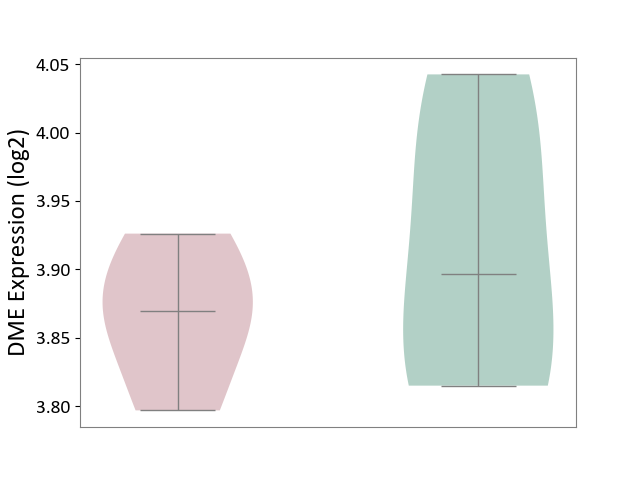
|
Click to View the Clearer Original Diagram | |||
| ICD Disease Classification 16 | Genitourinary system disease | Click to Show/Hide | |||
| ICD-11: GA10 | Endometriosis | Click to Show/Hide | |||
| The Studied Tissue | Endometrium tissue | ||||
| The Specified Disease | Endometriosis [ICD-11:GA10] | ||||
| The Expression Level of Disease Section Compare with the Healthy Individual Tissue | p-value: 7.34E-01; Fold-change: -2.23E-02; Z-score: -9.87E-02 | ||||
|
DME expression in the diseased tissue of patients
DME expression in the normal tissue of healthy individuals
|
|||||
| Violin Diagram of DME Disease-specific Protein Abundances |
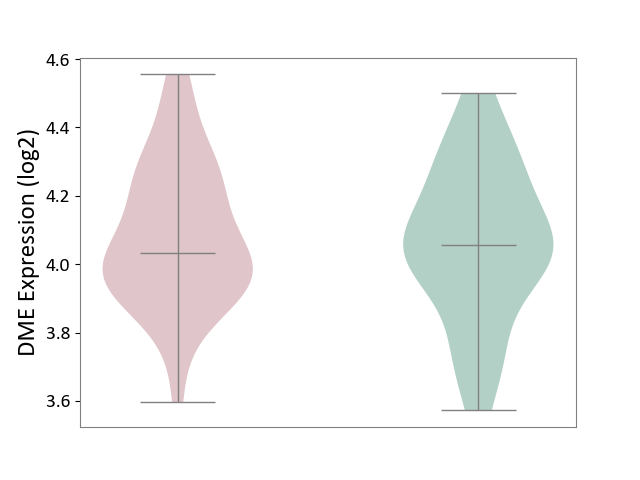
|
Click to View the Clearer Original Diagram | |||
| ICD-11: GC00 | Cystitis | Click to Show/Hide | |||
| The Studied Tissue | Bladder tissue | ||||
| The Specified Disease | Interstitial cystitis [ICD-11:GC00.3] | ||||
| The Expression Level of Disease Section Compare with the Healthy Individual Tissue | p-value: 7.62E-01; Fold-change: 5.13E-02; Z-score: 3.48E-01 | ||||
|
DME expression in the diseased tissue of patients
DME expression in the normal tissue of healthy individuals
|
|||||
| Violin Diagram of DME Disease-specific Protein Abundances |
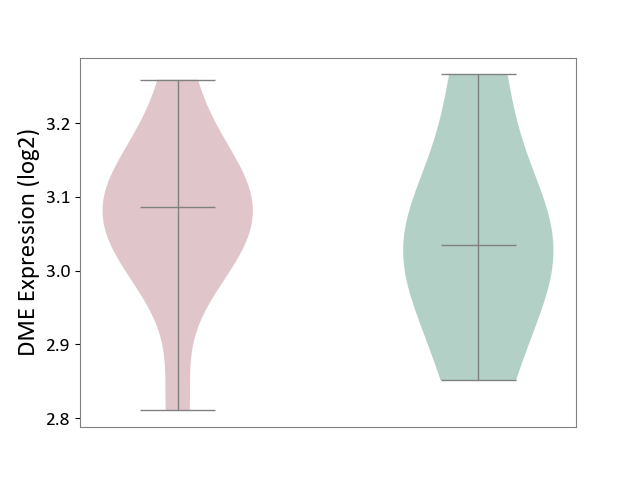
|
Click to View the Clearer Original Diagram | |||
| ICD Disease Classification 19 | Condition originating in perinatal period | Click to Show/Hide | |||
| ICD-11: KA21 | Short gestation disorder | Click to Show/Hide | |||
| The Studied Tissue | Myometrium | ||||
| The Specified Disease | Preterm birth [ICD-11:KA21.4Z] | ||||
| The Expression Level of Disease Section Compare with the Healthy Individual Tissue | p-value: 5.67E-01; Fold-change: -4.10E-02; Z-score: -5.31E-01 | ||||
|
DME expression in the diseased tissue of patients
DME expression in the normal tissue of healthy individuals
|
|||||
| Violin Diagram of DME Disease-specific Protein Abundances |
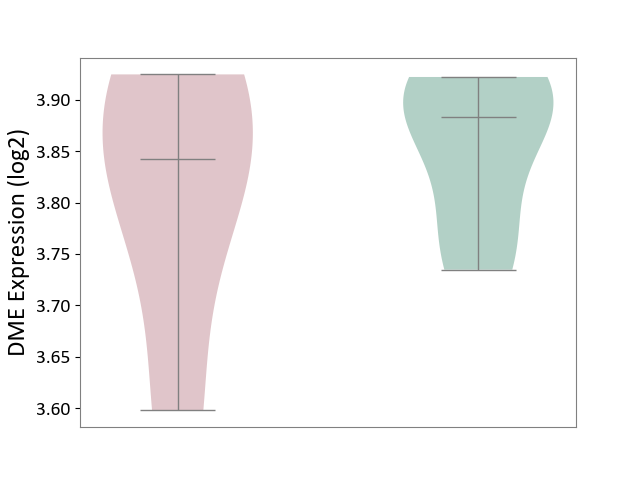
|
Click to View the Clearer Original Diagram | |||
| ICD Disease Classification 20 | Developmental anomaly | Click to Show/Hide | |||
| ICD-11: LD2C | Overgrowth syndrome | Click to Show/Hide | |||
| The Studied Tissue | Adipose tissue | ||||
| The Specified Disease | Simpson golabi behmel syndrome [ICD-11:LD2C] | ||||
| The Expression Level of Disease Section Compare with the Healthy Individual Tissue | p-value: 3.51E-01; Fold-change: 4.13E-02; Z-score: 2.86E-01 | ||||
|
DME expression in the diseased tissue of patients
DME expression in the normal tissue of healthy individuals
|
|||||
| Violin Diagram of DME Disease-specific Protein Abundances |
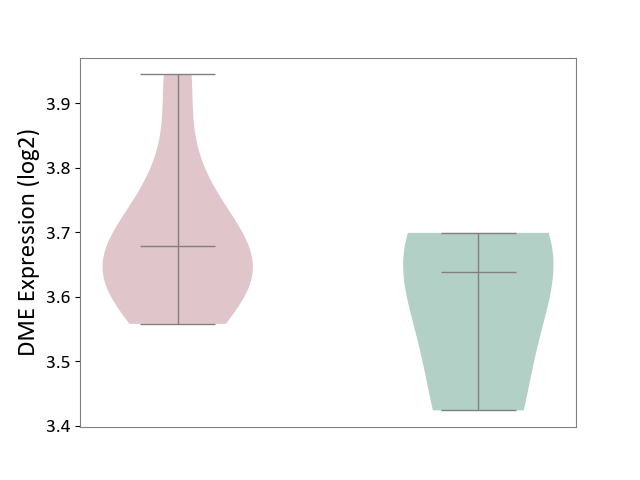
|
Click to View the Clearer Original Diagram | |||
| ICD-11: LD2D | Phakomatoses/hamartoneoplastic syndrome | Click to Show/Hide | |||
| The Studied Tissue | Perituberal tissue | ||||
| The Specified Disease | Tuberous sclerosis complex [ICD-11:LD2D.2] | ||||
| The Expression Level of Disease Section Compare with the Healthy Individual Tissue | p-value: 1.94E-01; Fold-change: 1.29E-01; Z-score: 7.28E-01 | ||||
|
DME expression in the diseased tissue of patients
DME expression in the normal tissue of healthy individuals
|
|||||
| Violin Diagram of DME Disease-specific Protein Abundances |
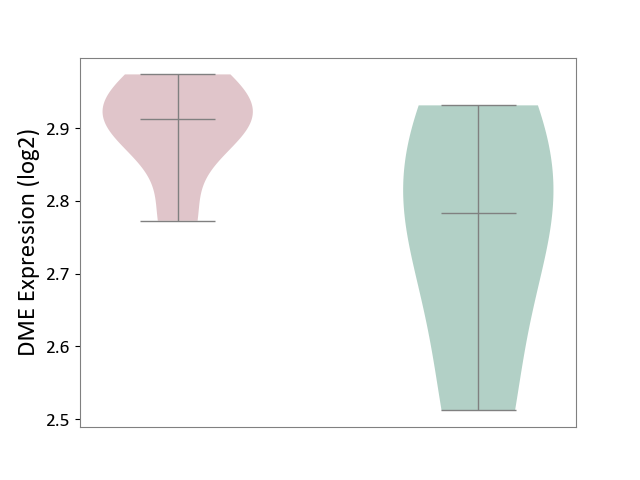
|
Click to View the Clearer Original Diagram | |||
| References | |||||
|---|---|---|---|---|---|
| 1 | Metabolism of thalidomide in human microsomes, cloned human cytochrome P-450 isozymes, and Hansen's disease patients. J Biochem Mol Toxicol. 2000;14(3):140-7. | ||||
| 2 | Laparoscopic Roux-en-Y gastric bypass surgery influenced pharmacokinetics of several drugs given as a cocktail with the highest impact observed for CYP1A2, CYP2C8 and CYP2E1 substrates. Basic Clin Pharmacol Toxicol. 2019 Aug;125(2):123-132. | ||||
| 3 | Effect of tamoxifen on the enzymatic activity of human cytochrome CYP2B6. J Pharmacol Exp Ther. 2002 Jun;301(3):945-52. | ||||
| 4 | Characterization of the oxidative metabolites of 17beta-estradiol and estrone formed by 15 selectively expressed human cytochrome p450 isoforms. Endocrinology. 2003 Aug;144(8):3382-98. | ||||
| 5 | Nicotine and 4-(methylnitrosamino)-1-(3-pyridyl)-butanone metabolism by cytochrome P450 2B6. Drug Metab Dispos. 2005 Dec;33(12):1760-4. | ||||
| 6 | Hepatic metabolism of diclofenac: role of human CYP in the minor oxidative pathways. Biochem Pharmacol. 1999 Sep 1;58(5):787-96. | ||||
| 7 | FDA LABEL:Hydrocodone | ||||
| 8 | Conformational adaptation of human cytochrome P450 2B6 and rabbit cytochrome P450 2B4 revealed upon binding multiple amlodipine molecules. Biochemistry. 2012 Sep 18;51(37):7225-38. | ||||
| 9 | Metabolic Profiles of Propofol and Fospropofol: Clinical and Forensic Interpretative Aspects | ||||
| 10 | Insights into CYP2B6-mediated drug-drug interactions. Acta Pharm Sin B. 2016 Sep;6(5):413-425. | ||||
| 11 | Pharmacokinetics and metabolism of 14C-brivaracetam, a novel SV2A ligand, in healthy subjects. Drug Metab Dispos. 2008 Jan;36(1):36-45. | ||||
| 12 | Metabolism of capsaicin by cytochrome P450 produces novel dehydrogenated metabolites and decreases cytotoxicity to lung and liver cells Chem Res Toxicol. 2003 Mar;16(3):336-49. doi: 10.1021/tx025599q. | ||||
| 13 | Metabolism of capsaicin by cytochrome P450 produces novel dehydrogenated metabolites and decreases cytotoxicity to lung and liver cells. Chem Res Toxicol. 2003 Mar;16(3):336-49. | ||||
| 14 | A novel distal enhancer module regulated by pregnane X receptor/constitutive androstane receptor is essential for the maximal induction of CYP2B6 gene expression. J Biol Chem. 2003 Apr 18;278(16):14146-52. | ||||
| 15 | Multiple cytochrome P-450s involved in the metabolism of terbinafine suggest a limited potential for drug-drug interactions Drug Metab Dispos. 1999 Sep;27(9):1029-38. | ||||
| 16 | Substrates, inducers, inhibitors and structure-activity relationships of human Cytochrome P450 2C9 and implications in drug development. Curr Med Chem. 2009;16(27):3480-675. | ||||
| 17 | Summary of information on human CYP enzymes: human P450 metabolism data. Drug Metab Rev. 2002 Feb-May;34(1-2):83-448. | ||||
| 18 | Identification of the human P-450 enzymes responsible for the sulfoxidation and thiono-oxidation of diethyldithiocarbamate methyl ester: role of P-450 enzymes in disulfiram bioactivation Alcohol Clin Exp Res. 1998 Sep;22(6):1212-9. | ||||
| 19 | Ninlaro- European Medicines Agency - European Union | ||||
| 20 | Metabolism of anabolic steroids by recombinant human cytochrome P450 enzymes. Gas chromatographic-mass spectrometric determination of metabolites. J Chromatogr B Biomed Sci Appl. 1999 Nov 26;735(1):73-83. | ||||
| 21 | The pharmacology and clinical pharmacokinetics of apomorphine SL BJU Int. 2001 Oct;88 Suppl 3:18-21. doi: 10.1046/j.1464-4096.2001.00124.x. | ||||
| 22 | Genetic polymorphism of cytochrome P450 2D6 determines oestrogen receptor activity of the major infertility drug clomiphene via its active metabolites | ||||
| 23 | Bupropion and 4-OH-bupropion pharmacokinetics in relation to genetic polymorphisms in CYP2B6. Pharmacogenetics. 2003 Oct;13(10):619-26. | ||||
| 24 | FDA label of Hydrocodone bitartrate. The 2020 official website of the U.S. Food and Drug Administration. | ||||
| 25 | Contribution of CYP3A4, CYP2B6, and CYP2C9 isoforms to N-demethylation of ketamine in human liver microsomes. Drug Metab Dispos. 2002 Jul;30(7):853-8. | ||||
| 26 | The clinical pharmacology profile of the new antiepileptic drug perampanel: A novel noncompetitive AMPA receptor antagonist Epilepsia. 2015 Jan;56(1):12-27. doi: 10.1111/epi.12865. | ||||
| 27 | Metabolism of beta-arteether to dihydroqinghaosu by human liver microsomes and recombinant cytochrome P450 | ||||
| 28 | Mechanistic analysis of the inactivation of cytochrome P450 2B6 by phencyclidine: effects on substrate binding, electron transfer, and uncoupling. Drug Metab Dispos. 2009 Apr;37(4):745-52. | ||||
| 29 | Interaction of cisapride with the human cytochrome P450 system: metabolism and inhibition studies. Drug Metab Dispos. 2000 Jul;28(7):789-800. | ||||
| 30 | Enzymes in addition to CYP3A4 and 3A5 mediate N-demethylation of dextromethorphan in human liver microsomes. Biopharm Drug Dispos. 1999 Oct;20(7):341-6. | ||||
| 31 | Inhibitory monoclonal antibody to human cytochrome P450 2B6. Biochem Pharmacol. 1998 May 15;55(10):1633-40. | ||||
| 32 | Identification of human cytochrome P450 and flavin-containing monooxygenase enzymes involved in the metabolism of lorcaserin, a novel selective human 5-hydroxytryptamine 2C agonist. Drug Metab Dispos. 2012 Apr;40(4):761-71. | ||||
| 33 | RAT CYP3A and CYP2B1/2 were not associated with nevirapine-induced hepatotoxicity. Methods Find Exp Clin Pharmacol. 2006 Sep;28(7):423-31. | ||||
| 34 | Application of the relative activity factor approach in scaling from heterologously expressed cytochromes p450 to human liver microsomes: studies on amitriptyline as a model substrate. J Pharmacol Exp Ther. 2001 Apr;297(1):326-37. | ||||
| 35 | Metabolite Profiling and Reaction Phenotyping for the in Vitro Assessment of the Bioactivation of Bromfenac ? Chem Res Toxicol. 2020 Jan 21;33(1):249-257. doi: 10.1021/acs.chemrestox.9b00268. | ||||
| 36 | Regulation of CYP2B6 in primary human hepatocytes by prototypical inducers. Drug Metab Dispos. 2004 Mar;32(3):348-58. | ||||
| 37 | FDA label of Cenobamate. The 2020 official website of the U.S. Food and Drug Administration. | ||||
| 38 | In vitro characterization of clobazam metabolism by recombinant cytochrome P450 enzymes: importance of CYP2C19. Drug Metab Dispos. 2004 Nov;32(11):1279-86. | ||||
| 39 | The effect of cyclophosphamide with and without dexamethasone on cytochrome P450 3A4 and 2B6 in human hepatocytes. Drug Metab Dispos. 2002 Jul;30(7):814-22. | ||||
| 40 | Evaluation of CYP2B6 induction and prediction of clinical drug-drug interactions: considerations from the IQ consortium induction working group-an industry perspective. Drug Metab Dispos. 2016 Oct;44(10):1720-30. | ||||
| 41 | Molecular characterization of CYP2B6 substrates. Curr Drug Metab. 2008 Jun;9(5):363-73. | ||||
| 42 | Reappraisal of human CYP isoforms involved in imipramine N-demethylation and 2-hydroxylation: a study using microsomes obtained from putative extensive and poor metabolizers of S-mephenytoin and eleven recombinant human CYPs. J Pharmacol Exp Ther. 1997 Jun;281(3):1199-210. | ||||
| 43 | Human cytochrome P450s involved in the metabolism of 9-cis- and 13-cis-retinoic acids | ||||
| 44 | Effects of rifampin on the pharmacokinetics of a single dose of istradefylline in healthy subjects. J Clin Pharmacol. 2018 Feb;58(2):193-201. | ||||
| 45 | Further characterization of the expression in liver and catalytic activity of CYP2B6. J Pharmacol Exp Ther. 1998 Sep;286(3):1253-9. | ||||
| 46 | PharmGKB summary: phenytoin pathway. Pharmacogenet Genomics. 2012 Jun;22(6):466-70. | ||||
| 47 | In vitro metabolism of exemestane by hepatic cytochrome P450s: impact of nonsynonymous polymorphisms on formation of the active metabolite 17-dihydroexemestane Pharmacol Res Perspect. 2017 Apr 27;5(3):e00314. doi: 10.1002/prp2.314. | ||||
| 48 | In vitro identification of the human cytochrome p450 enzymes involved in the oxidative metabolism of loxapine. Biopharm Drug Dispos. 2011 Oct;32(7):398-407. | ||||
| 49 | Malathion bioactivation in the human liver: the contribution of different cytochrome p450 isoforms. Drug Metab Dispos. 2005 Mar;33(3):295-302. | ||||
| 50 | Ospemifene metabolism in humans in vitro and in vivo: metabolite identification, quantitation, and CYP assignment of major hydroxylations. Drug Metabol Drug Interact. 2013;28(3):153-61. | ||||
| 51 | Involvement of human cytochrome P450 2B6 in the omega- and 4-hydroxylation of the anesthetic agent propofol. Xenobiotica. 2007 Jul;37(7):717-24. | ||||
| 52 | Clinical pharmacology of tramadol. Clin Pharmacokinet. 2004;43(13):879-923. | ||||
| 53 | Cytochrome P450-mediated metabolism of triclosan attenuates its cytotoxicity in hepatic cells | ||||
| 54 | Identification of the cytochrome P450 and other enzymes involved in the in vitro oxidative metabolism of a novel antidepressant, Lu AA21004. Drug Metab Dispos. 2012 Jul;40(7):1357-65. | ||||
| 55 | More methemoglobin is produced by benzocaine treatment than lidocaine treatment in human in vitro systems | ||||
| 56 | Drugs that may have potential CYP2B6 interactions. | ||||
| 57 | The impact of individual human cytochrome P450 enzymes on oxidative metabolism of anticancer drug lenvatinib | ||||
| 58 | N-demethylation of levo-alpha-acetylmethadol by human placental aromatase. Biochem Pharmacol. 2004 Mar 1;67(5):885-92. | ||||
| 59 | Identification of cytochrome P450 isoforms involved in the metabolism of loperamide in human liver microsomes. Eur J Clin Pharmacol. 2004 Oct;60(8):575-81. | ||||
| 60 | Methadone metabolism and drug-drug interactions: in vitro and in vivo literature review. J Pharm Sci. 2018 Dec;107(12):2983-2991. | ||||
| 61 | Role of specific cytochrome P450 enzymes in the N-oxidation of the antiarrhythmic agent mexiletine. Xenobiotica. 2003 Jan;33(1):13-25. | ||||
| 62 | Effects of olopatadine, a new antiallergic agent, on human liver microsomal cytochrome P450 activities Drug Metab Dispos. 2002 Dec;30(12):1504-11. doi: 10.1124/dmd.30.12.1504. | ||||
| 63 | Timolol metabolism in human liver microsomes is mediated principally by CYP2D6. Drug Metab Dispos. 2007 Jul;35(7):1135-41. | ||||
| 64 | Development, validation and application of the liquid chromatography tandem mass spectrometry method for simultaneous quantification of azilsartan medoxomil (TAK-491), azilsartan (TAK-536), and its 2 metabolites in human plasma | ||||
| 65 | Drug Interactions with Angiotensin Receptor Blockers: Role of Human Cytochromes P450 | ||||
| 66 | Lithium Intoxication in the Elderly: A Possible Interaction between Azilsartan, Fluvoxamine, and Lithium | ||||
| 67 | Critical evaluation of the efficacy and tolerability of azilsartan | ||||
| 68 | Oxidative metabolism of flunarizine and cinnarizine by microsomes from B-lymphoblastoid cell lines expressing human cytochrome P450 enzymes. Biol Pharm Bull. 1996 Nov;19(11):1511-4. | ||||
| 69 | Clopidogrel pathway. Pharmacogenet Genomics. 2010 Jul;20(7):463-5. | ||||
| 70 | LABEL:DDYI- flibanserin tablet, film coated | ||||
| 71 | Differential N-demethylation of l-alpha-acetylmethadol (LAAM) and norLAAM by cytochrome P450s 2B6, 2C18, and 3A4 | ||||
| 72 | Evaluation of the effects of the weak CYP3A inhibitors atorvastatin and ethinyl estradiol/norgestimate on lomitapide pharmacokinetics in healthy subjects. J Clin Pharmacol. 2016 Jan;56(1):47-55. | ||||
| 73 | Metabolism of loratadine and further characterization of its in vitro metabolites. Drug Metab Lett. 2009 Aug;3(3):162-70. | ||||
| 74 | Moxidectin and the avermectins: Consanguinity but not identity | ||||
| 75 | The evolution of antiplatelet therapy in the treatment of acute coronary syndromes: from aspirin to the present day. Drugs. 2012 Nov 12;72(16):2087-116. | ||||
| 76 | Physiologically Based Pharmacokinetic Modeling of Transdermal Selegiline and Its Metabolites for the Evaluation of Disposition Differences between Healthy and Special Populations | ||||
| 77 | Evaluation of metabolism dependent inhibition of CYP2B6 mediated bupropion hydroxylation in human liver microsomes by monoamine oxidase inhibitors and prediction of potential as perpetrators of drug interaction. Chem Biol Interact. 2015 Mar 25;230:9-20. | ||||
| 78 | Influence of CYP2B6 and CYP2C19 polymorphisms on sertraline metabolism in major depression patients. Int J Clin Pharm. 2016 Apr;38(2):388-94. | ||||
| 79 | Sigmoidal kinetic model for two co-operative substrate-binding sites in a cytochrome P450 3A4 active site: an example of the metabolism of diazepam and its derivatives. Biochem J. 1999 Jun 15;340 ( Pt 3):845-53. | ||||
| 80 | FDA label of Fedratinib. The 2020 official website of the U.S. Food and Drug Administration. | ||||
| 81 | FDA Label of Enasidenib. The 2020 official website of the U.S. Food and Drug Administration. | ||||
| 82 | Metabolism of epinastine, a histamine H1 receptor antagonist, in human liver microsomes in comparison with that of terfenadine. Res Commun Mol Pathol Pharmacol. 1997 Dec;98(3):273-92. | ||||
| 83 | Cross-species comparisons of the pharmacokinetics of ibudilast | ||||
| 84 | Metabolism of Meloxicam in human liver involves cytochromes P4502C9 and 3A4. Xenobiotica. 1998 Jan;28(1):1-13. | ||||
| 85 | Human metabolic interactions of environmental chemicals. J Biochem Mol Toxicol. 2007;21(4):182-6. | ||||
| 86 | Cytochrome P450 2B6 activity as measured by bupropion hydroxylation: effect of induction by rifampin and ethnicity. Clin Pharmacol Ther. 2006 Jul;80(1):75-84. | ||||
| 87 | FDA Label of Romidepsin. The 2020 official website of the U.S. Food and Drug Administration. | ||||
| 88 | Epclusa- European Medicines Agency - European Union | ||||
| 89 | Preclinical Pharmacokinetics and First-in-Human Pharmacokinetics, Safety, and Tolerability of Velpatasvir, a Pangenotypic Hepatitis C Virus NS5A Inhibitor, in Healthy Subjects | ||||
| 90 | Human kidney methoxyflurane and sevoflurane metabolism. Intrarenal fluoride production as a possible mechanism of methoxyflurane nephrotoxicity. Anesthesiology. 1995 Mar;82(3):689-99. | ||||
| 91 | FDA label of Trifarotene. The 2020 official website of the U.S. Food and Drug Administration. | ||||
| 92 | Antimalarial artemisinin drugs induce cytochrome P450 and MDR1 expression by activation of xenosensors pregnane X receptor and constitutive androstane receptor. Mol Pharmacol. 2005 Jun;67(6):1954-65. | ||||
| 93 | Ketobemidone is a substrate for cytochrome P4502C9 and 3A4, but not for P-glycoprotein. Xenobiotica. 2005 Aug;35(8):785-96. | ||||
| 94 | In vitro metabolism of TAK-438, vonoprazan fumarate, a novel potassium-competitive acid blocker. Xenobiotica. 2017 Dec;47(12):1027-1034. | ||||
| 95 | Assessments of CYP?inhibition?based drug-drug interaction between vonoprazan and poziotinib in?vitro and in?vivo | ||||
| 96 | Identification of cytochrome P450 enzymes involved in the metabolism of zotepine, an antipsychotic drug, in human liver microsomes. Xenobiotica. 1999 Mar;29(3):217-29. | ||||
| 97 | Contribution of human hepatic cytochrome p450 isoforms to the metabolism of psychotropic drugs. Biol Pharm Bull. 2005 Sep;28(9):1711-6. | ||||
| 98 | CYP3A4 is the major CYP isoform mediating the in vitro hydroxylation and demethylation of flunitrazepam. Drug Metab Dispos. 2001 Feb;29(2):133-40. | ||||
| 99 | Australian Public Assessment Report for asunaprevir. | ||||
| 100 | Characterization of human cytochrome P450 enzymes catalyzing domperidone N-dealkylation and hydroxylation in vitro. Br J Clin Pharmacol. 2004 Sep;58(3):277-87. | ||||
| 101 | DrugBank(Pharmacology-Metabolism):BMS-986165 | ||||
| 102 | Disposition and metabolism of semagacestat, a {gamma}-secretase inhibitor, in humans. Drug Metab Dispos. 2010 Apr;38(4):554-65. | ||||
| 103 | CYP2B6, CYP2D6, and CYP3A4 catalyze the primary oxidative metabolism of perhexiline enantiomers by human liver microsomes. Drug Metab Dispos. 2007 Jan;35(1):128-38. | ||||
| 104 | Effect of azole antifungals ketoconazole and fluconazole on the pharmacokinetics of dexloxiglumide. Br J Clin Pharmacol. 2005 Nov;60(5):498-507. | ||||
| 105 | In vitro evaluation of fenfluramine and norfenfluramine as victims of drug interactions | ||||
| 106 | DrugBank(Pharmacology-Metabolism):TAK-491 | ||||
| 107 | DrugBank(Pharmacology-Metabolism):Ganaxolone | ||||
| 108 | DrugBank(Pharmacology-Metabolism):MRTX849 | ||||
| 109 | DrugBank(Pharmacology-Metabolism):Ag-221 | ||||
| 110 | Determination of an optimal dosing regimen for fexinidazole, a novel oral drug for the treatment of human African trypanosomiasis: first-in-human studies | ||||
| 111 | Fexinidazole--a new oral nitroimidazole drug candidate entering clinical development for the treatment of sleeping sickness. PLoS Negl Trop Dis. 2010 Dec 21;4(12):e923. | ||||
| 112 | Metabolism of the trisubstituted purine cyclin-dependent kinase inhibitor seliciclib (R-roscovitine) in vitro and in vivo. Drug Metab Dispos. 2008 Mar;36(3):561-70. | ||||
| 113 | Investigation of the major human hepatic cytochrome P450 involved in 4-hydroxylation and N-dechloroethylation of trofosfamide. Cancer Chemother Pharmacol. 1999;44(4):327-34. | ||||
| 114 | Human liver CYP2B6-catalyzed hydroxylation of RP 73401 | ||||
| 115 | Evaluation of the drug-drug interaction potential for trazpiroben (TAK-906), a D(2)/D(3) receptor antagonist for gastroparesis, towards cytochrome P450s and transporters | ||||
| 116 | Discovery of Encequidar, First-in-Class Intestine Specific P-glycoprotein Inhibitor | ||||
| 117 | Nonclinical pharmacokinetics and in vitro metabolism of H3B-6545, a novel selective ERalpha covalent antagonist (SERCA). Cancer Chemother Pharmacol. 2019 Jan;83(1):151-160. | ||||
| 118 | Inactivation of cytochrome P450 (P450) 3A4 but not P450 3A5 by OSI-930, a thiophene-containing anticancer drug | ||||
| 119 | An assessment of human liver-derived in vitro systems to predict the in vivo metabolism and clearance of almokalant | ||||
| 120 | In vitro metabolism of 7 neuronal nicotinic receptor agonist AZD0328 and enzyme identification for its N-oxide metabolite | ||||
| 121 | Main metabolic pathways of TAK-802, a novel drug candidate for voiding dysfunction, in humans: the involvement of carbonyl reduction by 11-hydroxysteroid dehydrogenase 1 | ||||
| 122 | In vitro metabolism studies of nomifensine monooxygenation pathways: metabolite identification, reaction phenotyping, and bioactivation mechanism | ||||
| 123 | Pharmacogenetic roles of CYP2C19 and CYP2B6 in the metabolism of R- and S-mephobarbital in humans. Pharmacogenetics. 2004 Aug;14(8):549-56. | ||||
| 124 | Tumor-selective drug activation: a GDEPT approach utilizing cytochrome P450 1A1 and AQ4N. Cancer Gene Ther. 2006 Jun;13(6):598-605. | ||||
| 125 | Identification of the cytochromes P450 that catalyze coumarin 3,4-epoxidation and 3-hydroxylation | ||||
| 126 | Species differences and interindividual variation in liver microsomal cytochrome P450 2A enzymes: effects on coumarin, dicumarol, and testosterone oxidation | ||||
| 127 | Urinary metabolites of dibutyl phthalate and benzophenone-3 are potential chemical risk factors of chronic kidney function markers among healthy women | ||||
| 128 | Orphenadrine and methimazole inhibit multiple cytochrome P450 enzymes in human liver microsomes. Drug Metab Dispos. 1997 Mar;25(3):390-3. | ||||
| 129 | In Vitro Regio- and Stereoselective Oxidation of -Ionone by Human Liver Microsomes | ||||
| 130 | The omega-hydroxlyation of lauric acid: oxidation of 12-hydroxlauric acid to dodecanedioic acid by a purified recombinant fusion protein containing P450 4A1 and NADPH-P450 reductase | ||||
| 131 | Cytochrome P450 4A11 inhibition assays based on characterization of lauric acid metabolites | ||||
| 132 | Roles of human CYP2A6 and 2B6 and rat CYP2C11 and 2B1 in the 10-hydroxylation of (-)-verbenone by liver microsomes. Drug Metab Dispos. 2003 Aug;31(8):1049-53. | ||||
| 133 | Effects of cytokine-induced macrophages on the response of tumor cells to banoxantrone (AQ4N) | ||||
| 134 | Bioreductively activated antitumor N-oxides: the case of AQ4N, a unique approach to hypoxia-activated cancer chemotherapy | ||||
| 135 | CYP2S1 is negatively regulated by corticosteroids in human cell lines. Toxicol Lett. 2012 Feb 25;209(1):30-4. | ||||
| 136 | Genetic toxicology and toxicokinetics of arecoline and related areca nut compounds: an updated review | ||||
| 137 | Synthesis, characterization, and antimalarial activity of the glucuronides of the hydroxylated metabolites of arteether | ||||
| 138 | Use of a physiologically-based pharmacokinetic model to simulate artemether dose adjustment for overcoming the drug-drug interaction with efavirenz In Silico Pharmacol. 2013 Mar 1;1:4. doi: 10.1186/2193-9616-1-4. | ||||
| 139 | DrugBank(Pharmacology-Metabolism)Artemether | ||||
| 140 | Identification of metabolic pathways involved in the biotransformation of tolperisone by human microsomal enzymes. Drug Metab Dispos. 2003 May;31(5):631-6. | ||||
| 141 | LABEL: JUXTAPID- lomitapide mesylate capsule | ||||
| 142 | DrugBank(Pharmacology-Metabolism):Deucravacitinib | ||||
| 143 | Metabolite profiling and reaction phenotyping for the in vitro assessment of the bioactivation of bromfenac. Chem Res Toxicol. 2020 Jan 21;33(1):249-257. | ||||
| 144 | Metabolic disposition of 14C-bromfenac in healthy male volunteers J Clin Pharmacol. 1998 Aug;38(8):744-52. doi: 10.1002/j.1552-4604.1998.tb04815.x. | ||||
| 145 | DrugBank(Pharmacology-Metabolism)Bupropion | ||||
| 146 | Carbamazepine and its metabolites in human perfused placenta and in maternal and cord blood Epilepsia. 1995 Mar;36(3):241-8. doi: 10.1111/j.1528-1157.1995.tb00991.x. | ||||
| 147 | Kinetics and metabolism of clobazam in animals and man | ||||
| 148 | The KEGG resource for deciphering the genome | ||||
| 149 | Aprepitant inhibits cyclophosphamide bioactivation and thiotepa metabolism | ||||
| 150 | LC-MS/MS analysis of dextromethorphan metabolism in human saliva and urine to determine CYP2D6 phenotype and individual variability in N-demethylation and glucuronidation J Chromatogr B Analyt Technol Biomed Life Sci. 2004 Dec 25;813(1-2):217-25. doi: 10.1016/j.jchromb.2004.09.040. | ||||
| 151 | Classics in Chemical Neuroscience: Dextromethorphan (DXM). ACS Chem Neurosci. 2023 Jun 21;14(12):2256-2270. doi: 10.1021/acschemneuro.3c00088. | ||||
| 152 | Study on the Pharmacokinetics of Diazepam and Its Metabolites in Blood of Chinese People Eur J Drug Metab Pharmacokinet. 2020 Aug;45(4):477-485. doi: 10.1007/s13318-020-00614-8. | ||||
| 153 | Pharmacokinetics of Diazepam and Its Metabolites in Urine of Chinese Participants. Drugs R D. 2022 Mar;22(1):43-50. doi: 10.1007/s40268-021-00375-y. | ||||
| 154 | Kinetic disposition of diazepam and its metabolites after intravenous administration of diazepam in the horse: Relevance for doping control. J Vet Pharmacol Ther. 2021 Sep;44(5):733-744. doi: 10.1111/jvp.12991. | ||||
| 155 | DrugBank(Pharmacology-Metabolism)Diazepam | ||||
| 156 | Plasma and synovial fluid concentrations of diclofenac sodium and its major hydroxylated metabolites during long-term treatment of rheumatoid arthritis Eur J Clin Pharmacol. 1983;25(3):389-94. doi: 10.1007/BF01037953. | ||||
| 157 | Simultaneous determination of diclofenac sodium and its hydroxy metabolites by capillary column gas chromatography with electron-capture detection J Chromatogr. 1981 Nov 6;217:263-71. doi: 10.1016/s0021-9673(00)88081-4. | ||||
| 158 | Identification of the human P-450 enzymes responsible for the sulfoxidation and thiono-oxidation of diethyldithiocarbamate methyl ester: role of P-450 enzymes in disulfiram bioactivation. Alcohol Clin Exp Res. 1998 Sep;22(6):1212-9. | ||||
| 159 | Induction of CYP3A4 by efavirenz in primary human hepatocytes: comparison with rifampin and phenobarbital. J Clin Pharmacol. 2004 Nov;44(11):1273-81. | ||||
| 160 | Biotransformation of Efavirenz and Proteomic Analysis of Cytochrome P450s and UDP-Glucuronosyltransferases in Mouse, Macaque, and Human Brain-Derived In Vitro Systems. Drug Metab Dispos. 2023 Apr;51(4):521-531. doi: 10.1124/dmd.122.001195. | ||||
| 161 | Liver Cirrhosis Affects the Pharmacokinetics of the Six Substrates of the Basel?Phenotyping Cocktail Differently. Clin Pharmacokinet. 2022 Jul;61(7):1039-1055. doi: 10.1007/s40262-022-01119-0. | ||||
| 162 | Instability of Efavirenz Metabolites Identified During Method Development and Validation. J Pharm Sci. 2021 Oct;110(10):3362-3366. doi: 10.1016/j.xphs.2021.06.028. | ||||
| 163 | FDA:Enasidenib | ||||
| 164 | Simultaneous measurement of epinastine and its metabolite, 9,13b-dehydroepinastine, in human plasma by a newly developed ultra-performance liquid chromatography-tandem mass spectrometry and its application to pharmacokinetic studies Biomed Chromatogr. 2020 Sep;34(9):e4848. doi: 10.1002/bmc.4848. | ||||
| 165 | In vitro metabolism of exemestane by hepatic cytochrome P450s: impact of nonsynonymous polymorphisms on formation of the active metabolite 17beta-dihydroexemestane. Pharmacol Res Perspect. 2017 Apr 27;5(3):e00314. | ||||
| 166 | U. S. FDA Label -Fenfluramine | ||||
| 167 | Pharmacogenomics knowledge for personalized medicine Clin Pharmacol Ther. 2012 Oct;92(4):414-7. doi: 10.1038/clpt.2012.96. | ||||
| 168 | (R)-, (S)-, and racemic fluoxetine N-demethylation by human cytochrome P450 enzymes. Drug Metab Dispos. 2000 Oct;28(10):1187-91. | ||||
| 169 | Simultaneous identification and quantitation of fluoxetine and its metabolite, norfluoxetine, in biological samples by GC-MS | ||||
| 170 | Ganaxolone | ||||
| 171 | Cytochromes P450: a structure-based summary of biotransformations using representative substrates Drug Metab Rev. 2008;40(1):1-100. doi: 10.1080/03602530802309742. | ||||
| 172 | DrugBank(Pharmacology-Metabolism):Hydrocodone bitartrate | ||||
| 173 | CYP2D6 and CYP3A4 involvement in the primary oxidative metabolism of hydrocodone by human liver microsomes. Br J Clin Pharmacol. 2004 Mar;57(3):287-97. | ||||
| 174 | 2-Chloroacetaldehyde-induced cerebral glutathione depletion and neurotoxicity | ||||
| 175 | PubChem : JNJ-54135419 | ||||
| 176 | The clinical toxicology of ketamine. Clin Toxicol (Phila). 2023 Jun;61(6):415-428. doi: 10.1080/15563650.2023.2212125. | ||||
| 177 | Pharmacokinetics of Ketamine Transfer Into Human Milk. J Clin Psychopharmacol. 2023 May 23. doi: 10.1097/JCP.0000000000001711. | ||||
| 178 | Chronic exposure to (2?R,6?R)-hydroxynorketamine induces developmental neurotoxicity in hESC-derived cerebral organoids. J Hazard Mater. 2023 Jul 5;453:131379. doi: 10.1016/j.jhazmat.2023.131379. | ||||
| 179 | Identification of the cytochrome P450 enzymes involved in the metabolism of domperidone. Xenobiotica. 2004 Nov-Dec;34(11-12):1013-23. | ||||
| 180 | A prospective longitudinal study of growth in twin gestations compared with growth in singleton pregnancies. I. The fetal head J Ultrasound Med. 1991 Aug;10(8):439-43. doi: 10.7863/jum.1991.10.8.439. | ||||
| 181 | Meperidine and normeperidine levels following meperidine administration during labor. I. Mother | ||||
| 182 | Effects of ethinyl estradiol on pharmacokinetics of meperidine and pentobarbital in the rat | ||||
| 183 | Impact of cytochrome P450 variation on meperidine N-demethylation to the neurotoxic metabolite normeperidine. Xenobiotica. 2020 Feb;50(2):209-222. | ||||
| 184 | Quantification of mephenytoin and its metabolites 4'-hydroxymephenytoin and nirvanol in human urine using a simple sample processing method | ||||
| 185 | Relation of in vivo drug metabolism to stereoselective fetal hydantoin toxicology in mouse: evaluation of mephenytoin and its metabolite, nirvanol | ||||
| 186 | Metamizole (Dipyrone) and the Liver: A Review of the Literature J Clin Pharmacol. 2019 Nov;59(11):1433-1442. doi: 10.1002/jcph.1512. | ||||
| 187 | Clinical pharmacokinetics of dipyrone and its metabolites Clin Pharmacokinet. 1995 Mar;28(3):216-34. doi: 10.2165/00003088-199528030-00004. | ||||
| 188 | Effects of cytochrome P450 single nucleotide polymorphisms on methadone metabolism and pharmacodynamics | ||||
| 189 | Synthetic and natural compounds that interact with human cytochrome P450 1A2 and implications in drug development. Curr Med Chem. 2009;16(31):4066-218. | ||||
| 190 | DrugBank(Pharmacology-Metabolism):Adagrasib | ||||
| 191 | Identification of human cytochrome P450 isozymes involved in the metabolism of naftopidil enantiomers in vitro. J Pharm Pharmacol. 2014 Nov;66(11):1534-51. | ||||
| 192 | Characterization of Ca(2+)-antagonistic effects of three metabolites of the new antihypertensive agent naftopidil, (naphthyl)hydroxy-naftopidil, (phenyl)hydroxy-naftopidil, and O-desmethyl-naftopidil J Cardiovasc Pharmacol. 1991 Dec;18(6):918-25. doi: 10.1097/00005344-199112000-00020. | ||||
| 193 | U. S. FDA Label -Nevirapine | ||||
| 194 | U. S. FDA Label -Nicotine | ||||
| 195 | Pharmacokinetics, Metabolite Measurement, and Biomarker Identification of Dermal Exposure to Permethrin Using Accelerator Mass Spectrometry. Toxicol Sci. 2021 Aug 30;183(1):49-59. doi: 10.1093/toxsci/kfab082. | ||||
| 196 | Validation of enantioseparation and quantitation of an active metabolite of abrocitinib in human plasma | ||||
| 197 | DrugBank(Pharmacology-Metabolism)Phenobarbital | ||||
| 198 | Quantitation of N-(3,5-dichloropyrid-4-yl)-3-cyclopentyloxy-4-methoxybenzamide and 4-amino-3,5-dichloropyridine in rat and mouse plasma by LC/MS/MS | ||||
| 199 | Determination of the active and inactive metabolites of prasugrel in human plasma by liquid chromatography/tandem mass spectrometry Rapid Commun Mass Spectrom. 2007;21(2):169-79. doi: 10.1002/rcm.2813. | ||||
| 200 | Interactions of fentanyl with blood platelets and plasma proteins: platelet sensitivity to prasugrel metabolite is not affected by fentanyl under in vitro conditions. Pharmacol Rep. 2023 Apr;75(2):423-441. doi: 10.1007/s43440-023-00447-7. | ||||
| 201 | Pharmacokinetic and Pharmacodynamic Modeling and Simulation Analysis of Prasugrel in Healthy Male Volunteers. Clin Pharmacol Drug Dev. 2023 Jan;12(1):21-29. doi: 10.1002/cpdd.1172. | ||||
| 202 | Identification of cytochrome P450 enzymes involved in the metabolism of FK228, a potent histone deacetylase inhibitor, in human liver microsomes. Biol Pharm Bull. 2005 Jan;28(1):124-9. | ||||
| 203 | Comparative studies on the cytochrome p450-associated metabolism and interaction potential of selegiline between human liver-derived in vitro systems. Drug Metab Dispos. 2003 Sep;31(9):1093-102. | ||||
| 204 | Detection of l-Methamphetamine and l-Amphetamine as Selegiline Metabolites. J Anal Toxicol. 2021 Feb 6;45(1):99-104. doi: 10.1093/jat/bkaa058. | ||||
| 205 | Sertraline is metabolized by multiple cytochrome P450 enzymes, monoamine oxidases, and glucuronyl transferases in human: an in vitro study. Drug Metab Dispos. 2005 Feb;33(2):262-70. | ||||
| 206 | Pharmacogenetic Testing and Therapeutic Drug Monitoring Of Sertraline at a Residential Treatment Center for Children and Adolescents: A Pilot Study. Innov Pharm. 2022 Dec 26;13(4):10.24926/iip.v13i4.5035. doi: 10.24926/iip.v13i4.5035. | ||||
| 207 | Sertraline. 2022 May 15. Drugs and Lactation Database (LactMed?) [Internet]. Bethesda (MD): National Institute of Child Health and Human Development; 2006C. | ||||
| 208 | Neonicotinoids and pharmaceuticals in hair of the Red fox (Vulpes vulpes) from the Cavallino-Treporti peninsula, Italy. Environ Res. 2023 Jul 1;228:115837. doi: 10.1016/j.envres.2023.115837. | ||||
| 209 | Metabolism of tamoxifen by recombinant human cytochrome P450 enzymes: formation of the 4-hydroxy, 4'-hydroxy and N-desmethyl metabolites and isomerization of trans-4-hydroxytamoxifen. Drug Metab Dispos. 2002 Aug;30(8):869-74. | ||||
| 210 | Endoxifen and other metabolites of tamoxifen inhibit human hydroxysteroid sulfotransferase 2A1 (hSULT2A1). Drug Metab Dispos. 2014 Nov;42(11):1843-50. | ||||
| 211 | Metabolism and transport of tamoxifen in relation to its effectiveness: new perspectives on an ongoing controversy. Future Oncol. 2014 Jan;10(1):107-22. | ||||
| 212 | The tamoxifen dilemma. Carcinogenesis. 1999 Jul;20(7):1153-60. | ||||
| 213 | Pharmacokinetics and metabolism of temazepam in man and several animal species Br J Clin Pharmacol. 1979;8(1):23S-29S. doi: 10.1111/j.1365-2125.1979.tb00451.x. | ||||
| 214 | Human liver microsomal diazepam metabolism using cDNA-expressed cytochrome P450s: role of CYP2B6, 2C19 and the 3A subfamily. Xenobiotica. 1996 Nov;26(11):1155-66. | ||||
| 215 | Multiple cytochrome P-450s involved in the metabolism of terbinafine suggest a limited potential for drug-drug interactions. Drug Metab Dispos. 1999 Sep;27(9):1029-38. | ||||
| 216 | A multi-residue chiral liquid chromatography coupled with tandem mass spectrometry method for analysis of antifungal agents and their metabolites in aqueous environmental matrices. Anal Methods. 2021 Jun 14;13(22):2466-2477. doi: 10.1039/d1ay00556a. | ||||
| 217 | DrugBank(Pharmacology-Metabolism):Ticlopidine | ||||
| 218 | Trends in Tramadol: Pharmacology, Metabolism, and Misuse Anesth Analg. 2017 Jan;124(1):44-51. doi: 10.1213/ANE.0000000000001683. | ||||
| 219 | Simultaneous LC-MS/MS quantification of oxycodone, tramadol and fentanyl and their metabolites (noroxycodone, oxymorphone, O- desmethyltramadol, N- desmethyltramadol, and norfentanyl) in human plasma and whole blood collected via venepuncture and volumetric absorptive micro sampling. J Pharm Biomed Anal. 2021 Sep 5;203:114171. doi: 10.1016/j.jpba.2021.114171. | ||||
| 220 | Identification of human cytochrome P450s involved in the formation of all-trans-retinoic acid principal metabolites. Mol Pharmacol. 2000 Dec;58(6):1341-8. | ||||
| 221 | Retinoic acid metabolism and mechanism of action: a review | ||||
| 222 | LABEL:KLIEF- trifarotene cream | ||||
| 223 | A simple and sensitive HPLC-FL method for bioanalysis of velpatasvir, a novel hepatitis C virus NS5A inhibitor, in rat plasma: Investigation of factors determining its oral bioavailability J Chromatogr B Analyt Technol Biomed Life Sci. 2022 Oct 1;1208:123399. doi: 10.1016/j.jchromb.2022.123399. | ||||
| 224 | Vonoprazan fumarate, a novel potassium-competitive acid blocker, in the management of gastroesophageal reflux disease: safety and clinical evidence to date | ||||
| 225 | Vortioxetine: clinical pharmacokinetics and drug interactions. Clin Pharmacokinet. 2018 Jun;57(6):673-686. | ||||
| 226 | FDA Approved Drug Products:Oxbryta (voxelotor) tablets | ||||
| 227 | BioTransformer: a comprehensive computational tool for small molecule metabolism prediction and metabolite identification | ||||
| 228 | Metabolism and transport of oxazaphosphorines and the clinical implications Drug Metab Rev. 2005;37(4):611-703. doi: 10.1080/03602530500364023. | ||||
| 229 | Norzotepine, a major metabolite of zotepine, exerts atypical antipsychotic-like and antidepressant-like actions through its potent inhibition of norepinephrine reuptake | ||||
If you find any error in data or bug in web service, please kindly report it to Dr. Yin and Dr. Li.