

Details of Drug-Metabolizing Enzyme (DME)
| Full List of Drug(s) Metabolized by This DME | |||||
|---|---|---|---|---|---|
| Drugs Approved by FDA | Click to Show/Hide the Full List of Drugs: 124 Drugs | ||||
Darolutamide |
Drug Info | Approved | Prostate cancer | ICD11: 2C82 | [1] |
Tamoxifen citrate |
Drug Info | Approved | Breast cancer | ICD11: 2C60 | [2] |
Nintedanib esylate |
Drug Info | Approved | Idiopathic pulmonary fibrosis | ICD11: CB03 | [3] |
Warfarin sodium |
Drug Info | Approved | Atrial fibrillation | ICD11: BC81 | [4] |
Estradiol acetate |
Drug Info | Approved | Acquired prion disease | ICD11: 8E01 | [5] |
Estradiol cypionate |
Drug Info | Approved | Acquired prion disease | ICD11: 8E01 | [5] |
Estradiol valerate |
Drug Info | Approved | Acquired prion disease | ICD11: 8E01 | [5] |
Methylphenidate |
Drug Info | Approved | Attention deficit hyperactivity disorder | ICD11: 6A05 | [6] |
Nicotine |
Drug Info | Approved | Nicotine dependence | ICD11: 6C4A | [7] |
Atazanavir |
Drug Info | Approved | Human immunodeficiency virus infection | ICD11: 1C60 | [8] |
Dronabinol |
Drug Info | Approved | Anorexia nervosa | ICD11: 6B80 | [9] |
Ibrutinib |
Drug Info | Approved | Mantle cell lymphoma | ICD11: 2A85 | [10] |
Naloxone |
Drug Info | Approved | Opiate dependence | ICD11: 6C43 | [11] |
Metronidazole |
Drug Info | Approved | Amebiasis | ICD11: 1A36 | [12] |
Cannabidiol |
Drug Info | Approved | Lennox-Gastaut syndrome | ICD11: 8A62 | [13] |
Clomipramine hydrochloride |
Drug Info | Approved | Obsessive-compulsive disorder | ICD11: 6B20 | [14] |
Ethinyl estradiol |
Drug Info | Approved | Menopausal disorder | ICD11: GA30 | [12] |
Mycophenolate mofetil |
Drug Info | Approved | Crohn disease | ICD11: DD70 | [15] |
Valproic acid |
Drug Info | Approved | Epilepsy | ICD11: 8A60 | [16] |
Cyproheptadine |
Drug Info | Approved | Rheumatoid arthritis | ICD11: FA20 | [17] |
Febuxostat |
Drug Info | Approved | Hyperuricaemia | ICD11: 5C55 | [18] |
Labetalol |
Drug Info | Approved | Essential hypertension | ICD11: BA00 | [19] |
Opicapone |
Drug Info | Approved | Parkinsonism | ICD11: 8A00 | [20] |
Chenodeoxycholic acid |
Drug Info | Approved | Cholelithiasis | ICD11: DC11 | [21] |
Hydrocodone bitartrate |
Drug Info | Approved | Neuropathic pain | ICD11: 8E43 | [22] |
Indinavir sulfate |
Drug Info | Approved | Human immunodeficiency virus infection | ICD11: 1C60 | [23] |
Suprofen |
Drug Info | Approved | Iris sphincter disorder | ICD11: 9B01 | [9] |
Axitinib |
Drug Info | Approved | Renal cell carcinoma | ICD11: 2C90 | [24] |
Carvedilol |
Drug Info | Approved | Congestive heart failure | ICD11: BD10 | [12] |
Digitoxin |
Drug Info | Approved | Congestive heart failure | ICD11: BD10 | [25] |
Estriol |
Drug Info | Approved | Menopausal disorder | ICD11: GA30 | [26] |
Formoterol |
Drug Info | Approved | Asthma | ICD11: CA23 | [27] |
Ketoprofen |
Drug Info | Approved | Anaesthesia | ICD11: 8E22 | [28] |
Lasofoxifene |
Drug Info | Approved | Osteoporosis | ICD11: FB83 | [29] |
Minoxidil |
Drug Info | Approved | Essential hypertension | ICD11: BA00 | [30] |
Naproxen |
Drug Info | Approved | Rheumatoid arthritis | ICD11: FA20 | [31] |
Repaglinide |
Drug Info | Approved | Diabetes mellitus | ICD11: 5A10 | [32] |
Amitriptyline hydrochloride |
Drug Info | Approved | Depression | ICD11: 6A71 | [7] |
Belinostat |
Drug Info | Approved | Anaplastic large cell lymphoma | ICD11: 2A90 | [33] |
Codeine |
Drug Info | Approved | Anaesthesia | ICD11: 8E22 | [34] |
Deferasirox |
Drug Info | Approved | Hyperphosphatemia | ICD11: 5C64 | [35] |
Desvenlafaxine |
Drug Info | Approved | Major depressive disorder | ICD11: 6A70-6A7Z | [36] |
Dolutegravir sodium |
Drug Info | Approved | Human immunodeficiency virus infection | ICD11: 1C60 | [37] |
Dolutegravir sodium |
Drug Info | Approved | Human immunodeficiency virus infection | ICD11: 1C60 | [38] |
Dronedarone hydrochloride |
Drug Info | Approved | Atrial fibrillation | ICD11: BC81 | [39] |
Eslicarbazepine acetate |
Drug Info | Approved | Epilepsy | ICD11: 8A60 | [40] |
Eslicarbazepine acetate |
Drug Info | Approved | Epilepsy | ICD11: 8A60 | [41] |
Etodolac |
Drug Info | Approved | Rheumatoid arthritis | ICD11: FA20 | [42] |
Exjade |
Drug Info | Approved | Hyperphosphatemia | ICD11: 5C64 | [43] |
Ibuprofen |
Drug Info | Approved | Anaesthesia | ICD11: 8E22 | [44], [9] |
Imipramine hydrochloride |
Drug Info | Approved | Depression | ICD11: 6A71 | [7] |
Indomethacin |
Drug Info | Approved | Rheumatoid arthritis | ICD11: FA20 | [45] |
Letermovir |
Drug Info | Approved | Cytomegalovirus infection | ICD11: 1D82 | [46] |
Mercaptopurine |
Drug Info | Approved | Acute lymphoblastic leukemia | ICD11: 2B33 | [47] |
Morphine |
Drug Info | Approved | Anaesthesia | ICD11: 8E22 | [48] |
Morphine |
Drug Info | Approved | Anaesthesia | ICD11: 8E22 | [44], [49], [50] |
Oxymetazoline |
Drug Info | Approved | Erythema multiforme | ICD11: EB12 | [51] |
Phenytoin |
Drug Info | Approved | Epilepsy | ICD11: 8A60 | [44] |
Probenecid |
Drug Info | Approved | Hyperuricaemia | ICD11: 5C55 | [52] |
Rilpivirine hydrochloride |
Drug Info | Approved | Human immunodeficiency virus infection | ICD11: 1C60 | [53] |
Riluzole |
Drug Info | Approved | Amyotrophic lateral sclerosis | ICD11: 8B60 | [54] |
Rucaparib |
Drug Info | Approved | Ovarian cancer | ICD11: 2C73 | [55] |
Simvastatin |
Drug Info | Approved | Dyslipidaemia | ICD11: 5C81 | [56] |
Abacavir |
Drug Info | Approved | Human immunodeficiency virus infection | ICD11: 1C60 | [57] |
Anastrozole |
Drug Info | Approved | Breast cancer | ICD11: 2C60 | [58] |
Aspirin |
Drug Info | Approved | Myocardial infarction | ICD11: BA41 | [59] |
Atorvastatin calcium |
Drug Info | Approved | Dyslipidaemia | ICD11: 5C81 | [60] |
Buprenorphine hydrochloride |
Drug Info | Approved | Anaesthesia | ICD11: 8E22 | [61] |
Clofazimine |
Drug Info | Approved | Crohn disease | ICD11: DD70 | [62] |
Epinephrine hydrochloride |
Drug Info | Approved | Allergy | ICD11: 4A80 | [63] |
Gemfibrozil |
Drug Info | Approved | Hypertriglyceridaemia | ICD11: 5C80 | [64] |
Glipizide |
Drug Info | Approved | Diabetes mellitus | ICD11: 5A10 | [12] |
Intedanib |
Drug Info | Approved | Idiopathic pulmonary fibrosis | ICD11: CB03 | [65] |
Levothyroxine sodium |
Drug Info | Approved | Hypothyroidism | ICD11: 5A00 | [12] |
Liothyronine |
Drug Info | Approved | Hypothyroidism | ICD11: 5A00 | [66] |
Propofol |
Drug Info | Approved | Anaesthesia | ICD11: 8E22 | [67] |
Raloxifene |
Drug Info | Approved | Osteoporosis | ICD11: FB83 | [12] |
Tecovirimat |
Drug Info | Approved | Smallpox | ICD11: 1E70 | [68] |
Acetaminophen |
Drug Info | Approved | Anaesthesia | ICD11: 8E22 | [69] |
Binimetinib |
Drug Info | Approved | Melanoma | ICD11: 2C30 | [70] |
Candesartan cilexetil |
Drug Info | Approved | Essential hypertension | ICD11: BA00 | [71] |
Desloratadine |
Drug Info | Approved | Allergic rhinitis | ICD11: CA08 | [72] |
Etoposide |
Drug Info | Approved | Lung cancer | ICD11: 2C25 | [73] |
Ezetimibe |
Drug Info | Approved | Hypertriglyceridaemia | ICD11: 5C80 | [74] |
Lamotrigine |
Drug Info | Approved | Bipolar disorder | ICD11: 6A60 | [12] |
Losartan potassium |
Drug Info | Approved | Essential hypertension | ICD11: BA00 | [71] |
Lovastatin |
Drug Info | Approved | Hypertriglyceridaemia | ICD11: 5C80 | [56] |
Mycophenolic acid |
Drug Info | Approved | Crohn disease | ICD11: DD70 | [44], [75] |
Mycophenolic acid |
Drug Info | Approved | Crohn disease | ICD11: DD70 | [76] |
Pitavastatin calcium |
Drug Info | Approved | Hypertriglyceridaemia | ICD11: 5C80 | [77] |
Riociguat |
Drug Info | Approved | Pulmonary hypertension | ICD11: BB01 | [78] |
Selinexor |
Drug Info | Approved | Multiple myeloma | ICD11: 2A83 | [79] |
Troglitazone |
Drug Info | Approved | Diabetes mellitus | ICD11: 5A10 | [80] |
Zidovudine |
Drug Info | Approved | Human immunodeficiency virus infection | ICD11: 1C60 | [81] |
Cerivastatin sodium |
Drug Info | Approved | Hypertriglyceridaemia | ICD11: 5C80 | [82] |
Diflunisal |
Drug Info | Approved | Anaesthesia | ICD11: 8E22 | [83] |
Edaravone |
Drug Info | Approved | Cerebral stroke | ICD11: 8B11 | [84] |
Eltrombopag olamine |
Drug Info | Approved | Thrombocytopenia | ICD11: 3B64 | [85] |
Elvitegravir |
Drug Info | Approved | Human immunodeficiency virus infection | ICD11: 1C60 | [86] |
Flurbiprofen sodium |
Drug Info | Approved | Rheumatoid arthritis | ICD11: FA20 | [87] |
Furosemide |
Drug Info | Approved | Congestive heart failure | ICD11: BD10 | [12] |
Hesperidin |
Drug Info | Approved | Vascular purpura | ICD11: 3B60 | [88] |
Hydromorphone |
Drug Info | Approved | Anaesthesia | ICD11: 8E22 | [89] |
Loratadine |
Drug Info | Approved | Allergic rhinitis | ICD11: CA08 | [90] |
Oxazepam |
Drug Info | Approved | Anxiety disorder | ICD11: 6B00 | [91] |
Selexipag |
Drug Info | Approved | Pulmonary hypertension | ICD11: BB01 | [92] |
Tiagabine |
Drug Info | Approved | Epilepsy | ICD11: 8A60 | [93] |
Vericiguat |
Drug Info | Approved | Heart failure | ICD11: BD10-BD1Z | [94] |
Vorinostat |
Drug Info | Approved | Cutaneous T-cell lymphoma | ICD11: 2B01 | [95] |
Voxelotor |
Drug Info | Approved | Sickle-cell anaemia | ICD11: 3A51 | [96] |
Zonisamide |
Drug Info | Approved | Epilepsy | ICD11: 8A60 | [93] |
Delafloxacin |
Drug Info | Approved | Methicillin-resistant staphylococcus infection | ICD11: 1D01 | [97] |
Enasidenib |
Drug Info | Approved | Acute myeloid leukaemia | ICD11: 2A60 | [98] |
Fulvestrant |
Drug Info | Approved | Breast cancer | ICD11: 2C60 | [99] |
Hydroxyprogesterone caproate |
Drug Info | Approved | Uterine cancer | ICD11: 2C76 | [100] |
Indacaterol maleate |
Drug Info | Approved | Chronic obstructive pulmonary disease | ICD11: CA22 | [101] |
Lenacapavir |
Drug Info | Approved | Discovery agent | ICD: N.A. | [102] |
Naltrexone |
Drug Info | Approved | Alcohol dependence | ICD11: 6C40 | [103] |
Posaconazole |
Drug Info | Approved | Candidiasis | ICD11: 1F23 | [104] |
Raltegravir potassium |
Drug Info | Approved | Human immunodeficiency virus infection | ICD11: 1C60 | [105] |
Sacituzumab govitecan |
Drug Info | Approved | Discovery agent | ICD: N.A. | [106] |
Telmisartan |
Drug Info | Approved | Essential hypertension | ICD11: BA00 | [107] |
Meprobamate |
Drug Info | Approved | Anxiety disorder | ICD11: 6B00 | [108] |
LAROPIPRANT |
Drug Info | Phase 4 | Atherosclerosis | ICD11: BA80 | [111] |
| Drugs in Phase 4 Clinical Trial | Click to Show/Hide the Full List of Drugs: 11 Drugs | ||||
Ethinylestradiol propanesulfonate |
Drug Info | Phase 4 | Prostate cancer | ICD11: 2C82 | [109], [110] |
Glibenclamide |
Drug Info | Phase 4 | Diabetes mellitus | ICD11: 5A10 | [45] |
Pirprofen |
Drug Info | Phase 4 | Rheumatoid arthritis | ICD11: FA20 | [112] |
Tranilast |
Drug Info | Phase 4 | Conjunctivitis | ICD11: 9A60 | [113], [114] |
Androstanolone |
Drug Info | Phase 4 | Hypogonadism | ICD11: 5A61 | [115] |
Phenolphthalein |
Drug Info | Phase 4 | Irritable bowel syndrome | ICD11: DD91 | [116] |
Retigabine |
Drug Info | Phase 4 | Epilepsy | ICD11: 8A60 | [117] |
Silymarin |
Drug Info | Phase 4 | Fatty liver disease | ICD11: DB92 | [118] |
Bazedoxifene |
Drug Info | Phase 4 | Schizophrenia | ICD11: 6A20 | [119] |
Dexibuprofen |
Drug Info | Phase 4 | Osteoarthritis | ICD11: FA00 | [9] |
Oleandomycin |
Drug Info | Phase 4 | Acute upper respiratory infection | ICD11: CA07 | [120] |
| Drugs in Phase 3 Clinical Trial | Click to Show/Hide the Full List of Drugs: 18 Drugs | ||||
E-3A |
Drug Info | Phase 3 | Turner syndrome | ICD11: LD50 | [5] |
Selumetinib |
Drug Info | Phase 3 | Neurofibromatosis | ICD11: LD2D | [121] |
AKB-6548 |
Drug Info | Phase 3 | Anaemia | ICD11: 3A90 | [122] |
BMS-298585 |
Drug Info | Phase 3 | Diabetes mellitus | ICD11: 5A10 | [123] |
Curcumin |
Drug Info | Phase 3 | Stomach cancer | ICD11: 2B72 | [124] |
LAU-7b |
Drug Info | Phase 3 | Macular degeneration | ICD11: 9B78 | [125] |
Bexagliflozin |
Drug Info | Phase 3 | Type-2 diabetes | ICD11: 5A11 | [126] |
CEM-102 |
Drug Info | Phase 3 | Endocarditis | ICD11: 1B12 | [127] |
Heroin |
Drug Info | Phase 3 | Opiate dependence | ICD11: 6C43 | [128] |
AD-5423 |
Drug Info | Phase 3 | Schizophrenia | ICD11: 6A20 | [129] |
Losartan |
Drug Info | Phase 3 | Hypertension | ICD11: BA00-BA04 | [71] |
YKP-509 |
Drug Info | Phase 3 | Dyskinesia | ICD11: 8A02 | [130] |
LNP023 |
Drug Info | Phase 3 | IgA nephropathy | ICD11: MF8Y | [131] |
Etirinotecan pegol |
Drug Info | Phase 3 | Breast cancer | ICD11: 2C60-2C6Y | [132] |
LCQ908-NXA |
Drug Info | Phase 3 | Hypertriglyceridaemia | ICD11: 5C80 | [133] |
KAD-1229 |
Drug Info | Phase 3 | Diabetes mellitus | ICD11: 5A10 | [134] |
Ag-221 |
Drug Info | Phase 3 | Acute myelogenous leukaemia | ICD11: 2A41 | [135] |
Atorvastatin |
Drug Info | Phase 3 | Hypertriglyceridaemia | ICD11: 5C80 | [136] |
| Drugs in Phase 2 Clinical Trial | Click to Show/Hide the Full List of Drugs: 20 Drugs | ||||
ENT-1814 |
Drug Info | Phase 2/3 | Bell palsy | ICD11: 8B88 | [137] |
Puerarin |
Drug Info | Phase 2 | Alcohol dependence | ICD11: 6C40 | [138] |
BAICALEIN |
Drug Info | Phase 2 | Influenza virus infection | ICD11: 1E30-1E32 | [139] |
Ethanol |
Drug Info | Phase 2 | Diabetic nephropathy | ICD11: GB61 | [140] |
LJN452 |
Drug Info | Phase 2 | Primary biliary cholangitis | ICD11: DB96 | [141] |
PT2385 |
Drug Info | Phase 2 | Von hippel-lindau disease | ICD11: 5A75 | [142] |
BCP-13498 |
Drug Info | Phase 2 | Anaesthesia | ICD11: 8E22 | [143] |
GSK-1265744 |
Drug Info | Phase 2 | Human immunodeficiency virus infection | ICD11: 1C60 | [144] |
AMG 232 |
Drug Info | Phase 2 | Merkel cell carcinoma | ICD11: 2C34 | [145] |
BIA 3-202 |
Drug Info | Phase 2 | Parkinsonism | ICD11: 8A00 | [146] |
AUS-131 |
Drug Info | Phase 2 | Prostatic hyperplasia | ICD11: GA90 | [147] |
ABT-751 |
Drug Info | Phase 2 | Breast cancer | ICD11: 2C60 | [148] |
AR-67 |
Drug Info | Phase 2 | Brain cancer | ICD11: 2A00 | [149] |
BN-1270 |
Drug Info | Phase 2 | Pulmonary hypertension | ICD11: BB01 | [150] |
VS-6063 |
Drug Info | Phase 2 | Mesothelioma | ICD11: 2C51 | [151] |
BAY-85-3934 |
Drug Info | Phase 2 | Anemia | ICD11: 3A00-3A9Z | [152] |
Sitafloxacin |
Drug Info | Phase 2 | Escherichia coli infection | ICD11: 1A03 | [153] |
SN-38 |
Drug Info | Phase 2 | Colorectal cancer | ICD11: 2B91 | [154] |
HMR-1275 |
Drug Info | Phase 2 | Chronic lymphocytic leukaemia | ICD11: 2A82 | [12] |
ICI-79,280 |
Drug Info | Phase 2 | Ductal carcinoma | ICD11: 2E65 | [155] |
| Drugs in Phase 1 Clinical Trial | Click to Show/Hide the Full List of Drugs: 10 Drugs | ||||
CB-3304 |
Drug Info | Phase 1/2 | Chronic lymphocytic leukaemia | ICD11: 2A82 | [156] |
LM-94 |
Drug Info | Phase 1/2 | Cholangitis | ICD11: DC13 | [157] |
TMC-120 |
Drug Info | Phase 1/2 | Human immunodeficiency virus infection | ICD11: 1C60 | [158] |
AG-1549 |
Drug Info | Phase 1 | Human immunodeficiency virus infection | ICD11: 1C60 | [159] |
BRN-0183227 |
Drug Info | Phase 1 | Acute coronary syndrome | ICD11: BA4Z | [160] |
GS-9883 |
Drug Info | Phase 1 | Human immunodeficiency virus infection | ICD11: 1C60 | [161] |
TAS-103 |
Drug Info | Phase 1 | Colon cancer | ICD11: 2B90 | [162] |
Norbuprenorphine |
Drug Info | Phase 1 | Human immunodeficiency virus infection | ICD11: 1C60-1C62 | [163] |
OTSSP167 |
Drug Info | Phase 1 | Myelodysplastic syndrome | ICD11: 2A37 | [164] |
UP-83 |
Drug Info | Phase 1 | Rheumatoid arthritis | ICD11: FA20 | [165] |
| Discontinued/withdrawn Drugs | Click to Show/Hide the Full List of Drugs: 4 Drugs | ||||
Motesanib |
Drug Info | Discontinued in Phase 3 | Lung cancer | ICD11: 2C25 | [166] |
Lexacalcitol |
Drug Info | Discontinued in Phase 2 | Solid tumour/cancer | ICD11: 2A00-2F9Z | [167], [168] |
T-5224 |
Drug Info | Discontinued in Phase 2 | Rheumatoid arthritis | ICD11: FA20 | [169] |
GV-150526 |
Drug Info | Discontinued | Cerebral stroke | ICD11: 8B11 | [9] |
| Preclinical/investigative Agents | Click to Show/Hide the Full List of Drugs: 9 Drugs | ||||
Phenanthrenequinone |
Drug Info | Investigative | Discovery agent | ICD: N.A. | [170] |
Eugenol |
Drug Info | Investigative | Discovery agent | ICD: N.A. | [124] |
Chloroxylenol |
Drug Info | Investigative | Pseudomonas infection | ICD11: 1G40 | [171] |
Hydroxyestrone |
Drug Info | Investigative | Discovery agent | ICD: N.A. | [172] |
Phloretin |
Drug Info | Investigative | Discovery agent | ICD: N.A. | [124] |
Chrysin |
Drug Info | Investigative | Discovery agent | ICD: N.A. | [124] |
Cis-4-hydroxytamoxifen |
Drug Info | Investigative | Discovery agent | ICD: N.A. | [155] |
Alpha-D-galactose |
Drug Info | Investigative | Discovery agent | ICD: N.A. | [173] |
Anthraflavic acid |
Drug Info | Investigative | Discovery agent | ICD: N.A. | [124] |
| Experimental Enzyme Kinetic Data of Drugs | Click to Show/Hide the Full List of Drugs: 9 Drugs | ||||
Curcumin |
Drug Info | Phase 3 | Stomach cancer | Km = 0.1 microM | [124] |
Ethanol |
Drug Info | Phase 2 | Diabetic nephropathy | Km = 8.03 microM | [140] |
ICI-79,280 |
Drug Info | Phase 2 | Ductal carcinoma | Km = 0.004 microM | [155] |
Eugenol |
Drug Info | Investigative | Discovery agent | Km = 0.0084 microM | [124] |
Phloretin |
Drug Info | Investigative | Discovery agent | Km = 0.0068 microM | [124] |
Chrysin |
Drug Info | Investigative | Discovery agent | Km = 0.004 microM | [124] |
Cis-4-hydroxytamoxifen |
Drug Info | Investigative | Discovery agent | Km = 0.0074 microM | [155] |
ACMC-1AKLT |
Drug Info | Investigative | Discovery agent | Km = 0.198 microM | [5] |
Anthraflavic acid |
Drug Info | Investigative | Discovery agent | Km = 0.01 microM | [124] |
| Tissue/Disease-Specific Protein Abundances of This DME | |||||
|---|---|---|---|---|---|
| ICD Disease Classification 01 | Infectious/parasitic disease | Click to Show/Hide | |||
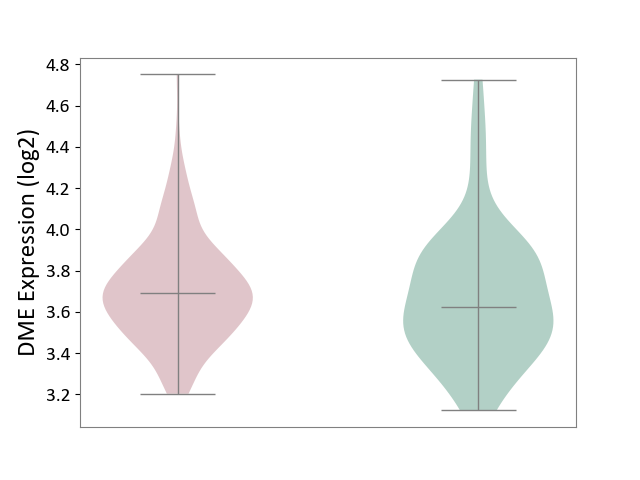
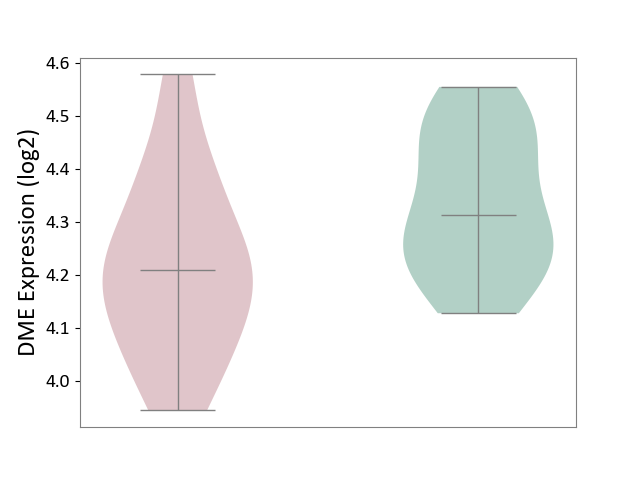
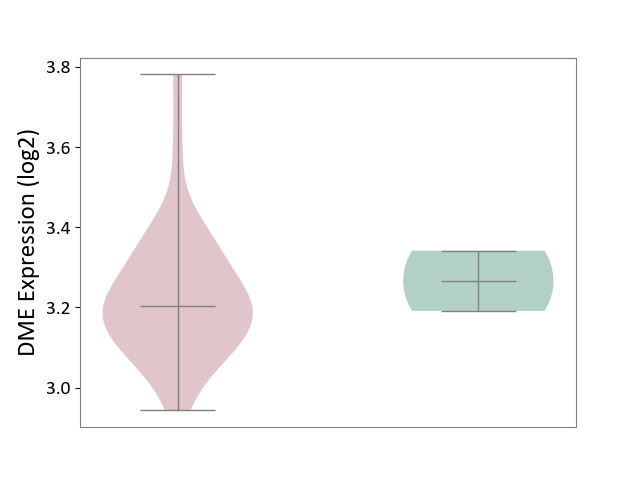
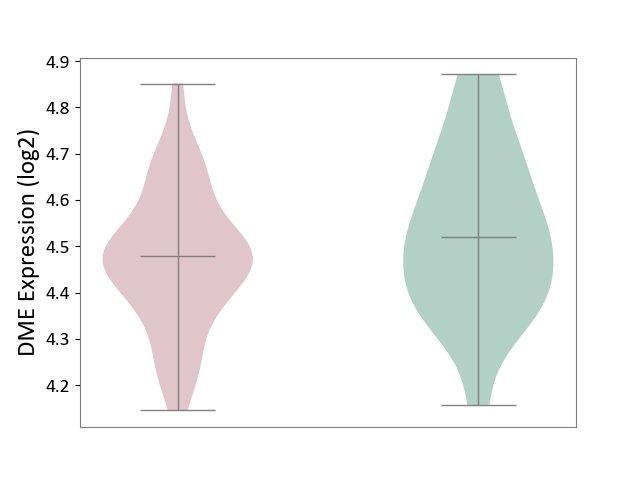
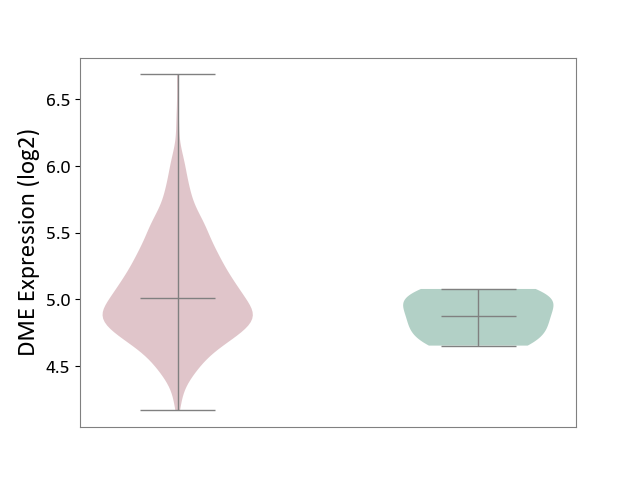
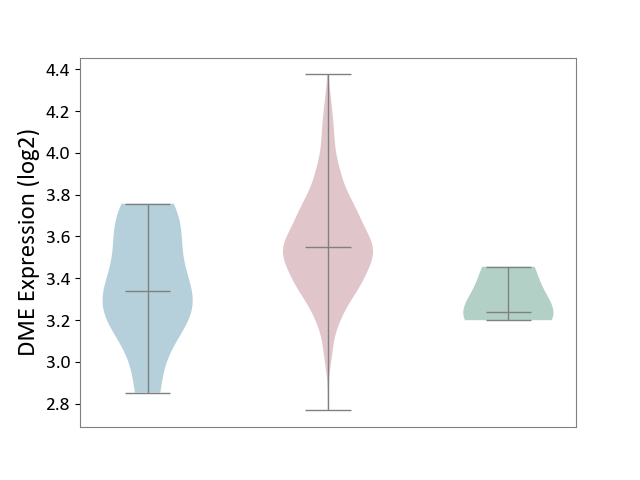
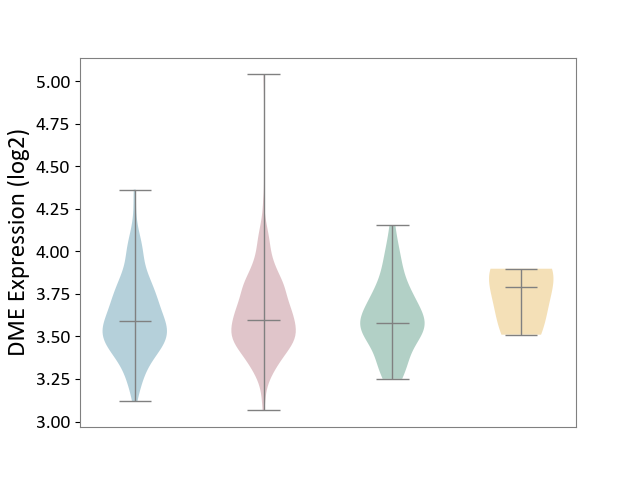
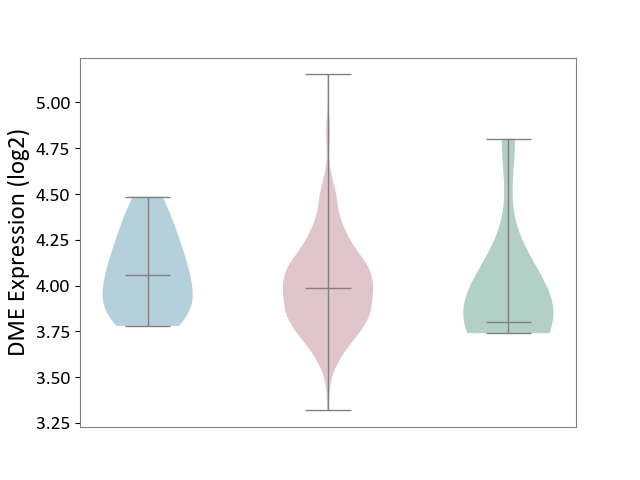
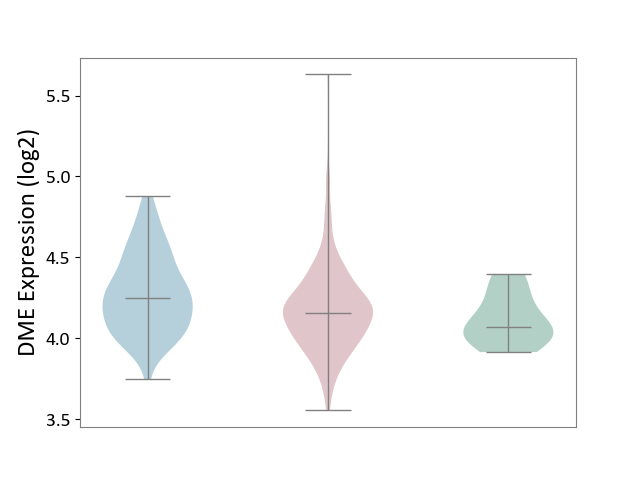
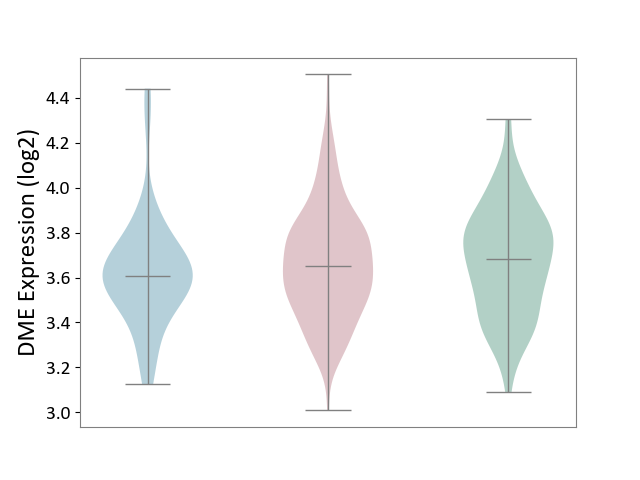
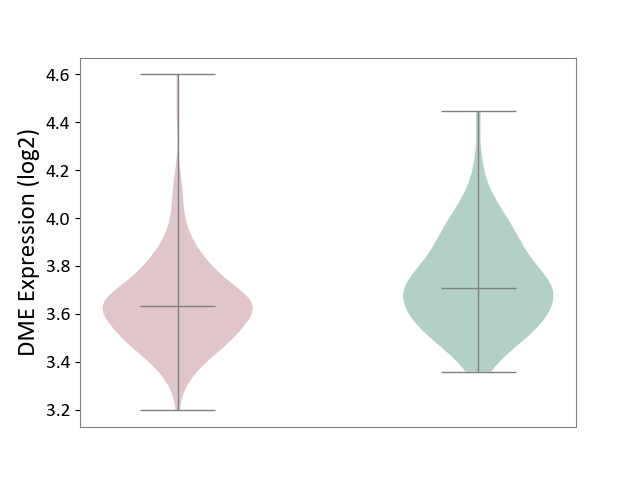
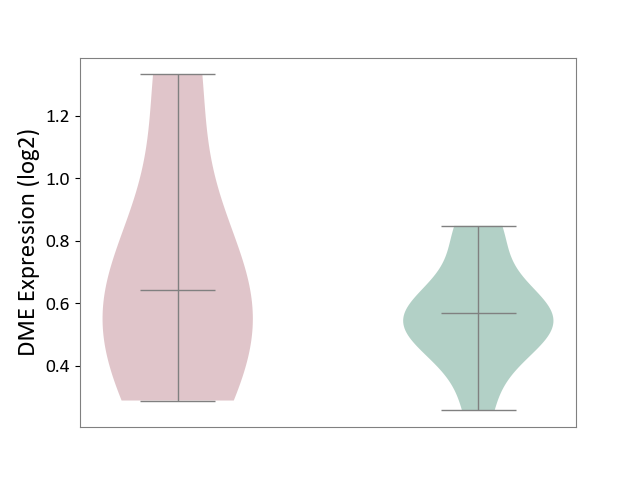
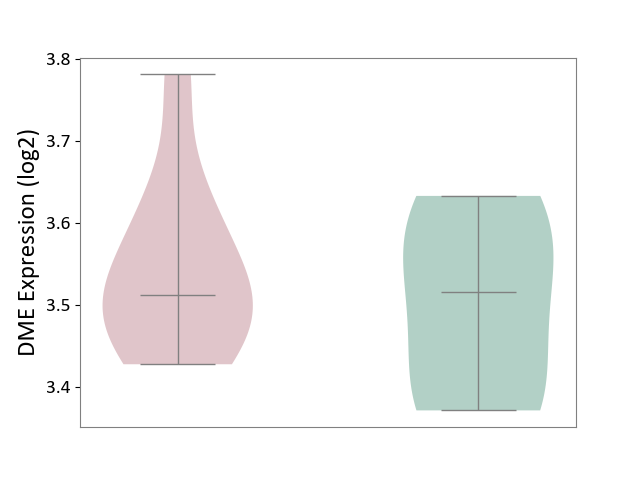
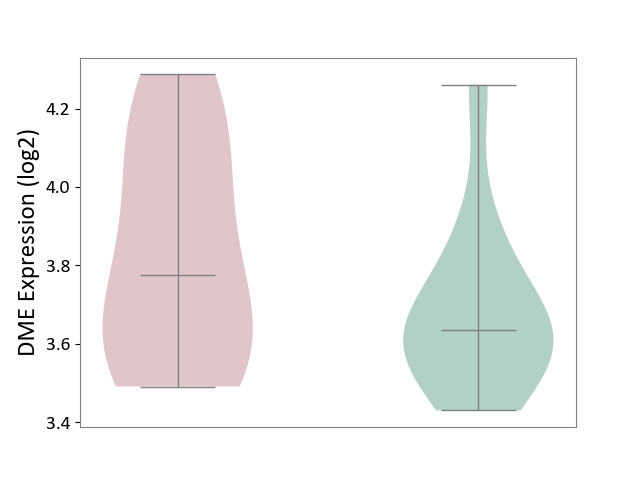
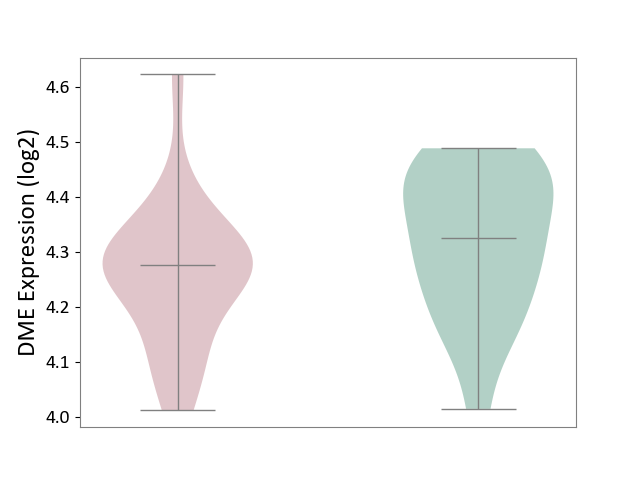
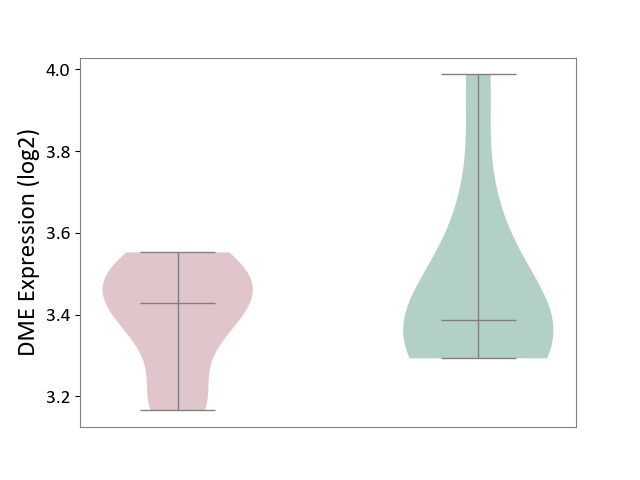
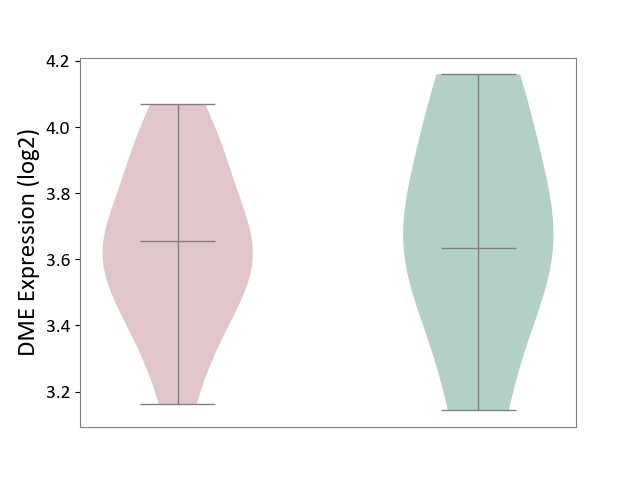
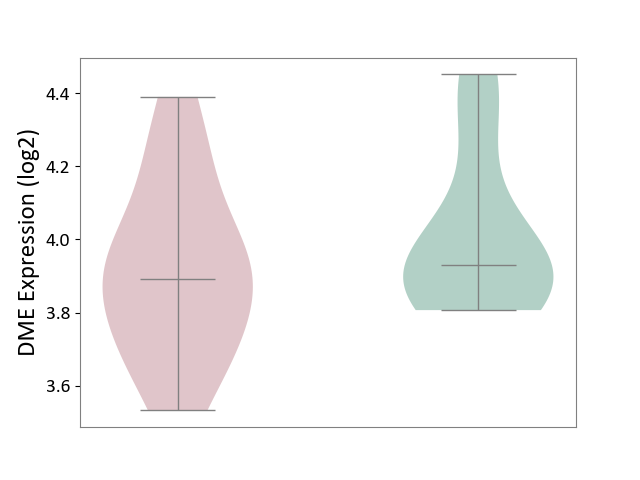
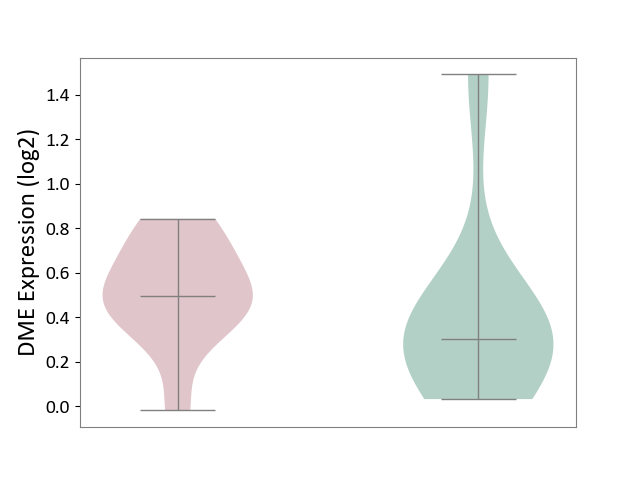
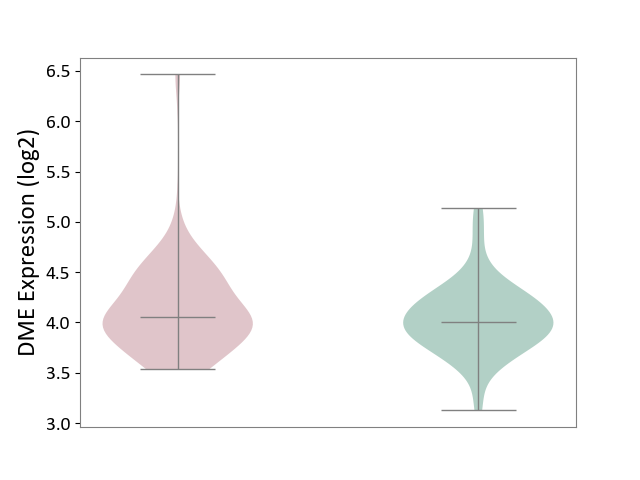
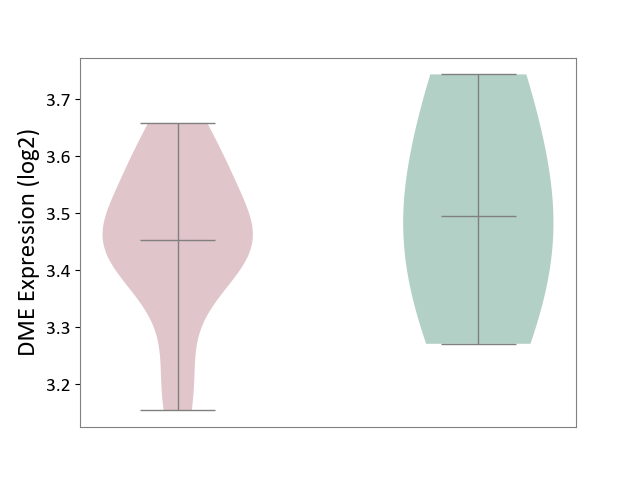
| ICD-11: 1C1H | Necrotising ulcerative gingivitis | Click to Show/Hide | |||
| The Studied Tissue | Gingival tissue | ||||
| The Specified Disease | Bacterial infection of gingival [ICD-11:1C1H] | ||||
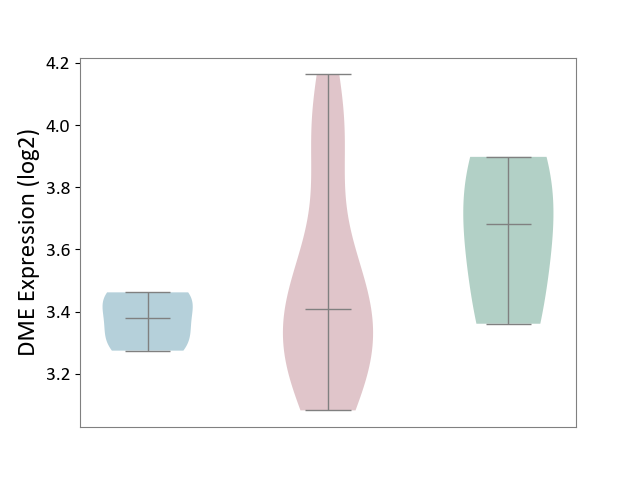
| The Expression Level of Disease Section Compare with the Healthy Individual Tissue | p-value: 5.17E-01; Fold-change: 6.55E-02; Z-score: 2.04E-01 | ||||
|
DME expression in the diseased tissue of patients
DME expression in the normal tissue of healthy individuals
|
|||||
| Violin Diagram of DME Disease-specific Protein Abundances |
|
Click to View the Clearer Original Diagram | |||
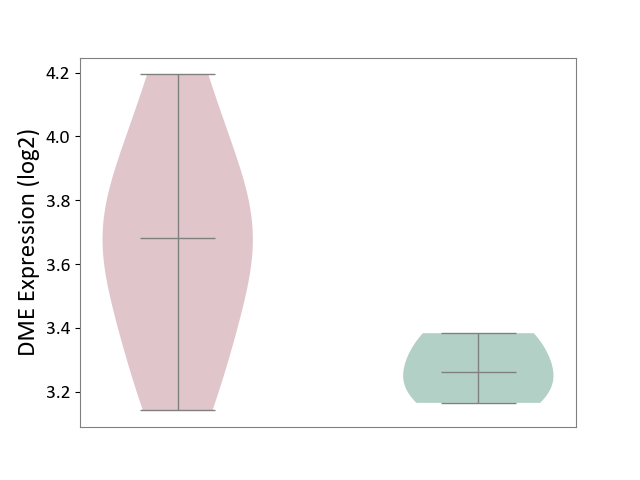
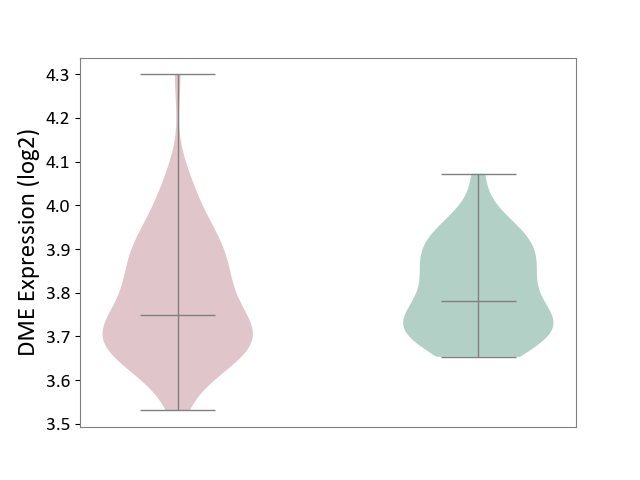
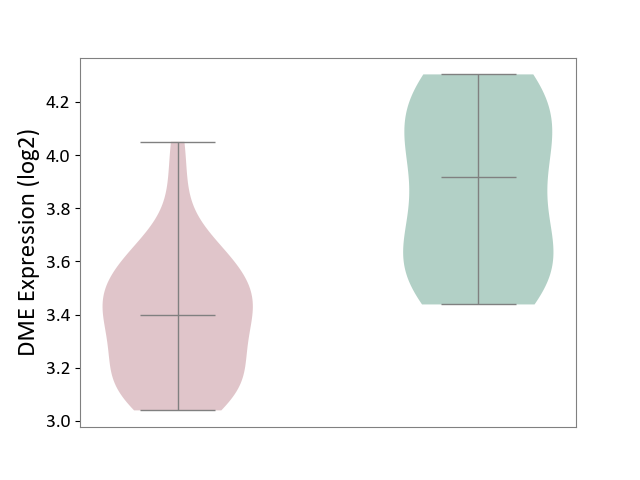
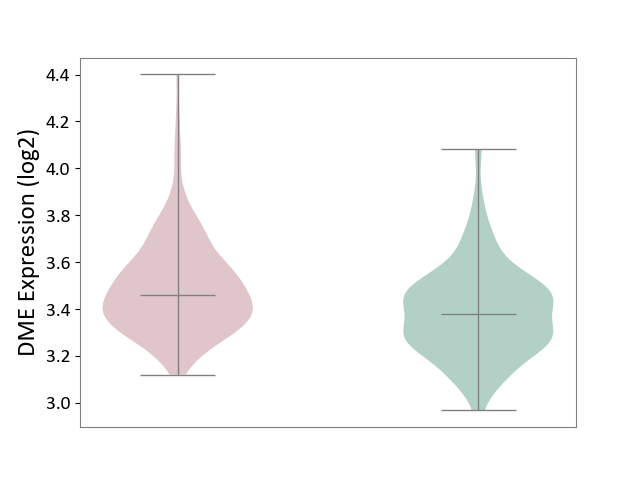
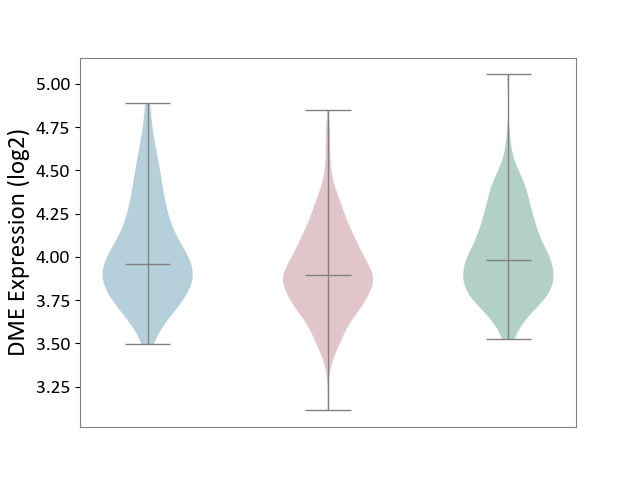
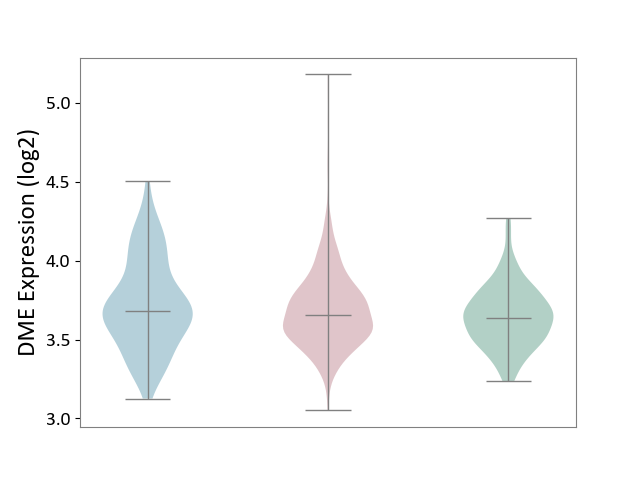
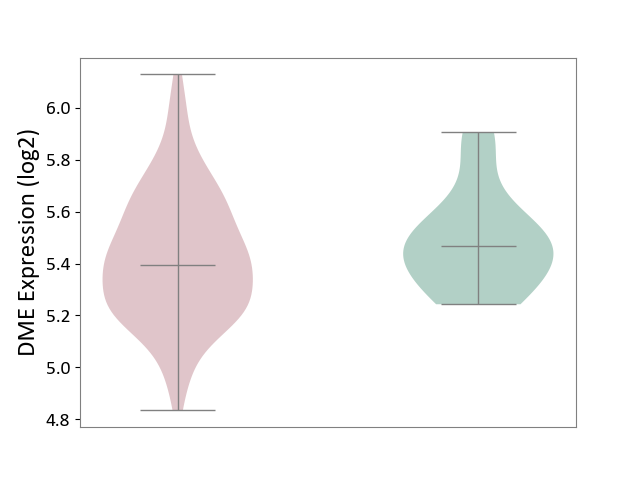
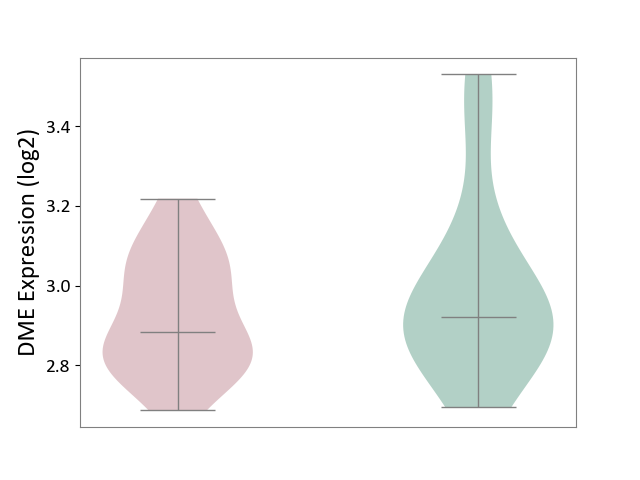
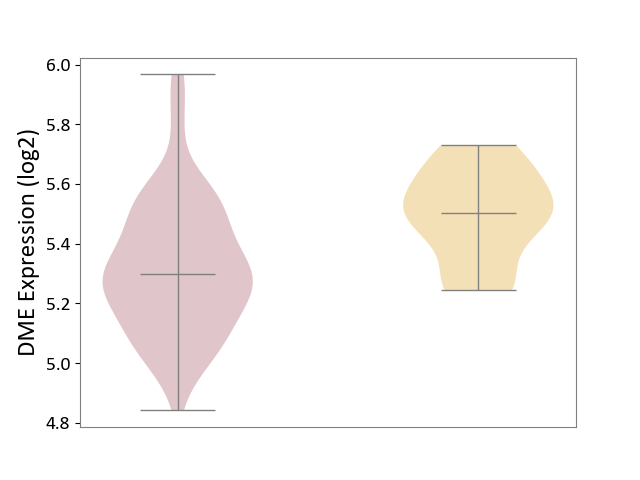
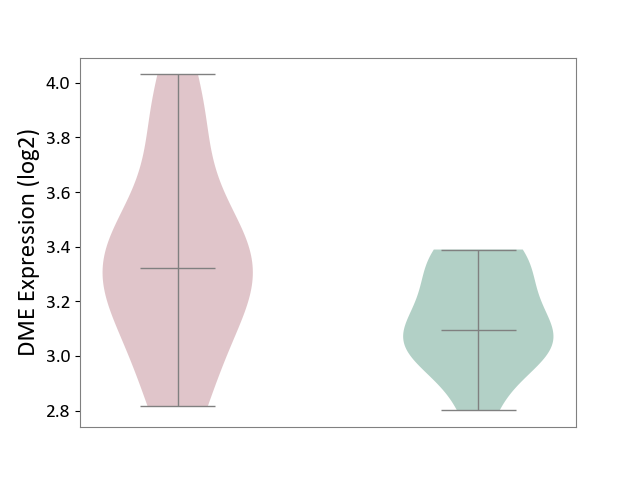
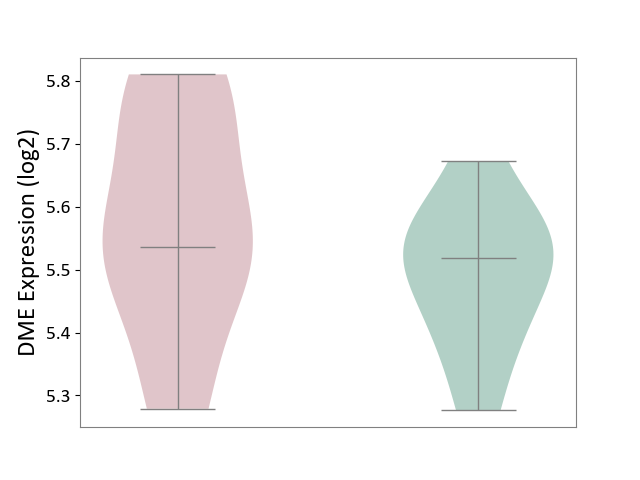
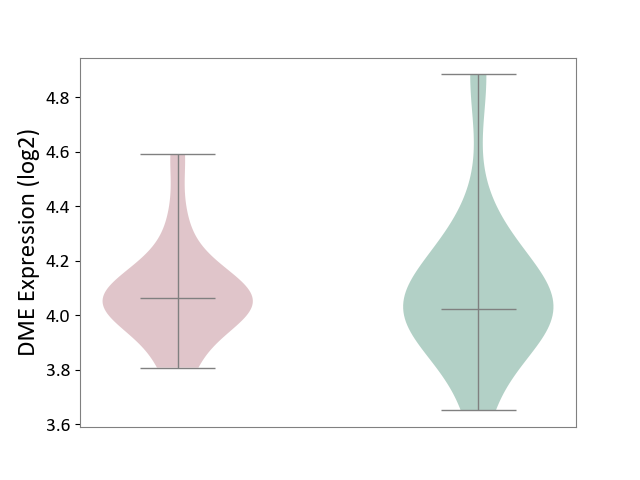
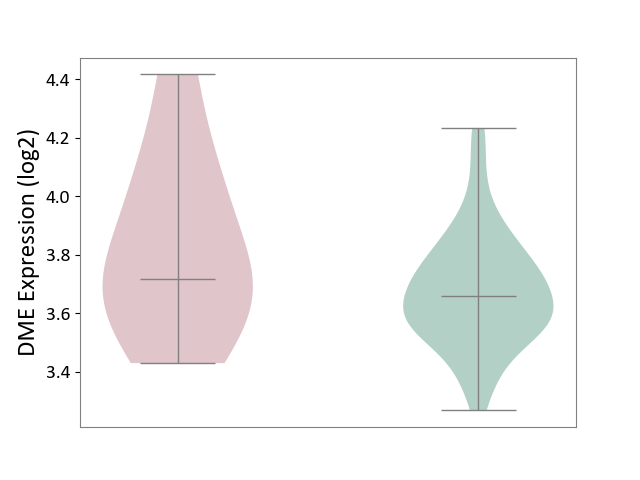
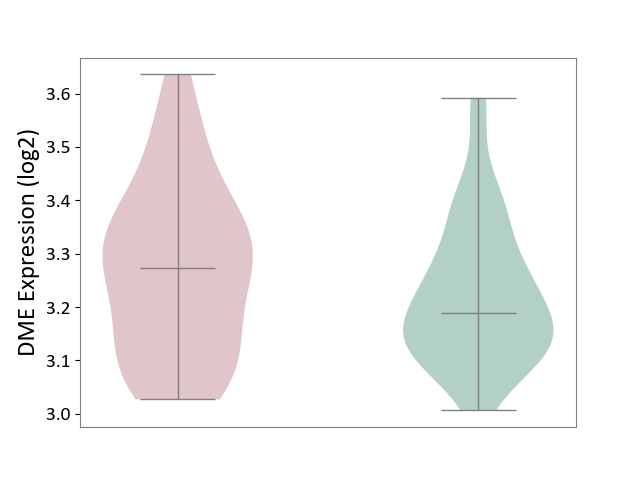
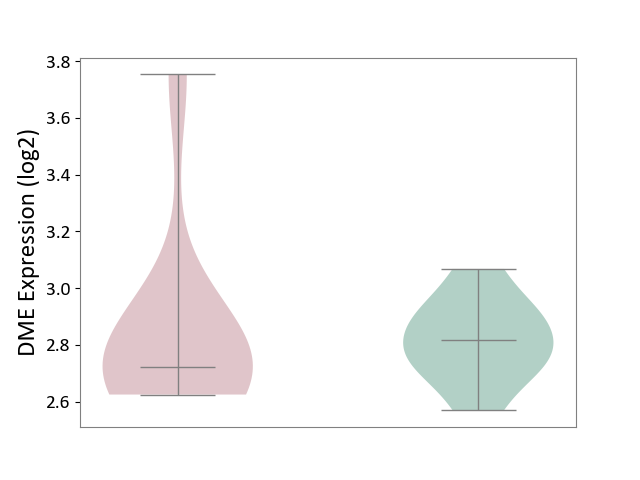
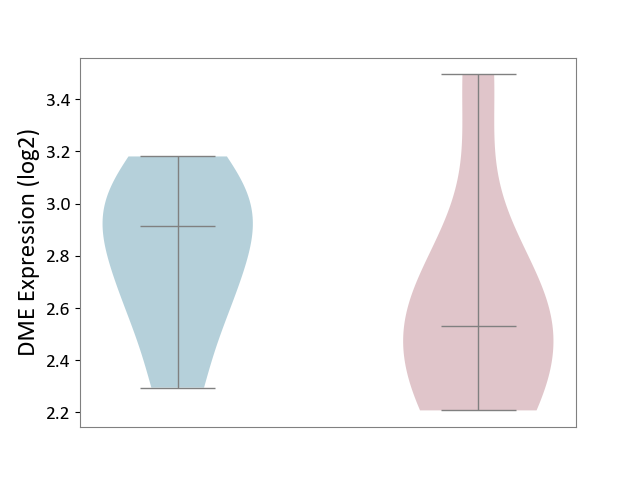
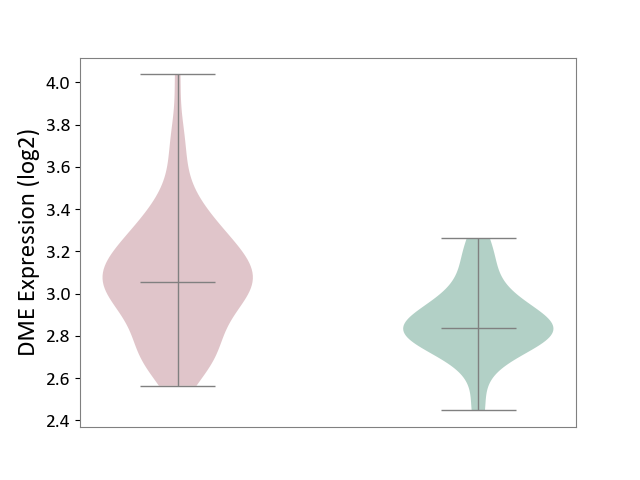
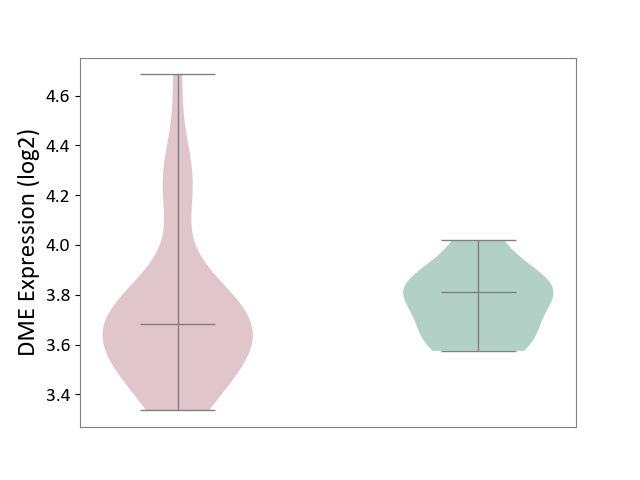
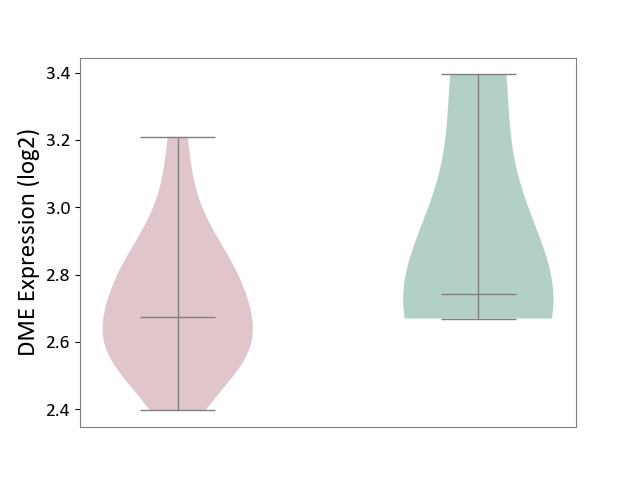
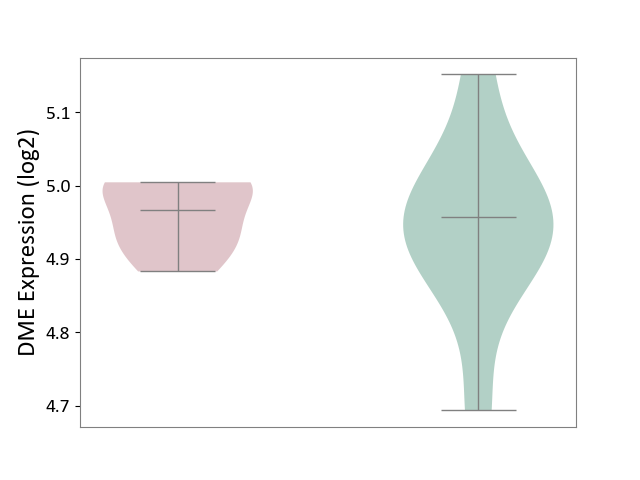
| ICD-11: 1E30 | Influenza | Click to Show/Hide | |||
| The Studied Tissue | Whole blood | ||||
| The Specified Disease | Influenza [ICD-11:1E30] | ||||
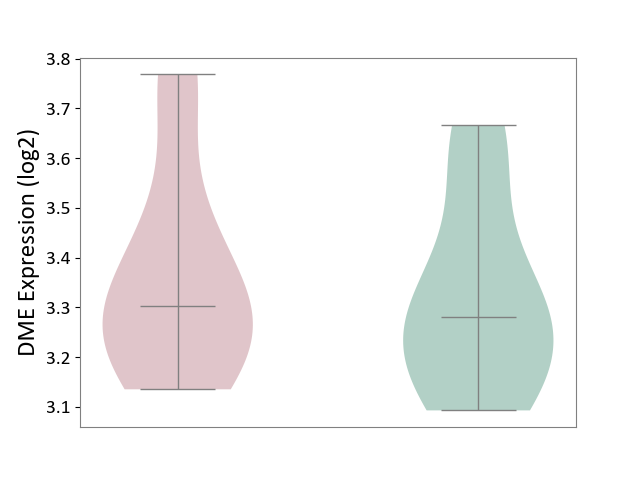
| The Expression Level of Disease Section Compare with the Healthy Individual Tissue | p-value: 1.24E-02; Fold-change: 4.20E-01; Z-score: 3.84E+00 | ||||
|
DME expression in the diseased tissue of patients
DME expression in the normal tissue of healthy individuals
|
|||||
| Violin Diagram of DME Disease-specific Protein Abundances |
|
Click to View the Clearer Original Diagram | |||
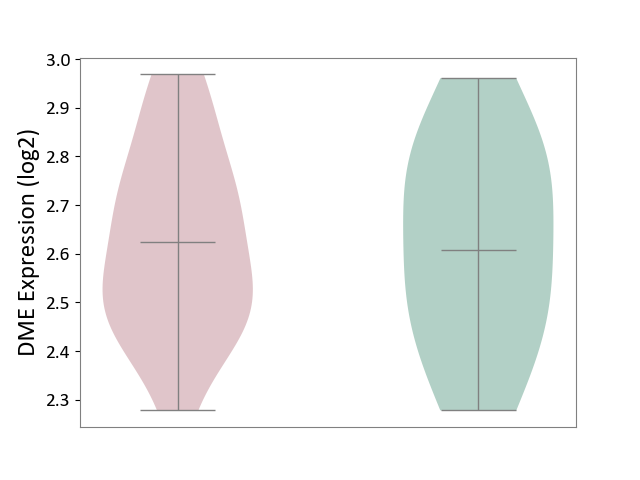
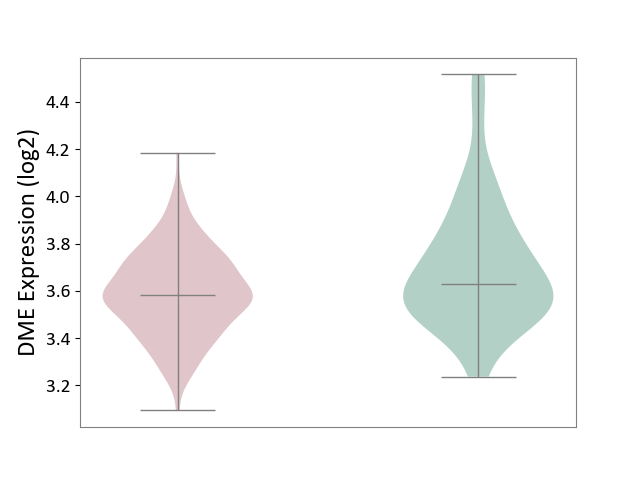
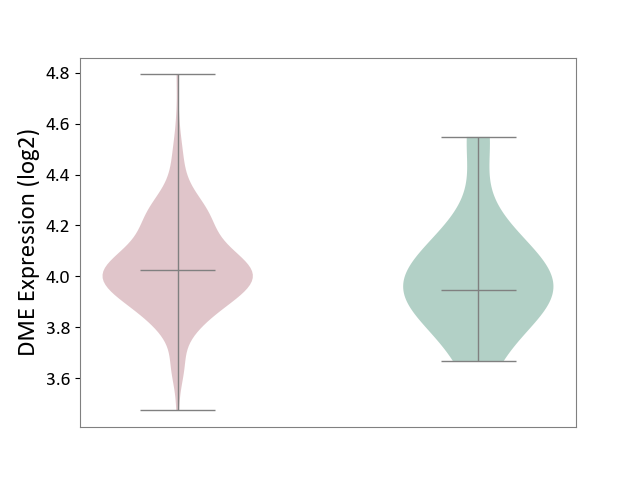
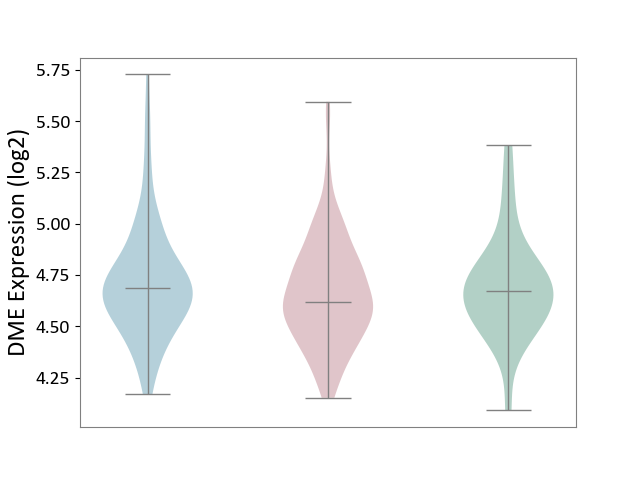
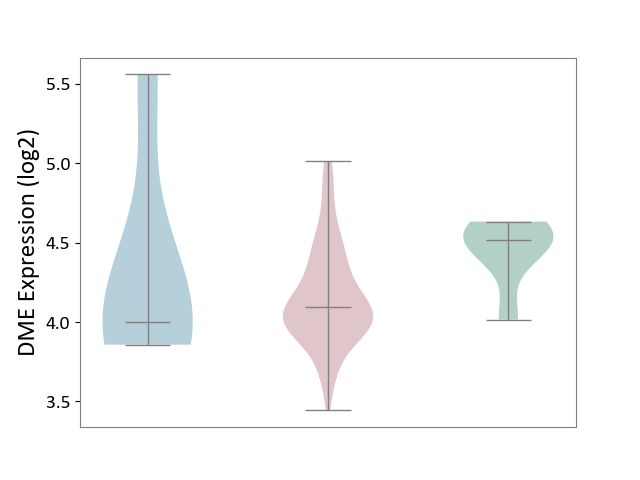
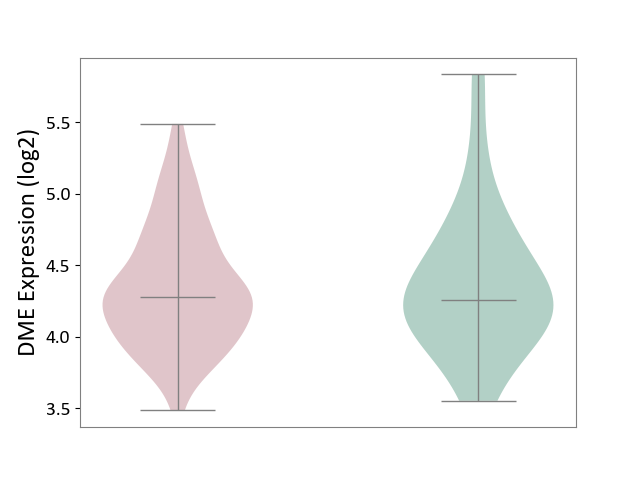
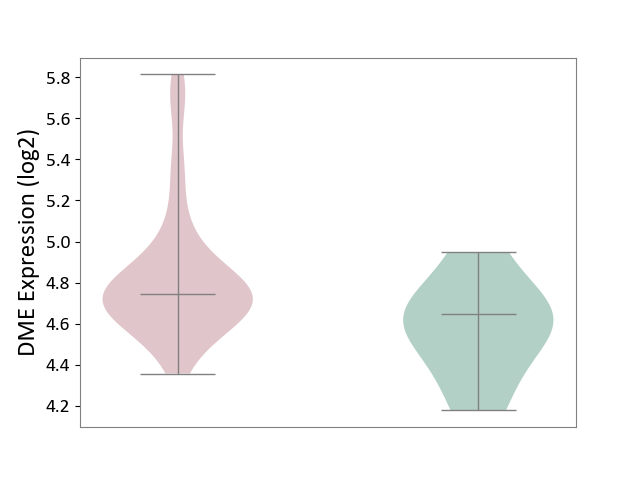
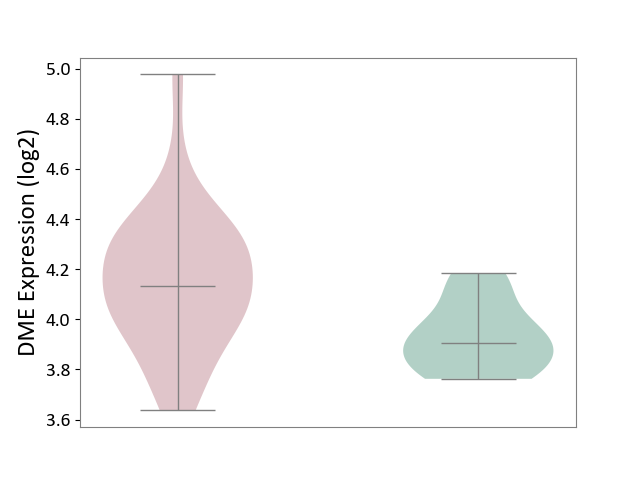
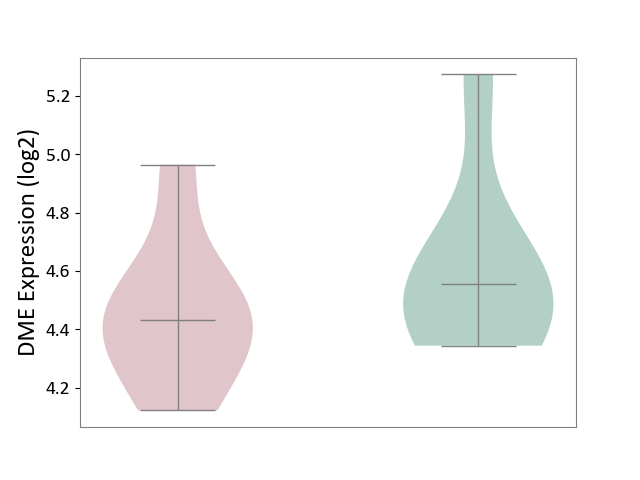
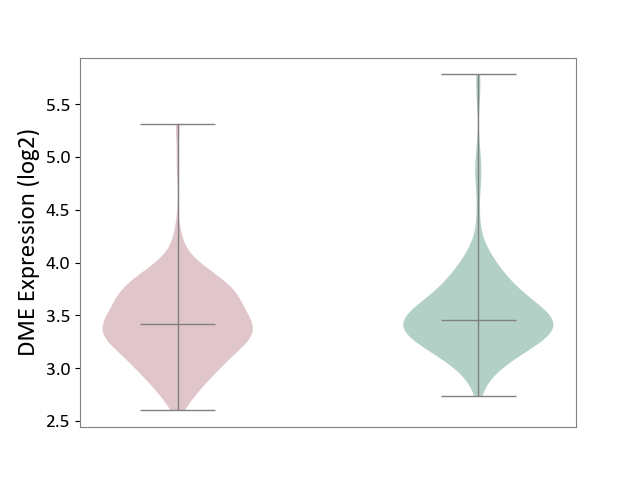
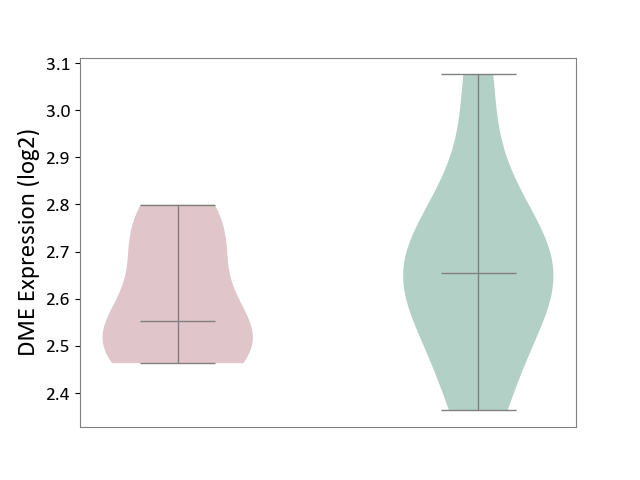
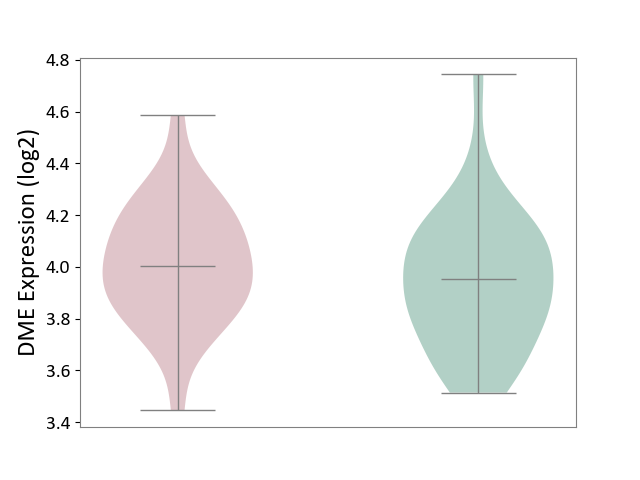
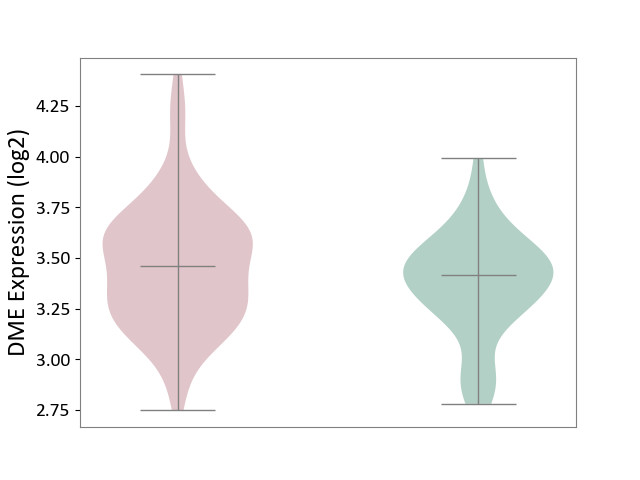
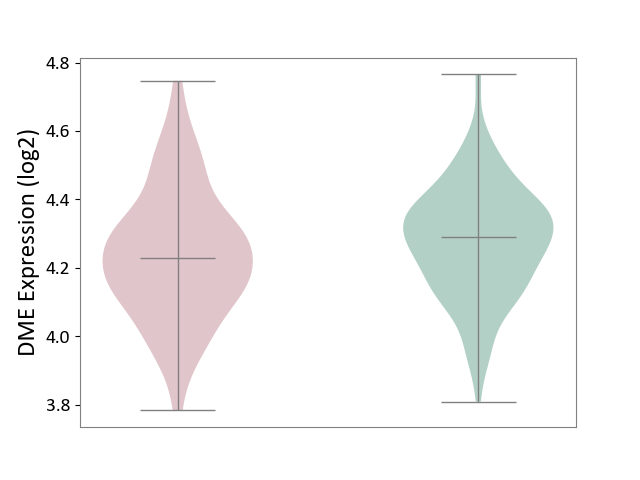
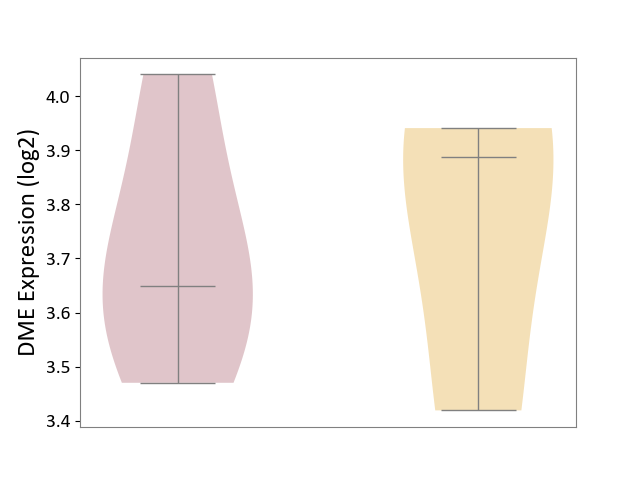
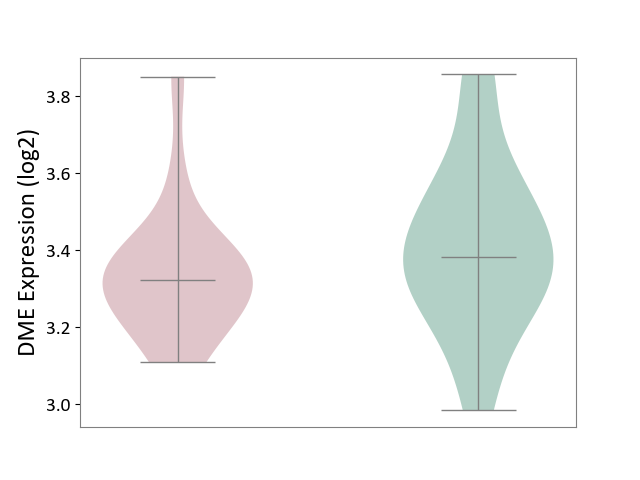
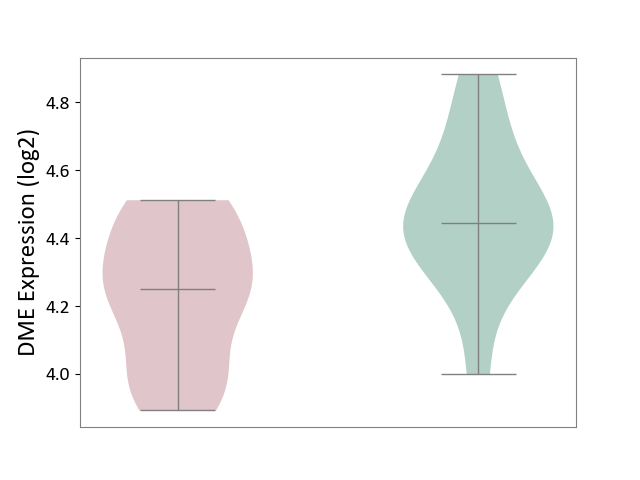
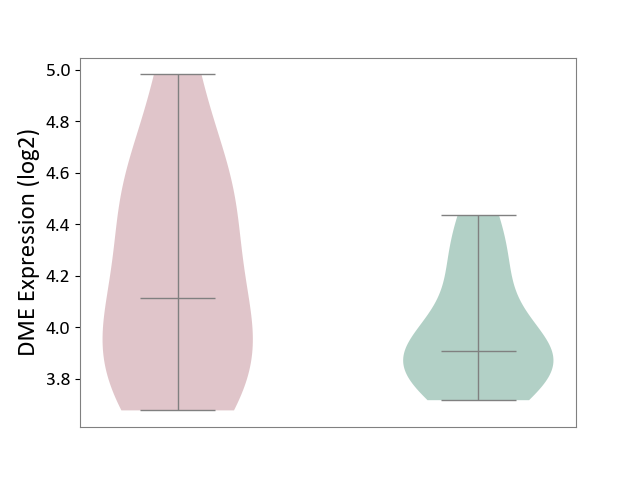
| ICD-11: 1E51 | Chronic viral hepatitis | Click to Show/Hide | |||
| The Studied Tissue | Whole blood | ||||
| The Specified Disease | Chronic hepatitis C [ICD-11:1E51.1] | ||||
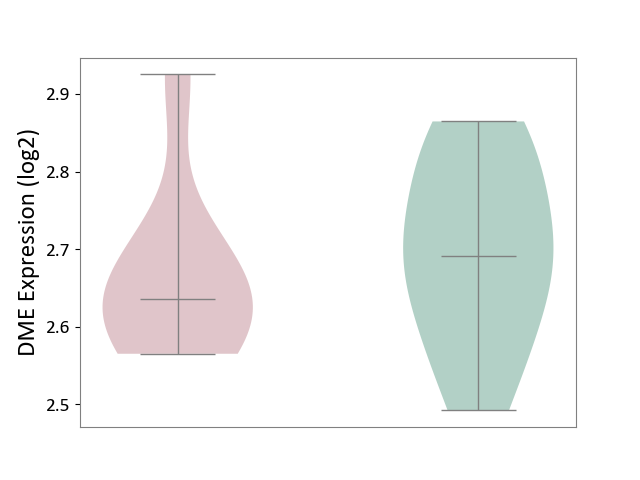
| The Expression Level of Disease Section Compare with the Healthy Individual Tissue | p-value: 9.82E-01; Fold-change: 1.47E-02; Z-score: 6.84E-02 | ||||
|
DME expression in the diseased tissue of patients
DME expression in the normal tissue of healthy individuals
|
|||||
| Violin Diagram of DME Disease-specific Protein Abundances |
|
Click to View the Clearer Original Diagram | |||
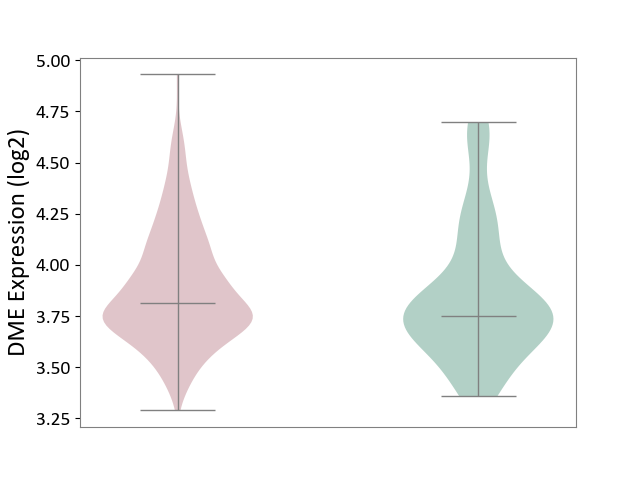
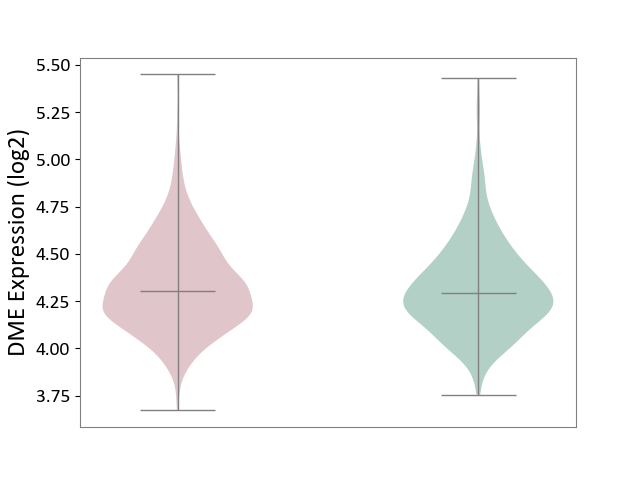
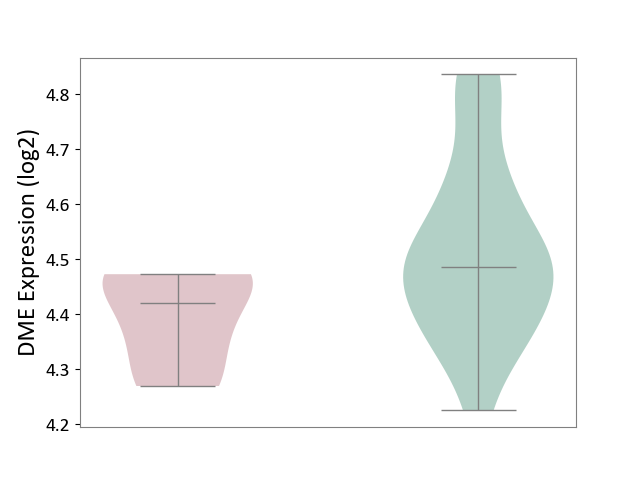
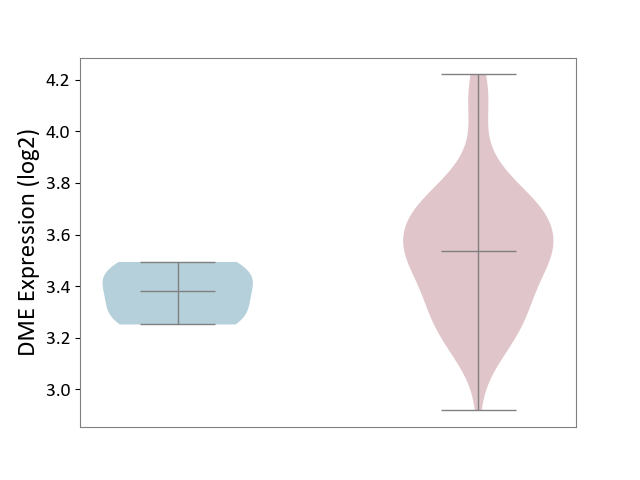
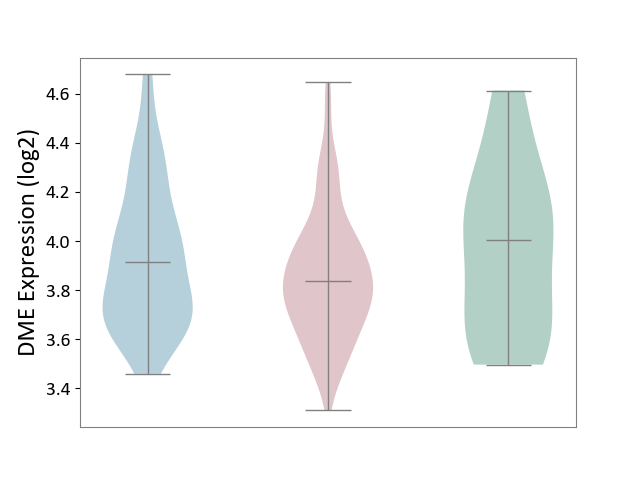
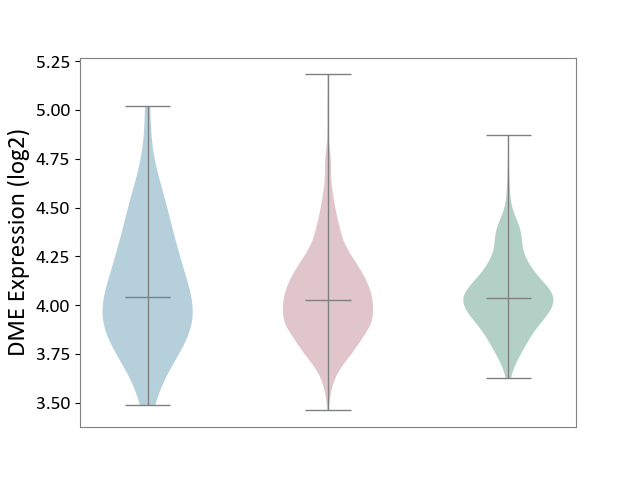
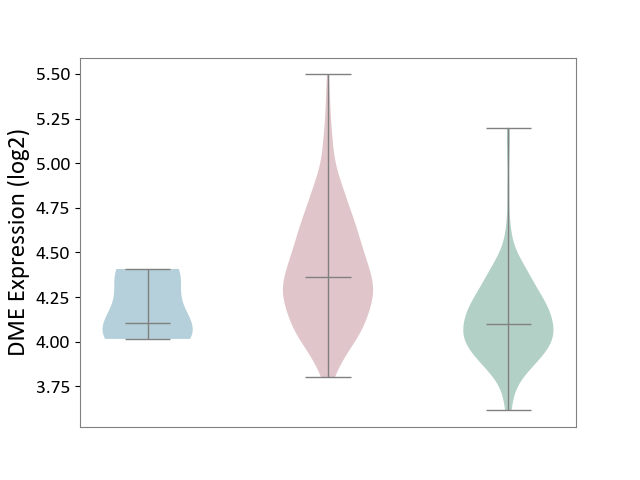
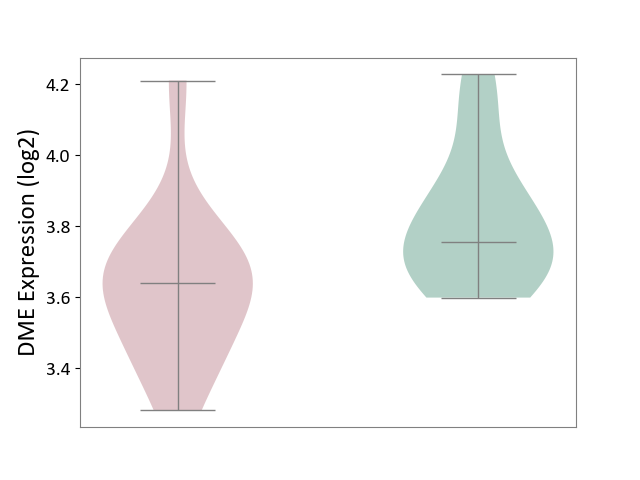
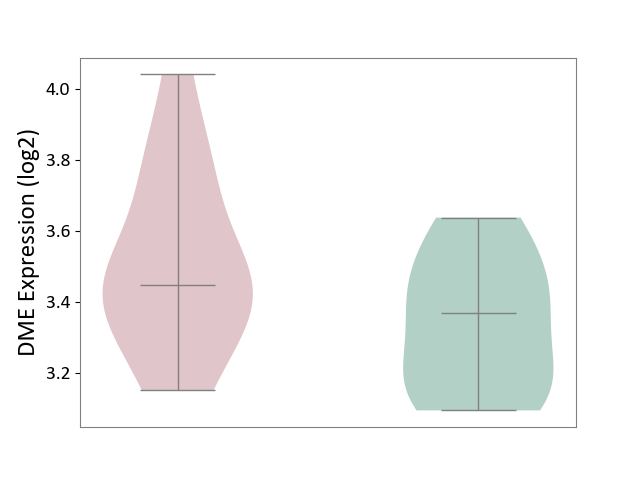
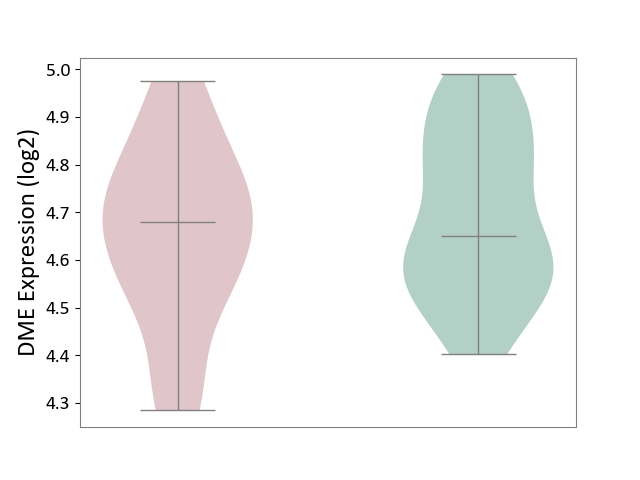
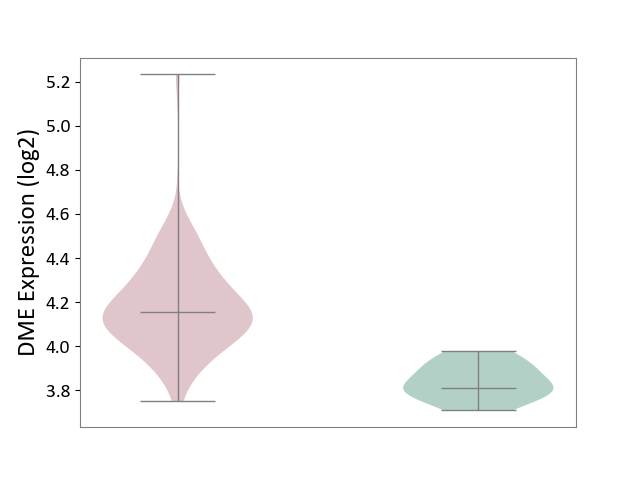
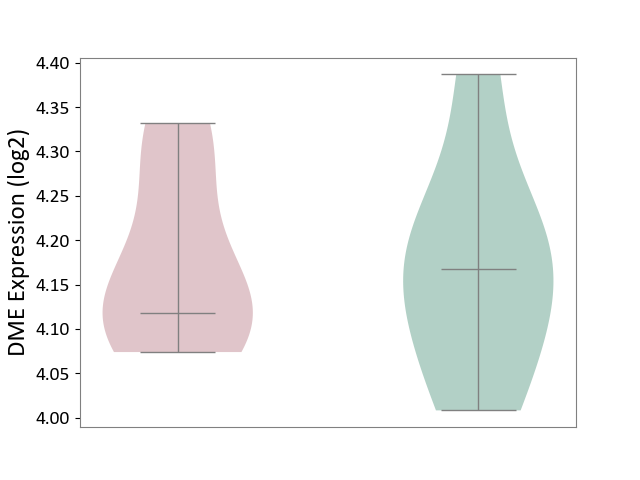
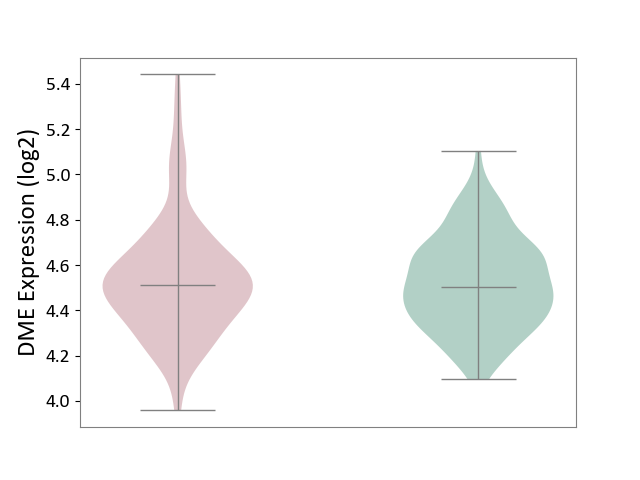
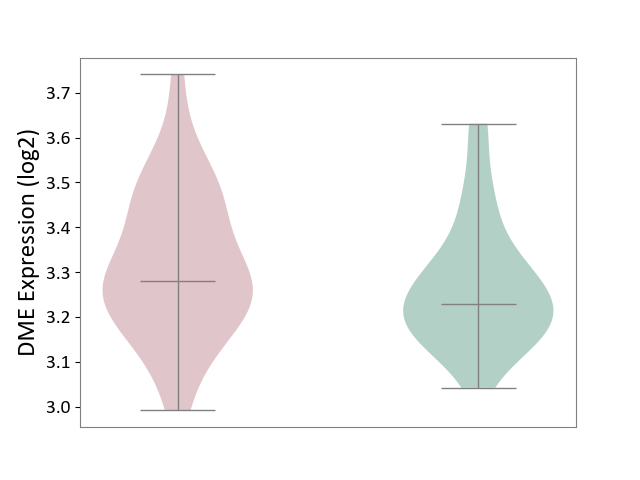
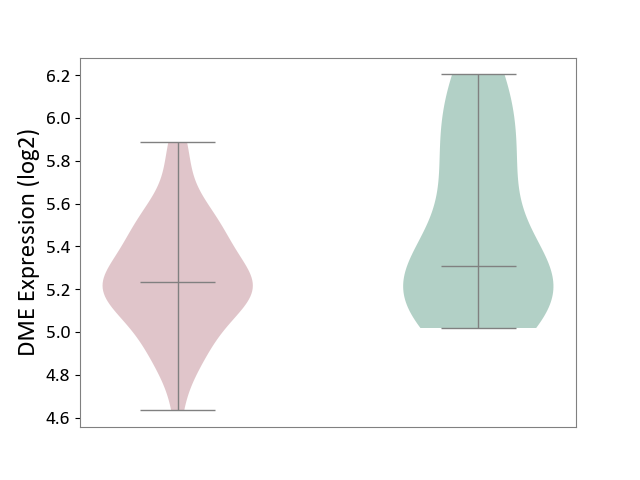
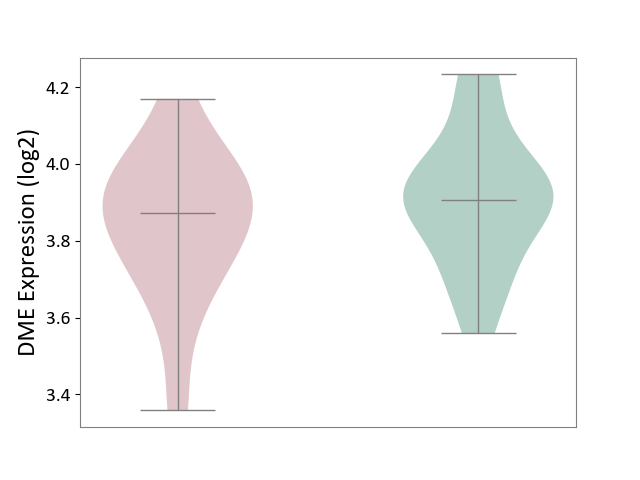
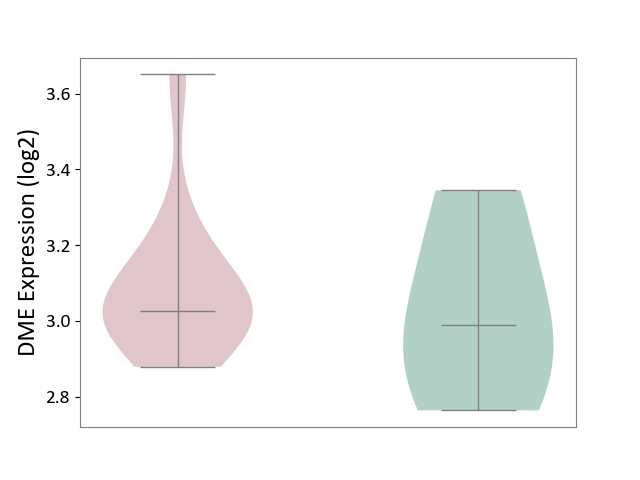
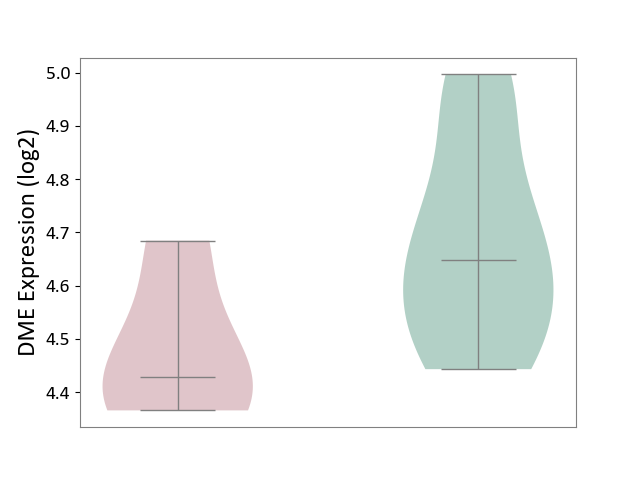
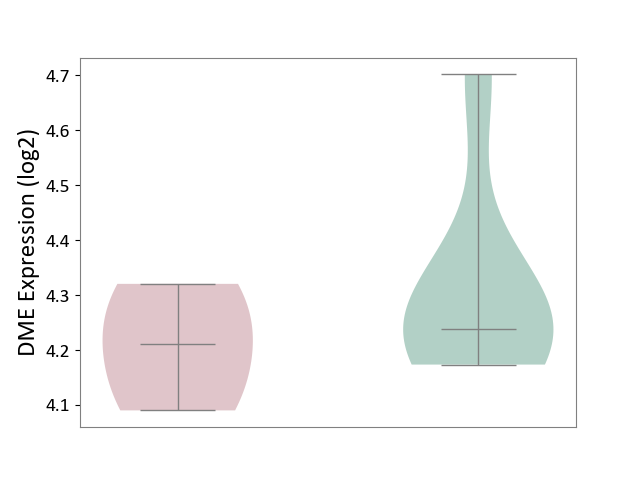
| ICD-11: 1G41 | Sepsis with septic shock | Click to Show/Hide | |||
| The Studied Tissue | Whole blood | ||||
| The Specified Disease | Sepsis with septic shock [ICD-11:1G41] | ||||
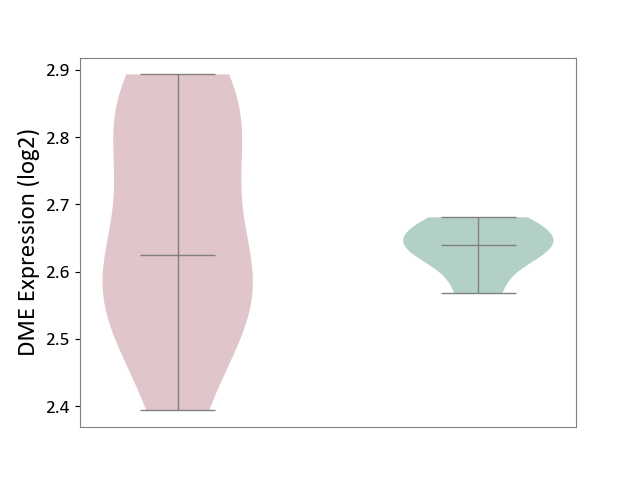
| The Expression Level of Disease Section Compare with the Healthy Individual Tissue | p-value: 1.46E-01; Fold-change: 6.14E-02; Z-score: 1.89E-01 | ||||
|
DME expression in the diseased tissue of patients
DME expression in the normal tissue of healthy individuals
|
|||||
| Violin Diagram of DME Disease-specific Protein Abundances |
|
Click to View the Clearer Original Diagram | |||
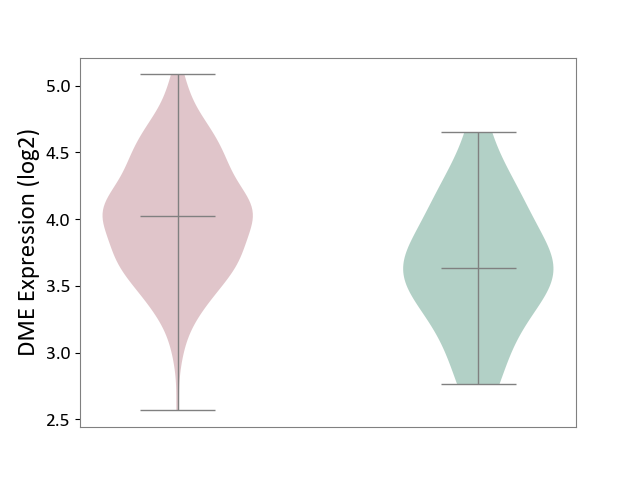
| ICD-11: CA40 | Respiratory syncytial virus infection | Click to Show/Hide | |||
| The Studied Tissue | Peripheral blood | ||||
| The Specified Disease | Pediatric respiratory syncytial virus infection [ICD-11:CA40.11] | ||||
| The Expression Level of Disease Section Compare with the Healthy Individual Tissue | p-value: 1.49E-02; Fold-change: -1.03E-01; Z-score: -7.62E-01 | ||||
|
DME expression in the diseased tissue of patients
DME expression in the normal tissue of healthy individuals
|
|||||
| Violin Diagram of DME Disease-specific Protein Abundances |
|
Click to View the Clearer Original Diagram | |||
| ICD-11: CA42 | Rhinovirus infection | Click to Show/Hide | |||
| The Studied Tissue | Nasal epithelium tissue | ||||
| The Specified Disease | Rhinovirus infection [ICD-11:CA42.1] | ||||
| The Expression Level of Disease Section Compare with the Healthy Individual Tissue | p-value: 5.08E-01; Fold-change: -3.22E-02; Z-score: -3.06E-01 | ||||
|
DME expression in the diseased tissue of patients
DME expression in the normal tissue of healthy individuals
|
|||||
| Violin Diagram of DME Disease-specific Protein Abundances |
|
Click to View the Clearer Original Diagram | |||
| ICD-11: KA60 | Neonatal sepsis | Click to Show/Hide | |||
| The Studied Tissue | Whole blood | ||||
| The Specified Disease | Neonatal sepsis [ICD-11:KA60] | ||||
| The Expression Level of Disease Section Compare with the Healthy Individual Tissue | p-value: 5.66E-04; Fold-change: -4.90E-02; Z-score: -1.83E-01 | ||||
|
DME expression in the diseased tissue of patients
DME expression in the normal tissue of healthy individuals
|
|||||
| Violin Diagram of DME Disease-specific Protein Abundances |
|
Click to View the Clearer Original Diagram | |||
| ICD Disease Classification 02 | Neoplasm | Click to Show/Hide | |||
| ICD-11: 2A00 | Brain cancer | Click to Show/Hide | |||
| The Studied Tissue | Nervous tissue | ||||
| The Specified Disease | Glioblastopma [ICD-11:2A00.00] | ||||
| The Expression Level of Disease Section Compare with the Healthy Individual Tissue | p-value: 6.50E-01; Fold-change: 1.30E-02; Z-score: 5.24E-02 | ||||
|
DME expression in the diseased tissue of patients
DME expression in the normal tissue of healthy individuals
|
|||||
| Violin Diagram of DME Disease-specific Protein Abundances |
|
Click to View the Clearer Original Diagram | |||
| The Studied Tissue | Brain stem tissue | ||||
| The Specified Disease | Glioma [ICD-11:2A00.0Y-2A00.0Z] | ||||
| The Expression Level of Disease Section Compare with the Healthy Individual Tissue | p-value: 7.13E-01; Fold-change: -6.34E-02; Z-score: -5.97E-01 | ||||
|
DME expression in the diseased tissue of patients
DME expression in the normal tissue of healthy individuals
|
|||||
| Violin Diagram of DME Disease-specific Protein Abundances |
|
Click to View the Clearer Original Diagram | |||
| The Studied Tissue | White matter tissue | ||||
| The Specified Disease | Glioma [ICD-11:2A00.0Y-2A00.0Z] | ||||
| The Expression Level of Disease Section Compare with the Healthy Individual Tissue | p-value: 3.04E-04; Fold-change: -5.18E-01; Z-score: -1.68E+00 | ||||
|
DME expression in the diseased tissue of patients
DME expression in the normal tissue of healthy individuals
|
|||||
| Violin Diagram of DME Disease-specific Protein Abundances |
|
Click to View the Clearer Original Diagram | |||
| The Studied Tissue | Brain stem tissue | ||||
| The Specified Disease | Neuroectodermal tumour [ICD-11:2A00.11] | ||||
| The Expression Level of Disease Section Compare with the Healthy Individual Tissue | p-value: 6.49E-01; Fold-change: 7.94E-02; Z-score: 3.42E-01 | ||||
|
DME expression in the diseased tissue of patients
DME expression in the normal tissue of healthy individuals
|
|||||
| Violin Diagram of DME Disease-specific Protein Abundances |
|
Click to View the Clearer Original Diagram | |||
| ICD-11: 2A20 | Myeloproliferative neoplasm | Click to Show/Hide | |||
| The Studied Tissue | Whole blood | ||||
| The Specified Disease | Myelofibrosis [ICD-11:2A20.2] | ||||
| The Expression Level of Disease Section Compare with the Healthy Individual Tissue | p-value: 8.65E-03; Fold-change: -6.65E-02; Z-score: -4.13E-01 | ||||
|
DME expression in the diseased tissue of patients
DME expression in the normal tissue of healthy individuals
|
|||||
| Violin Diagram of DME Disease-specific Protein Abundances |
|
Click to View the Clearer Original Diagram | |||
| The Studied Tissue | Whole blood | ||||
| The Specified Disease | Polycythemia vera [ICD-11:2A20.4] | ||||
| The Expression Level of Disease Section Compare with the Healthy Individual Tissue | p-value: 1.23E-01; Fold-change: -4.00E-02; Z-score: -2.26E-01 | ||||
|
DME expression in the diseased tissue of patients
DME expression in the normal tissue of healthy individuals
|
|||||
| Violin Diagram of DME Disease-specific Protein Abundances |
|
Click to View the Clearer Original Diagram | |||
| ICD-11: 2A36 | Myelodysplastic syndrome | Click to Show/Hide | |||
| The Studied Tissue | Bone marrow | ||||
| The Specified Disease | Myelodysplastic syndrome [ICD-11:2A36-2A3Z] | ||||
| The Expression Level of Disease Section Compare with the Healthy Individual Tissue | p-value: 7.18E-01; Fold-change: 4.62E-02; Z-score: 2.36E-01 | ||||
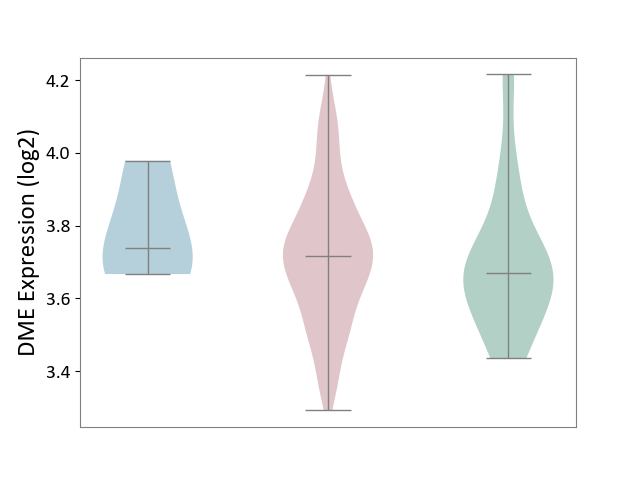
| The Expression Level of Disease Section Compare with the Adjacent Tissue | p-value: 4.47E-01; Fold-change: -2.32E-02; Z-score: -1.60E-01 | ||||
|
DME expression in the diseased tissue of patients
DME expression in the normal tissue adjacent to the diseased tissue of patients
DME expression in the normal tissue of healthy individuals
|
|||||
| Violin Diagram of DME Disease-specific Protein Abundances |
|
Click to View the Clearer Original Diagram | |||
| ICD-11: 2A81 | Diffuse large B-cell lymphoma | Click to Show/Hide | |||
| The Studied Tissue | Tonsil tissue | ||||
| The Specified Disease | Diffuse large B-cell lymphoma [ICD-11:2A81] | ||||
| The Expression Level of Disease Section Compare with the Healthy Individual Tissue | p-value: 3.08E-01; Fold-change: 7.98E-03; Z-score: 3.57E-02 | ||||
|
DME expression in the diseased tissue of patients
DME expression in the normal tissue of healthy individuals
|
|||||
| Violin Diagram of DME Disease-specific Protein Abundances |
|
Click to View the Clearer Original Diagram | |||
| ICD-11: 2A83 | Plasma cell neoplasm | Click to Show/Hide | |||
| The Studied Tissue | Peripheral blood | ||||
| The Specified Disease | Multiple myeloma [ICD-11:2A83.1] | ||||
| The Expression Level of Disease Section Compare with the Healthy Individual Tissue | p-value: 6.60E-01; Fold-change: 2.51E-02; Z-score: 8.26E-02 | ||||
|
DME expression in the diseased tissue of patients
DME expression in the normal tissue of healthy individuals
|
|||||
| Violin Diagram of DME Disease-specific Protein Abundances |
|
Click to View the Clearer Original Diagram | |||
| The Studied Tissue | Bone marrow | ||||
| The Specified Disease | Multiple myeloma [ICD-11:2A83.1] | ||||
| The Expression Level of Disease Section Compare with the Healthy Individual Tissue | p-value: 8.62E-03; Fold-change: 1.37E-01; Z-score: 8.67E-01 | ||||
|
DME expression in the diseased tissue of patients
DME expression in the normal tissue of healthy individuals
|
|||||
| Violin Diagram of DME Disease-specific Protein Abundances |
|
Click to View the Clearer Original Diagram | |||
| ICD-11: 2B33 | Leukaemia | Click to Show/Hide | |||
| The Studied Tissue | Bone marrow | ||||
| The Specified Disease | Acute myelocytic leukaemia [ICD-11:2B33.1] | ||||
| The Expression Level of Disease Section Compare with the Healthy Individual Tissue | p-value: 4.83E-07; Fold-change: 8.08E-02; Z-score: 4.11E-01 | ||||
|
DME expression in the diseased tissue of patients
DME expression in the normal tissue of healthy individuals
|
|||||
| Violin Diagram of DME Disease-specific Protein Abundances |
|
Click to View the Clearer Original Diagram | |||
| ICD-11: 2B6E | Oral cancer | Click to Show/Hide | |||
| The Studied Tissue | Oral tissue | ||||
| The Specified Disease | Oral cancer [ICD-11:2B6E] | ||||
| The Expression Level of Disease Section Compare with the Healthy Individual Tissue | p-value: 5.98E-01; Fold-change: -5.34E-02; Z-score: -2.12E-01 | ||||
| The Expression Level of Disease Section Compare with the Adjacent Tissue | p-value: 1.49E-01; Fold-change: -6.42E-02; Z-score: -2.32E-01 | ||||
|
DME expression in the diseased tissue of patients
DME expression in the normal tissue adjacent to the diseased tissue of patients
DME expression in the normal tissue of healthy individuals
|
|||||
| Violin Diagram of DME Disease-specific Protein Abundances |
|
Click to View the Clearer Original Diagram | |||
| ICD-11: 2B70 | Esophageal cancer | Click to Show/Hide | |||
| The Studied Tissue | Esophagus | ||||
| The Specified Disease | Esophagal cancer [ICD-11:2B70] | ||||
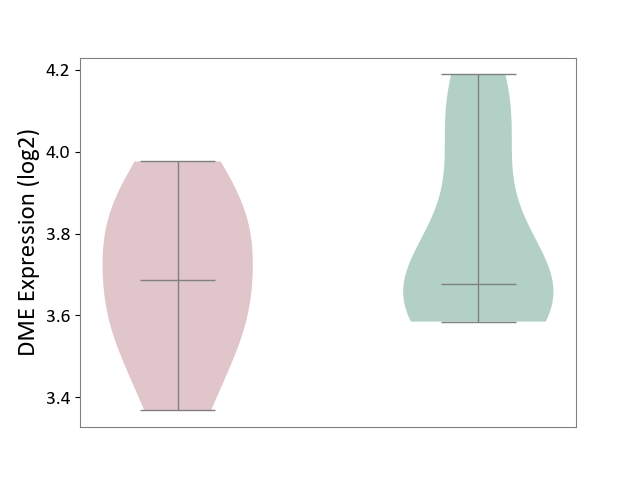
| The Expression Level of Disease Section Compare with the Adjacent Tissue | p-value: 1.56E-02; Fold-change: 1.55E-01; Z-score: 1.53E+00 | ||||
|
DME expression in the diseased tissue of patients
DME expression in the normal tissue adjacent to the diseased tissue of patients
|
|||||
| Violin Diagram of DME Disease-specific Protein Abundances |
|
Click to View the Clearer Original Diagram | |||
| ICD-11: 2B72 | Stomach cancer | Click to Show/Hide | |||
| The Studied Tissue | Gastric tissue | ||||
| The Specified Disease | Gastric cancer [ICD-11:2B72] | ||||
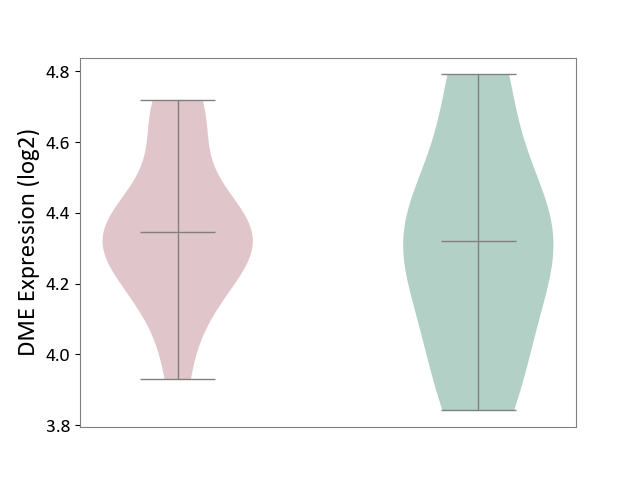
| The Expression Level of Disease Section Compare with the Healthy Individual Tissue | p-value: 7.39E-02; Fold-change: 3.09E-01; Z-score: 2.24E+00 | ||||
| The Expression Level of Disease Section Compare with the Adjacent Tissue | p-value: 6.79E-03; Fold-change: 2.06E-01; Z-score: 7.52E-01 | ||||
|
DME expression in the diseased tissue of patients
DME expression in the normal tissue adjacent to the diseased tissue of patients
DME expression in the normal tissue of healthy individuals
|
|||||
| Violin Diagram of DME Disease-specific Protein Abundances |
|
Click to View the Clearer Original Diagram | |||
| ICD-11: 2B90 | Colon cancer | Click to Show/Hide | |||
| The Studied Tissue | Colon tissue | ||||
| The Specified Disease | Colon cancer [ICD-11:2B90] | ||||
| The Expression Level of Disease Section Compare with the Healthy Individual Tissue | p-value: 3.70E-05; Fold-change: -8.48E-02; Z-score: -3.30E-01 | ||||
| The Expression Level of Disease Section Compare with the Adjacent Tissue | p-value: 1.09E-04; Fold-change: -6.45E-02; Z-score: -2.20E-01 | ||||
|
DME expression in the diseased tissue of patients
DME expression in the normal tissue adjacent to the diseased tissue of patients
DME expression in the normal tissue of healthy individuals
|
|||||
| Violin Diagram of DME Disease-specific Protein Abundances |
|
Click to View the Clearer Original Diagram | |||
| ICD-11: 2B92 | Rectal cancer | Click to Show/Hide | |||
| The Studied Tissue | Rectal colon tissue | ||||
| The Specified Disease | Rectal cancer [ICD-11:2B92] | ||||
| The Expression Level of Disease Section Compare with the Healthy Individual Tissue | p-value: 1.87E-02; Fold-change: -4.28E-01; Z-score: -1.94E+00 | ||||
| The Expression Level of Disease Section Compare with the Adjacent Tissue | p-value: 6.75E-01; Fold-change: 9.22E-02; Z-score: 1.41E-01 | ||||
|
DME expression in the diseased tissue of patients
DME expression in the normal tissue adjacent to the diseased tissue of patients
DME expression in the normal tissue of healthy individuals
|
|||||
| Violin Diagram of DME Disease-specific Protein Abundances |
|
Click to View the Clearer Original Diagram | |||
| ICD-11: 2C10 | Pancreatic cancer | Click to Show/Hide | |||
| The Studied Tissue | Pancreas | ||||
| The Specified Disease | Pancreatic cancer [ICD-11:2C10] | ||||
| The Expression Level of Disease Section Compare with the Healthy Individual Tissue | p-value: 2.45E-01; Fold-change: -1.66E-01; Z-score: -4.71E-01 | ||||
| The Expression Level of Disease Section Compare with the Adjacent Tissue | p-value: 6.94E-02; Fold-change: -7.70E-02; Z-score: -2.65E-01 | ||||
|
DME expression in the diseased tissue of patients
DME expression in the normal tissue adjacent to the diseased tissue of patients
DME expression in the normal tissue of healthy individuals
|
|||||
| Violin Diagram of DME Disease-specific Protein Abundances |
|
Click to View the Clearer Original Diagram | |||
| ICD-11: 2C12 | Liver cancer | Click to Show/Hide | |||
| The Studied Tissue | Liver tissue | ||||
| The Specified Disease | Liver cancer [ICD-11:2C12.0] | ||||
| The Expression Level of Disease Section Compare with the Healthy Individual Tissue | p-value: 6.94E-01; Fold-change: 1.98E-02; Z-score: 9.45E-02 | ||||
| The Expression Level of Disease Section Compare with the Adjacent Tissue | p-value: 6.13E-01; Fold-change: 9.54E-03; Z-score: 4.14E-02 | ||||
| The Expression Level of Disease Section Compare with the Other Disease Section | p-value: 2.87E-01; Fold-change: -1.92E-01; Z-score: -1.02E+00 | ||||
|
DME expression in the diseased tissue of patients
DME expression in the normal tissue adjacent to the diseased tissue of patients
DME expression in the normal tissue of healthy individuals
DME expression in tissue other than the diseased tissue of patients
|
|||||
| Violin Diagram of DME Disease-specific Protein Abundances |
|
Click to View the Clearer Original Diagram | |||
| ICD-11: 2C25 | Lung cancer | Click to Show/Hide | |||
| The Studied Tissue | Lung tissue | ||||
| The Specified Disease | Lung cancer [ICD-11:2C25] | ||||
| The Expression Level of Disease Section Compare with the Healthy Individual Tissue | p-value: 2.33E-02; Fold-change: 1.75E-02; Z-score: 8.91E-02 | ||||
| The Expression Level of Disease Section Compare with the Adjacent Tissue | p-value: 1.69E-01; Fold-change: -2.78E-02; Z-score: -9.72E-02 | ||||
|
DME expression in the diseased tissue of patients
DME expression in the normal tissue adjacent to the diseased tissue of patients
DME expression in the normal tissue of healthy individuals
|
|||||
| Violin Diagram of DME Disease-specific Protein Abundances |
|
Click to View the Clearer Original Diagram | |||
| ICD-11: 2C30 | Skin cancer | Click to Show/Hide | |||
| The Studied Tissue | Skin | ||||
| The Specified Disease | Melanoma [ICD-11:2C30] | ||||
| The Expression Level of Disease Section Compare with the Healthy Individual Tissue | p-value: 8.43E-01; Fold-change: 1.95E-02; Z-score: 3.86E-02 | ||||
|
DME expression in the diseased tissue of patients
DME expression in the normal tissue of healthy individuals
|
|||||
| Violin Diagram of DME Disease-specific Protein Abundances |
|
Click to View the Clearer Original Diagram | |||
| The Studied Tissue | Skin | ||||
| The Specified Disease | Skin cancer [ICD-11:2C30-2C3Z] | ||||
| The Expression Level of Disease Section Compare with the Healthy Individual Tissue | p-value: 3.45E-18; Fold-change: -3.01E-01; Z-score: -4.74E-01 | ||||
| The Expression Level of Disease Section Compare with the Adjacent Tissue | p-value: 2.61E-11; Fold-change: 2.18E-01; Z-score: 6.73E-01 | ||||
|
DME expression in the diseased tissue of patients
DME expression in the normal tissue adjacent to the diseased tissue of patients
DME expression in the normal tissue of healthy individuals
|
|||||
| Violin Diagram of DME Disease-specific Protein Abundances |

|
Click to View the Clearer Original Diagram | |||
| ICD-11: 2C6Z | Breast cancer | Click to Show/Hide | |||
| The Studied Tissue | Breast tissue | ||||
| The Specified Disease | Breast cancer [ICD-11:2C60-2C6Z] | ||||
| The Expression Level of Disease Section Compare with the Healthy Individual Tissue | p-value: 6.74E-01; Fold-change: -1.44E-02; Z-score: -7.35E-02 | ||||
| The Expression Level of Disease Section Compare with the Adjacent Tissue | p-value: 3.58E-01; Fold-change: -1.80E-02; Z-score: -5.68E-02 | ||||
|
DME expression in the diseased tissue of patients
DME expression in the normal tissue adjacent to the diseased tissue of patients
DME expression in the normal tissue of healthy individuals
|
|||||
| Violin Diagram of DME Disease-specific Protein Abundances |
|
Click to View the Clearer Original Diagram | |||
| ICD-11: 2C73 | Ovarian cancer | Click to Show/Hide | |||
| The Studied Tissue | Ovarian tissue | ||||
| The Specified Disease | Ovarian cancer [ICD-11:2C73] | ||||
| The Expression Level of Disease Section Compare with the Healthy Individual Tissue | p-value: 7.11E-01; Fold-change: 1.85E-01; Z-score: 5.52E-01 | ||||
| The Expression Level of Disease Section Compare with the Adjacent Tissue | p-value: 3.30E-01; Fold-change: -6.90E-02; Z-score: -3.16E-01 | ||||
|
DME expression in the diseased tissue of patients
DME expression in the normal tissue adjacent to the diseased tissue of patients
DME expression in the normal tissue of healthy individuals
|
|||||
| Violin Diagram of DME Disease-specific Protein Abundances |
|
Click to View the Clearer Original Diagram | |||
| ICD-11: 2C77 | Cervical cancer | Click to Show/Hide | |||
| The Studied Tissue | Cervical tissue | ||||
| The Specified Disease | Cervical cancer [ICD-11:2C77] | ||||
| The Expression Level of Disease Section Compare with the Healthy Individual Tissue | p-value: 2.40E-01; Fold-change: -7.00E-02; Z-score: -3.69E-01 | ||||
|
DME expression in the diseased tissue of patients
DME expression in the normal tissue of healthy individuals
|
|||||
| Violin Diagram of DME Disease-specific Protein Abundances |
|
Click to View the Clearer Original Diagram | |||
| ICD-11: 2C78 | Uterine cancer | Click to Show/Hide | |||
| The Studied Tissue | Endometrium tissue | ||||
| The Specified Disease | Uterine cancer [ICD-11:2C78] | ||||
| The Expression Level of Disease Section Compare with the Healthy Individual Tissue | p-value: 1.33E-18; Fold-change: 2.66E-01; Z-score: 1.10E+00 | ||||
| The Expression Level of Disease Section Compare with the Adjacent Tissue | p-value: 6.21E-02; Fold-change: 2.60E-01; Z-score: 1.40E+00 | ||||
|
DME expression in the diseased tissue of patients
DME expression in the normal tissue adjacent to the diseased tissue of patients
DME expression in the normal tissue of healthy individuals
|
|||||
| Violin Diagram of DME Disease-specific Protein Abundances |
|
Click to View the Clearer Original Diagram | |||
| ICD-11: 2C82 | Prostate cancer | Click to Show/Hide | |||
| The Studied Tissue | Prostate | ||||
| The Specified Disease | Prostate cancer [ICD-11:2C82] | ||||
| The Expression Level of Disease Section Compare with the Healthy Individual Tissue | p-value: 2.60E-03; Fold-change: 3.86E-01; Z-score: 8.02E-01 | ||||
|
DME expression in the diseased tissue of patients
DME expression in the normal tissue of healthy individuals
|
|||||
| Violin Diagram of DME Disease-specific Protein Abundances |
|
Click to View the Clearer Original Diagram | |||
| ICD-11: 2C90 | Renal cancer | Click to Show/Hide | |||
| The Studied Tissue | Kidney | ||||
| The Specified Disease | Renal cancer [ICD-11:2C90-2C91] | ||||
| The Expression Level of Disease Section Compare with the Healthy Individual Tissue | p-value: 2.57E-01; Fold-change: 8.93E-02; Z-score: 5.68E-01 | ||||
| The Expression Level of Disease Section Compare with the Adjacent Tissue | p-value: 1.85E-03; Fold-change: -9.19E-02; Z-score: -3.78E-01 | ||||
|
DME expression in the diseased tissue of patients
DME expression in the normal tissue adjacent to the diseased tissue of patients
DME expression in the normal tissue of healthy individuals
|
|||||
| Violin Diagram of DME Disease-specific Protein Abundances |
|
Click to View the Clearer Original Diagram | |||
| ICD-11: 2C92 | Ureter cancer | Click to Show/Hide | |||
| The Studied Tissue | Urothelium | ||||
| The Specified Disease | Ureter cancer [ICD-11:2C92] | ||||
| The Expression Level of Disease Section Compare with the Healthy Individual Tissue | p-value: 3.59E-01; Fold-change: -3.65E-02; Z-score: -1.61E-01 | ||||
|
DME expression in the diseased tissue of patients
DME expression in the normal tissue of healthy individuals
|
|||||
| Violin Diagram of DME Disease-specific Protein Abundances |
|
Click to View the Clearer Original Diagram | |||
| ICD-11: 2C94 | Bladder cancer | Click to Show/Hide | |||
| The Studied Tissue | Bladder tissue | ||||
| The Specified Disease | Bladder cancer [ICD-11:2C94] | ||||
| The Expression Level of Disease Section Compare with the Healthy Individual Tissue | p-value: 3.76E-02; Fold-change: 9.81E-02; Z-score: 4.02E-01 | ||||
|
DME expression in the diseased tissue of patients
DME expression in the normal tissue of healthy individuals
|
|||||
| Violin Diagram of DME Disease-specific Protein Abundances |
|
Click to View the Clearer Original Diagram | |||
| ICD-11: 2D02 | Retinal cancer | Click to Show/Hide | |||
| The Studied Tissue | Uvea | ||||
| The Specified Disease | Retinoblastoma [ICD-11:2D02.2] | ||||
| The Expression Level of Disease Section Compare with the Healthy Individual Tissue | p-value: 3.14E-02; Fold-change: -1.16E-01; Z-score: -6.08E-01 | ||||
|
DME expression in the diseased tissue of patients
DME expression in the normal tissue of healthy individuals
|
|||||
| Violin Diagram of DME Disease-specific Protein Abundances |
|
Click to View the Clearer Original Diagram | |||
| ICD-11: 2D10 | Thyroid cancer | Click to Show/Hide | |||
| The Studied Tissue | Thyroid | ||||
| The Specified Disease | Thyroid cancer [ICD-11:2D10] | ||||
| The Expression Level of Disease Section Compare with the Healthy Individual Tissue | p-value: 5.73E-01; Fold-change: -2.96E-02; Z-score: -1.22E-01 | ||||
| The Expression Level of Disease Section Compare with the Adjacent Tissue | p-value: 3.31E-01; Fold-change: 4.72E-02; Z-score: 1.93E-01 | ||||
|
DME expression in the diseased tissue of patients
DME expression in the normal tissue adjacent to the diseased tissue of patients
DME expression in the normal tissue of healthy individuals
|
|||||
| Violin Diagram of DME Disease-specific Protein Abundances |
|
Click to View the Clearer Original Diagram | |||
| ICD-11: 2D11 | Adrenal cancer | Click to Show/Hide | |||
| The Studied Tissue | Adrenal cortex | ||||
| The Specified Disease | Adrenocortical carcinoma [ICD-11:2D11.Z] | ||||
| The Expression Level of Disease Section Compare with the Other Disease Section | p-value: 1.98E-04; Fold-change: -2.03E-01; Z-score: -1.30E+00 | ||||
|
DME expression in the diseased tissue of patients
DME expression in tissue other than the diseased tissue of patients
|
|||||
| Violin Diagram of DME Disease-specific Protein Abundances |
|
Click to View the Clearer Original Diagram | |||
| ICD-11: 2D12 | Endocrine gland neoplasm | Click to Show/Hide | |||
| The Studied Tissue | Pituitary tissue | ||||
| The Specified Disease | Pituitary cancer [ICD-11:2D12] | ||||
| The Expression Level of Disease Section Compare with the Healthy Individual Tissue | p-value: 1.83E-03; Fold-change: 2.27E-01; Z-score: 1.62E+00 | ||||
|
DME expression in the diseased tissue of patients
DME expression in the normal tissue of healthy individuals
|
|||||
| Violin Diagram of DME Disease-specific Protein Abundances |
|
Click to View the Clearer Original Diagram | |||
| The Studied Tissue | Pituitary tissue | ||||
| The Specified Disease | Pituitary gonadotrope tumour [ICD-11:2D12] | ||||
| The Expression Level of Disease Section Compare with the Healthy Individual Tissue | p-value: 8.42E-02; Fold-change: 7.93E-02; Z-score: 4.07E-01 | ||||
|
DME expression in the diseased tissue of patients
DME expression in the normal tissue of healthy individuals
|
|||||
| Violin Diagram of DME Disease-specific Protein Abundances |
|
Click to View the Clearer Original Diagram | |||
| ICD-11: 2D42 | Head and neck cancer | Click to Show/Hide | |||
| The Studied Tissue | Head and neck tissue | ||||
| The Specified Disease | Head and neck cancer [ICD-11:2D42] | ||||
| The Expression Level of Disease Section Compare with the Healthy Individual Tissue | p-value: 1.04E-03; Fold-change: -7.68E-02; Z-score: -3.85E-01 | ||||
|
DME expression in the diseased tissue of patients
DME expression in the normal tissue of healthy individuals
|
|||||
| Violin Diagram of DME Disease-specific Protein Abundances |
|
Click to View the Clearer Original Diagram | |||
| ICD Disease Classification 03 | Blood/blood-forming organ disease | Click to Show/Hide | |||
| ICD-11: 3A51 | Sickle cell disorder | Click to Show/Hide | |||
| The Studied Tissue | Peripheral blood | ||||
| The Specified Disease | Sickle cell disease [ICD-11:3A51.0-3A51.3] | ||||
| The Expression Level of Disease Section Compare with the Healthy Individual Tissue | p-value: 5.29E-02; Fold-change: 2.26E-01; Z-score: 1.23E+00 | ||||
|
DME expression in the diseased tissue of patients
DME expression in the normal tissue of healthy individuals
|
|||||
| Violin Diagram of DME Disease-specific Protein Abundances |
|
Click to View the Clearer Original Diagram | |||
| ICD-11: 3A70 | Aplastic anaemia | Click to Show/Hide | |||
| The Studied Tissue | Bone marrow | ||||
| The Specified Disease | Shwachman-Diamond syndrome [ICD-11:3A70.0] | ||||
| The Expression Level of Disease Section Compare with the Healthy Individual Tissue | p-value: 3.66E-01; Fold-change: -1.22E-01; Z-score: -3.85E-01 | ||||
|
DME expression in the diseased tissue of patients
DME expression in the normal tissue of healthy individuals
|
|||||
| Violin Diagram of DME Disease-specific Protein Abundances |
|
Click to View the Clearer Original Diagram | |||
| ICD-11: 3B63 | Thrombocytosis | Click to Show/Hide | |||
| The Studied Tissue | Whole blood | ||||
| The Specified Disease | Thrombocythemia [ICD-11:3B63] | ||||
| The Expression Level of Disease Section Compare with the Healthy Individual Tissue | p-value: 4.03E-01; Fold-change: 2.82E-02; Z-score: 1.62E-01 | ||||
|
DME expression in the diseased tissue of patients
DME expression in the normal tissue of healthy individuals
|
|||||
| Violin Diagram of DME Disease-specific Protein Abundances |
|
Click to View the Clearer Original Diagram | |||
| ICD-11: 3B64 | Thrombocytopenia | Click to Show/Hide | |||
| The Studied Tissue | Whole blood | ||||
| The Specified Disease | Thrombocytopenia [ICD-11:3B64] | ||||
| The Expression Level of Disease Section Compare with the Healthy Individual Tissue | p-value: 5.31E-01; Fold-change: 7.20E-02; Z-score: 4.31E-01 | ||||
|
DME expression in the diseased tissue of patients
DME expression in the normal tissue of healthy individuals
|
|||||
| Violin Diagram of DME Disease-specific Protein Abundances |
|
Click to View the Clearer Original Diagram | |||
| ICD Disease Classification 04 | Immune system disease | Click to Show/Hide | |||
| ICD-11: 4A00 | Immunodeficiency | Click to Show/Hide | |||
| The Studied Tissue | Peripheral blood | ||||
| The Specified Disease | Immunodeficiency [ICD-11:4A00-4A20] | ||||
| The Expression Level of Disease Section Compare with the Healthy Individual Tissue | p-value: 2.34E-01; Fold-change: 1.78E-02; Z-score: 1.52E-01 | ||||
|
DME expression in the diseased tissue of patients
DME expression in the normal tissue of healthy individuals
|
|||||
| Violin Diagram of DME Disease-specific Protein Abundances |
|
Click to View the Clearer Original Diagram | |||
| ICD-11: 4A40 | Lupus erythematosus | Click to Show/Hide | |||
| The Studied Tissue | Whole blood | ||||
| The Specified Disease | Lupus erythematosus [ICD-11:4A40] | ||||
| The Expression Level of Disease Section Compare with the Healthy Individual Tissue | p-value: 2.19E-02; Fold-change: -3.33E-02; Z-score: -7.37E-02 | ||||
|
DME expression in the diseased tissue of patients
DME expression in the normal tissue of healthy individuals
|
|||||
| Violin Diagram of DME Disease-specific Protein Abundances |
|
Click to View the Clearer Original Diagram | |||
| ICD-11: 4A42 | Systemic sclerosis | Click to Show/Hide | |||
| The Studied Tissue | Whole blood | ||||
| The Specified Disease | Scleroderma [ICD-11:4A42.Z] | ||||
| The Expression Level of Disease Section Compare with the Healthy Individual Tissue | p-value: 7.26E-09; Fold-change: 3.41E-01; Z-score: 4.05E+00 | ||||
|
DME expression in the diseased tissue of patients
DME expression in the normal tissue of healthy individuals
|
|||||
| Violin Diagram of DME Disease-specific Protein Abundances |
|
Click to View the Clearer Original Diagram | |||
| ICD-11: 4A43 | Systemic autoimmune disease | Click to Show/Hide | |||
| The Studied Tissue | Salivary gland tissue | ||||
| The Specified Disease | Sjogren's syndrome [ICD-11:4A43.2] | ||||
| The Expression Level of Disease Section Compare with the Healthy Individual Tissue | p-value: 4.19E-01; Fold-change: -2.73E-01; Z-score: -1.01E+00 | ||||
| The Expression Level of Disease Section Compare with the Adjacent Tissue | p-value: 2.12E-01; Fold-change: 2.86E-02; Z-score: 3.26E-01 | ||||
|
DME expression in the diseased tissue of patients
DME expression in the normal tissue adjacent to the diseased tissue of patients
DME expression in the normal tissue of healthy individuals
|
|||||
| Violin Diagram of DME Disease-specific Protein Abundances |
|
Click to View the Clearer Original Diagram | |||
| ICD-11: 4A62 | Behcet disease | Click to Show/Hide | |||
| The Studied Tissue | Peripheral blood | ||||
| The Specified Disease | Behcet's disease [ICD-11:4A62] | ||||
| The Expression Level of Disease Section Compare with the Healthy Individual Tissue | p-value: 6.15E-01; Fold-change: 2.28E-02; Z-score: 1.18E-01 | ||||
|
DME expression in the diseased tissue of patients
DME expression in the normal tissue of healthy individuals
|
|||||
| Violin Diagram of DME Disease-specific Protein Abundances |
|
Click to View the Clearer Original Diagram | |||
| ICD-11: 4B04 | Monocyte count disorder | Click to Show/Hide | |||
| The Studied Tissue | Whole blood | ||||
| The Specified Disease | Autosomal dominant monocytopenia [ICD-11:4B04] | ||||
| The Expression Level of Disease Section Compare with the Healthy Individual Tissue | p-value: 5.60E-01; Fold-change: -5.65E-02; Z-score: -4.75E-01 | ||||
|
DME expression in the diseased tissue of patients
DME expression in the normal tissue of healthy individuals
|
|||||
| Violin Diagram of DME Disease-specific Protein Abundances |
|
Click to View the Clearer Original Diagram | |||
| ICD Disease Classification 05 | Endocrine/nutritional/metabolic disease | Click to Show/Hide | |||
| ICD-11: 5A11 | Type 2 diabetes mellitus | Click to Show/Hide | |||
| The Studied Tissue | Omental adipose tissue | ||||
| The Specified Disease | Obesity related type 2 diabetes [ICD-11:5A11] | ||||
| The Expression Level of Disease Section Compare with the Healthy Individual Tissue | p-value: 5.78E-01; Fold-change: -1.53E-02; Z-score: -3.93E-01 | ||||
|
DME expression in the diseased tissue of patients
DME expression in the normal tissue of healthy individuals
|
|||||
| Violin Diagram of DME Disease-specific Protein Abundances |
|
Click to View the Clearer Original Diagram | |||
| The Studied Tissue | Liver tissue | ||||
| The Specified Disease | Type 2 diabetes [ICD-11:5A11] | ||||
| The Expression Level of Disease Section Compare with the Healthy Individual Tissue | p-value: 5.20E-01; Fold-change: -3.27E-03; Z-score: -2.84E-02 | ||||
|
DME expression in the diseased tissue of patients
DME expression in the normal tissue of healthy individuals
|
|||||
| Violin Diagram of DME Disease-specific Protein Abundances |
|
Click to View the Clearer Original Diagram | |||
| ICD-11: 5A80 | Ovarian dysfunction | Click to Show/Hide | |||
| The Studied Tissue | Vastus lateralis muscle | ||||
| The Specified Disease | Polycystic ovary syndrome [ICD-11:5A80.1] | ||||
| The Expression Level of Disease Section Compare with the Healthy Individual Tissue | p-value: 9.39E-01; Fold-change: 4.04E-02; Z-score: 1.42E-01 | ||||
|
DME expression in the diseased tissue of patients
DME expression in the normal tissue of healthy individuals
|
|||||
| Violin Diagram of DME Disease-specific Protein Abundances |
|
Click to View the Clearer Original Diagram | |||
| ICD-11: 5C51 | Inborn carbohydrate metabolism disorder | Click to Show/Hide | |||
| The Studied Tissue | Biceps muscle | ||||
| The Specified Disease | Pompe disease [ICD-11:5C51.3] | ||||
| The Expression Level of Disease Section Compare with the Healthy Individual Tissue | p-value: 4.05E-01; Fold-change: -1.01E-01; Z-score: -5.06E-01 | ||||
|
DME expression in the diseased tissue of patients
DME expression in the normal tissue of healthy individuals
|
|||||
| Violin Diagram of DME Disease-specific Protein Abundances |
|
Click to View the Clearer Original Diagram | |||
| ICD-11: 5C56 | Lysosomal disease | Click to Show/Hide | |||
| The Studied Tissue | Whole blood | ||||
| The Specified Disease | Batten disease [ICD-11:5C56.1] | ||||
| The Expression Level of Disease Section Compare with the Healthy Individual Tissue | p-value: 9.21E-01; Fold-change: -5.04E-02; Z-score: -4.11E-01 | ||||
|
DME expression in the diseased tissue of patients
DME expression in the normal tissue of healthy individuals
|
|||||
| Violin Diagram of DME Disease-specific Protein Abundances |
|
Click to View the Clearer Original Diagram | |||
| ICD-11: 5C80 | Hyperlipoproteinaemia | Click to Show/Hide | |||
| The Studied Tissue | Peripheral blood | ||||
| The Specified Disease | Familial hypercholesterolemia [ICD-11:5C80.00] | ||||
| The Expression Level of Disease Section Compare with the Healthy Individual Tissue | p-value: 2.10E-01; Fold-change: 1.41E-01; Z-score: 6.42E-01 | ||||
|
DME expression in the diseased tissue of patients
DME expression in the normal tissue of healthy individuals
|
|||||
| Violin Diagram of DME Disease-specific Protein Abundances |
|
Click to View the Clearer Original Diagram | |||
| The Studied Tissue | Whole blood | ||||
| The Specified Disease | Familial hypercholesterolemia [ICD-11:5C80.00] | ||||
| The Expression Level of Disease Section Compare with the Healthy Individual Tissue | p-value: 2.00E-01; Fold-change: 5.79E-02; Z-score: 3.00E-01 | ||||
|
DME expression in the diseased tissue of patients
DME expression in the normal tissue of healthy individuals
|
|||||
| Violin Diagram of DME Disease-specific Protein Abundances |
|
Click to View the Clearer Original Diagram | |||
| ICD Disease Classification 06 | Mental/behavioural/neurodevelopmental disorder | Click to Show/Hide | |||
| ICD-11: 6A02 | Autism spectrum disorder | Click to Show/Hide | |||
| The Studied Tissue | Whole blood | ||||
| The Specified Disease | Autism [ICD-11:6A02] | ||||
| The Expression Level of Disease Section Compare with the Healthy Individual Tissue | p-value: 2.69E-01; Fold-change: 4.90E-02; Z-score: 1.88E-01 | ||||
|
DME expression in the diseased tissue of patients
DME expression in the normal tissue of healthy individuals
|
|||||
| Violin Diagram of DME Disease-specific Protein Abundances |
|
Click to View the Clearer Original Diagram | |||
| ICD-11: 6A20 | Schizophrenia | Click to Show/Hide | |||
| The Studied Tissue | Prefrontal cortex | ||||
| The Specified Disease | Schizophrenia [ICD-11:6A20] | ||||
| The Expression Level of Disease Section Compare with the Healthy Individual Tissue | p-value: 8.03E-01; Fold-change: 9.92E-03; Z-score: 4.89E-02 | ||||
|
DME expression in the diseased tissue of patients
DME expression in the normal tissue of healthy individuals
|
|||||
| Violin Diagram of DME Disease-specific Protein Abundances |
|
Click to View the Clearer Original Diagram | |||
| The Studied Tissue | Superior temporal cortex | ||||
| The Specified Disease | Schizophrenia [ICD-11:6A20] | ||||
| The Expression Level of Disease Section Compare with the Healthy Individual Tissue | p-value: 1.42E-01; Fold-change: -4.97E-02; Z-score: -3.73E-01 | ||||
|
DME expression in the diseased tissue of patients
DME expression in the normal tissue of healthy individuals
|
|||||
| Violin Diagram of DME Disease-specific Protein Abundances |
|
Click to View the Clearer Original Diagram | |||
| ICD-11: 6A60 | Bipolar disorder | Click to Show/Hide | |||
| The Studied Tissue | Prefrontal cortex | ||||
| The Specified Disease | Bipolar disorder [ICD-11:6A60-6A6Z] | ||||
| The Expression Level of Disease Section Compare with the Healthy Individual Tissue | p-value: 2.03E-01; Fold-change: 8.52E-02; Z-score: 6.41E-01 | ||||
|
DME expression in the diseased tissue of patients
DME expression in the normal tissue of healthy individuals
|
|||||
| Violin Diagram of DME Disease-specific Protein Abundances |
|
Click to View the Clearer Original Diagram | |||
| ICD-11: 6A70 | Depressive disorder | Click to Show/Hide | |||
| The Studied Tissue | Whole blood | ||||
| The Specified Disease | Major depressive disorder [ICD-11:6A70-6A7Z] | ||||
| The Expression Level of Disease Section Compare with the Healthy Individual Tissue | p-value: 9.17E-02; Fold-change: 4.08E-02; Z-score: 1.59E-01 | ||||
|
DME expression in the diseased tissue of patients
DME expression in the normal tissue of healthy individuals
|
|||||
| Violin Diagram of DME Disease-specific Protein Abundances |
|
Click to View the Clearer Original Diagram | |||
| The Studied Tissue | Hippocampus | ||||
| The Specified Disease | Major depressive disorder [ICD-11:6A70-6A7Z] | ||||
| The Expression Level of Disease Section Compare with the Healthy Individual Tissue | p-value: 1.87E-01; Fold-change: 4.98E-02; Z-score: 3.61E-01 | ||||
|
DME expression in the diseased tissue of patients
DME expression in the normal tissue of healthy individuals
|
|||||
| Violin Diagram of DME Disease-specific Protein Abundances |
|
Click to View the Clearer Original Diagram | |||
| ICD Disease Classification 08 | Nervous system disease | Click to Show/Hide | |||
| ICD-11: 8A00 | Parkinsonism | Click to Show/Hide | |||
| The Studied Tissue | Substantia nigra tissue | ||||
| The Specified Disease | Parkinson's disease [ICD-11:8A00.0] | ||||
| The Expression Level of Disease Section Compare with the Healthy Individual Tissue | p-value: 4.53E-01; Fold-change: 4.14E-02; Z-score: 1.83E-01 | ||||
|
DME expression in the diseased tissue of patients
DME expression in the normal tissue of healthy individuals
|
|||||
| Violin Diagram of DME Disease-specific Protein Abundances |
|
Click to View the Clearer Original Diagram | |||
| ICD-11: 8A01 | Choreiform disorder | Click to Show/Hide | |||
| The Studied Tissue | Whole blood | ||||
| The Specified Disease | Huntington's disease [ICD-11:8A01.10] | ||||
| The Expression Level of Disease Section Compare with the Healthy Individual Tissue | p-value: 8.92E-01; Fold-change: -9.30E-02; Z-score: -6.37E-01 | ||||
|
DME expression in the diseased tissue of patients
DME expression in the normal tissue of healthy individuals
|
|||||
| Violin Diagram of DME Disease-specific Protein Abundances |
|
Click to View the Clearer Original Diagram | |||
| ICD-11: 8A20 | Alzheimer disease | Click to Show/Hide | |||
| The Studied Tissue | Entorhinal cortex | ||||
| The Specified Disease | Alzheimer's disease [ICD-11:8A20] | ||||
| The Expression Level of Disease Section Compare with the Healthy Individual Tissue | p-value: 1.10E-01; Fold-change: -5.91E-02; Z-score: -3.60E-01 | ||||
|
DME expression in the diseased tissue of patients
DME expression in the normal tissue of healthy individuals
|
|||||
| Violin Diagram of DME Disease-specific Protein Abundances |
|
Click to View the Clearer Original Diagram | |||
| ICD-11: 8A2Y | Neurocognitive impairment | Click to Show/Hide | |||
| The Studied Tissue | White matter tissue | ||||
| The Specified Disease | HIV-associated neurocognitive impairment [ICD-11:8A2Y-8A2Z] | ||||
| The Expression Level of Disease Section Compare with the Healthy Individual Tissue | p-value: 5.34E-02; Fold-change: -7.88E-02; Z-score: -1.98E-01 | ||||
|
DME expression in the diseased tissue of patients
DME expression in the normal tissue of healthy individuals
|
|||||
| Violin Diagram of DME Disease-specific Protein Abundances |
|
Click to View the Clearer Original Diagram | |||
| ICD-11: 8A40 | Multiple sclerosis | Click to Show/Hide | |||
| The Studied Tissue | Plasmacytoid dendritic cells | ||||
| The Specified Disease | Multiple sclerosis [ICD-11:8A40] | ||||
| The Expression Level of Disease Section Compare with the Healthy Individual Tissue | p-value: 7.69E-01; Fold-change: 1.91E-02; Z-score: 5.45E-02 | ||||
|
DME expression in the diseased tissue of patients
DME expression in the normal tissue of healthy individuals
|
|||||
| Violin Diagram of DME Disease-specific Protein Abundances |
|
Click to View the Clearer Original Diagram | |||
| The Studied Tissue | Spinal cord | ||||
| The Specified Disease | Multiple sclerosis [ICD-11:8A40] | ||||
| The Expression Level of Disease Section Compare with the Adjacent Tissue | p-value: 3.34E-01; Fold-change: -3.84E-01; Z-score: -1.29E+00 | ||||
|
DME expression in the diseased tissue of patients
DME expression in the normal tissue adjacent to the diseased tissue of patients
|
|||||
| Violin Diagram of DME Disease-specific Protein Abundances |
|
Click to View the Clearer Original Diagram | |||
| ICD-11: 8A60 | Epilepsy | Click to Show/Hide | |||
| The Studied Tissue | Peritumoral cortex tissue | ||||
| The Specified Disease | Epilepsy [ICD-11:8A60-8A6Z] | ||||
| The Expression Level of Disease Section Compare with the Other Disease Section | p-value: 8.69E-01; Fold-change: -2.40E-01; Z-score: -8.34E-01 | ||||
|
DME expression in the diseased tissue of patients
DME expression in tissue other than the diseased tissue of patients
|
|||||
| Violin Diagram of DME Disease-specific Protein Abundances |
|
Click to View the Clearer Original Diagram | |||
| The Studied Tissue | Whole blood | ||||
| The Specified Disease | Seizure [ICD-11:8A60-8A6Z] | ||||
| The Expression Level of Disease Section Compare with the Healthy Individual Tissue | p-value: 3.23E-01; Fold-change: -3.50E-02; Z-score: -1.96E-01 | ||||
|
DME expression in the diseased tissue of patients
DME expression in the normal tissue of healthy individuals
|
|||||
| Violin Diagram of DME Disease-specific Protein Abundances |
|
Click to View the Clearer Original Diagram | |||
| ICD-11: 8B01 | Subarachnoid haemorrhage | Click to Show/Hide | |||
| The Studied Tissue | Intracranial artery | ||||
| The Specified Disease | Intracranial aneurysm [ICD-11:8B01.0] | ||||
| The Expression Level of Disease Section Compare with the Healthy Individual Tissue | p-value: 3.06E-01; Fold-change: -3.90E-02; Z-score: -1.78E-01 | ||||
|
DME expression in the diseased tissue of patients
DME expression in the normal tissue of healthy individuals
|
|||||
| Violin Diagram of DME Disease-specific Protein Abundances |
|
Click to View the Clearer Original Diagram | |||
| ICD-11: 8B11 | Cerebral ischaemic stroke | Click to Show/Hide | |||
| The Studied Tissue | Whole blood | ||||
| The Specified Disease | Cardioembolic stroke [ICD-11:8B11.20] | ||||
| The Expression Level of Disease Section Compare with the Healthy Individual Tissue | p-value: 2.22E-04; Fold-change: 2.15E-01; Z-score: 1.22E+00 | ||||
|
DME expression in the diseased tissue of patients
DME expression in the normal tissue of healthy individuals
|
|||||
| Violin Diagram of DME Disease-specific Protein Abundances |
|
Click to View the Clearer Original Diagram | |||
| The Studied Tissue | Peripheral blood | ||||
| The Specified Disease | Ischemic stroke [ICD-11:8B11] | ||||
| The Expression Level of Disease Section Compare with the Healthy Individual Tissue | p-value: 2.61E-01; Fold-change: -6.03E-02; Z-score: -2.74E-01 | ||||
|
DME expression in the diseased tissue of patients
DME expression in the normal tissue of healthy individuals
|
|||||
| Violin Diagram of DME Disease-specific Protein Abundances |
|
Click to View the Clearer Original Diagram | |||
| ICD-11: 8B60 | Motor neuron disease | Click to Show/Hide | |||
| The Studied Tissue | Skin | ||||
| The Specified Disease | Lateral sclerosis [ICD-11:8B60.4] | ||||
| The Expression Level of Disease Section Compare with the Healthy Individual Tissue | p-value: 6.40E-01; Fold-change: 3.70E-02; Z-score: 1.48E-01 | ||||
|
DME expression in the diseased tissue of patients
DME expression in the normal tissue of healthy individuals
|
|||||
| Violin Diagram of DME Disease-specific Protein Abundances |
|
Click to View the Clearer Original Diagram | |||
| The Studied Tissue | Cervical spinal cord | ||||
| The Specified Disease | Lateral sclerosis [ICD-11:8B60.4] | ||||
| The Expression Level of Disease Section Compare with the Healthy Individual Tissue | p-value: 5.01E-01; Fold-change: 1.93E-01; Z-score: 4.52E-01 | ||||
|
DME expression in the diseased tissue of patients
DME expression in the normal tissue of healthy individuals
|
|||||
| Violin Diagram of DME Disease-specific Protein Abundances |
|
Click to View the Clearer Original Diagram | |||
| ICD-11: 8C70 | Muscular dystrophy | Click to Show/Hide | |||
| The Studied Tissue | Muscle tissue | ||||
| The Specified Disease | Myopathy [ICD-11:8C70.6] | ||||
| The Expression Level of Disease Section Compare with the Healthy Individual Tissue | p-value: 5.94E-01; Fold-change: -1.29E-01; Z-score: -8.90E-01 | ||||
|
DME expression in the diseased tissue of patients
DME expression in the normal tissue of healthy individuals
|
|||||
| Violin Diagram of DME Disease-specific Protein Abundances |
|
Click to View the Clearer Original Diagram | |||
| ICD-11: 8C75 | Distal myopathy | Click to Show/Hide | |||
| The Studied Tissue | Muscle tissue | ||||
| The Specified Disease | Tibial muscular dystrophy [ICD-11:8C75] | ||||
| The Expression Level of Disease Section Compare with the Healthy Individual Tissue | p-value: 6.96E-03; Fold-change: -1.95E-01; Z-score: -8.72E-01 | ||||
|
DME expression in the diseased tissue of patients
DME expression in the normal tissue of healthy individuals
|
|||||
| Violin Diagram of DME Disease-specific Protein Abundances |
|
Click to View the Clearer Original Diagram | |||
| ICD Disease Classification 09 | Visual system disease | Click to Show/Hide | |||
| ICD-11: 9A96 | Anterior uveitis | Click to Show/Hide | |||
| The Studied Tissue | Peripheral monocyte | ||||
| The Specified Disease | Autoimmune uveitis [ICD-11:9A96] | ||||
| The Expression Level of Disease Section Compare with the Healthy Individual Tissue | p-value: 6.04E-02; Fold-change: -2.20E-01; Z-score: -1.16E+00 | ||||
|
DME expression in the diseased tissue of patients
DME expression in the normal tissue of healthy individuals
|
|||||
| Violin Diagram of DME Disease-specific Protein Abundances |
|
Click to View the Clearer Original Diagram | |||
| ICD Disease Classification 11 | Circulatory system disease | Click to Show/Hide | |||
| ICD-11: BA41 | Myocardial infarction | Click to Show/Hide | |||
| The Studied Tissue | Peripheral blood | ||||
| The Specified Disease | Myocardial infarction [ICD-11:BA41-BA50] | ||||
| The Expression Level of Disease Section Compare with the Healthy Individual Tissue | p-value: 1.86E-01; Fold-change: 5.00E-02; Z-score: 1.43E-01 | ||||
|
DME expression in the diseased tissue of patients
DME expression in the normal tissue of healthy individuals
|
|||||
| Violin Diagram of DME Disease-specific Protein Abundances |
|
Click to View the Clearer Original Diagram | |||
| ICD-11: BA80 | Coronary artery disease | Click to Show/Hide | |||
| The Studied Tissue | Peripheral blood | ||||
| The Specified Disease | Coronary artery disease [ICD-11:BA80-BA8Z] | ||||
| The Expression Level of Disease Section Compare with the Healthy Individual Tissue | p-value: 3.89E-01; Fold-change: -6.89E-02; Z-score: -2.01E-01 | ||||
|
DME expression in the diseased tissue of patients
DME expression in the normal tissue of healthy individuals
|
|||||
| Violin Diagram of DME Disease-specific Protein Abundances |
|
Click to View the Clearer Original Diagram | |||
| ICD-11: BB70 | Aortic valve stenosis | Click to Show/Hide | |||
| The Studied Tissue | Calcified aortic valve | ||||
| The Specified Disease | Aortic stenosis [ICD-11:BB70] | ||||
| The Expression Level of Disease Section Compare with the Healthy Individual Tissue | p-value: 1.84E-01; Fold-change: 2.05E-01; Z-score: 8.91E-01 | ||||
|
DME expression in the diseased tissue of patients
DME expression in the normal tissue of healthy individuals
|
|||||
| Violin Diagram of DME Disease-specific Protein Abundances |
|
Click to View the Clearer Original Diagram | |||
| ICD Disease Classification 12 | Respiratory system disease | Click to Show/Hide | |||
| ICD-11: 7A40 | Central sleep apnoea | Click to Show/Hide | |||
| The Studied Tissue | Hyperplastic tonsil | ||||
| The Specified Disease | Apnea [ICD-11:7A40] | ||||
| The Expression Level of Disease Section Compare with the Healthy Individual Tissue | p-value: 3.44E-01; Fold-change: -2.67E-02; Z-score: -1.48E-01 | ||||
|
DME expression in the diseased tissue of patients
DME expression in the normal tissue of healthy individuals
|
|||||
| Violin Diagram of DME Disease-specific Protein Abundances |
|
Click to View the Clearer Original Diagram | |||
| ICD-11: CA08 | Vasomotor or allergic rhinitis | Click to Show/Hide | |||
| The Studied Tissue | Peripheral blood | ||||
| The Specified Disease | Olive pollen allergy [ICD-11:CA08.00] | ||||
| The Expression Level of Disease Section Compare with the Healthy Individual Tissue | p-value: 6.85E-01; Fold-change: -4.31E-02; Z-score: -2.18E-01 | ||||
|
DME expression in the diseased tissue of patients
DME expression in the normal tissue of healthy individuals
|
|||||
| Violin Diagram of DME Disease-specific Protein Abundances |
|
Click to View the Clearer Original Diagram | |||
| ICD-11: CA0A | Chronic rhinosinusitis | Click to Show/Hide | |||
| The Studied Tissue | Sinus mucosa tissue | ||||
| The Specified Disease | Chronic rhinosinusitis [ICD-11:CA0A] | ||||
| The Expression Level of Disease Section Compare with the Healthy Individual Tissue | p-value: 6.93E-01; Fold-change: 1.04E-02; Z-score: 8.52E-02 | ||||
|
DME expression in the diseased tissue of patients
DME expression in the normal tissue of healthy individuals
|
|||||
| Violin Diagram of DME Disease-specific Protein Abundances |
|
Click to View the Clearer Original Diagram | |||
| ICD-11: CA22 | Chronic obstructive pulmonary disease | Click to Show/Hide | |||
| The Studied Tissue | Lung tissue | ||||
| The Specified Disease | Chronic obstructive pulmonary disease [ICD-11:CA22] | ||||
| The Expression Level of Disease Section Compare with the Healthy Individual Tissue | p-value: 8.29E-01; Fold-change: -5.44E-03; Z-score: -2.25E-02 | ||||
|
DME expression in the diseased tissue of patients
DME expression in the normal tissue of healthy individuals
|
|||||
| Violin Diagram of DME Disease-specific Protein Abundances |
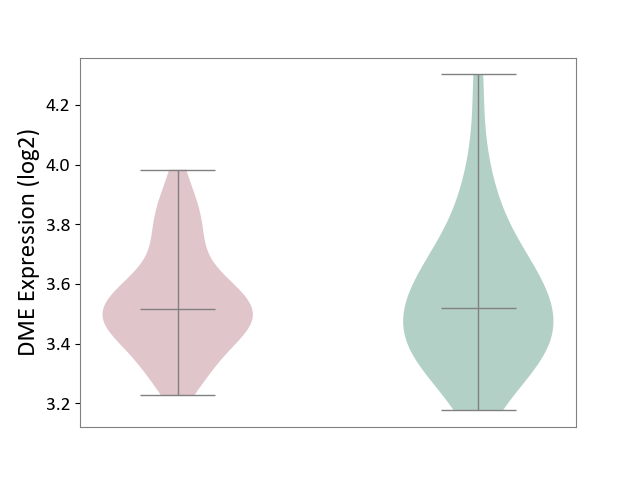
|
Click to View the Clearer Original Diagram | |||
| The Studied Tissue | Small airway epithelium | ||||
| The Specified Disease | Chronic obstructive pulmonary disease [ICD-11:CA22] | ||||
| The Expression Level of Disease Section Compare with the Healthy Individual Tissue | p-value: 4.23E-03; Fold-change: 9.31E-02; Z-score: 4.30E-01 | ||||
|
DME expression in the diseased tissue of patients
DME expression in the normal tissue of healthy individuals
|
|||||
| Violin Diagram of DME Disease-specific Protein Abundances |
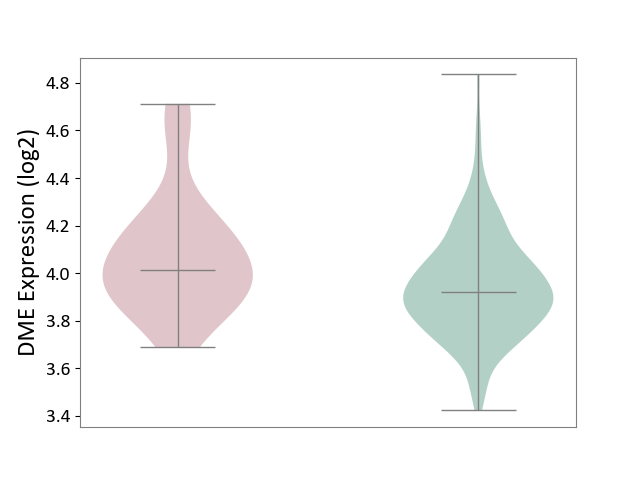
|
Click to View the Clearer Original Diagram | |||
| ICD-11: CA23 | Asthma | Click to Show/Hide | |||
| The Studied Tissue | Nasal and bronchial airway | ||||
| The Specified Disease | Asthma [ICD-11:CA23] | ||||
| The Expression Level of Disease Section Compare with the Healthy Individual Tissue | p-value: 3.80E-01; Fold-change: -9.11E-03; Z-score: -3.47E-02 | ||||
|
DME expression in the diseased tissue of patients
DME expression in the normal tissue of healthy individuals
|
|||||
| Violin Diagram of DME Disease-specific Protein Abundances |
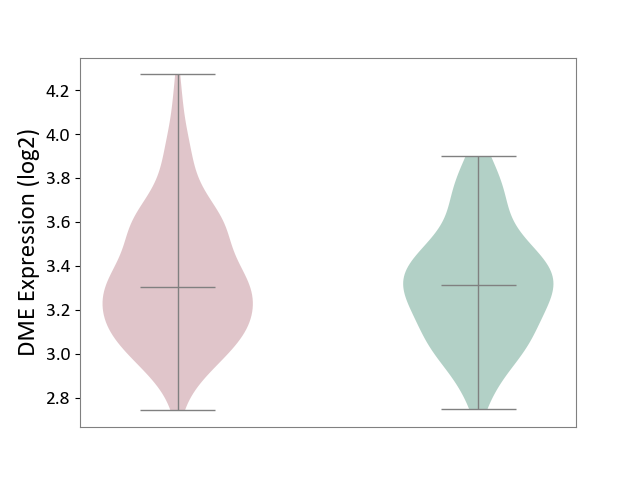
|
Click to View the Clearer Original Diagram | |||
| ICD-11: CB03 | Idiopathic interstitial pneumonitis | Click to Show/Hide | |||
| The Studied Tissue | Lung tissue | ||||
| The Specified Disease | Idiopathic pulmonary fibrosis [ICD-11:CB03.4] | ||||
| The Expression Level of Disease Section Compare with the Healthy Individual Tissue | p-value: 7.59E-01; Fold-change: 8.21E-02; Z-score: 5.64E-01 | ||||
|
DME expression in the diseased tissue of patients
DME expression in the normal tissue of healthy individuals
|
|||||
| Violin Diagram of DME Disease-specific Protein Abundances |
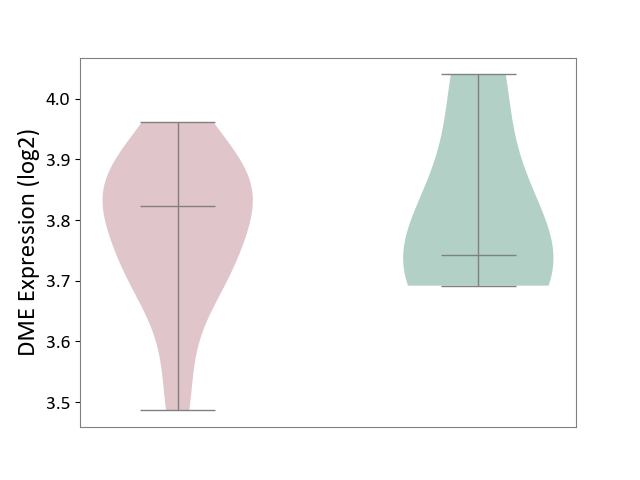
|
Click to View the Clearer Original Diagram | |||
| ICD Disease Classification 13 | Digestive system disease | Click to Show/Hide | |||
| ICD-11: DA0C | Periodontal disease | Click to Show/Hide | |||
| The Studied Tissue | Gingival tissue | ||||
| The Specified Disease | Periodontal disease [ICD-11:DA0C] | ||||
| The Expression Level of Disease Section Compare with the Adjacent Tissue | p-value: 9.45E-01; Fold-change: 4.29E-02; Z-score: 1.35E-01 | ||||
|
DME expression in the diseased tissue of patients
DME expression in the normal tissue adjacent to the diseased tissue of patients
|
|||||
| Violin Diagram of DME Disease-specific Protein Abundances |
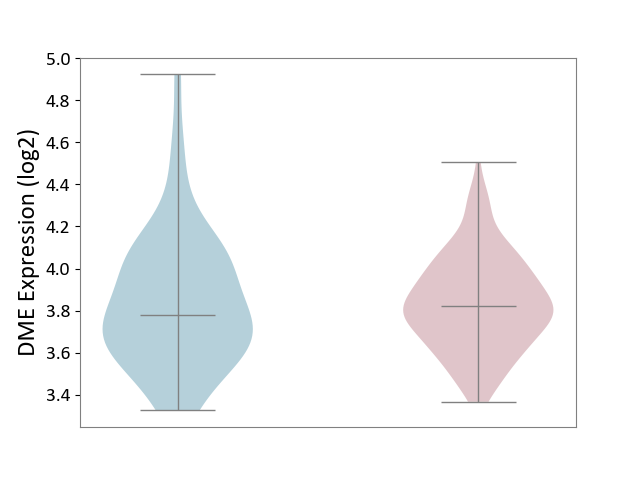
|
Click to View the Clearer Original Diagram | |||
| ICD-11: DA42 | Gastritis | Click to Show/Hide | |||
| The Studied Tissue | Gastric antrum tissue | ||||
| The Specified Disease | Eosinophilic gastritis [ICD-11:DA42.2] | ||||
| The Expression Level of Disease Section Compare with the Adjacent Tissue | p-value: 3.29E-01; Fold-change: 1.20E-01; Z-score: 4.99E-01 | ||||
|
DME expression in the diseased tissue of patients
DME expression in the normal tissue adjacent to the diseased tissue of patients
|
|||||
| Violin Diagram of DME Disease-specific Protein Abundances |
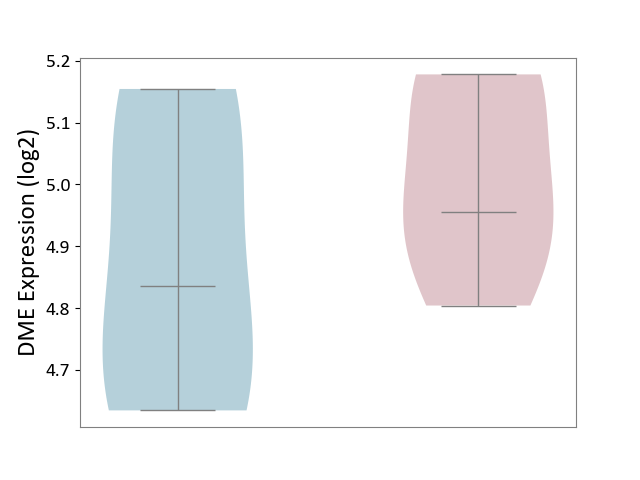
|
Click to View the Clearer Original Diagram | |||
| ICD-11: DB92 | Non-alcoholic fatty liver disease | Click to Show/Hide | |||
| The Studied Tissue | Liver tissue | ||||
| The Specified Disease | Non-alcoholic fatty liver disease [ICD-11:DB92] | ||||
| The Expression Level of Disease Section Compare with the Healthy Individual Tissue | p-value: 4.43E-01; Fold-change: -1.85E-02; Z-score: -1.25E-01 | ||||
|
DME expression in the diseased tissue of patients
DME expression in the normal tissue of healthy individuals
|
|||||
| Violin Diagram of DME Disease-specific Protein Abundances |
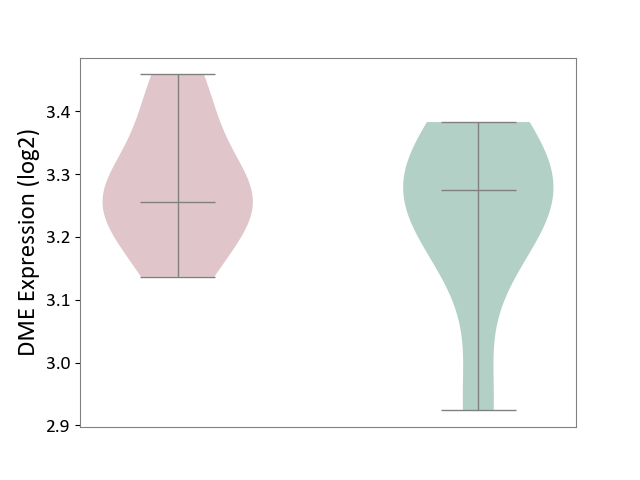
|
Click to View the Clearer Original Diagram | |||
| ICD-11: DB99 | Hepatic failure | Click to Show/Hide | |||
| The Studied Tissue | Liver tissue | ||||
| The Specified Disease | Liver failure [ICD-11:DB99.7-DB99.8] | ||||
| The Expression Level of Disease Section Compare with the Healthy Individual Tissue | p-value: 9.52E-01; Fold-change: -4.37E-02; Z-score: -2.04E-01 | ||||
|
DME expression in the diseased tissue of patients
DME expression in the normal tissue of healthy individuals
|
|||||
| Violin Diagram of DME Disease-specific Protein Abundances |
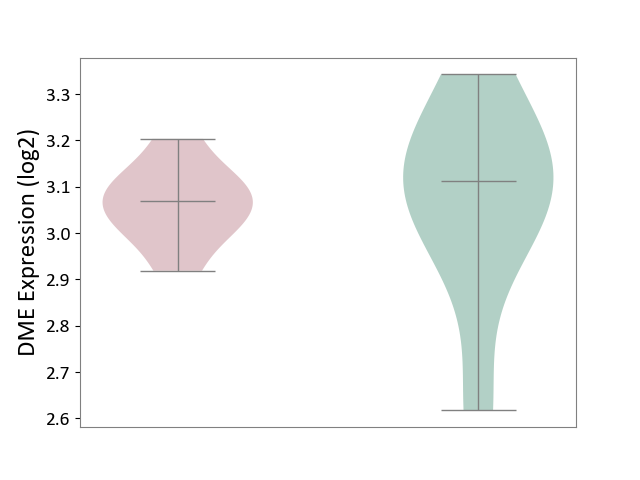
|
Click to View the Clearer Original Diagram | |||
| ICD-11: DD71 | Ulcerative colitis | Click to Show/Hide | |||
| The Studied Tissue | Colon mucosal tissue | ||||
| The Specified Disease | Ulcerative colitis [ICD-11:DD71] | ||||
| The Expression Level of Disease Section Compare with the Adjacent Tissue | p-value: 8.90E-02; Fold-change: -1.23E-01; Z-score: -5.71E-01 | ||||
|
DME expression in the diseased tissue of patients
DME expression in tissue other than the diseased tissue of patients
|
|||||
| Violin Diagram of DME Disease-specific Protein Abundances |
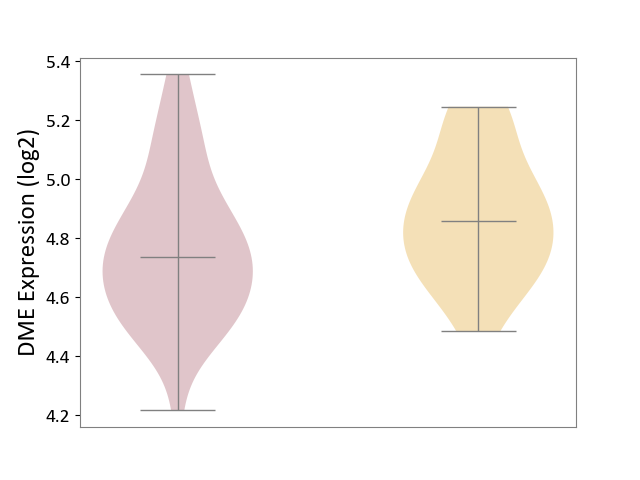
|
Click to View the Clearer Original Diagram | |||
| ICD-11: DD91 | Irritable bowel syndrome | Click to Show/Hide | |||
| The Studied Tissue | Rectal colon tissue | ||||
| The Specified Disease | Irritable bowel syndrome [ICD-11:DD91.0] | ||||
| The Expression Level of Disease Section Compare with the Healthy Individual Tissue | p-value: 4.40E-01; Fold-change: -4.85E-04; Z-score: -1.69E-03 | ||||
|
DME expression in the diseased tissue of patients
DME expression in the normal tissue of healthy individuals
|
|||||
| Violin Diagram of DME Disease-specific Protein Abundances |
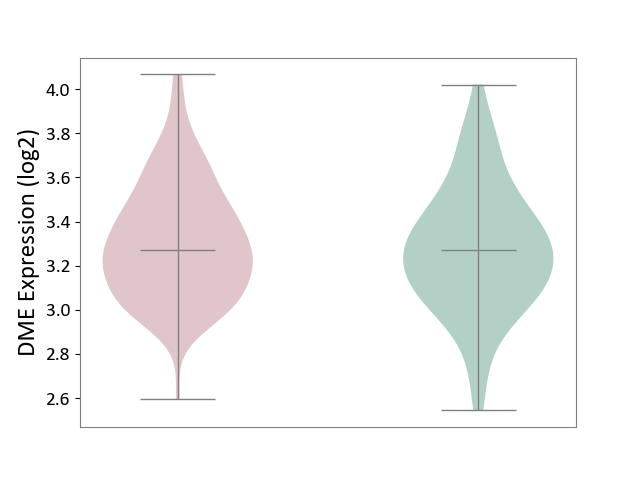
|
Click to View the Clearer Original Diagram | |||
| ICD Disease Classification 14 | Skin disease | Click to Show/Hide | |||
| ICD-11: EA80 | Atopic eczema | Click to Show/Hide | |||
| The Studied Tissue | Skin | ||||
| The Specified Disease | Atopic dermatitis [ICD-11:EA80] | ||||
| The Expression Level of Disease Section Compare with the Healthy Individual Tissue | p-value: 3.37E-04; Fold-change: -1.50E-01; Z-score: -9.69E-01 | ||||
|
DME expression in the diseased tissue of patients
DME expression in the normal tissue of healthy individuals
|
|||||
| Violin Diagram of DME Disease-specific Protein Abundances |
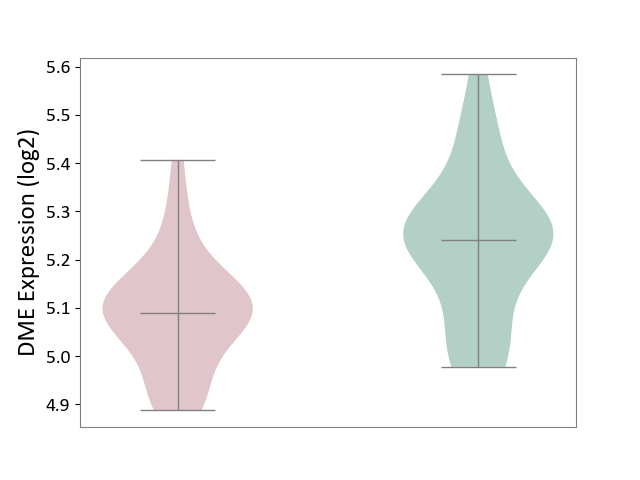
|
Click to View the Clearer Original Diagram | |||
| ICD-11: EA90 | Psoriasis | Click to Show/Hide | |||
| The Studied Tissue | Skin | ||||
| The Specified Disease | Psoriasis [ICD-11:EA90] | ||||
| The Expression Level of Disease Section Compare with the Healthy Individual Tissue | p-value: 9.29E-06; Fold-change: -4.82E-01; Z-score: -7.82E-01 | ||||
| The Expression Level of Disease Section Compare with the Adjacent Tissue | p-value: 1.42E-21; Fold-change: 3.55E-01; Z-score: 1.33E+00 | ||||
|
DME expression in the diseased tissue of patients
DME expression in the normal tissue adjacent to the diseased tissue of patients
DME expression in the normal tissue of healthy individuals
|
|||||
| Violin Diagram of DME Disease-specific Protein Abundances |
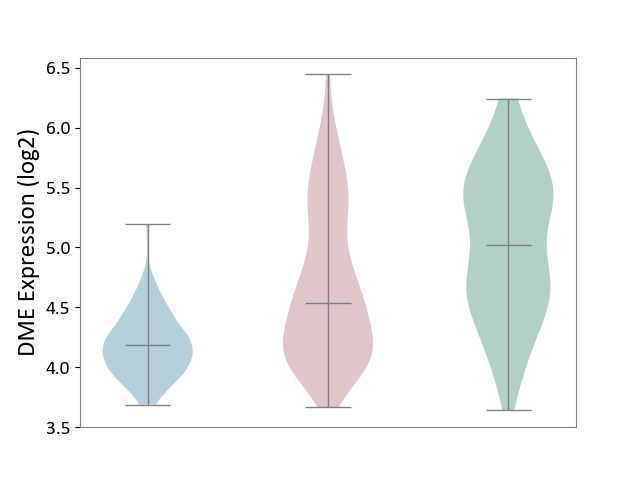
|
Click to View the Clearer Original Diagram | |||
| ICD-11: ED63 | Acquired hypomelanotic disorder | Click to Show/Hide | |||
| The Studied Tissue | Skin | ||||
| The Specified Disease | Vitiligo [ICD-11:ED63.0] | ||||
| The Expression Level of Disease Section Compare with the Healthy Individual Tissue | p-value: 3.47E-01; Fold-change: -1.58E-02; Z-score: -6.45E-02 | ||||
|
DME expression in the diseased tissue of patients
DME expression in the normal tissue of healthy individuals
|
|||||
| Violin Diagram of DME Disease-specific Protein Abundances |
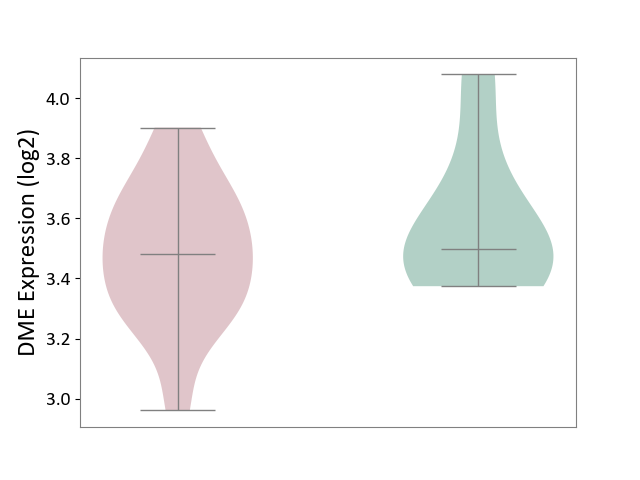
|
Click to View the Clearer Original Diagram | |||
| ICD-11: ED70 | Alopecia or hair loss | Click to Show/Hide | |||
| The Studied Tissue | Skin from scalp | ||||
| The Specified Disease | Alopecia [ICD-11:ED70] | ||||
| The Expression Level of Disease Section Compare with the Healthy Individual Tissue | p-value: 1.46E-01; Fold-change: -1.86E-02; Z-score: -8.11E-02 | ||||
|
DME expression in the diseased tissue of patients
DME expression in the normal tissue of healthy individuals
|
|||||
| Violin Diagram of DME Disease-specific Protein Abundances |
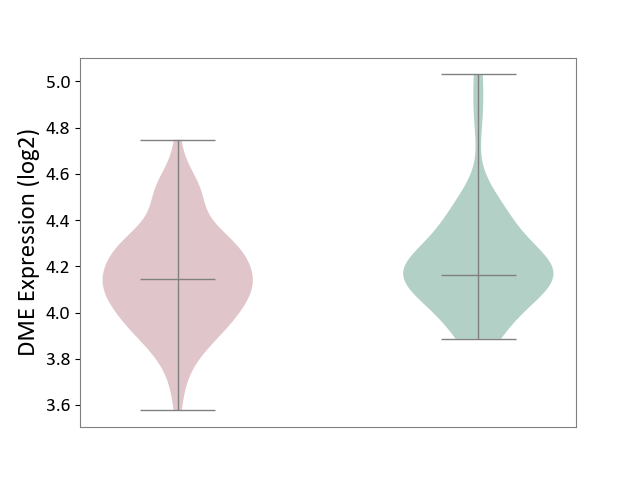
|
Click to View the Clearer Original Diagram | |||
| ICD-11: EK0Z | Contact dermatitis | Click to Show/Hide | |||
| The Studied Tissue | Skin | ||||
| The Specified Disease | Sensitive skin [ICD-11:EK0Z] | ||||
| The Expression Level of Disease Section Compare with the Healthy Individual Tissue | p-value: 5.34E-01; Fold-change: -2.43E-02; Z-score: -1.99E-01 | ||||
|
DME expression in the diseased tissue of patients
DME expression in the normal tissue of healthy individuals
|
|||||
| Violin Diagram of DME Disease-specific Protein Abundances |
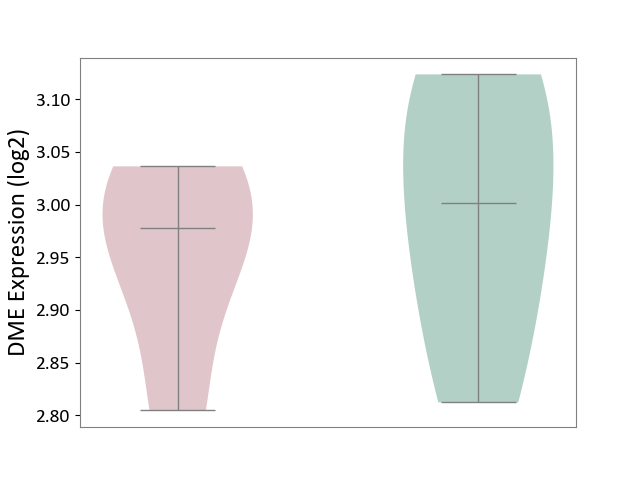
|
Click to View the Clearer Original Diagram | |||
| ICD Disease Classification 15 | Musculoskeletal system/connective tissue disease | Click to Show/Hide | |||
| ICD-11: FA00 | Osteoarthritis | Click to Show/Hide | |||
| The Studied Tissue | Peripheral blood | ||||
| The Specified Disease | Arthropathy [ICD-11:FA00-FA5Z] | ||||
| The Expression Level of Disease Section Compare with the Healthy Individual Tissue | p-value: 9.48E-01; Fold-change: -8.54E-03; Z-score: -6.13E-02 | ||||
|
DME expression in the diseased tissue of patients
DME expression in the normal tissue of healthy individuals
|
|||||
| Violin Diagram of DME Disease-specific Protein Abundances |
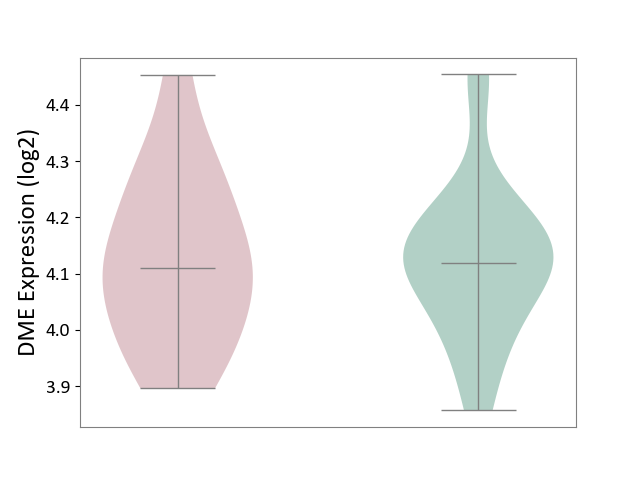
|
Click to View the Clearer Original Diagram | |||
| The Studied Tissue | Synovial tissue | ||||
| The Specified Disease | Osteoarthritis [ICD-11:FA00-FA0Z] | ||||
| The Expression Level of Disease Section Compare with the Healthy Individual Tissue | p-value: 4.11E-01; Fold-change: 5.03E-03; Z-score: 2.97E-02 | ||||
|
DME expression in the diseased tissue of patients
DME expression in the normal tissue of healthy individuals
|
|||||
| Violin Diagram of DME Disease-specific Protein Abundances |
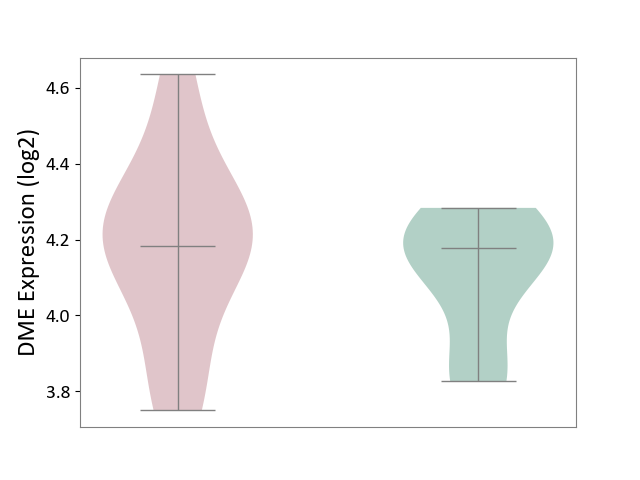
|
Click to View the Clearer Original Diagram | |||
| ICD-11: FA20 | Rheumatoid arthritis | Click to Show/Hide | |||
| The Studied Tissue | Peripheral blood | ||||
| The Specified Disease | Childhood onset rheumatic disease [ICD-11:FA20.Z] | ||||
| The Expression Level of Disease Section Compare with the Healthy Individual Tissue | p-value: 7.37E-01; Fold-change: -3.42E-02; Z-score: -1.12E-01 | ||||
|
DME expression in the diseased tissue of patients
DME expression in the normal tissue of healthy individuals
|
|||||
| Violin Diagram of DME Disease-specific Protein Abundances |
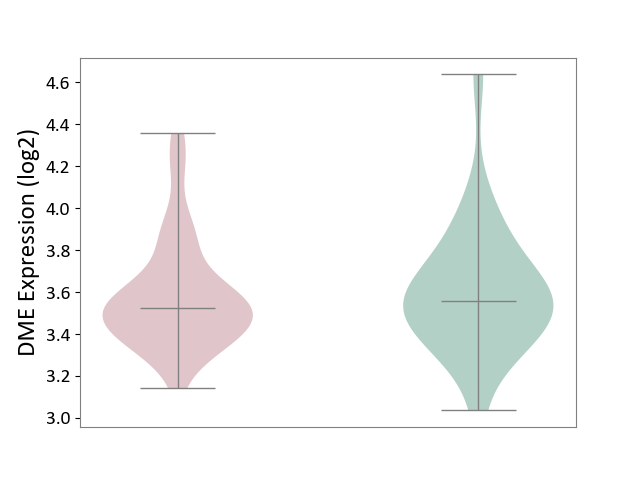
|
Click to View the Clearer Original Diagram | |||
| The Studied Tissue | Synovial tissue | ||||
| The Specified Disease | Rheumatoid arthritis [ICD-11:FA20] | ||||
| The Expression Level of Disease Section Compare with the Healthy Individual Tissue | p-value: 9.12E-01; Fold-change: 2.06E-01; Z-score: 3.41E-01 | ||||
|
DME expression in the diseased tissue of patients
DME expression in the normal tissue of healthy individuals
|
|||||
| Violin Diagram of DME Disease-specific Protein Abundances |
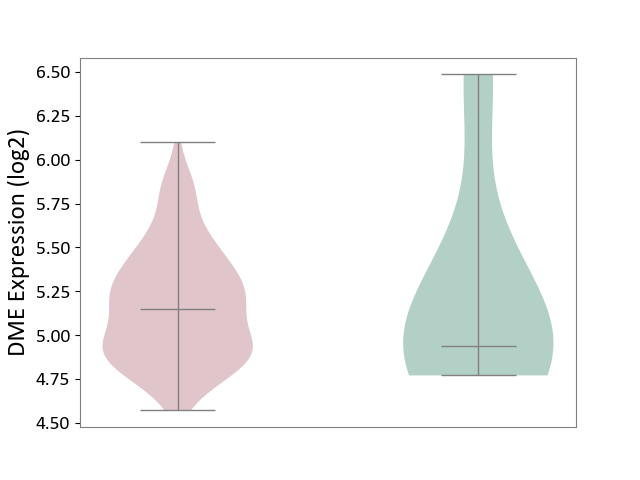
|
Click to View the Clearer Original Diagram | |||
| ICD-11: FA24 | Juvenile idiopathic arthritis | Click to Show/Hide | |||
| The Studied Tissue | Peripheral blood | ||||
| The Specified Disease | Juvenile idiopathic arthritis [ICD-11:FA24] | ||||
| The Expression Level of Disease Section Compare with the Healthy Individual Tissue | p-value: 3.30E-01; Fold-change: -2.46E-02; Z-score: -9.42E-02 | ||||
|
DME expression in the diseased tissue of patients
DME expression in the normal tissue of healthy individuals
|
|||||
| Violin Diagram of DME Disease-specific Protein Abundances |
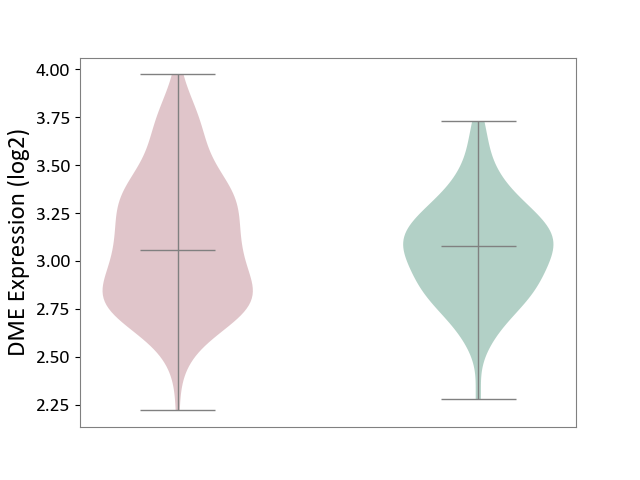
|
Click to View the Clearer Original Diagram | |||
| ICD-11: FA92 | Inflammatory spondyloarthritis | Click to Show/Hide | |||
| The Studied Tissue | Pheripheral blood | ||||
| The Specified Disease | Ankylosing spondylitis [ICD-11:FA92.0Z] | ||||
| The Expression Level of Disease Section Compare with the Healthy Individual Tissue | p-value: 1.69E-01; Fold-change: 9.30E-02; Z-score: 7.05E-01 | ||||
|
DME expression in the diseased tissue of patients
DME expression in the normal tissue of healthy individuals
|
|||||
| Violin Diagram of DME Disease-specific Protein Abundances |
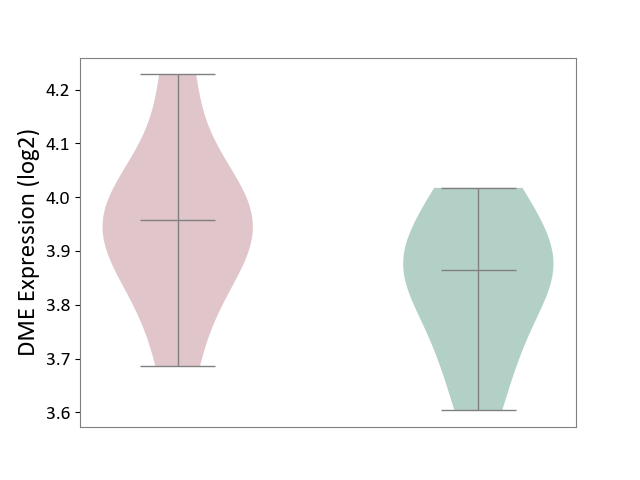
|
Click to View the Clearer Original Diagram | |||
| ICD-11: FB83 | Low bone mass disorder | Click to Show/Hide | |||
| The Studied Tissue | Bone marrow | ||||
| The Specified Disease | Osteoporosis [ICD-11:FB83.1] | ||||
| The Expression Level of Disease Section Compare with the Healthy Individual Tissue | p-value: 4.43E-01; Fold-change: 4.28E-02; Z-score: 2.46E-01 | ||||
|
DME expression in the diseased tissue of patients
DME expression in the normal tissue of healthy individuals
|
|||||
| Violin Diagram of DME Disease-specific Protein Abundances |
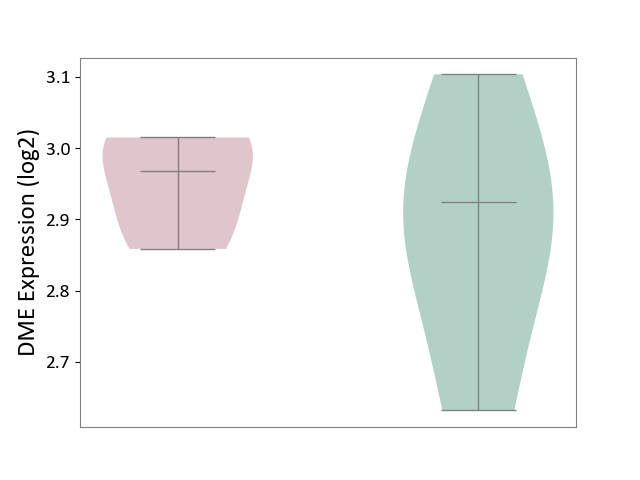
|
Click to View the Clearer Original Diagram | |||
| ICD Disease Classification 16 | Genitourinary system disease | Click to Show/Hide | |||
| ICD-11: GA10 | Endometriosis | Click to Show/Hide | |||
| The Studied Tissue | Endometrium tissue | ||||
| The Specified Disease | Endometriosis [ICD-11:GA10] | ||||
| The Expression Level of Disease Section Compare with the Healthy Individual Tissue | p-value: 1.98E-01; Fold-change: 1.01E-01; Z-score: 3.33E-01 | ||||
|
DME expression in the diseased tissue of patients
DME expression in the normal tissue of healthy individuals
|
|||||
| Violin Diagram of DME Disease-specific Protein Abundances |
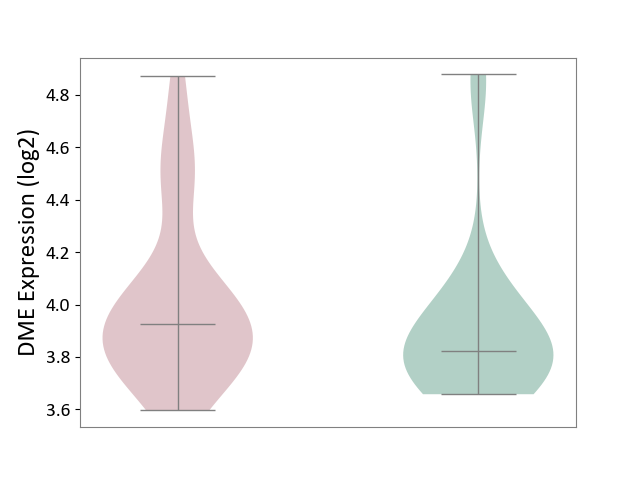
|
Click to View the Clearer Original Diagram | |||
| ICD-11: GC00 | Cystitis | Click to Show/Hide | |||
| The Studied Tissue | Bladder tissue | ||||
| The Specified Disease | Interstitial cystitis [ICD-11:GC00.3] | ||||
| The Expression Level of Disease Section Compare with the Healthy Individual Tissue | p-value: 2.00E-02; Fold-change: 1.81E-01; Z-score: 1.77E+00 | ||||
|
DME expression in the diseased tissue of patients
DME expression in the normal tissue of healthy individuals
|
|||||
| Violin Diagram of DME Disease-specific Protein Abundances |
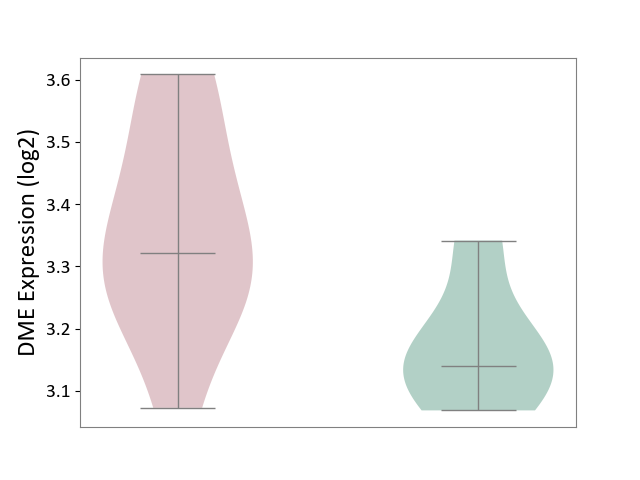
|
Click to View the Clearer Original Diagram | |||
| ICD Disease Classification 19 | Condition originating in perinatal period | Click to Show/Hide | |||
| ICD-11: KA21 | Short gestation disorder | Click to Show/Hide | |||
| The Studied Tissue | Myometrium | ||||
| The Specified Disease | Preterm birth [ICD-11:KA21.4Z] | ||||
| The Expression Level of Disease Section Compare with the Healthy Individual Tissue | p-value: 2.91E-01; Fold-change: 7.62E-02; Z-score: 6.08E-01 | ||||
|
DME expression in the diseased tissue of patients
DME expression in the normal tissue of healthy individuals
|
|||||
| Violin Diagram of DME Disease-specific Protein Abundances |
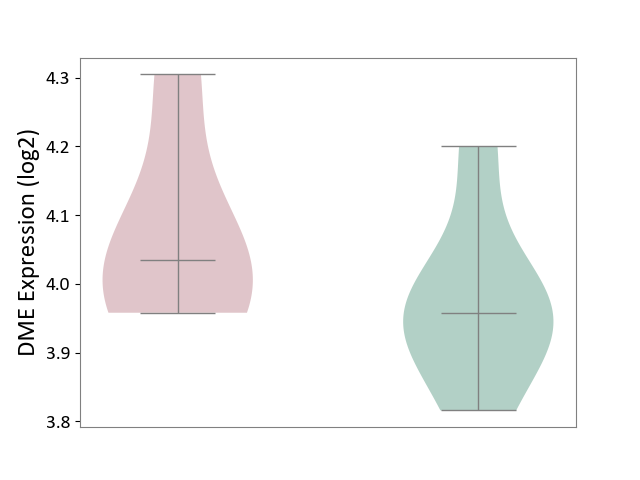
|
Click to View the Clearer Original Diagram | |||
| ICD Disease Classification 20 | Developmental anomaly | Click to Show/Hide | |||
| ICD-11: LD2C | Overgrowth syndrome | Click to Show/Hide | |||
| The Studied Tissue | Adipose tissue | ||||
| The Specified Disease | Simpson golabi behmel syndrome [ICD-11:LD2C] | ||||
| The Expression Level of Disease Section Compare with the Healthy Individual Tissue | p-value: 3.03E-02; Fold-change: 1.31E-01; Z-score: 1.81E+00 | ||||
|
DME expression in the diseased tissue of patients
DME expression in the normal tissue of healthy individuals
|
|||||
| Violin Diagram of DME Disease-specific Protein Abundances |
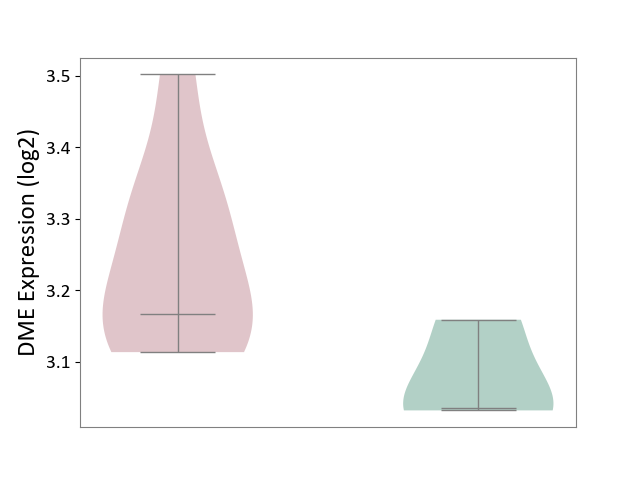
|
Click to View the Clearer Original Diagram | |||
| ICD-11: LD2D | Phakomatoses/hamartoneoplastic syndrome | Click to Show/Hide | |||
| The Studied Tissue | Perituberal tissue | ||||
| The Specified Disease | Tuberous sclerosis complex [ICD-11:LD2D.2] | ||||
| The Expression Level of Disease Section Compare with the Healthy Individual Tissue | p-value: 9.43E-01; Fold-change: 1.22E-01; Z-score: 3.50E-01 | ||||
|
DME expression in the diseased tissue of patients
DME expression in the normal tissue of healthy individuals
|
|||||
| Violin Diagram of DME Disease-specific Protein Abundances |
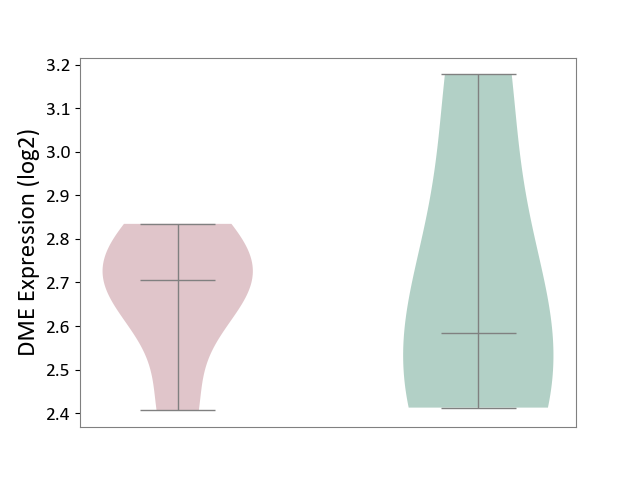
|
Click to View the Clearer Original Diagram | |||
| References | |||||
|---|---|---|---|---|---|
| 1 | Drug-drug interaction potential of darolutamide: in vitro and clinical studies. Eur J Drug Metab Pharmacokinet. 2019 Dec;44(6):747-759. | ||||
| 2 | Functional significance of UDP-glucuronosyltransferase variants in the metabolism of active tamoxifen metabolites. Cancer Res. 2009 Mar 1;69(5):1892-900. | ||||
| 3 | Clinical pharmacokinetics and pharmacodynamics of nintedanib. Clin Pharmacokinet. 2019 Sep;58(9):1131-1147. | ||||
| 4 | Assessing cytochrome P450 and UDP-glucuronosyltransferase contributions to warfarin metabolism in humans. Chem Res Toxicol. 2009 Jul;22(7):1239-45. | ||||
| 5 | Functional characterization of human and cynomolgus monkey UDP-glucuronosyltransferase 1A1 enzymes. Life Sci. 2010 Aug 14;87(7-8):261-8. | ||||
| 6 | Metabolomics of Methylphenidate and Ethylphenidate: Implications in Pharmacological and Toxicological Effects | ||||
| 7 | Liquid chromatography-tandem mass spectrometry method for measurement of nicotine N-glucuronide: a marker for human UGT2B10 inhibition. J Pharm Biomed Anal. 2011 Jul 15;55(5):964-71. | ||||
| 8 | In vitro inhibition of UDP glucuronosyltransferases by atazanavir and other HIV protease inhibitors and the relationship of this property to in vivo bilirubin glucuronidation. Drug Metab Dispos. 2005 Nov;33(11):1729-39. | ||||
| 9 | Substrates, inducers, inhibitors and structure-activity relationships of human Cytochrome P450 2C9 and implications in drug development. Curr Med Chem. 2009;16(27):3480-675. | ||||
| 10 | Extrahepatic metabolism of ibrutinib | ||||
| 11 | Metabolic interaction between morphine and naloxone in human liver. A common pathway of glucuronidation? Drug Metab Dispos. 1989 Mar-Apr;17(2):218-20. | ||||
| 12 | Drug-drug interactions for UDP-glucuronosyltransferase substrates: a pharmacokinetic explanation for typically observed low exposure (AUCi/AUC) ratios. Drug Metab Dispos. 2004 Nov;32(11):1201-8. | ||||
| 13 | Glucuronidation of capsaicin by liver microsomes and expressed UGT enzymes: reaction kinetics, contribution of individual enzymes and marked species differences Expert Opin Drug Metab Toxicol. 2014 Oct;10(10):1325-36. doi: 10.1517/17425255.2014.954548. | ||||
| 14 | Role of human UGT2B10 in N-glucuronidation of tricyclic antidepressants, amitriptyline, imipramine, clomipramine, and trimipramine. Drug Metab Dispos. 2010 May;38(5):863-70. | ||||
| 15 | Characterization of rat intestinal microsomal UDP-glucuronosyltransferase activity toward mycophenolic acid. Drug Metab Dispos. 2006 Sep;34(9):1632-9. | ||||
| 16 | Effect of aging on glucuronidation of valproic acid in human liver microsomes and the role of UDP-glucuronosyltransferase UGT1A4, UGT1A8, and UGT1A10. Drug Metab Dispos. 2009 Jan;37(1):229-36. | ||||
| 17 | Effect of common exon variant (p.P364L) on drug glucuronidation by the human UDP-glucuronosyltransferase 1 family. Basic Clin Pharmacol Toxicol. 2011 Dec;109(6):486-93. | ||||
| 18 | In vitro drug-drug interaction studies with febuxostat, a novel non-purine selective inhibitor of xanthine oxidase: plasma protein binding, identification of metabolic enzymes and cytochrome P450 inhibition. Xenobiotica. 2008 May;38(5):496-510. | ||||
| 19 | Regulation of UDP-glucuronosyltransferase (UGT) 1A1 by progesterone and its impact on labetalol elimination. Xenobiotica. 2008 Jan;38(1):62-75. | ||||
| 20 | Metabolism and disposition of opicapone in the rat and metabolic enzymes phenotyping | ||||
| 21 | Human UDP-glucuronosyltransferase (UGT)1A3 enzyme conjugates chenodeoxycholic acid in the liver. Hepatology. 2006 Nov;44(5):1158-70. | ||||
| 22 | Pharmacokinetic drug interactions of morphine, codeine, and their derivatives: theory and clinical reality, Part II. Psychosomatics. 2003 Nov-Dec;44(6):515-20. | ||||
| 23 | Inhibition of bilirubin metabolism induces moderate hyperbilirubinemia and attenuates ANG II-dependent hypertension in mice. Am J Physiol Regul Integr Comp Physiol. 2009 Sep;297(3):R738-43. | ||||
| 24 | Clinical pharmacology of axitinib. Clin Pharmacokinet. 2013 Sep;52(9):713-25. | ||||
| 25 | Use of a human liver microsome bank in drug glucuronidation studies. Toxicol In Vitro. 1991;5(5-6):559-62. | ||||
| 26 | Stimulation of microsomal uridine diphosphate glucuronyltransferase by glucuronic acid derivatives. Biochem J. 1974 Apr;139(1):243-9. | ||||
| 27 | FDA Approved Drug Products: Perforomist? inhalation solution | ||||
| 28 | Association between the UGT1A1*28 allele and hyperbilirubinemia in HIV-positive patients receiving atazanavir: a meta-analysis. Biosci Rep. 2019 May 2;39(5). pii: BSR20182105. | ||||
| 29 | DrugBank(Pharmacology-Metabolism):Lasofoxifene | ||||
| 30 | Human udp-glucuronosyltransferases: isoform selectivity and kinetics of 4-methylumbelliferone and 1-naphthol glucuronidation, effects of organic solvents, and inhibition by diclofenac and probenecid. Drug Metab Dispos. 2004 Apr;32(4):413-23. | ||||
| 31 | Influence of mutations associated with Gilbert and Crigler-Najjar type II syndromes on the glucuronidation kinetics of bilirubin and other UDP-glucuronosyltransferase 1A substrates. Pharmacogenet Genomics. 2007 Dec;17(12):1017-29. | ||||
| 32 | Repaglinide-gemfibrozil drug interaction: inhibition of repaglinide glucuronidation as a potential additional contributing mechanism. Br J Clin Pharmacol. 2010 Dec;70(6):870-80. | ||||
| 33 | Effects of UGT1A1 genotype on the pharmacokinetics, pharmacodynamics, and toxicities of belinostat administered by 48-hour continuous infusion in patients with cancer. J Clin Pharmacol. 2016 Apr;56(4):461-73. | ||||
| 34 | Evaluation of 3'-azido-3'-deoxythymidine, morphine, and codeine as probe substrates for UDP-glucuronosyltransferase 2B7 (UGT2B7) in human liver microsomes: specificity and influence of the UGT2B7*2 polymorphism. Drug Metab Dispos. 2003 Sep;31(9):1125-33. | ||||
| 35 | Deferasirox pharmacogenetic influence on pharmacokinetic, efficacy and toxicity in a cohort of pediatric patients. Pharmacogenomics. 2017 Apr;18(6):539-554. | ||||
| 36 | Impact of polymorphisms in CYP and UGT enzymes and ABC and SLCO1B1 transporters on the pharmacokinetics and safety of desvenlafaxine | ||||
| 37 | Mechanisms of action, pharmacology and interactions of dolutegravir. Enferm Infecc Microbiol Clin. 2015 Mar;33 Suppl 1:2-8. | ||||
| 38 | Metabolism, excretion, and mass balance of the HIV-1 integrase inhibitor dolutegravir in humans | ||||
| 39 | DrugBank(Pharmacology-Metabolism):Dronedarone hydrochloride | ||||
| 40 | Hepatic UDP-glucuronosyltransferase is responsible for eslicarbazepine glucuronidation. Drug Metab Dispos. 2011 Sep;39(9):1486-94. | ||||
| 41 | DrugBank(Pharmacology-Metabolism):Eslicarbazepine acetate | ||||
| 42 | Stereoselective glucuronidation and hydroxylation of etodolac by UGT1A9 and CYP2C9 in man. Xenobiotica. 2004 May;34(5):449-61. | ||||
| 43 | LABEL:Exjade | ||||
| 44 | Pharmacogenomics knowledge for personalized medicine Clin Pharmacol Ther. 2012 Oct;92(4):414-7. doi: 10.1038/clpt.2012.96. | ||||
| 45 | Contribution of UDP-glucuronosyltransferases 1A9 and 2B7 to the glucuronidation of indomethacin in the human liver. Eur J Clin Pharmacol. 2007 Mar;63(3):289-96. | ||||
| 46 | Pharmacogenetic analysis of OATP1B1, UGT1A1, and BCRP variants in relation to the pharmacokinetics of letermovir in previously conducted clinical studies. J Clin Pharmacol. 2019 Sep;59(9):1236-1243. | ||||
| 47 | Pharmacogenomics in drug-metabolizing enzymes catalyzing anticancer drugs for personalized cancer chemotherapy. Curr Drug Metab. 2007 Aug;8(6):554-62. | ||||
| 48 | Contribution of UDP-glucuronosyltransferase 1A1 and 1A8 to morphine-6-glucuronidation and its kinetic properties. Drug Metab Dispos. 2008 Apr;36(4):688-94. | ||||
| 49 | Metabolism and pharmacokinetics of morphine in neonates: A review | ||||
| 50 | Morphine metabolism, transport and brain disposition | ||||
| 51 | Identification and characterization of oxymetazoline glucuronidation in human liver microsomes: evidence for the involvement of UGT1A9. J Pharm Sci. 2011 Feb;100(2):784-93. | ||||
| 52 | Modulation of 3'-azido-3'-deoxythymidine catabolism by probenecid and acetaminophen in freshly isolated rat hepatocytes. Biochem Pharmacol. 1991 Sep 12;42(7):1475-80. | ||||
| 53 | Human biotransformation of the nonnucleoside reverse transcriptase inhibitor rilpivirine and a cross-species metabolism comparison. Antimicrob Agents Chemother. 2013 Oct;57(10):5067-79. | ||||
| 54 | Involvement of human CYP1A isoenzymes in the metabolism and drug interactions of riluzole in vitro. J Pharmacol Exp Ther. 1997 Sep;282(3):1465-72. | ||||
| 55 | Evaluation of absorption, distribution, metabolism, and excretion of [(14)C]-rucaparib, a poly(ADP-ribose) polymerase inhibitor, in patients with advanced solid tumors Invest New Drugs. 2020 Jun;38(3):765-775. doi: 10.1007/s10637-019-00815-2. | ||||
| 56 | Pharmacogenomics of statins: understanding susceptibility to adverse effects. Pharmgenomics Pers Med. 2016 Oct 3;9:97-106. | ||||
| 57 | Product characteristics of Triumeq. | ||||
| 58 | In vitro and in vivo oxidative metabolism and glucuronidation of anastrozole. Br J Clin Pharmacol. 2010 Dec;70(6):854-69. | ||||
| 59 | Pharmacogenomics in aspirin intolerance. Curr Drug Metab. 2009 Nov;10(9):998-1008. | ||||
| 60 | Atorvastatin glucuronidation is minimally and nonselectively inhibited by the fibrates gemfibrozil, fenofibrate, and fenofibric acid. Drug Metab Dispos. 2007 Aug;35(8):1315-24. | ||||
| 61 | Contribution of the different UDP-glucuronosyltransferase (UGT) isoforms to buprenorphine and norbuprenorphine metabolism and relationship with the main UGT polymorphisms in a bank of human liver microsomes. Drug Metab Dispos. 2010 Jan;38(1):40-5. | ||||
| 62 | Characterization of Clofazimine Metabolism in Human Liver Microsomal Incubation In Vitro | ||||
| 63 | Steroid glucuronides: human circulatory levels and formation by LNCaP cells. J Steroid Biochem Mol Biol. 1991;40(4-6):593-8. | ||||
| 64 | The UDP-glucuronosyltransferase 2B7 isozyme is responsible for gemfibrozil glucuronidation in the human liver. Drug Metab Dispos. 2007 Nov;35(11):2040-4. | ||||
| 65 | Characterization of Enzymes Involved in Nintedanib Metabolism in Humans | ||||
| 66 | FDA Label of Liothyronine sodium. The 2020 official website of the U.S. Food and Drug Administration. | ||||
| 67 | Substrate-dependent modulation of UDP-glucuronosyltransferase 1A1 (UGT1A1) by propofol in recombinant human UGT1A1 and human liver microsomes. Basic Clin Pharmacol Toxicol. 2007 Sep;101(3):211-4. | ||||
| 68 | FDA label of Tecovirimat. The 2020 official website of the U.S. Food and Drug Administration. | ||||
| 69 | Effect of UDP-glucuronosyltransferase (UGT) 1A polymorphism (rs8330 and rs10929303) on glucuronidation status of acetaminophen. Dose Response. 2017 Sep 11;15(3):1559325817723731. | ||||
| 70 | Binimetinib - European Medicines Agency - European Union | ||||
| 71 | The human UDP-glucuronosyltransferase UGT1A3 is highly selective towards N2 in the tetrazole ring of losartan, candesartan, and zolarsartan. Biochem Pharmacol. 2008 Sep 15;76(6):763-72. | ||||
| 72 | A long-standing mystery solved: the formation of 3-hydroxydesloratadine is catalyzed by CYP2C8 but prior glucuronidation of desloratadine by UDP-glucuronosyltransferase 2B10 is an obligatory requirement Drug Metab Dispos. 2015 Apr;43(4):523-33. doi: 10.1124/dmd.114.062620. | ||||
| 73 | UDP-glucuronosyltransferase 1A1 is the principal enzyme responsible for etoposide glucuronidation in human liver and intestinal microsomes: structural characterization of phenolic and alcoholic glucuronides of etoposide and estimation of enzyme kinetics. Drug Metab Dispos. 2007 Mar;35(3):371-80. | ||||
| 74 | Ezetimibe: a review of its metabolism, pharmacokinetics and drug interactions. Clin Pharmacokinet. 2005;44(5):467-94. | ||||
| 75 | The main role of UGT1A9 in the hepatic metabolism of mycophenolic acid and the effects of naturally occurring variants | ||||
| 76 | Identification of the UDP-glucuronosyltransferase isoforms involved in mycophenolic acid phase II metabolism. Drug Metab Dispos. 2005 Jan;33(1):139-46. | ||||
| 77 | Metabolic fate of pitavastatin, a new inhibitor of HMG-CoA reductase: human UDP-glucuronosyltransferase enzymes involved in lactonization. Xenobiotica. 2003 Jan;33(1):27-41. | ||||
| 78 | Clinical Pharmacokinetic and Pharmacodynamic Profile of Riociguat | ||||
| 79 | FDA label of Selinexor. The 2020 official website of the U.S. Food and Drug Administration. | ||||
| 80 | Troglitazone glucuronidation in human liver and intestine microsomes: high catalytic activity of UGT1A8 and UGT1A10. Drug Metab Dispos. 2002 Dec;30(12):1462-9. | ||||
| 81 | Interindividual variability in pharmacokinetics of generic nucleoside reverse transcriptase inhibitors in TB/HIV-coinfected Ghanaian patients: UGT2B7*1c is associated with faster zidovudine clearance and glucuronidation. J Clin Pharmacol. 2009 Sep;49(9):1079-90. | ||||
| 82 | Cerivastatin, genetic variants, and the risk of rhabdomyolysis. Pharmacogenet Genomics. 2011 May;21(5):280-8. | ||||
| 83 | Differential effects of phenobarbital on ester and ether glucuronidation of diflunisal in rats. J Pharmacol Exp Ther. 1987 Sep;242(3):1013-8. | ||||
| 84 | A novel administration route for edaravone: I. Effects of metabolic inhibitors on skin permeability of edaravone. Int J Pharm. 2009 May 8;372(1-2):33-8. | ||||
| 85 | Eltrombopag-induced acute liver failure in a pediatric patient: a pharmacokinetic and pharmacogenetic analysis. Ther Drug Monit. 2018 Aug;40(4):386-388. | ||||
| 86 | Elvitegravir for the treatment of HIV infection. Drugs Today (Barc). 2014 Mar;50(3):209-17. | ||||
| 87 | Predominant contribution of UDP-glucuronosyltransferase 2B7 in the glucuronidation of racemic flurbiprofen in the human liver. Drug Metab Dispos. 2007 Jul;35(7):1182-7. | ||||
| 88 | Involvement of phase II enzymes and efflux transporters in the metabolism and absorption of naringin, hesperidin and their aglycones in rats | ||||
| 89 | Is maternal opioid use hazardous to breast-fed infants? Clin Toxicol (Phila). 2012 Jan;50(1):1-14. | ||||
| 90 | Advances in high-resolution MS and hepatocyte models solve a long-standing metabolism challenge: the loratadine story. Bioanalysis. 2016 Aug;8(16):1645-62. | ||||
| 91 | Evidence for oxazepam as an in vivo probe of UGT2B15: oxazepam clearance is reduced by UGT2B15 D85Y polymorphism but unaffected by UGT2B17 deletion. Br J Clin Pharmacol. 2009 Nov;68(5):721-30. | ||||
| 92 | FDA LABEL:elexipag | ||||
| 93 | Actual and Predicted Pharmacokinetic Interactions Between Anticonvulsants and Antiretrovirals. | ||||
| 94 | Vericiguat: A New Hope for Heart Failure Patients | ||||
| 95 | A pharmacogenetic study of vorinostat glucuronidation. Pharmacogenet Genomics. 2010 Oct;20(10):638-41. | ||||
| 96 | FDA Approved Drug Products:Oxbryta (voxelotor) tablets | ||||
| 97 | Delafloxacin: place in therapy and review of microbiologic, clinical and pharmacologic properties. Infect Dis Ther. 2018 Jun;7(2):197-217. | ||||
| 98 | FDA:Enasidenib | ||||
| 99 | Inactivation of the pure antiestrogen fulvestrant and other synthetic estrogen molecules by UDP-glucuronosyltransferase 1A enzymes expressed in breast tissue. Mol Pharmacol. 2006 Mar;69(3):908-20. | ||||
| 100 | The glucuronidation of Delta4-3-Keto C19- and C21-hydroxysteroids by human liver microsomal and recombinant UDP-glucuronosyltransferases (UGTs): 6alpha- and 21-hydroxyprogesterone are selective substrates for UGT2B7. Drug Metab Dispos. 2007 Mar;35(3):363-70. | ||||
| 101 | Use of indacaterol for the treatment of COPD: a pharmacokinetic evaluation. Expert Opin Drug Metab Toxicol. 2014 Jan;10(1):129-37. | ||||
| 102 | DrugBank(Pharmacology-Metabolism):Lenacapavir | ||||
| 103 | In vivo chronic exposure to heroin or naltrexone selectively inhibits liver microsome formation of estradiol-3-glucuronide in the rat. Biochem Pharmacol. 2008 Sep 1;76(5):672-9. | ||||
| 104 | Identification of human UDP-glucuronosyltransferase enzyme(s) responsible for the glucuronidation of posaconazole (Noxafil). Drug Metab Dispos. 2004 Feb;32(2):267-71. | ||||
| 105 | Successful tacrolimus treatment following renal transplant in a HIV-infected patient with raltegravir previously treated with a protease inhibitor based regimen. Drug Metabol Drug Interact. 2011;26(3):139-41. | ||||
| 106 | New Insights into SN-38 Glucuronidation: Evidence for the Important Role of UDP Glucuronosyltransferase 1A9 | ||||
| 107 | The impact of pharmacogenetics of metabolic enzymes and transporters on the pharmacokinetics of telmisartan in healthy volunteers. Pharmacogenet Genomics. 2011 Sep;21(9):523-30. | ||||
| 108 | Solid-phase synthesis of drug glucuronides by immobilized glucuronosyltransferase. J Med Chem. 1976 May;19(5):679-83. | ||||
| 109 | Genetic variation in the first-pass metabolism of ethinylestradiol, sex hormone binding globulin levels and venous thrombosis risk Eur J Intern Med. 2017 Jul;42:54-60. doi: 10.1016/j.ejim.2017.05.019. | ||||
| 110 | Metabolism of 17 alpha-ethinylestradiol by human liver microsomes in vitro: aromatic hydroxylation and irreversible protein binding of metabolites J Clin Endocrinol Metab. 1974 Dec;39(6):1072-80. doi: 10.1210/jcem-39-6-1072. | ||||
| 111 | Metabolism of MK-0524, a prostaglandin D2 receptor 1 antagonist, in microsomes and hepatocytes from preclinical species and humans | ||||
| 112 | Glucuronidation of 2-arylpropionic acids pirprofen, flurbiprofen, and ibuprofen by liver microsomes. Drug Metab Dispos. 1990 Sep-Oct;18(5):692-7. | ||||
| 113 | Glucuronidation of antiallergic drug, Tranilast: identification of human UDP-glucuronosyltransferase isoforms and effect of its phase I metabolite. Drug Metab Dispos. 2007 Apr;35(4):583-9. | ||||
| 114 | Simultaneous determination of tranilast and metabolites in plasma and urine using high-performance liquid chromatography | ||||
| 115 | UDP-glucuronosyltransferase 2B15 (UGT2B15) and UGT2B17 enzymes are major determinants of the androgen response in prostate cancer LNCaP cells. J Biol Chem. 2007 Nov 16;282(46):33466-74. | ||||
| 116 | Inhibition of UDP-glucuronyltransferase activity in rat liver microsomes by pyrimidine derivatives. Comp Biochem Physiol C Pharmacol Toxicol Endocrinol. 1995 Nov;112(3):321-5. | ||||
| 117 | N-Glucuronidation of the antiepileptic drug retigabine: results from studies with human volunteers, heterologously expressed human UGTs, human liver, kidney, and liver microsomal membranes of Crigler-Najjar type II. Metabolism. 2006 Jun;55(6):711-21. | ||||
| 118 | Role of UDP-glucuronosyltransferase 1A1 in the metabolism and pharmacokinetics of silymarin flavonolignans in patients with HCV and NAFLD. Molecules. 2017 Jan 15;22(1). pii: E142. | ||||
| 119 | UGT1A1*28 polymorphism influences glucuronidation of bazedoxifene. Pharmazie. 2015 Feb;70(2):94-6. | ||||
| 120 | Inversion of the anomeric configuration of the transferred sugar during inactivation of the macrolide antibiotic oleandomycin catalyzed by a macrolide glycosyltransferase. FEBS Lett. 2000 Jul 7;476(3):186-9. | ||||
| 121 | Physiologically Based Pharmacokinetic Modeling for Selumetinib to Evaluate Drug-Drug Interactions and Pediatric Dose Regimens | ||||
| 122 | DrugBank(Pharmacology-Metabolism):AKB-6548 | ||||
| 123 | Characterization of the UDP glucuronosyltransferase activity of human liver microsomes genotyped for the UGT1A1*28 polymorphism. Drug Metab Dispos. 2007 Dec;35(12):2270-80. | ||||
| 124 | Differential and special properties of the major human UGT1-encoded gastrointestinal UDP-glucuronosyltransferases enhance potential to control chemical uptake. J Biol Chem. 2004 Jan 9;279(2):1429-41. | ||||
| 125 | Characterization of the metabolism of fenretinide by human liver microsomes, cytochrome P450 enzymes and UDP-glucuronosyltransferases. Br J Pharmacol. 2011 Feb;162(4):989-99. | ||||
| 126 | Metabolism and disposition of the SGLT2 inhibitor bexagliflozin in rats, monkeys and humans | ||||
| 127 | Fusidic acid inhibits hepatic transporters and metabolic enzymes: potential cause of clinical drug-drug interaction observed with statin coadministration. Antimicrob Agents Chemother. 2016 Sep 23;60(10):5986-94. | ||||
| 128 | PharmGKB:Heroin | ||||
| 129 | Blonanserin: a review of its use in the management of schizophrenia | ||||
| 130 | Carisbamate addon therapy for drugresistant partial epilepsy. The Cochrane Library. John Wiley Sons, Ltd, 2016. | ||||
| 131 | Absorption, Distribution, Metabolism, and Excretion of [(14)C]iptacopan in Healthy Male Volunteers and in In Vivo and In Vitro Studies | ||||
| 132 | Etirinotecan pegol in women with recurrent platinum-resistant or refractory ovarian cancer | ||||
| 133 | Pradigastat disposition in humans: in vivo and in vitro investigations. Xenobiotica. 2017 Dec;47(12):1077-1089. | ||||
| 134 | Carboxyl-glucuronidation of mitiglinide by human UDP-glucuronosyltransferases. Biochem Pharmacol. 2007 Jun 1;73(11):1842-51. | ||||
| 135 | DrugBank(Pharmacology-Metabolism):Ag-221 | ||||
| 136 | UGT1A1*28 is associated with decreased systemic exposure of atorvastatin lactone. Mol Diagn Ther. 2013 Aug;17(4):233-7. | ||||
| 137 | Identification of aspartic acid and histidine residues mediating the reaction mechanism and the substrate specificity of the human UDP-glucuronosyltransferases 1A. J Biol Chem. 2007 Dec 14;282(50):36514-24. | ||||
| 138 | UDP-glucuronosyltransferase 1A1 is the principal enzyme responsible for puerarin metabolism in human liver microsomes | ||||
| 139 | Involvement of UDP-glucuronosyltransferases in the extensive liver and intestinal first-pass metabolism of flavonoid baicalein | ||||
| 140 | Identification and preliminary characterization of UDP-glucuronosyltransferases catalyzing formation of ethyl glucuronide. Anal Bioanal Chem. 2014 Apr;406(9-10):2325-32. | ||||
| 141 | Evaluation of the Absorption, Metabolism, and Excretion of a Single Oral 1-mg Dose of Tropifexor in Healthy Male Subjects and the Concentration Dependence of Tropifexor Metabolism | ||||
| 142 | Metabolic Profiling of the Novel Hypoxia-Inducible Factor 2 Inhibitor PT2385 In Vivo and In Vitro | ||||
| 143 | Paracetamol glucuronidation by recombinant rat and human phenol UDP-glucuronosyltransferases. Biochem Pharmacol. 1993 May 5;45(9):1809-14. | ||||
| 144 | Disposition and metabolism of cabotegravir: a comparison of biotransformation and excretion between different species and routes of administration in humans. Xenobiotica. 2016;46(2):147-62. | ||||
| 145 | Pharmacokinetics and metabolism of AMG 232, a novel orally bioavailable inhibitor of the MDM2-p53 interaction, in rats, dogs and monkeys: in vitro-in vivo correlation | ||||
| 146 | Human metabolism of nebicapone (BIA 3-202), a novel catechol-o-methyltransferase inhibitor: characterization of in vitro glucuronidation | ||||
| 147 | S-equol glucuronidation in liver and intestinal microsomes of humans, monkeys, dogs, rats, and mice | ||||
| 148 | Preclinical discovery of candidate genes to guide pharmacogenetics during phase I development: the example of the novel anticancer agent ABT-751. Pharmacogenet Genomics. 2013 Jul;23(7):374-81. | ||||
| 149 | Metabolic pathways of the camptothecin analog AR-67 | ||||
| 150 | Induction and inhibition of cicletanine metabolism in cultured hepatocytes and liver microsomes from rats. Fundam Clin Pharmacol. 2000 Sep-Oct;14(5):509-18. | ||||
| 151 | A first-in-Asian phase 1 study to evaluate safety, pharmacokinetics and clinical activity of VS-6063, a focal adhesion kinase (FAK) inhibitor in Japanese patients with advanced solid tumors | ||||
| 152 | Drug-drug interaction of atazanavir on UGT1A1-mediated glucuronidation of molidustat in human | ||||
| 153 | Acyl glucuronidation of fluoroquinolone antibiotics by the UDP-glucuronosyltransferase 1A subfamily in human liver microsomes | ||||
| 154 | Effects of green tea compounds on irinotecan metabolism. Drug Metab Dispos. 2007 Feb;35(2):228-33. | ||||
| 155 | Glucuronidation of active tamoxifen metabolites by the human UDP glucuronosyltransferases. Drug Metab Dispos. 2007 Nov;35(11):2006-14. | ||||
| 156 | Metabolic map and bioactivation of the anti-tumour drug noscapine | ||||
| 157 | In vitro inhibitory effects of non-steroidal anti-inflammatory drugs on 4-methylumbelliferone glucuronidation in recombinant human UDP-glucuronosyltransferase 1A9--potent inhibition by niflumic acid. Biopharm Drug Dispos. 2006 Jan;27(1):1-6. | ||||
| 158 | Metabolism Of Antiretroviral Drugs Used In Hiv Preexposure Prophylaxis | ||||
| 159 | Metabolism and excretion of capravirine, a new non-nucleoside reverse transcriptase inhibitor, alone and in combination with ritonavir in healthy volunteers. Drug Metab Dispos. 2004 Jul;32(7):689-98. | ||||
| 160 | Stratification of Volunteers According to Flavanone Metabolite Excretion and Phase II Metabolism Profile after Single Doses of 'Pera' Orange and 'Moro' Blood Orange Juices | ||||
| 161 | Bictegravir, a novel integrase inhibitor for the treatment of HIV infection. Drugs Today (Barc). 2019 Nov;55(11):669-682. | ||||
| 162 | Phase I clinical and pharmacogenetic study of weekly TAS-103 in patients with advanced cancer. J Clin Oncol. 2001 Apr 1;19(7):2084-90. | ||||
| 163 | Chemical and enzyme-assisted syntheses of norbuprenorphine-3--D-glucuronide | ||||
| 164 | Glucuronidation of OTS167 in Humans Is Catalyzed by UDP-Glucuronosyltransferases UGT1A1, UGT1A3, UGT1A8, and UGT1A10 | ||||
| 165 | Identification of human UDP-glucuronosyltransferase responsible for the glucuronidation of niflumic acid in human liver. Pharm Res. 2006 Jul;23(7):1502-8. | ||||
| 166 | In vitro metabolism of the novel, highly selective oral angiogenesis inhibitor motesanib diphosphate in preclinical species and in humans | ||||
| 167 | Metabolism of 1,8-cineole by human cytochrome P450 enzymes: identification of a new hydroxylated metabolite. Biochim Biophys Acta. 2005 Apr 15;1722(3):304-11. doi: 10.1016/j.bbagen.2004.12.019. | ||||
| 168 | Performance comparison between multienzymes loaded single and dual electrodes for the simultaneous electrochemical detection of adenosine and metabolites in cancerous cells. Biosens Bioelectron. 2018 Jun 30;109:263-271. doi: 10.1016/j.bios.2018.03.031. | ||||
| 169 | Metabolism of the c-Fos/activator protein-1 inhibitor T-5224 by multiple human UDP-glucuronosyltransferase isoforms | ||||
| 170 | Metabolism of a representative oxygenated polycyclic aromatic hydrocarbon (PAH) phenanthrene-9,10-quinone in human hepatoma (HepG2) cells | ||||
| 171 | Fate of halogenated phenols in the organism | ||||
| 172 | Structural and functional studies of UDP-glucuronosyltransferases. Drug Metab Rev. 1999 Nov;31(4):817-99. | ||||
| 173 | Molecular structure of galactokinase J Biol Chem. 2003 Aug 29;278(35):33305-11. doi: 10.1074/jbc.M304789200. | ||||
| 174 | Absorption, disposition, metabolism, and excretion of [3-(14)C]caffeic acid in rats | ||||
| 175 | Simultaneous quantification of abemaciclib and its active metabolites in human and mouse plasma by UHPLC-MS/MS J Pharm Biomed Anal. 2021 Sep 5;203:114225. doi: 10.1016/j.jpba.2021.114225. | ||||
| 176 | Application of a Volumetric Absorptive Microsampling (VAMS)-Based Method for the Determination of Paracetamol and Four of its Metabolites as a Tool for Pharmacokinetic Studies in Obese and Non-Obese Patients. Clin Pharmacokinet. 2022 Dec;61(12):1719-1733. doi: 10.1007/s40262-022-01187-2. | ||||
| 177 | Evaluation of urinary acetaminophen metabolites and its association with the genetic polymorphisms of the metabolising enzymes, and serum acetaminophen concentrations in preterm neonates with patent ductus arteriosus. Xenobiotica. 2021 Nov;51(11):1335-1342. doi: 10.1080/00498254.2021.1982070. | ||||
| 178 | Enzymatic production of alpha-D-galactose 1-phosphate by lactose phosphorolysis Biotechnol Lett. 2009 Dec;31(12):1873-7. doi: 10.1007/s10529-009-0087-1. | ||||
| 179 | The Antifungal Effects of Citral on Magnaporthe oryzae Occur via Modulation of Chitin Content as Revealed by RNA-Seq Analysis. J Fungi (Basel). 2021 Nov 29;7(12):1023. doi: 10.3390/jof7121023. | ||||
| 180 | In Vitro Kinetic Characterization of Axitinib Metabolism | ||||
| 181 | Hepatic metabolism and disposition of baicalein via the coupling of conjugation enzymes and transporters-in vitro and in vivo evidences | ||||
| 182 | Oxazolidinones as versatile scaffolds in medicinal chemistry | ||||
| 183 | UGT1A1 dysfunction increases liver burden and aggravates hepatocyte damage caused by long-term bilirubin metabolism disorder | ||||
| 184 | Monthly variation in the plasma copper and zinc concentration of pregnant and non-pregnant mares | ||||
| 185 | Involvement of multiple cytochrome P450 and UDP-glucuronosyltransferase enzymes in the in vitro metabolism of muraglitazar. Drug Metab Dispos. 2007 Jan;35(1):139-49. | ||||
| 186 | Glucuronidation as a major metabolic clearance pathway of 14c-labeled muraglitazar in humans: metabolic profiles in subjects with or without bile collection Drug Metab Dispos. 2006 Mar;34(3):427-39. doi: 10.1124/dmd.105.007617. | ||||
| 187 | DrugBank(Pharmacology-Metabolism):Deucravacitinib | ||||
| 188 | In vitro metabolism study of buprenorphine: evidence for new metabolic pathways. Drug Metab Dispos. 2005 May;33(5):689-95. | ||||
| 189 | Interaction between buprenorphine and norbuprenorphine in neonatal opioid withdrawal syndrome. Drug Alcohol Depend. 2023 Jun 21;249:110832. doi: 10.1016/j.drugalcdep.2023.110832. | ||||
| 190 | Determination of buprenorphine, norbuprenorphine, naloxone, and their glucuronides in urine by liquid chromatography-tandem mass spectrometry. Drug Test Anal. 2021 Sep;13(9):1658-1667. doi: 10.1002/dta.3104. | ||||
| 191 | Metabolism of carvedilol in dogs, rats, and mice Drug Metab Dispos. 1998 Oct;26(10):958-69. | ||||
| 192 | Metabolism of the trisubstituted purine cyclin-dependent kinase inhibitor seliciclib (R-roscovitine) in vitro and in vivo. Drug Metab Dispos. 2008 Mar;36(3):561-70. | ||||
| 193 | Clinical Development of Darolutamide: A Novel Androgen Receptor Antagonist for the Treatment of Prostate Cancer Clin Genitourin Cancer. 2018 Oct;16(5):332-340. doi: 10.1016/j.clgc.2018.07.017. | ||||
| 194 | Drug-Drug Interaction Study to Evaluate the Pharmacokinetics, Safety, and Tolerability of Ipatasertib in Combination with Darolutamide in Patients with Advanced Prostate Cancer. Pharmaceutics. 2022 Oct 1;14(10):2101. doi: 10.3390/pharmaceutics14102101. | ||||
| 195 | Clinical Pharmacokinetics of the Androgen Receptor Inhibitor Darolutamide in Healthy Subjects and Patients with Hepatic or Renal Impairment. Clin Pharmacokinet. 2022 Apr;61(4):565-575. doi: 10.1007/s40262-021-01078-y. | ||||
| 196 | Pharmacokinetics, metabolism, and disposition of deferasirox in beta-thalassemic patients with transfusion-dependent iron overload who are at pharmacokinetic steady state Drug Metab Dispos. 2010 May;38(5):808-16. doi: 10.1124/dmd.109.030833. | ||||
| 197 | LABEL:ADICAVA- edaravone injection RADICAVA ORS- edaravone kit | ||||
| 198 | Eltrombopag for use in children with immune thrombocytopenia. Blood Adv. 2018 Feb 27;2(4):454-461. | ||||
| 199 | In vitro resistance selections using elvitegravir, raltegravir, and two metabolites of elvitegravir M1 and M4 | ||||
| 200 | Glucuronidation of the nonsteroidal antiestrogen EM-652 (SCH 57068), by human and monkey steroid conjugating UDP-glucuronosyltransferase enzymes | ||||
| 201 | Cytochrome P450 isozymes involved in the metabolism of phenol, a benzene metabolite. Toxicol Lett. 2001 Dec 15;125(1-3):117-23. | ||||
| 202 | LABEL:?ARTICAINE HYDROCHLORIDE AND EPINEPHRINE injection, solution | ||||
| 203 | Pharmacokinetics and drug interactions of eslicarbazepine acetate Epilepsia. 2012 Jun;53(6):935-46. doi: 10.1111/j.1528-1167.2012.03519.x. | ||||
| 204 | Key factors in the discovery and development of new antiepileptic drugs Nat Rev Drug Discov. 2010 Jan;9(1):68-82. doi: 10.1038/nrd2997. | ||||
| 205 | The metabolism of estradiol; oral compared to intravenous administration J Steroid Biochem. 1985 Dec;23(6A):1065-70. doi: 10.1016/0022-4731(85)90068-8. | ||||
| 206 | Profiling endogenous serum estrogen and estrogen-glucuronides by liquid chromatography-tandem mass spectrometry Anal Chem. 2009 Dec 15;81(24):10143-8. doi: 10.1021/ac9019126. | ||||
| 207 | Human bilirubin UDP-glucuronosyltransferase catalyzes the glucuronidation of ethinylestradiol Mol Pharmacol. 1993 Apr;43(4):649-54. | ||||
| 208 | Integrated population pharmacokinetics of etirinotecan pegol and its four metabolites in cancer patients with solid tumors | ||||
| 209 | DrugBank(Pharmacology-Metabolism)Etoposide | ||||
| 210 | Bioequivalence Study of Ezetimibe Tablets After a Single Oral Dose of 10?mg in Healthy Japanese Subjects Under Fasting Conditions. Clin Pharmacol Drug Dev. 2023 Apr 6. doi: 10.1002/cpdd.1245. | ||||
| 211 | Pharmacokinetics and bioequivalence of Ezetimibe tablet versus Ezetrol?:an open-label, randomized, two-sequence crossover study in healthy Chinese subjects. BMC Pharmacol Toxicol. 2023 Feb 3;24(1):7. doi: 10.1186/s40360-023-00649-y. | ||||
| 212 | Investigation of the discriminatory ability of analytes for the bioequivalence assessment of ezetimibe: Parent drug, metabolite, total form, and combination of parent drug and total form. Eur J Pharm Sci. 2022 Jul 1;174:106192. doi: 10.1016/j.ejps.2022.106192. | ||||
| 213 | DrugBank(Pharmacology-Metabolism):Favipiravir | ||||
| 214 | Clinical Investigation of Metabolic and Renal Clearance Pathways Contributing to the Elimination of Fevipiprant Using Probenecid as Perpetrator. Drug Metab Dispos. 2021 May;49(5):389-394. doi: 10.1124/dmd.120.000273. | ||||
| 215 | Fevipiprant has a low risk of influencing co-medication pharmacokinetics: Impact on simvastatin and rosuvastatin in different SLCO1B1 genotypes | ||||
| 216 | DrugBank(Pharmacology-Metabolism):Flurbiprofen | ||||
| 217 | Mass balance and metabolism of [(3)H]Formoterol in healthy men after combined i.v. and oral administration-mimicking inhalation Drug Metab Dispos. 1999 Oct;27(10):1104-16. | ||||
| 218 | DrugBank : Formoterol | ||||
| 219 | U. S. FDA Label -Fosphenytoin sodium | ||||
| 220 | High-performance liquid chromatographic determination and identification of acyl migration and photodegradation products of furosemide 1-O-acyl glucuronide J Chromatogr B Biomed Sci Appl. 1998 Oct 23;718(1):153-62. doi: 10.1016/s0378-4347(98)00357-0. | ||||
| 221 | DrugBank(Pharmacology-Metabolism):FYX-051 | ||||
| 222 | Intracellular pharmacokinetics of gemcitabine, its deaminated metabolite 2',2'-difluorodeoxyuridine and their nucleotides Br J Clin Pharmacol. 2018 Jun;84(6):1279-1289. doi: 10.1111/bcp.13557. | ||||
| 223 | Correction to "Mechanistic Basis of Cabotegravir-Glucuronide Disposition in Humans" | ||||
| 224 | Herb-drug interaction in the protective effect of Alpinia officinarum against gastric injury induced by indomethacin based on pharmacokinetic, tissue distribution and excretion studies in rats. J Pharm Anal. 2021 Apr;11(2):200-209. doi: 10.1016/j.jpha.2020.05.009. | ||||
| 225 | Pharmacokinetics, metabolism, and excretion of irinotecan (CPT-11) following I.V. infusion of [(14)C]CPT-11 in cancer patients Drug Metab Dispos. 2000 Apr;28(4):423-33. | ||||
| 226 | Transporter and metabolic enzyme-mediated intra-enteric circulation of SN-38, an active metabolite of irinotecan: A new concept. Biochem Biophys Res Commun. 2023 Jul 12;665:19-25. doi: 10.1016/j.bbrc.2023.04.109. | ||||
| 227 | Opioid-induced microbial dysbiosis disrupts irinotecan (CPT-11) metabolism and increases gastrointestinal toxicity in a murine model. Br J Pharmacol. 2023 May;180(10):1362-1378. doi: 10.1111/bph.16020. | ||||
| 228 | Pregnancy-Related Hormones Increase UGT1A1-Mediated Labetalol Metabolism in Human Hepatocytes Front Pharmacol. 2021 Apr 15;12:655320. doi: 10.3389/fphar.2021.655320. | ||||
| 229 | #N/A | ||||
| 230 | FDA label:Lenacapavir | ||||
| 231 | LABEL:PREVYMIS- letermovir tablet, film coated PREVYMIS- letermovir injection, solution | ||||
| 232 | Comparisons of detections, stabilities, and kinetics of degradation of hymecromone and its glucuronide and sulfate metabolites | ||||
| 233 | Pharmacokinetics and metabolism of LNP023 in rats by liquid chromatography combined with electrospray ionization-tandem mass spectrometry | ||||
| 234 | Clinical pharmacokinetics of losartan. Clin Pharmacokinet. 2005;44(8):797-814. | ||||
| 235 | The potent inhibition of human cytosolic sulfotransferase 1A1 by 17-ethinylestradiol is due to interactions with isoleucine 89 on loop 1 Horm Mol Biol Clin Investig. 2014 Dec;20(3):81-90. doi: 10.1515/hmbci-2014-0028. | ||||
| 236 | Presence of morphine metabolites in human cerebrospinal fluid after intracerebroventricular administration of morphine | ||||
| 237 | PharmGKB summary: mycophenolic acid pathway. Pharmacogenet Genomics. 2014 Jan;24(1):73-9. | ||||
| 238 | Metabolism of the anthelmintic drug niclosamide by cytochrome P450 enzymes and UDP-glucuronosyltransferases: metabolite elucidation and main contributions from CYP1A2 and UGT1A1 Xenobiotica. 2016;46(1):1-13. doi: 10.3109/00498254.2015.1047812. | ||||
| 239 | DrugBank(Pharmacology-Metabolism)Norgestimate | ||||
| 240 | Pharmacokinetics, pharmacodynamics and tolerability of opicapone, a novel catechol-O-methyltransferase inhibitor, in healthy subjects: prediction of slow enzyme-inhibitor complex dissociation of a short-living and very long-acting inhibitor | ||||
| 241 | DrugBank(Pharmacology-Metabolism)Phenacetin | ||||
| 242 | Biotransformation of phenytoin in the electrochemically-driven CYP2C19 system. Biophys Chem. 2022 Dec;291:106894. doi: 10.1016/j.bpc.2022.106894. | ||||
| 243 | High-performance liquid chromatographic determination of pirprofen and five of its metabolites in human plasma without hydrolysis and in human urine before and after chemical hydrolysis | ||||
| 244 | The metabolism of probenecid in man Ann N Y Acad Sci. 1971 Jul 6;179:399-402. doi: 10.1111/j.1749-6632.1971.tb46916.x. | ||||
| 245 | Raloxifene glucuronidation in liver and intestinal microsomes of humans and monkeys: contribution of UGT1A1, UGT1A8 and UGT1A9 | ||||
| 246 | Determination of raloxifene and its glucuronides in human urine by liquid chromatography-tandem mass spectrometry assay | ||||
| 247 | Pharmacokinetics of raloxifene and its clinical application | ||||
| 248 | Quantification of the HIV-integrase inhibitor raltegravir and detection of its main metabolite in human plasma, dried blood spots and peripheral blood mononuclear cell lysate by means of high-performance liquid chromatography tandem mass spectrometry | ||||
| 249 | Impact of UGT1A1 polymorphisms on Raltegravir and its glucuronide plasma concentrations in a cohort of HIV-1 infected patients | ||||
| 250 | Pharmacokinetics and safety of rucaparib in patients with advanced solid tumors and hepatic impairment. Cancer Chemother Pharmacol. 2021 Aug;88(2):259-270. doi: 10.1007/s00280-021-04278-2. | ||||
| 251 | Summary of information on human CYP enzymes: human P450 metabolism data. Drug Metab Rev. 2002 Feb-May;34(1-2):83-448. | ||||
| 252 | Evidence for differences in regioselective and stereoselective glucuronidation of silybin diastereomers from milk thistle (Silybum marianum) by human UDP-glucuronosyltransferases | ||||
| 253 | Metabolism, Transport and Drug-Drug Interactions of Silymarin | ||||
| 254 | Simvastatin Tablet, Film-Coated | ||||
| 255 | Clinical pharmacokinetics and metabolism of irinotecan (CPT-11) | ||||
| 256 | Individualization of Irinotecan Treatment: A Review of Pharmacokinetics, Pharmacodynamics, and Pharmacogenetics | ||||
| 257 | LABEL:POXX- tecovirimat monohydrate injection, solution, concentrate TPOXX- tecovirimat monohydrate capsule | ||||
| 258 | Clinical pharmacokinetics of troglitazone Clin Pharmacokinet. 1999 Aug;37(2):91-104. doi: 10.2165/00003088-199937020-00001. | ||||
| 259 | Stability studies of vorinostat and its two metabolites in human plasma, serum and urine | ||||
| 260 | Uridine 5'-diphospho-glucuronosyltransferase genetic polymorphisms and response to cancer chemotherapy. Future Oncol. 2010 Apr;6(4):563-85. | ||||
| 261 | Pharmacokinetics of carisbamate (RWJ-333369) in healthy Japanese and Western subjects | ||||
If you find any error in data or bug in web service, please kindly report it to Dr. Yin and Dr. Li.