

Details of Drug-Metabolizing Enzyme (DME)
| Full List of Drug(s) Metabolized by This DME | |||||
|---|---|---|---|---|---|
| Drugs Approved by FDA | Click to Show/Hide the Full List of Drugs: 166 Drugs | ||||
Thalidomide |
Drug Info | Approved | Breast cancer | ICD11: 2C60 | [1] |
Warfarin sodium |
Drug Info | Approved | Atrial fibrillation | ICD11: BC81 | [2] |
Estradiol acetate |
Drug Info | Approved | Acquired prion disease | ICD11: 8E01 | [3] |
Estradiol cypionate |
Drug Info | Approved | Acquired prion disease | ICD11: 8E01 | [4] |
Estradiol valerate |
Drug Info | Approved | Acquired prion disease | ICD11: 8E01 | [4] |
Estrone |
Drug Info | Approved | Menopausal disorder | ICD11: GA30 | [5] |
Nicotine |
Drug Info | Approved | Nicotine dependence | ICD11: 6C4A | [6] |
Apalutamide |
Drug Info | Approved | Acute myeloid leukaemia | ICD11: 2A60 | [7] |
Ozanimod |
Drug Info | Approved | Multiple sclerosis | ICD11: 8A40 | [8] |
Diclofenac sodium |
Drug Info | Approved | Osteoarthritis | ICD11: FA00 | [9] |
Fospropofol disodium |
Drug Info | Approved | Monitored anaesthesia care | ICD11: N.A. | [10] |
Montelukast sodium |
Drug Info | Approved | Asthma | ICD11: CA23 | [11] |
Naloxone |
Drug Info | Approved | Opiate dependence | ICD11: 6C43 | [12] |
Rosiglitazone |
Drug Info | Approved | Diabetes mellitus | ICD11: 5A10 | [13] |
Rosiglitazone |
Drug Info | Approved | Diabetes mellitus | ICD11: 5A10 | [14] |
Rosiglitazone |
Drug Info | Approved | Diabetes mellitus | ICD11: 5A10 | [15] |
Almogran |
Drug Info | Approved | Migraine | ICD11: 8A80 | [16] |
Almogran |
Drug Info | Approved | Migraine | ICD11: 8A80 | [17] |
Imatinib mesylate |
Drug Info | Approved | Chronic myelogenous leukaemia | ICD11: 2A20 | [3] |
Lidocaine |
Drug Info | Approved | Anaesthesia | ICD11: 8E22 | [18] |
Brivaracetam |
Drug Info | Approved | Focal seizure | ICD11: 8A68 | [19] |
Cannabidiol |
Drug Info | Approved | Lennox-Gastaut syndrome | ICD11: 8A62 | [20] |
Capsaicin |
Drug Info | Approved | Herpes zoster | ICD11: 1E91 | [21] |
Ethinyl estradiol |
Drug Info | Approved | Menopausal disorder | ICD11: GA30 | [22] |
Ifosfamide |
Drug Info | Approved | Lung cancer | ICD11: 2C25 | [23] |
Irbesartan |
Drug Info | Approved | Essential hypertension | ICD11: BA00 | [22] |
Lapatinib ditosylate |
Drug Info | Approved | Breast cancer | ICD11: 2C60 | [24] |
Mycophenolate mofetil |
Drug Info | Approved | Crohn disease | ICD11: DD70 | [25] |
Pitavastatin |
Drug Info | Approved | Hypertriglyceridaemia | ICD11: 5C80 | [26] |
Pitavastatin |
Drug Info | Approved | Hypertriglyceridaemia | ICD11: 5C80 | [27], [28] |
Terbinafine hydrochloride |
Drug Info | Approved | Pityriasis versicolor | ICD11: 1F2D | [29] |
Thiazolidinedione |
Drug Info | Approved | Alzheimer disease | ICD11: 8A20 | [30] |
Tretinoin |
Drug Info | Approved | Acne vulgaris | ICD11: ED80 | [31] |
Almotriptan malate |
Drug Info | Approved | Migraine | ICD11: 8A80 | [17] |
Cabazitaxel |
Drug Info | Approved | Breast cancer | ICD11: 2C60 | [32] |
Enzalutamide |
Drug Info | Approved | Prostate cancer | ICD11: 2C82 | [3] |
Enzalutamide |
Drug Info | Approved | Prostate cancer | ICD11: 2C82 | [33] |
Febuxostat |
Drug Info | Approved | Hyperuricaemia | ICD11: 5C55 | [34] |
Glasdegib |
Drug Info | Approved | Acute myeloid leukaemia | ICD11: 2A60 | [35] |
Ixazomib |
Drug Info | Approved | Amyloidosis | ICD11: 5D00 | [36] |
Pioglitazone hydrochloride |
Drug Info | Approved | Diabetes mellitus | ICD11: 5A10 | [37] |
Apomorphine |
Drug Info | Approved | Parkinsonism | ICD11: 8A00 | [38] |
Clomiphene citrate |
Drug Info | Approved | Female infertility | ICD11: GA31 | [39] |
Ketorolac |
Drug Info | Approved | Rheumatoid arthritis | ICD11: FA20 | [40] |
Nilotinib |
Drug Info | Approved | Chronic myelogenous leukaemia | ICD11: 2A20 | [3] |
Quinine sulfate |
Drug Info | Approved | Malaria | ICD11: 1F40 | [3] |
Remdesivir |
Drug Info | Approved | Coronavirus Disease 2019 (COVID-19) | ICD11: 1D6Y | [41] |
Tepotinib |
Drug Info | Approved | Lung cancer | ICD11: 2C25 | [42] |
Tepotinib |
Drug Info | Approved | Lung cancer | ICD11: 2C25 | [43] |
Tucatinib |
Drug Info | Approved | HER2-positive breast cancer | ICD11: 2C60-2C6Y | [44] |
Tucatinib |
Drug Info | Approved | HER2-positive breast cancer | ICD11: 2C60-2C6Y | [45] |
Caffeine |
Drug Info | Approved | Orthostatic hypotension | ICD11: BA21 | [46] |
Cisapride |
Drug Info | Approved | Gastro-oesophageal reflux disease | ICD11: DA22 | [47] |
Diazepam |
Drug Info | Approved | Epilepsy | ICD11: 8A60 | [48] |
Diethylstilbestrol |
Drug Info | Approved | Vaginitis | ICD11: GA02 | [49] |
Ketoprofen |
Drug Info | Approved | Anaesthesia | ICD11: 8E22 | [50] |
Lansoprazole |
Drug Info | Approved | Duodenal ulcer | ICD11: DA63 | [51] |
Macitentan |
Drug Info | Approved | Pulmonary hypertension | ICD11: BB01 | [52] |
Naproxen |
Drug Info | Approved | Rheumatoid arthritis | ICD11: FA20 | [2] |
Repaglinide |
Drug Info | Approved | Diabetes mellitus | ICD11: 5A10 | [53] |
Rofecoxib |
Drug Info | Approved | Rheumatoid arthritis | ICD11: FA20 | [3] |
Trimethoprim |
Drug Info | Approved | Infectious cystitis | ICD11: GC00 | [54] |
Verapamil hydrochloride |
Drug Info | Approved | Essential hypertension | ICD11: BA00 | [55] |
Amitriptyline hydrochloride |
Drug Info | Approved | Depression | ICD11: 6A71 | [56] |
Brigatinib |
Drug Info | Approved | Anaplastic large cell lymphoma | ICD11: 2A90 | [57] |
Bromfenac |
Drug Info | Approved | Cataract | ICD11: 9B10 | [58] |
Captopril |
Drug Info | Approved | Essential hypertension | ICD11: BA00 | [59] |
Carbamazepine |
Drug Info | Approved | Epilepsy | ICD11: 8A60 | [60] |
Cyclophosphamide |
Drug Info | Approved | Multiple myeloma | ICD11: 2A83 | [23] |
Dabrafenib mesylate |
Drug Info | Approved | Melanoma | ICD11: 2C30 | [3] |
Diltiazem hydrochloride |
Drug Info | Approved | Essential hypertension | ICD11: BA00 | [61] |
Fluvastatin sodium |
Drug Info | Approved | Hypertriglyceridaemia | ICD11: 5C80 | [62] |
Ibuprofen |
Drug Info | Approved | Anaesthesia | ICD11: 8E22 | [63] |
Isotretinoin |
Drug Info | Approved | Acne vulgaris | ICD11: ED80 | [64] |
Istradefylline |
Drug Info | Approved | Parkinsonism | ICD11: 8A00 | [65] |
Morphine |
Drug Info | Approved | Anaesthesia | ICD11: 8E22 | [66] |
Phenytoin |
Drug Info | Approved | Epilepsy | ICD11: 8A60 | [18] |
Quinidine |
Drug Info | Approved | Ventricular tachyarrhythmia | ICD11: BC71 | [3] |
Simvastatin |
Drug Info | Approved | Dyslipidaemia | ICD11: 5C81 | [67] |
Simvastatin |
Drug Info | Approved | Dyslipidaemia | ICD11: 5C81 | [68] |
Sulfinpyrazone |
Drug Info | Approved | Uncontrolled gout | ICD11: FA25 | [18] |
Amiodarone hydrochloride |
Drug Info | Approved | Ventricular tachyarrhythmia | ICD11: BC71 | [69] |
Anastrozole |
Drug Info | Approved | Breast cancer | ICD11: 2C60 | [70] |
Atorvastatin calcium |
Drug Info | Approved | Dyslipidaemia | ICD11: 5C81 | [3] |
Azelastine |
Drug Info | Approved | Allergic rhinitis | ICD11: CA08 | [71] |
Bedaquiline fumarate |
Drug Info | Approved | Pulmonary tuberculosis | ICD11: 1B10 | [72], [73] |
Buprenorphine hydrochloride |
Drug Info | Approved | Anaesthesia | ICD11: 8E22 | [12] |
Cabozantinib |
Drug Info | Approved | Thyroid cancer | ICD11: 2D10 | [74] |
Clozapine |
Drug Info | Approved | Schizophrenia | ICD11: 6A20 | [75] |
Eszopiclone |
Drug Info | Approved | Insomnia | ICD11: 7A00 | [29] |
Mirtazapine |
Drug Info | Approved | Depression | ICD11: 6A71 | [18] |
Omeprazole |
Drug Info | Approved | Gastro-oesophageal reflux disease | ICD11: DA22 | [76] |
Pazopanib |
Drug Info | Approved | Renal cell carcinoma | ICD11: 2C90 | [77] |
Perphenazine |
Drug Info | Approved | Schizophrenia | ICD11: 6A20 | [78] |
Phenprocoumon |
Drug Info | Approved | Thrombosis | ICD11: DB61 | [79] |
Ponatinib hydrochloride |
Drug Info | Approved | Acute lymphoblastic leukemia | ICD11: 2B33 | [80] |
Propofol |
Drug Info | Approved | Anaesthesia | ICD11: 8E22 | [81] |
Sulfamethoxazole |
Drug Info | Approved | Infectious cystitis | ICD11: GC00 | [82] |
Testosterone undecanoate |
Drug Info | Approved | Hypogonadism | ICD11: 5A61 | [3] |
Torasemide |
Drug Info | Approved | Congestive heart failure | ICD11: BD10 | [83] |
Treprostinil |
Drug Info | Approved | Pulmonary hypertension | ICD11: BB01 | [84] |
Vortioxetine hydrobromide |
Drug Info | Approved | Depression | ICD11: 6A71 | [85] |
Zafirlukast |
Drug Info | Approved | Asthma | ICD11: CA23 | [54] |
Apixaban |
Drug Info | Approved | Deep vein thrombosis | ICD11: BD71 | [86] |
Desloratadine |
Drug Info | Approved | Allergic rhinitis | ICD11: CA08 | [87] |
Fluorouracilo |
Drug Info | Approved | Stomach cancer | ICD11: 2B72 | [88] |
Levomethadyl acetate hydrochloride |
Drug Info | Approved | Opiate dependence | ICD11: 6C43 | [89] |
Levomilnacipran |
Drug Info | Approved | Depression | ICD11: 6A71 | [90] |
Loperamide hydrochloride |
Drug Info | Approved | Irritable bowel syndrome | ICD11: DD91 | [91] |
Losartan potassium |
Drug Info | Approved | Essential hypertension | ICD11: BA00 | [92] |
Lovastatin |
Drug Info | Approved | Hypertriglyceridaemia | ICD11: 5C80 | [93] |
Methadone |
Drug Info | Approved | Anaesthesia | ICD11: 8E22 | [94] |
Mycophenolic acid |
Drug Info | Approved | Crohn disease | ICD11: DD70 | [95], [96] |
Mycophenolic acid |
Drug Info | Approved | Crohn disease | ICD11: DD70 | [97] |
Paclitaxel |
Drug Info | Approved | Ovarian cancer | ICD11: 2C73 | [98] |
Paclitaxel |
Drug Info | Approved | Ovarian cancer | ICD11: 2C73 | [99] |
Phenobarbital |
Drug Info | Approved | Epilepsy | ICD11: 8A60 | [100] |
Piroxicam |
Drug Info | Approved | Anaesthesia | ICD11: 8E22 | [101] |
Pitavastatin calcium |
Drug Info | Approved | Hypertriglyceridaemia | ICD11: 5C80 | [102] |
Riociguat |
Drug Info | Approved | Pulmonary hypertension | ICD11: BB01 | [103] |
Sitagliptin |
Drug Info | Approved | Diabetes mellitus | ICD11: 5A10 | [104] |
Sorafenib |
Drug Info | Approved | Renal cell carcinoma | ICD11: 2C90 | [105] |
Sulfadiazine |
Drug Info | Approved | Toxoplasmosis | ICD11: 1F57 | [106] |
Taxol |
Drug Info | Approved | Breast cancer | ICD11: 2C60-2C6Y | [107], [108], [109] |
Tazarotene |
Drug Info | Approved | Psoriasis vulgaris | ICD11: EA90 | [110] |
Timolol maleate |
Drug Info | Approved | Essential hypertension | ICD11: BA00 | [111] |
Tolbutamide |
Drug Info | Approved | Diabetes mellitus | ICD11: 5A10 | [112] |
Troglitazone |
Drug Info | Approved | Diabetes mellitus | ICD11: 5A10 | [113] |
Zidovudine |
Drug Info | Approved | Human immunodeficiency virus infection | ICD11: 1C60 | [18] |
Azilsartan |
Drug Info | Approved | Hypertension | ICD11: BA00-BA04 | [114] |
Azilsartan |
Drug Info | Approved | Hypertension | ICD11: BA00-BA04 | [115], [116] |
Azilsartan medoxomil |
Drug Info | Approved | Essential hypertension | ICD11: BA00 | [117] |
Celecoxib |
Drug Info | Approved | Rheumatoid arthritis | ICD11: FA20 | [118] |
Cerivastatin sodium |
Drug Info | Approved | Hypertriglyceridaemia | ICD11: 5C80 | [3] |
Dapsone |
Drug Info | Approved | Pneumocystis pneumonia | ICD11: CA40 | [119] |
Eltrombopag olamine |
Drug Info | Approved | Thrombocytopenia | ICD11: 3B64 | [120] |
Flibanserin |
Drug Info | Approved | Inhibited sexual desire | ICD11: HA00 | [121] |
Lomitapide mesylate |
Drug Info | Approved | Hypertriglyceridaemia | ICD11: 5C80 | [122] |
Loratadine |
Drug Info | Approved | Allergic rhinitis | ICD11: CA08 | [3] |
Mefenamic acid |
Drug Info | Approved | Female pelvic pain | ICD11: GA34 | [3] |
Mephenytoin |
Drug Info | Approved | Epilepsy | ICD11: 8A60 | [123] |
Nicardipine hydrochloride |
Drug Info | Approved | Essential hypertension | ICD11: BA00 | [18] |
Pentamidine isethionate |
Drug Info | Approved | Pneumocystis pneumonia | ICD11: CA40 | [124] |
Selegiline |
Drug Info | Approved | Major depressive disorder | ICD11: 6A70-6A7Z | [125] |
Selegiline hydrochloride |
Drug Info | Approved | Parkinsonism | ICD11: 8A00 | [125] |
Selexipag |
Drug Info | Approved | Pulmonary hypertension | ICD11: BB01 | [126] |
Temazepam |
Drug Info | Approved | Insomnia | ICD11: 7A00 | [127] |
Benzyl alcohol |
Drug Info | Approved | Pediculosis | ICD11: 1G00 | [128] |
Chloroquine |
Drug Info | Approved | Malaria | ICD11: 1F40 | [129] |
Chloroquine |
Drug Info | Approved | Malaria | ICD11: 1F40 | [130] |
Enasidenib |
Drug Info | Approved | Acute myeloid leukaemia | ICD11: 2A60 | [131] |
Halofantrine |
Drug Info | Approved | Malaria | ICD11: 1F40 | [132] |
Lorlatinib |
Drug Info | Approved | Lung cancer | ICD11: 2C25 | [133] |
Meloxicam |
Drug Info | Approved | Osteoarthritis | ICD11: FA00 | [134] |
Relugolix |
Drug Info | Approved | Prostate cancer | ICD11: 2C82 | [135] |
Testosterone cypionate |
Drug Info | Approved | Testosterone deficiency | ICD11: 5A81 | [3] |
Testosterone enanthate |
Drug Info | Approved | Testosterone deficiency | ICD11: 5A81 | [3] |
Trimethadione |
Drug Info | Approved | Epilepsy | ICD11: 8A60 | [136] |
Velpatasvir |
Drug Info | Approved | Viral hepatitis | ICD11: 1E51 | [137] |
Velpatasvir |
Drug Info | Approved | Viral hepatitis | ICD11: 1E51 | [138] |
Voxilaprevir |
Drug Info | Approved | Viral hepatitis | ICD11: 1E51 | [137] |
Voxilaprevir |
Drug Info | Approved | Viral hepatitis | ICD11: 1E51 | [139] |
Elagolix sodium |
Drug Info | Approved | Endometriosis | ICD11: GA10 | [140] |
Lovastatin acid |
Drug Info | Approved | Hypertriglyceridaemia | ICD11: 5C80 | [141] |
Nabilone |
Drug Info | Approved | Insomnia | ICD11: 7A00-7A0Z | [142] |
Trifarotene |
Drug Info | Approved | Acne vulgaris | ICD11: ED80 | [143] |
| Drugs in Phase 4 Clinical Trial | Click to Show/Hide the Full List of Drugs: 14 Drugs | ||||
Ombitasvir |
Drug Info | Phase 4 | Viral hepatitis | ICD11: 1E51 | [144] |
Mestranol |
Drug Info | Phase 4 | Menorrhagia | ICD11: GA20 | [145] |
Ketobemidone |
Drug Info | Phase 4 | Anaesthesia | ICD11: 8E22 | [146] |
Amodiaquine |
Drug Info | Phase 4 | Malaria | ICD11: 1F40 | [147] |
Tienilic acid |
Drug Info | Phase 4 | Congestive heart failure | ICD11: BD10 | [29] |
Aminophenazone |
Drug Info | Phase 4 | Anaesthesia | ICD11: 8E22 | [148] |
Zopiclone |
Drug Info | Phase 4 | Insomnia | ICD11: 7A00 | [149] |
Dexibuprofen |
Drug Info | Phase 4 | Osteoarthritis | ICD11: FA00 | [63] |
Milnacipran |
Drug Info | Phase 4 | Asperger syndrome | ICD11: 6A02 | [150] |
Milnacipran |
Drug Info | Phase 4 | Asperger syndrome | ICD11: 6A02 | [151] |
Pranlukast |
Drug Info | Phase 4 | Obstructive sleep apnea | ICD11: 7A41 | [152] |
Tegafur |
Drug Info | Phase 4 | Colon cancer | ICD11: 2B90 | [88] |
Beraprost |
Drug Info | Phase 4 | Influenza virus infection | ICD11: 1E30 | [153] |
Cefaloridine |
Drug Info | Phase 4 | Staphylococcus infection | ICD11: 1B73 | [154] |
| Drugs in Phase 3 Clinical Trial | Click to Show/Hide the Full List of Drugs: 36 Drugs | ||||
E-3A |
Drug Info | Phase 3 | Turner syndrome | ICD11: LD50 | [3] |
Selumetinib |
Drug Info | Phase 3 | Neurofibromatosis | ICD11: LD2D | [155] |
FG-4592 |
Drug Info | Phase 3 | Anaemia | ICD11: 3A90 | [156] |
LY-2484595 |
Drug Info | Phase 3 | Myocardial infarction | ICD11: BA41 | [157] |
Sotorasib |
Drug Info | Phase 3 | Lung cancer | ICD11: 2C25 | [59] |
BMS-298585 |
Drug Info | Phase 3 | Diabetes mellitus | ICD11: 5A10 | [158] |
Finerenone |
Drug Info | Phase 3 | Diabetic nephropathy | ICD11: GB61 | [159], [160], [161] |
Finerenone |
Drug Info | Phase 3 | Diabetic nephropathy | ICD11: GB61 | [159] |
Finerenone |
Drug Info | Phase 3 | Diabetic nephropathy | ICD11: GB61 | [161] |
Finerenone |
Drug Info | Phase 3 | Diabetic nephropathy | ICD11: GB61 | [162] |
LAS-17177 |
Drug Info | Phase 3 | Functional nausea/vomiting | ICD11: DD90 | [163] |
ABT-333 |
Drug Info | Phase 3 | Viral hepatitis | ICD11: 1E51 | [164] |
KW-5338 |
Drug Info | Phase 3 | Gastroparesis | ICD11: DA41 | [165] |
LAU-7b |
Drug Info | Phase 3 | Macular degeneration | ICD11: 9B78 | [166] |
NSC-122758 |
Drug Info | Phase 3 | Vitamin deficiency | ICD11: 5B55 | [167] |
NSC-122758 |
Drug Info | Phase 3 | Vitamin deficiency | ICD11: 5B55 | [31] |
NSC-122758 |
Drug Info | Phase 3 | Vitamin deficiency | ICD11: 5B55 | [31], [168] |
Bexagliflozin |
Drug Info | Phase 3 | Type-2 diabetes | ICD11: 5A11 | [169] |
CKD-501 |
Drug Info | Phase 3 | Diabetes mellitus | ICD11: 5A10 | [170] |
Masitinib |
Drug Info | Phase 3 | Amyotrophic lateral sclerosis | ICD11: 8B60 | [171] |
Hydroxychloroquine |
Drug Info | Phase 3 | Malaria | ICD11: 1F40-1F45 | [130] |
LNP023 |
Drug Info | Phase 3 | IgA nephropathy | ICD11: MF8Y | [172] |
LY-450139 |
Drug Info | Phase 3 | Alzheimer disease | ICD11: 8A20 | [173] |
Imatinib |
Drug Info | Phase 3 | Mantle cell lymphoma | ICD11: 2A85 | [3] |
TAK-491 |
Drug Info | Phase 3 | Hypertension | ICD11: BA00-BA04 | [174] |
BNP-1350 |
Drug Info | Phase 3 | Ovarian cancer | ICD11: 2C73 | [175] |
MRTX849 |
Drug Info | Phase 3 | Lung cancer | ICD11: 2C25 | [176] |
Ag-221 |
Drug Info | Phase 3 | Acute myelogenous leukaemia | ICD11: 2A41 | [177] |
Atorvastatin |
Drug Info | Phase 3 | Hypertriglyceridaemia | ICD11: 5C80 | [62] |
CS-011 |
Drug Info | Phase 3 | Diabetes mellitus | ICD11: 5A10 | [178] |
CYT-387 |
Drug Info | Phase 3 | Myelofibrosis | ICD11: 2A22 | [179] |
DRF-2593 |
Drug Info | Phase 3 | Diabetes mellitus | ICD11: 5A10 | [170] |
Elagolix |
Drug Info | Phase 3 | Uterine leiomyoma | ICD11: 2E86 | [180] |
Montelukast |
Drug Info | Phase 3 | Asthma | ICD11: CA23 | [22] |
Palovarotene |
Drug Info | Phase 3 | Fibrodysplasia ossificans progressiva | ICD11: FB31 | [181] |
RG7388 |
Drug Info | Phase 3 | Acute myeloid leukaemia | ICD11: 2A60 | [182] |
| Drugs in Phase 2 Clinical Trial | Click to Show/Hide the Full List of Drugs: 26 Drugs | ||||
Verapamil |
Drug Info | Phase 2/3 | Hypertension | ICD11: BA00-BA04 | [183], [184] |
EMD-128130 |
Drug Info | Phase 2/3 | Rett syndrome | ICD11: LD90 | [185] |
QLT-091001 |
Drug Info | Phase 2/3 | Barrett esophagus | ICD11: DA23 | [167] |
Amiodarone |
Drug Info | Phase 2/3 | Ventricular tachyarrhythmia | ICD11: BC71 | [186] |
PF-06463922 |
Drug Info | Phase 2 | Lung cancer | ICD11: 2C25 | [187] |
BLZ-945 |
Drug Info | Phase 2 | Amyotrophic lateral sclerosis | ICD11: 8B60 | [188] |
GSK-1278863 |
Drug Info | Phase 2 | Asperger syndrome | ICD11: 6A02 | [189] |
LIK-066 |
Drug Info | Phase 2 | Heart failure | ICD11: BD10-BD1Z | [190] |
AZD-2014 |
Drug Info | Phase 2 | Brain cancer | ICD11: 2A00 | [191] |
LJN452 |
Drug Info | Phase 2 | Primary biliary cholangitis | ICD11: DB96 | [192] |
AP26113 |
Drug Info | Phase 2 | Solid tumour/cancer | ICD11: 2A00-2F9Z | [57] |
AP26113 |
Drug Info | Phase 2 | Solid tumour/cancer | ICD11: 2A00-2F9Z | [193] |
AMG 853 |
Drug Info | Phase 2 | Asthma | ICD11: CA23 | [194] |
Ibrolipim |
Drug Info | Phase 2 | Hypertriglyceridaemia | ICD11: 5C80 | [195] |
AKB-9778 |
Drug Info | Phase 2 | Arterial occlusive disease | ICD11: BD4Z | [196] |
JI-101 |
Drug Info | Phase 2 | Solid tumour/cancer | ICD11: 2A00-2F9Z | [197] |
RDEA3170 |
Drug Info | Phase 2 | Hyperuricaemia | ICD11: 5C55 | [198] |
SAM-531 |
Drug Info | Phase 2 | Alzheimer disease | ICD11: 8A20 | [199] |
VX-680 |
Drug Info | Phase 2 | Solid tumour/cancer | ICD11: 2A00-2F9Z | [200] |
PTC299 |
Drug Info | Phase 2 | Solid tumour/cancer | ICD11: 2A00-2F9Z | [201] |
TAK-063 |
Drug Info | Phase 2 | Schizophrenia | ICD11: 6A20 | [202] |
TAK-906 |
Drug Info | Phase 2 | Gastroparesis | ICD11: DA41 | [203] |
GS-9857 |
Drug Info | Phase 2 | Hepatitis C virus infection | ICD11: 1E50-1E51 | [204] |
KD025 |
Drug Info | Phase 2 | Psoriasis vulgaris | ICD11: EA90 | [205] |
TAK-652 |
Drug Info | Phase 2 | Human immunodeficiency virus infection | ICD11: 1C60 | [206] |
Vidofludimus |
Drug Info | Phase 2 | Rheumatoid arthritis | ICD11: FA20 | [207] |
| Drugs in Phase 1 Clinical Trial | Click to Show/Hide the Full List of Drugs: 10 Drugs | ||||
AG-1549 |
Drug Info | Phase 1 | Human immunodeficiency virus infection | ICD11: 1C60 | [208] |
STX 64 |
Drug Info | Phase 1 | Prostate cancer | ICD11: 2C82 | [209] |
MK-0822 |
Drug Info | Phase 1 | Osteoporosis | ICD11: FB83 | [210] |
AST-1306 |
Drug Info | Phase 1 | Solid tumour/cancer | ICD11: 2A00-2F9Z | [211] |
H3B-6545 |
Drug Info | Phase 1 | Breast cancer | ICD11: 2C60 | [212] |
M-813 |
Drug Info | Phase 1 | Schizophrenia | ICD11: 6A20 | [213] |
Alvespimycin hydrochloride |
Drug Info | Phase 1 | Ovarian cancer | ICD11: 2C73 | [214] |
Benzoylphenylurea |
Drug Info | Phase 1 | Solid tumour/cancer | ICD11: 2A00-2F9Z | [215], [216] |
AZD-9496 |
Drug Info | Phase 1 | Breast cancer | ICD11: 2C60 | [217] |
ARRY-380 |
Drug Info | Phase 1 | Solid tumour/cancer | ICD11: 2A00-2F9Z | [218] |
| Discontinued/withdrawn Drugs | Click to Show/Hide the Full List of Drugs: 8 Drugs | ||||
Cilomilast |
Drug Info | Discontinued in Phase 3 | Emphysema | ICD11: CA21 | [219] |
Darapladib |
Drug Info | Discontinued in Phase 3 | Arteriosclerosis obliterans | ICD11: BD40 | [220] |
AZD0328 |
Drug Info | Discontinued in Phase 2 | Alzheimer disease | ICD11: 8A20 | [221] |
BMS-181168 |
Drug Info | Discontinued in Phase 2 | Cognitive impairment | ICD11: 6D71 | [222] |
ADD-3878 |
Drug Info | Discontinued | Endometriosis | ICD11: GA10 | [170] |
ML-3000 |
Drug Info | Discontinued | Osteoarthritis | ICD11: FA00 | [29] |
R-1439 |
Drug Info | Discontinued | Diabetes mellitus | ICD11: 5A10 | [223] |
ABT-001 |
Drug Info | Discontinued | Asthma | ICD11: CA23 | [224] |
| Preclinical/investigative Agents | Click to Show/Hide the Full List of Drugs: 6 Drugs | ||||
Arachidonic acid |
Drug Info | Investigative | Discovery agent | ICD: N.A. | [225] |
Antipyrine |
Drug Info | Investigative | Discovery agent | ICD: N.A. | [29] |
Lauric acid |
Drug Info | Investigative | Alzheimer disease | ICD11: 8A20 | [226], [227] |
Cyamemazine |
Drug Info | Investigative | Discovery agent | ICD: N.A. | [228] |
Diclofenac glucuronide |
Drug Info | Investigative | Discovery agent | ICD: N.A. | [229] |
Paraoxon |
Drug Info | Investigative | Discovery agent | ICD: N.A. | [230] |
| Tissue/Disease-Specific Protein Abundances of This DME | |||||
|---|---|---|---|---|---|
| Tissue-specific Protein Abundances in Healthy Individuals | Click to Show/Hide | ||||

|
|||||
| ICD Disease Classification 01 | Infectious/parasitic disease | Click to Show/Hide | |||
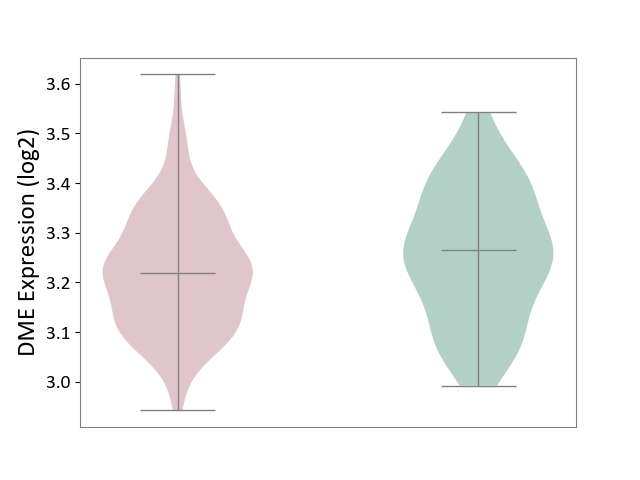
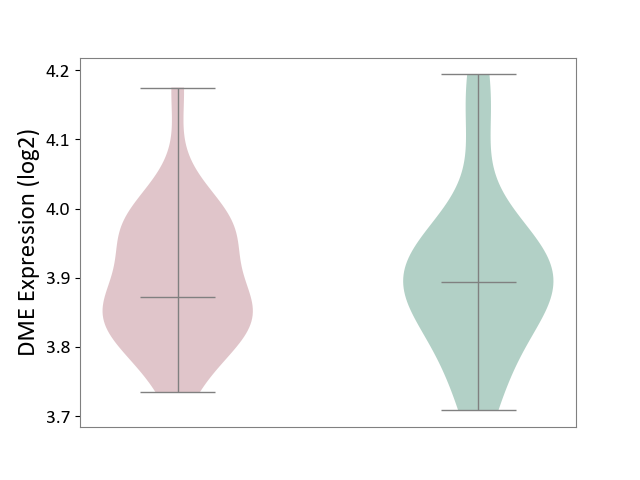
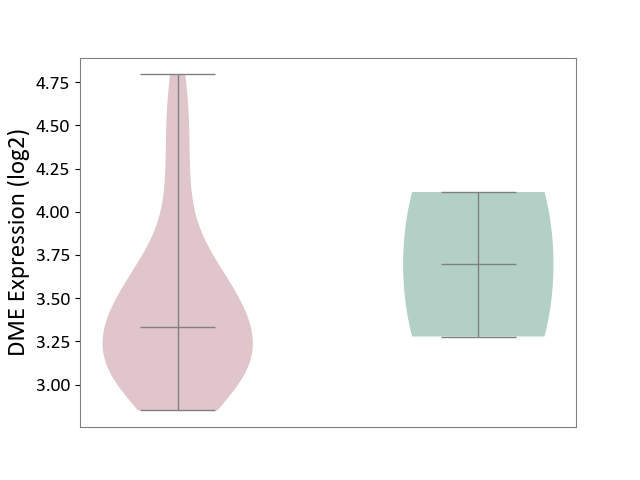
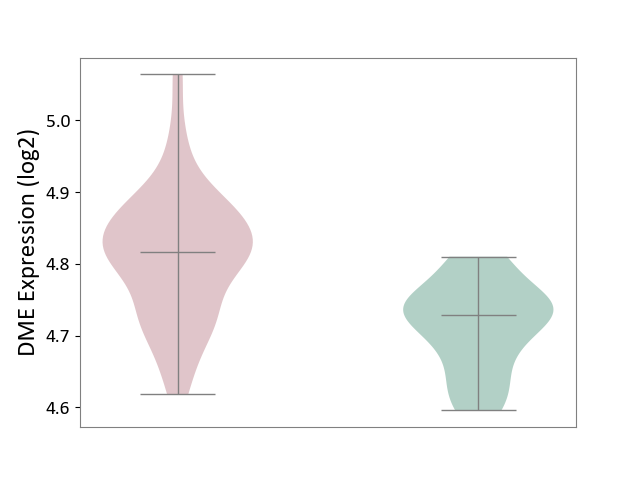
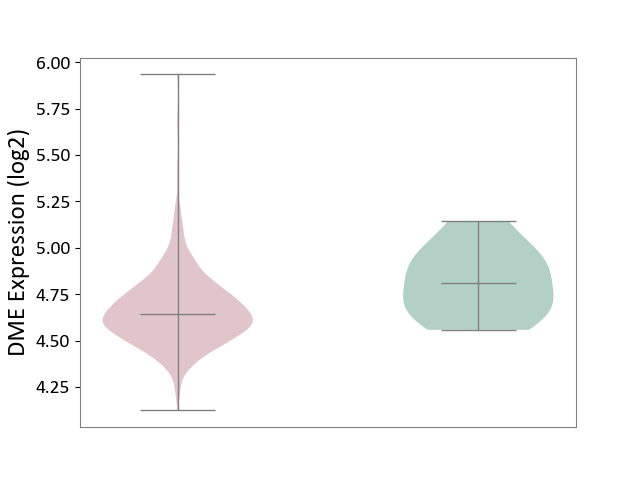
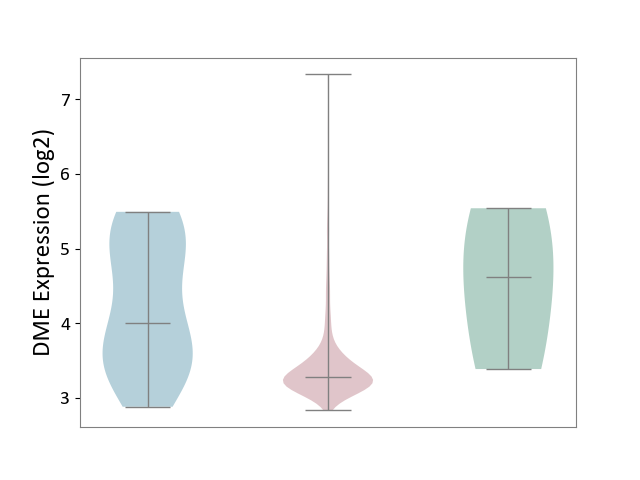
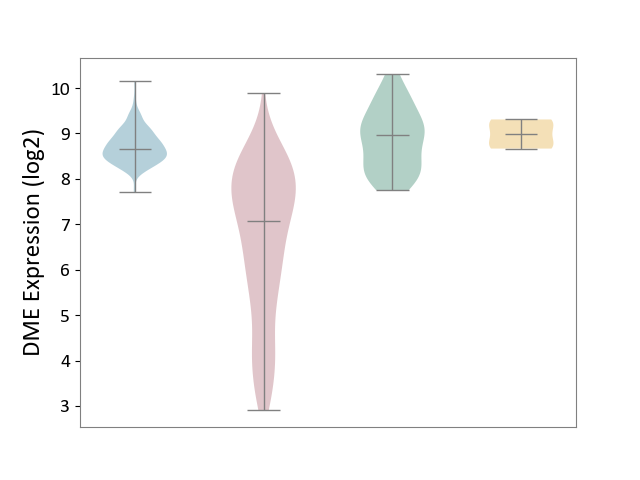
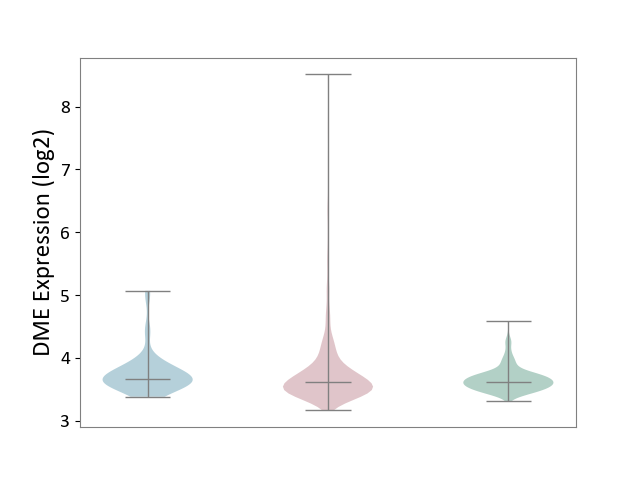
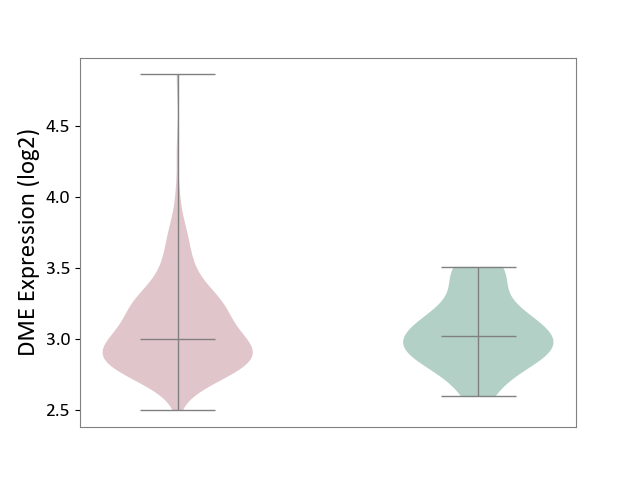
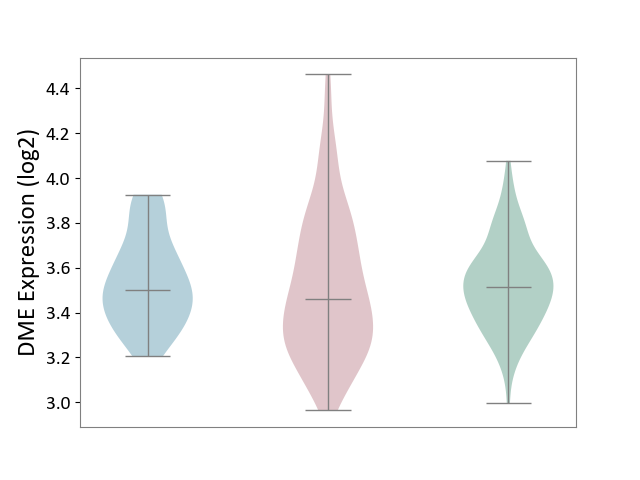
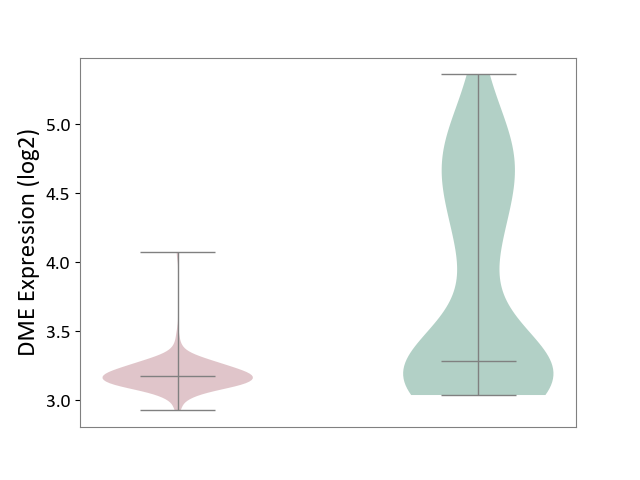
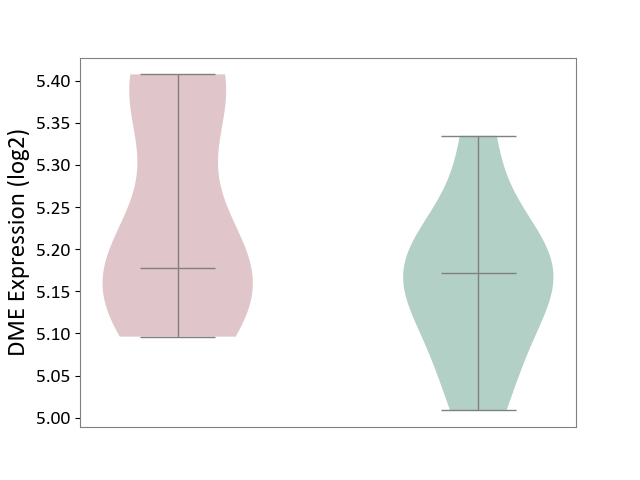
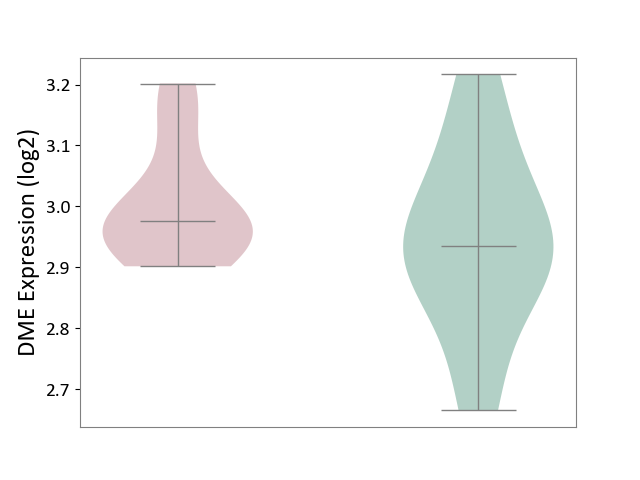
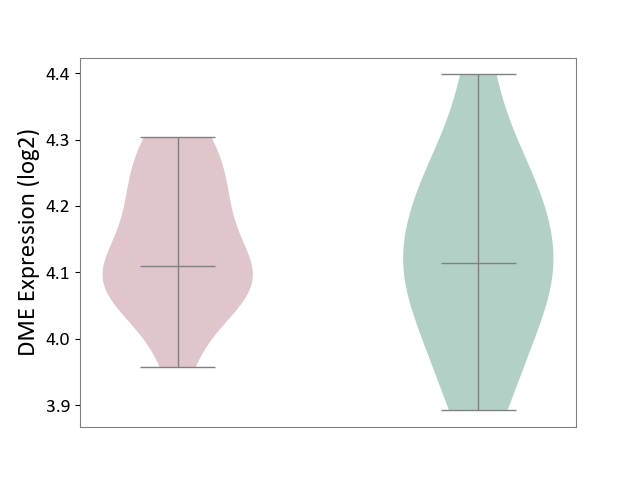
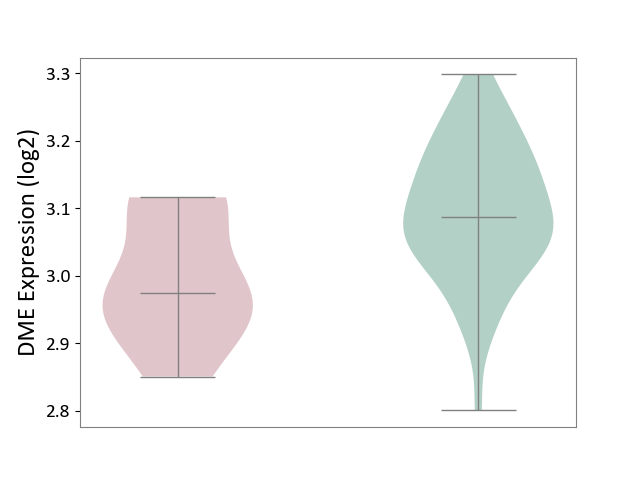
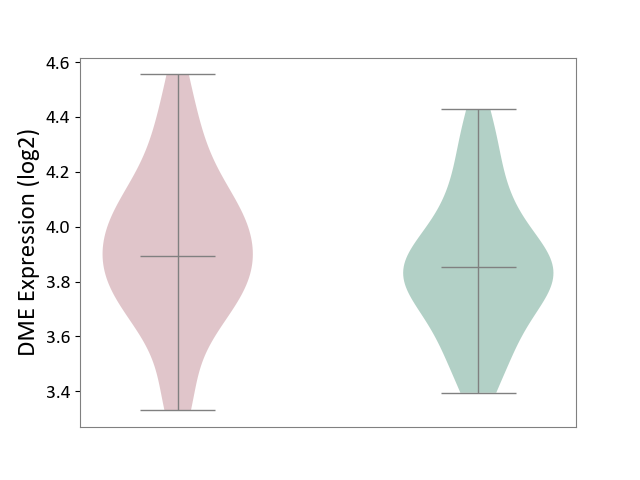
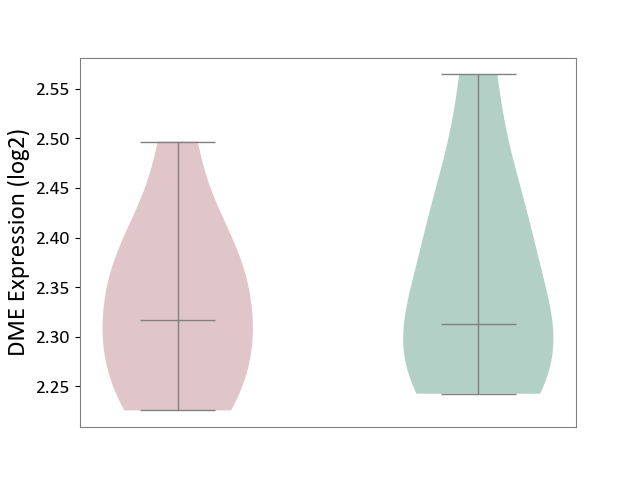
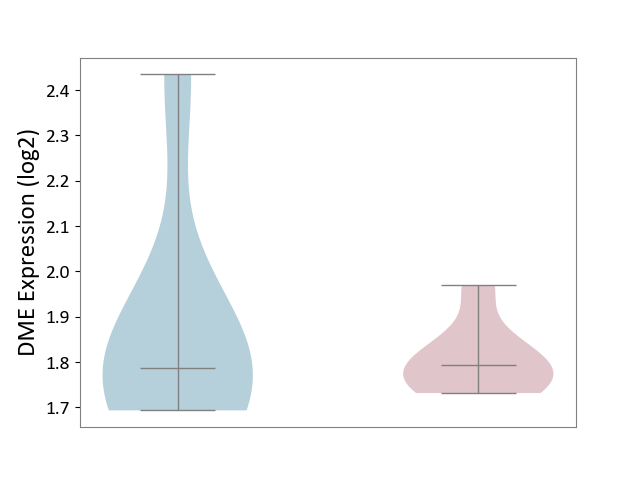
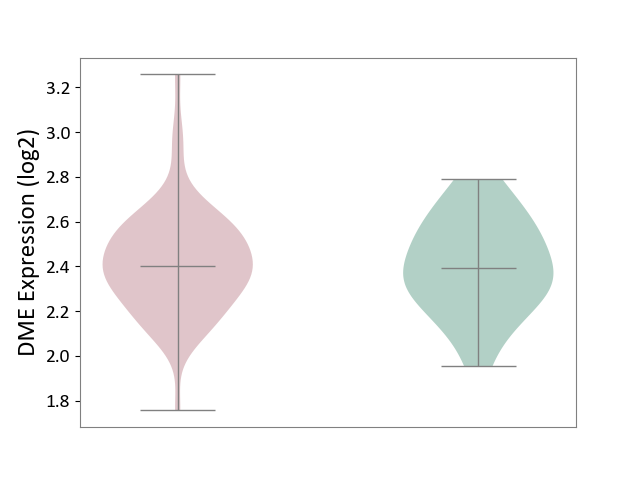
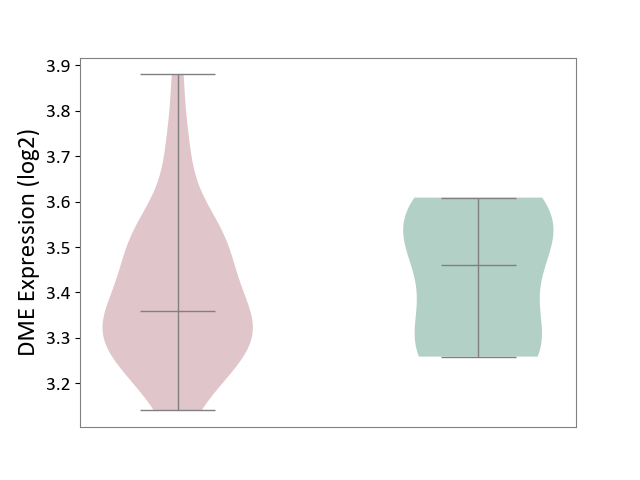
| ICD-11: 1C1H | Necrotising ulcerative gingivitis | Click to Show/Hide | |||
| The Studied Tissue | Gingival tissue | ||||
| The Specified Disease | Bacterial infection of gingival [ICD-11:1C1H] | ||||
| The Expression Level of Disease Section Compare with the Healthy Individual Tissue | p-value: 6.65E-02; Fold-change: -4.48E-02; Z-score: -3.36E-01 | ||||
|
DME expression in the diseased tissue of patients
DME expression in the normal tissue of healthy individuals
|
|||||
| Violin Diagram of DME Disease-specific Protein Abundances |
|
Click to View the Clearer Original Diagram | |||
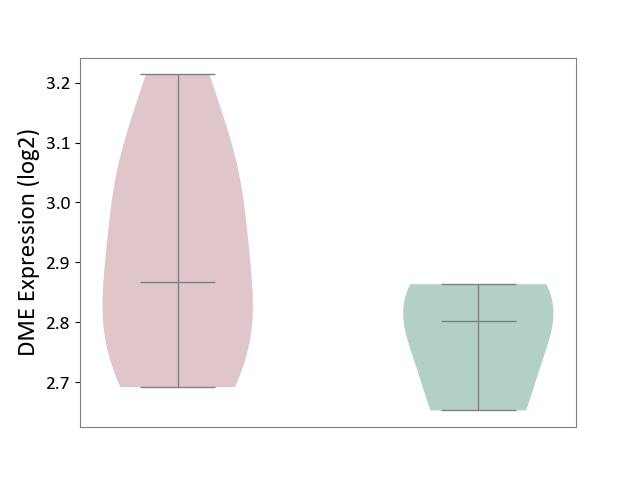
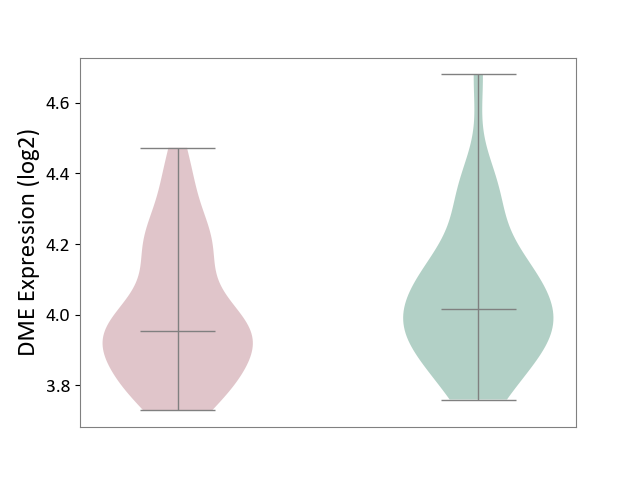
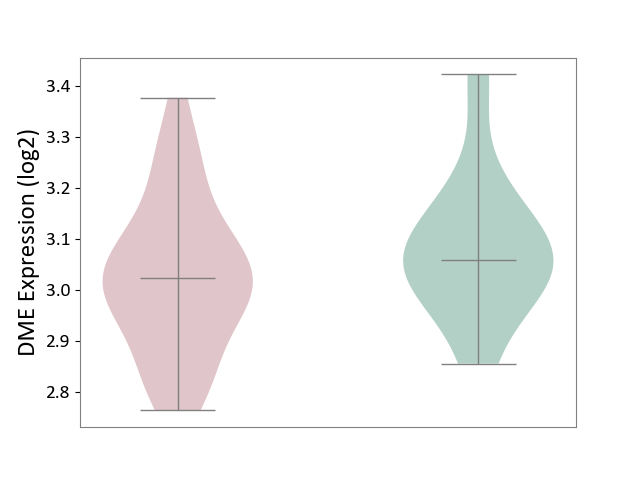
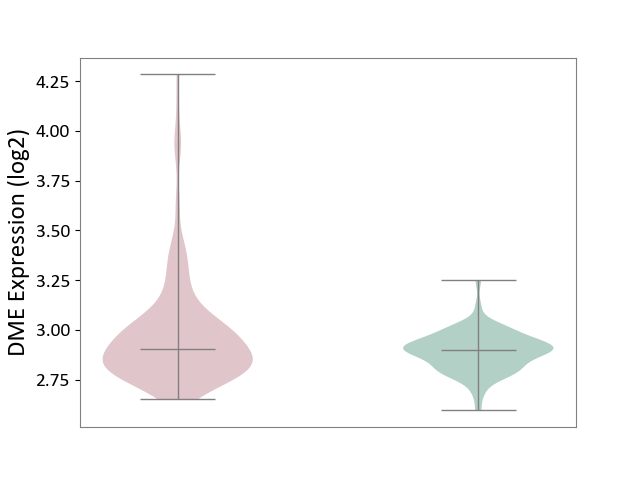
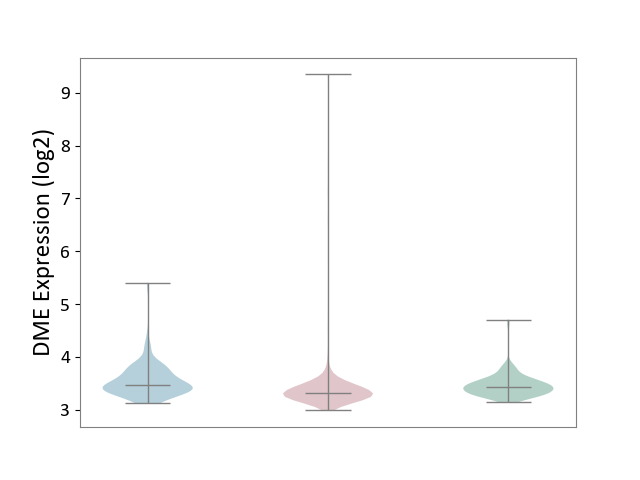
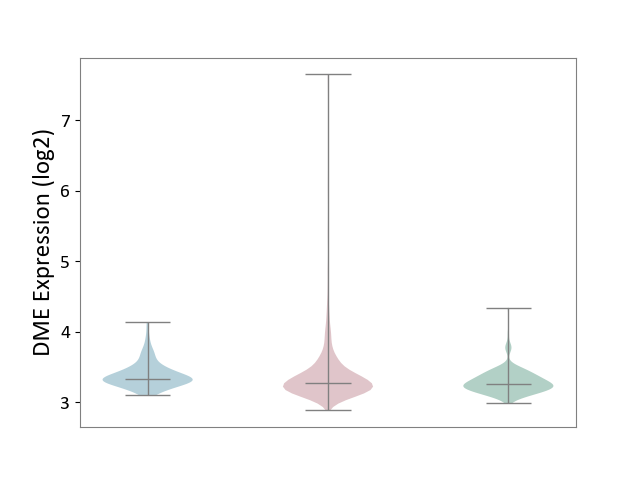
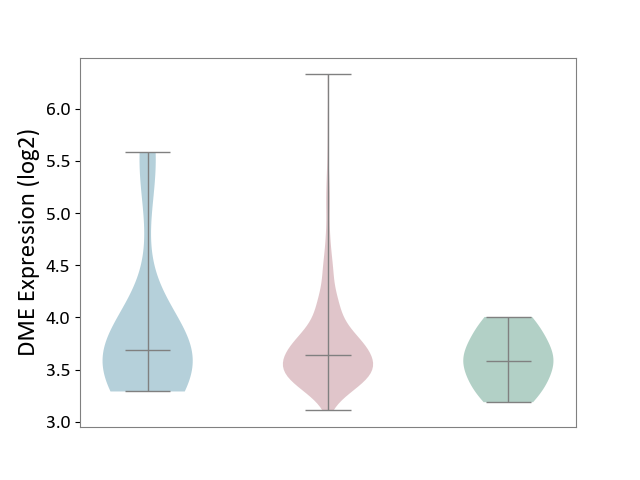
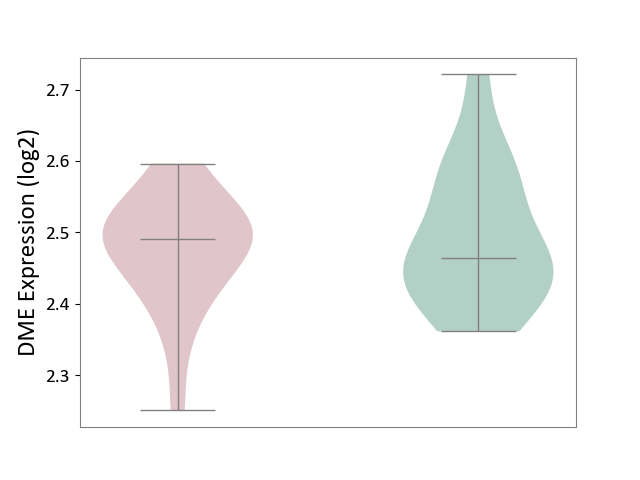
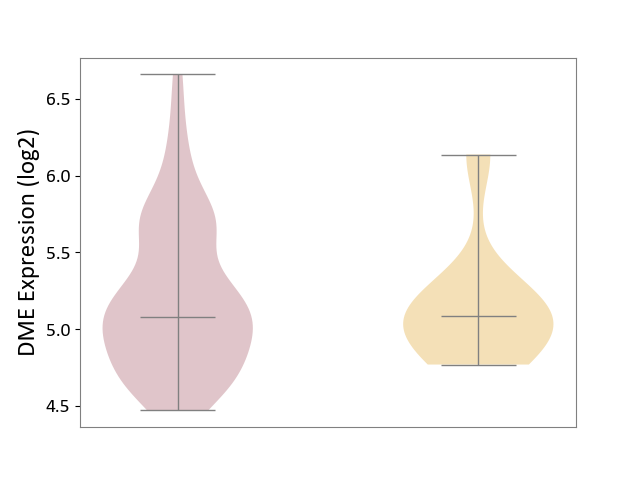
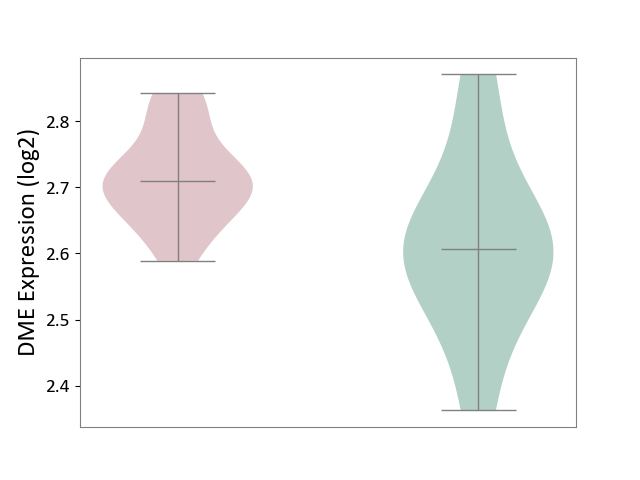
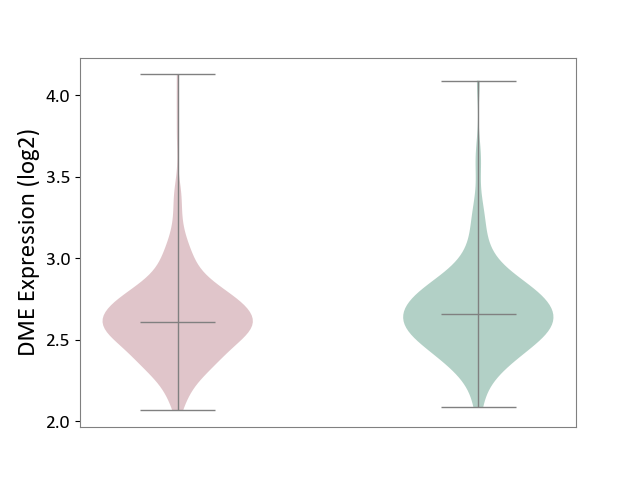
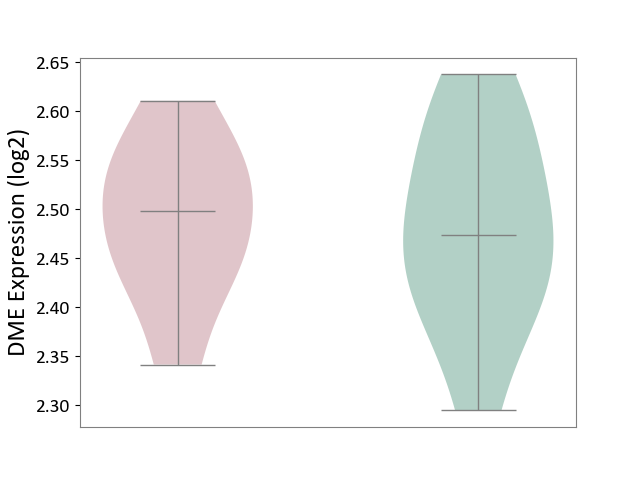
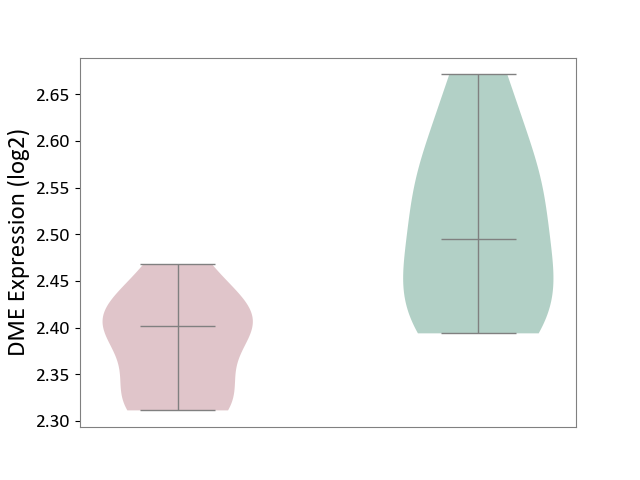
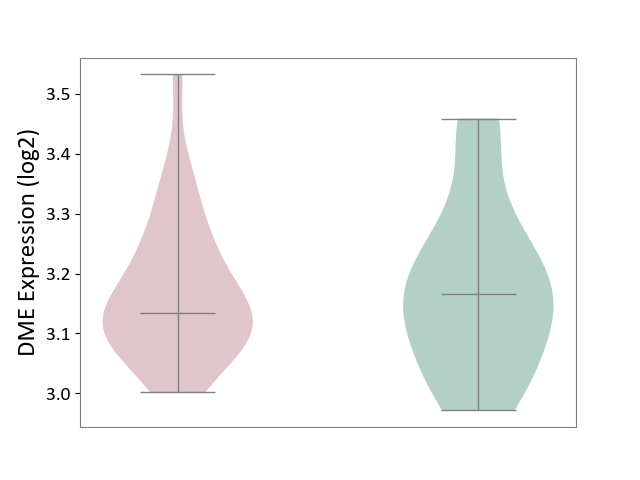
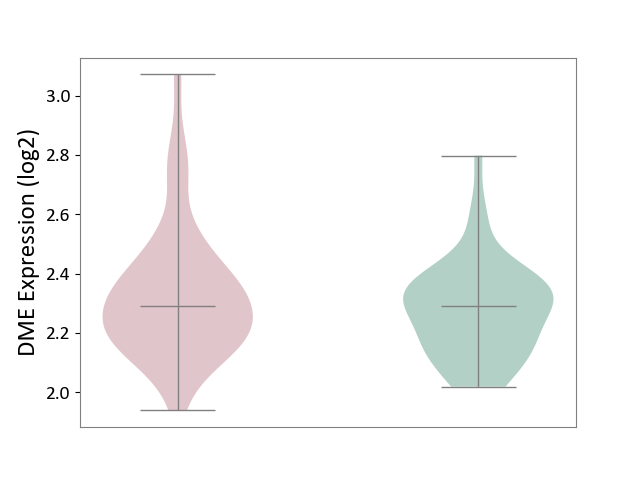
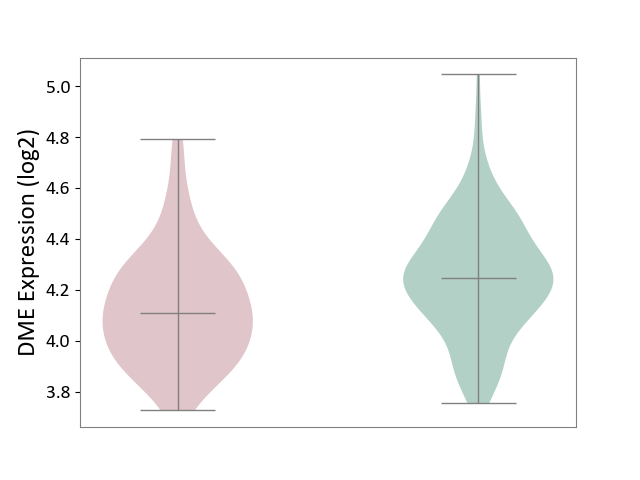
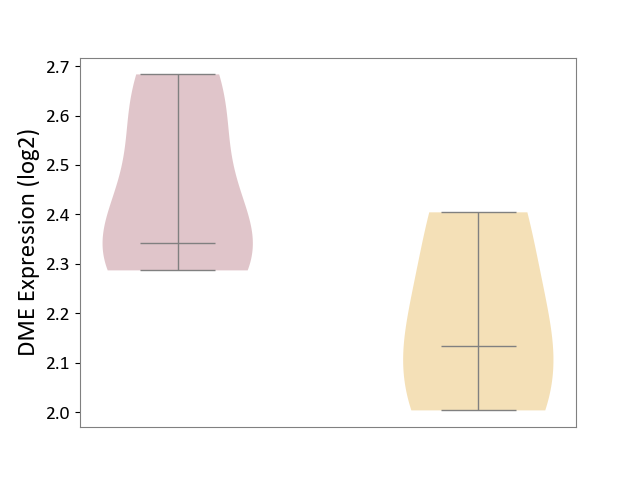
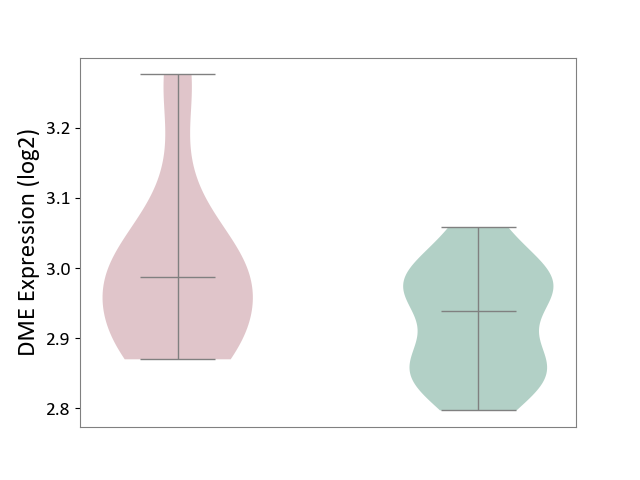
| ICD-11: 1E30 | Influenza | Click to Show/Hide | |||
| The Studied Tissue | Whole blood | ||||
| The Specified Disease | Influenza [ICD-11:1E30] | ||||
| The Expression Level of Disease Section Compare with the Healthy Individual Tissue | p-value: 1.60E-01; Fold-change: 6.49E-02; Z-score: 5.99E-01 | ||||
|
DME expression in the diseased tissue of patients
DME expression in the normal tissue of healthy individuals
|
|||||
| Violin Diagram of DME Disease-specific Protein Abundances |
|
Click to View the Clearer Original Diagram | |||
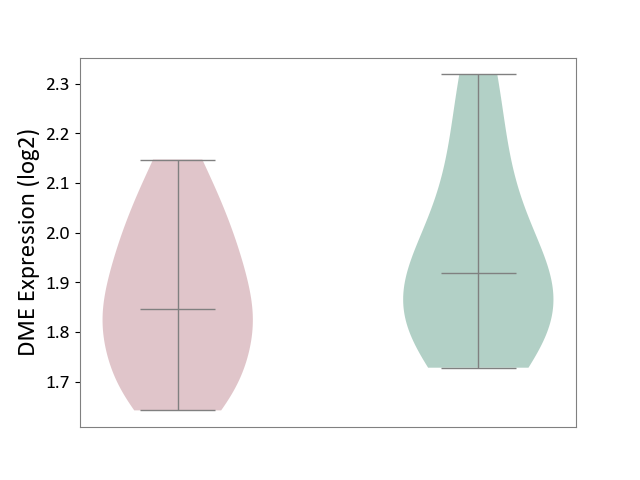
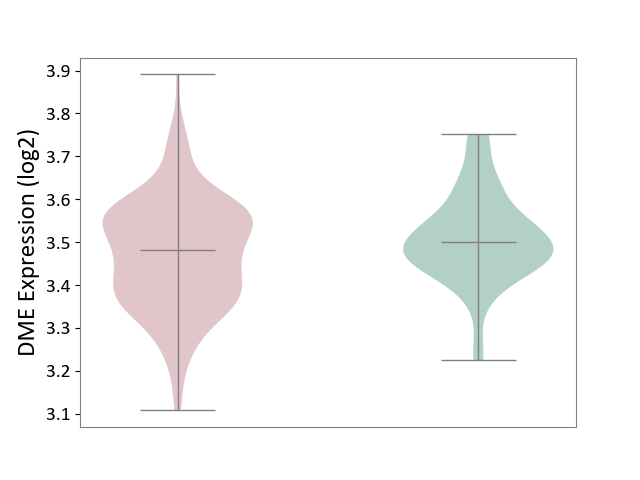
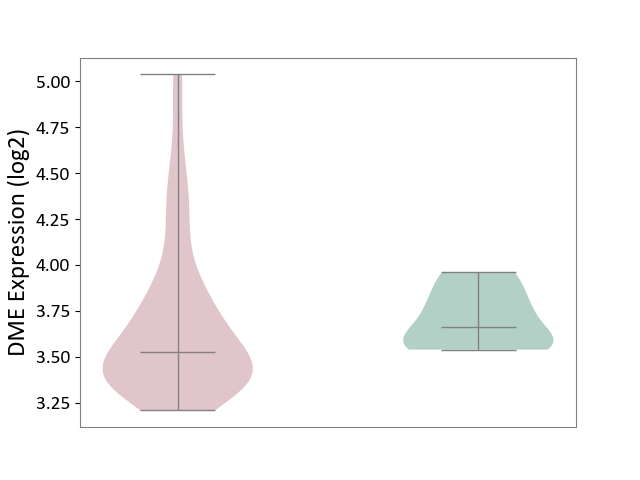
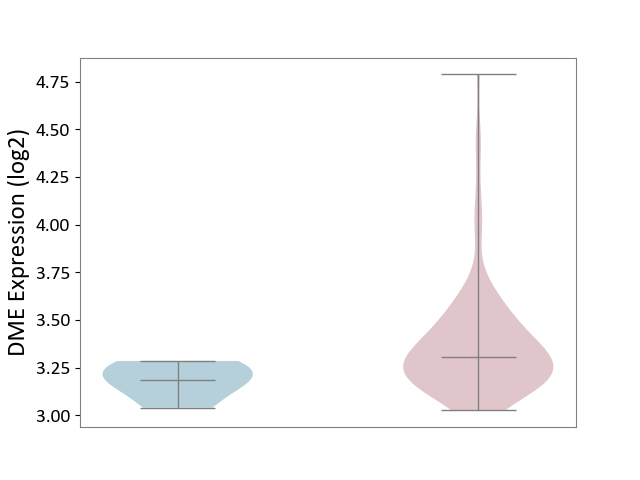
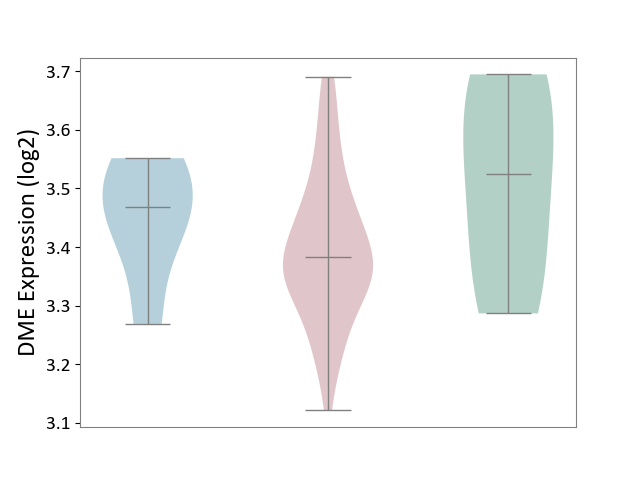
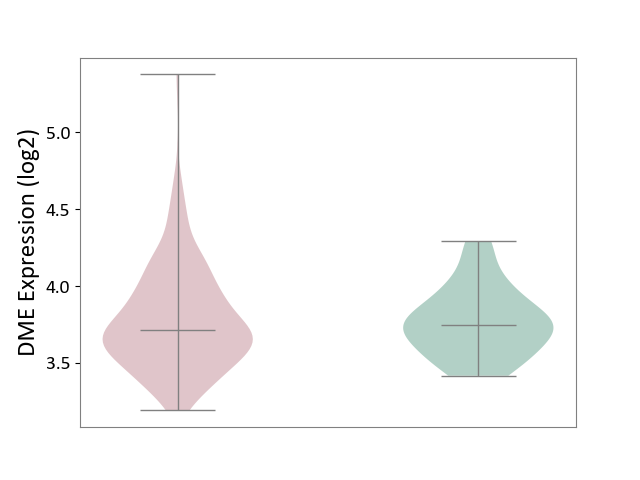
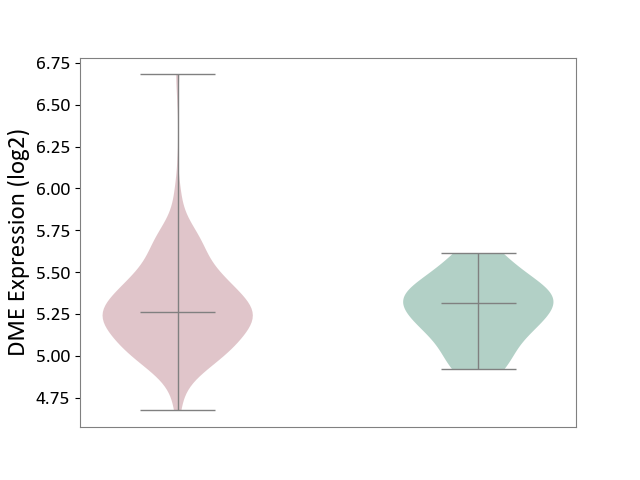
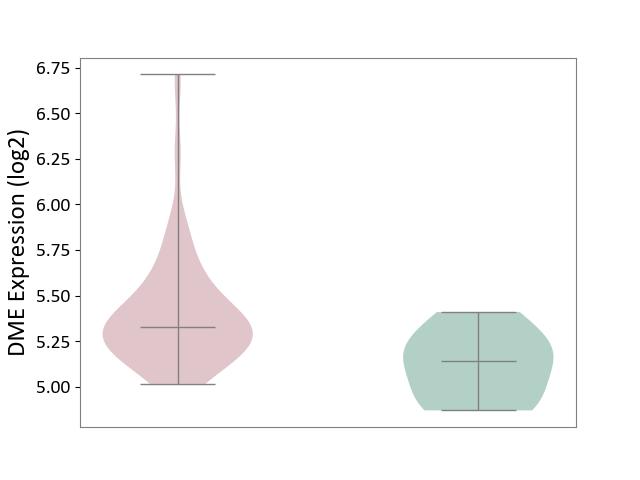
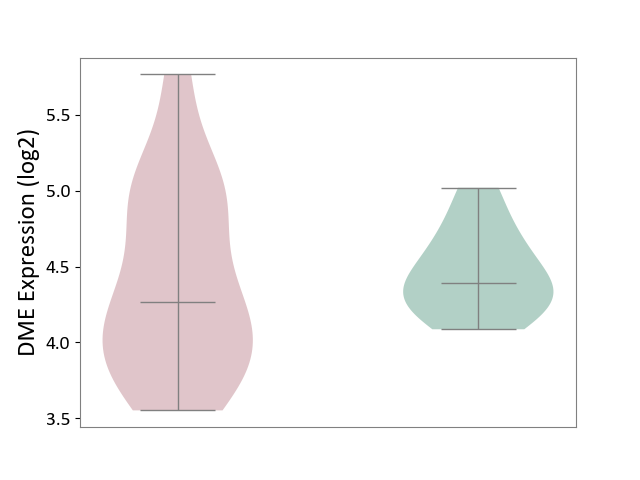
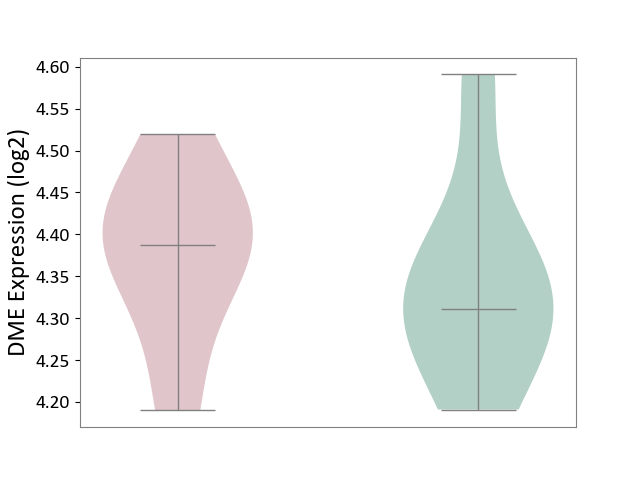
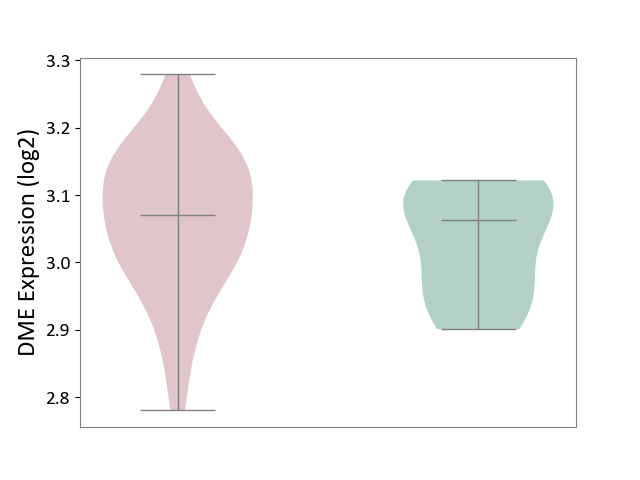
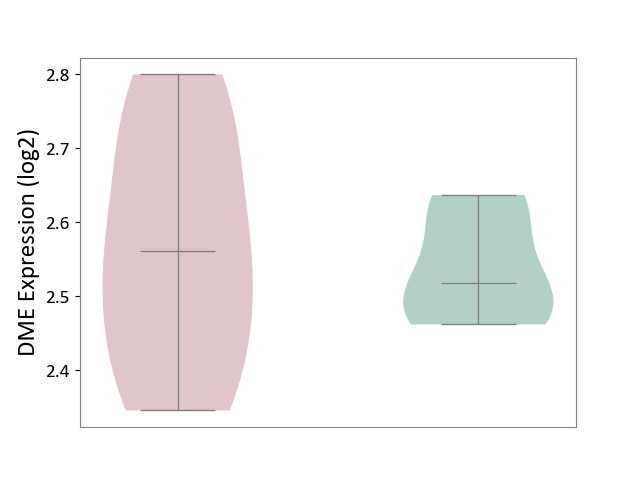
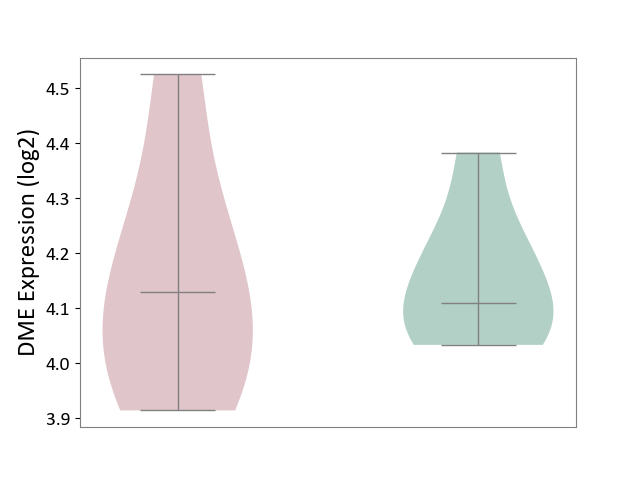
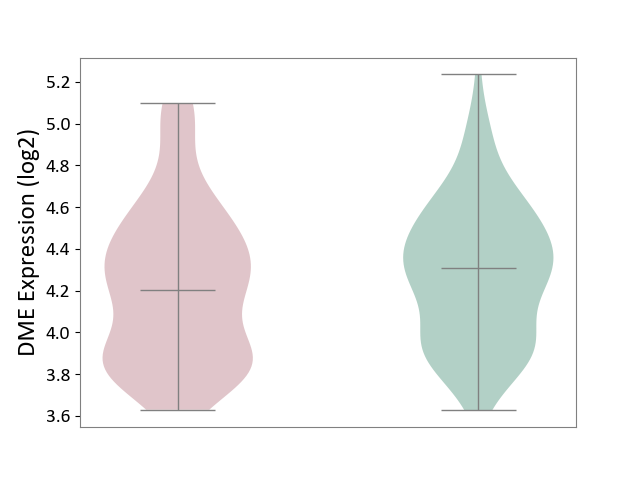
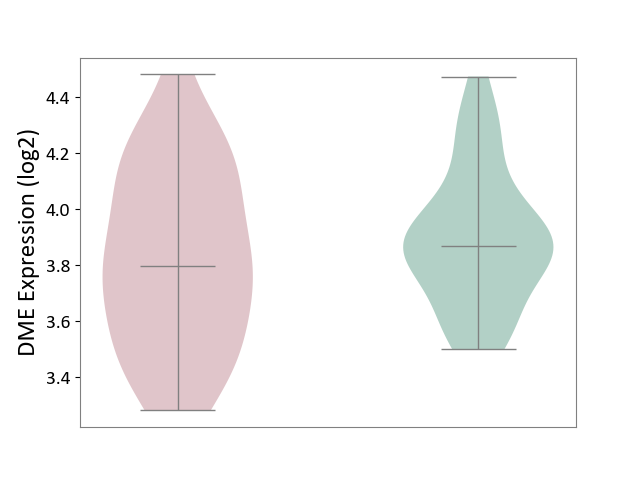
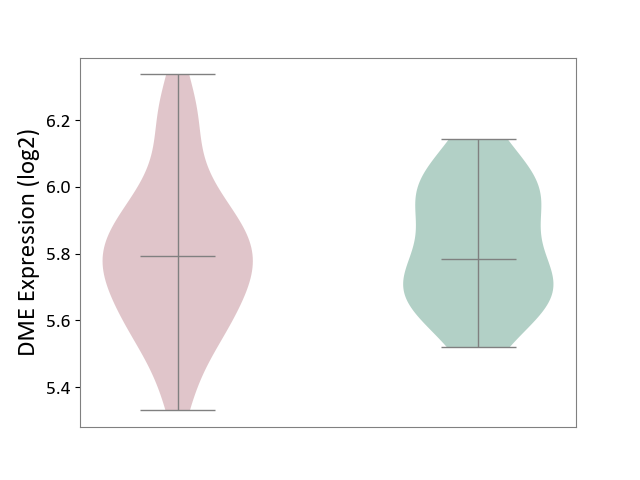
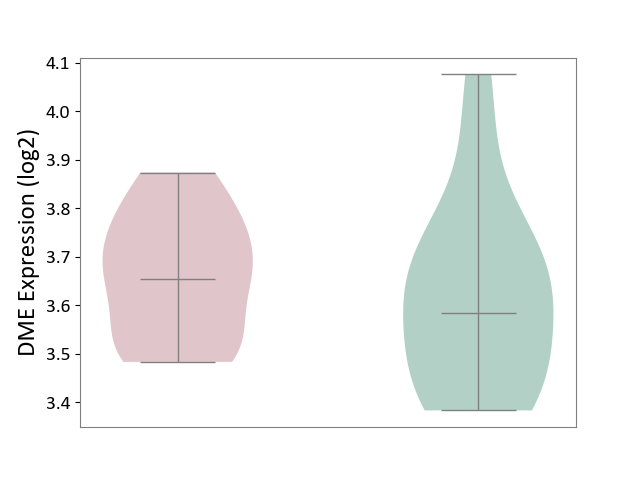
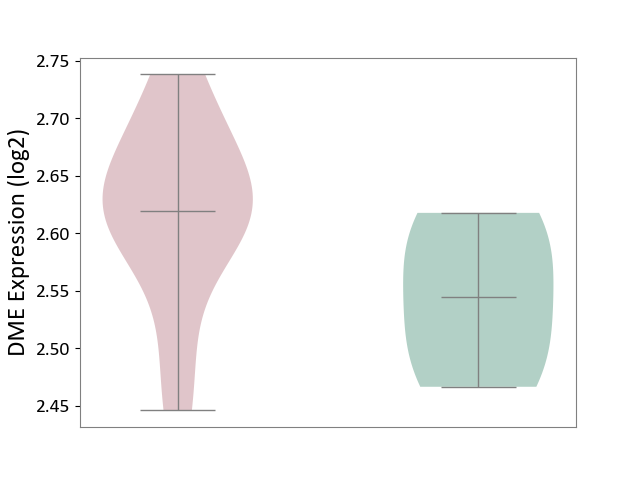
| ICD-11: 1E51 | Chronic viral hepatitis | Click to Show/Hide | |||
| The Studied Tissue | Whole blood | ||||
| The Specified Disease | Chronic hepatitis C [ICD-11:1E51.1] | ||||
| The Expression Level of Disease Section Compare with the Healthy Individual Tissue | p-value: 2.25E-01; Fold-change: -7.20E-02; Z-score: -3.91E-01 | ||||
|
DME expression in the diseased tissue of patients
DME expression in the normal tissue of healthy individuals
|
|||||
| Violin Diagram of DME Disease-specific Protein Abundances |
|
Click to View the Clearer Original Diagram | |||
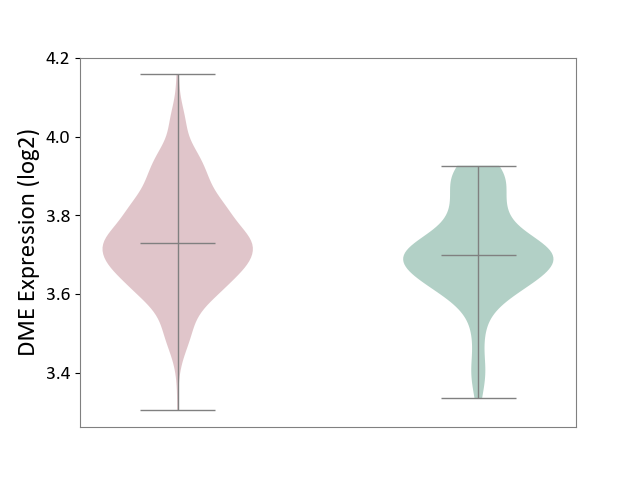
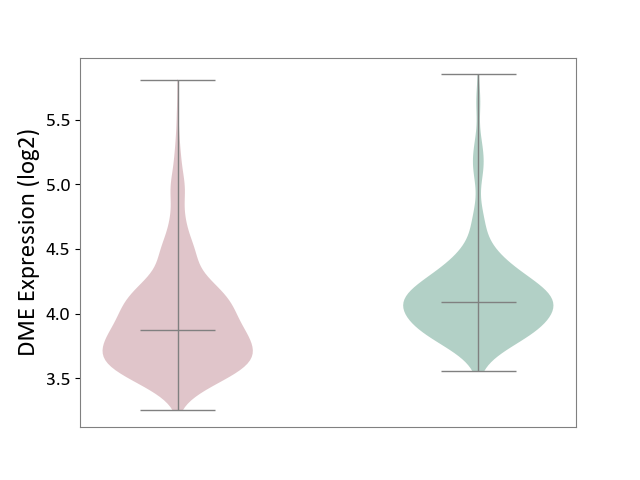
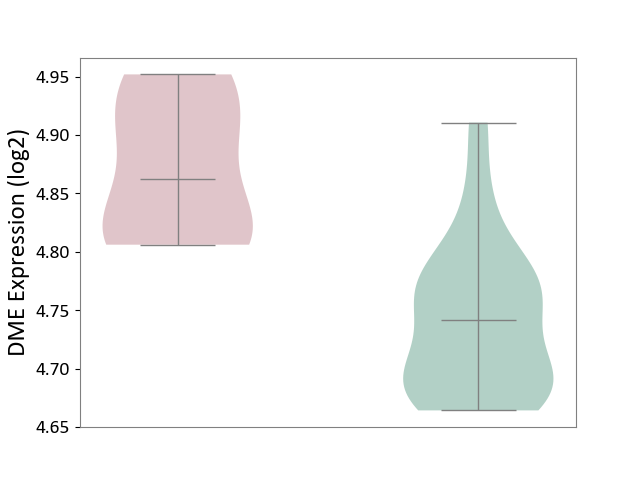
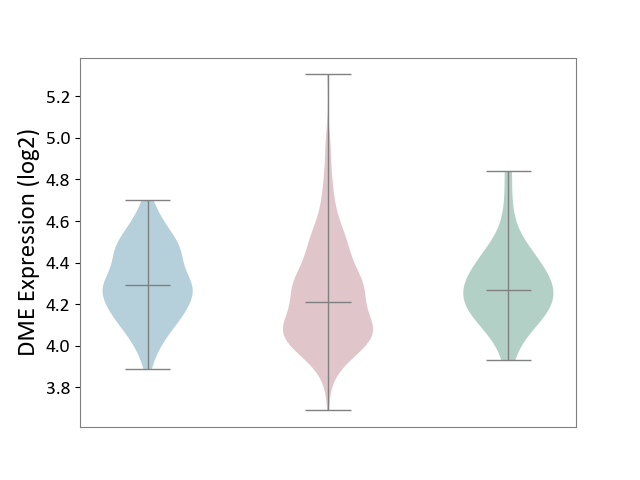
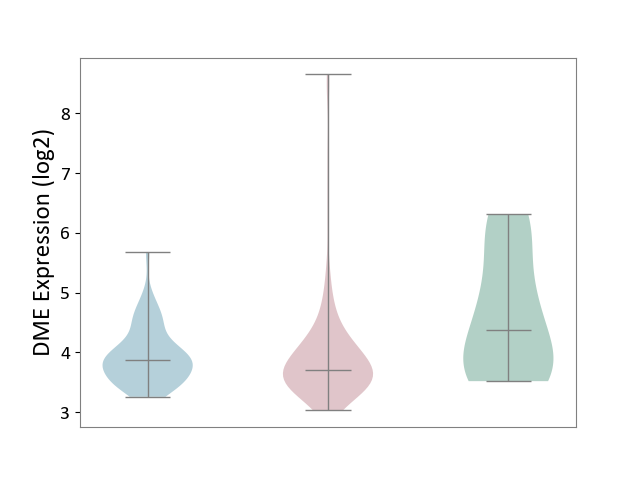
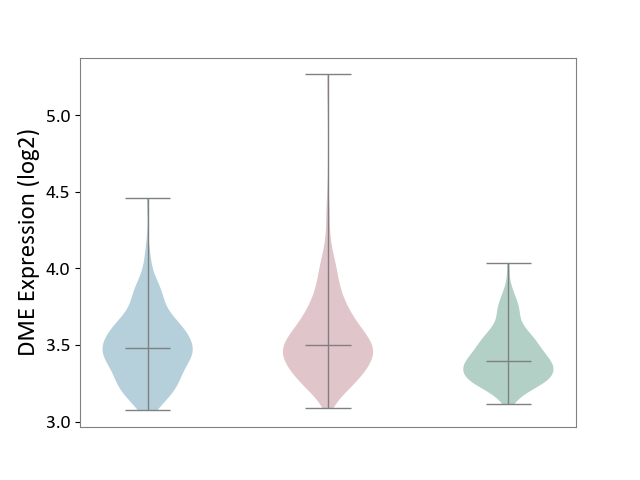
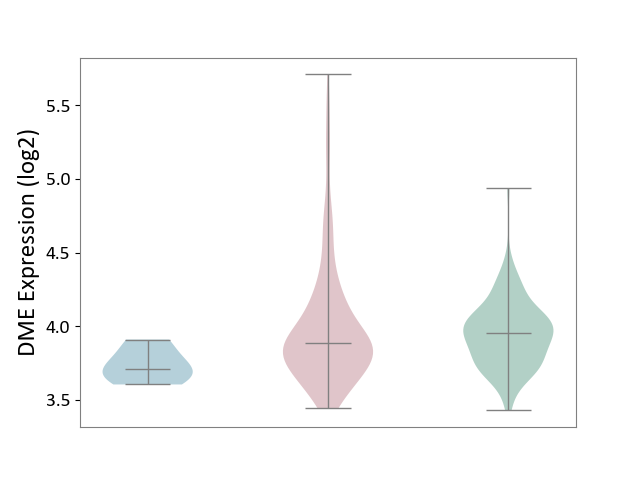
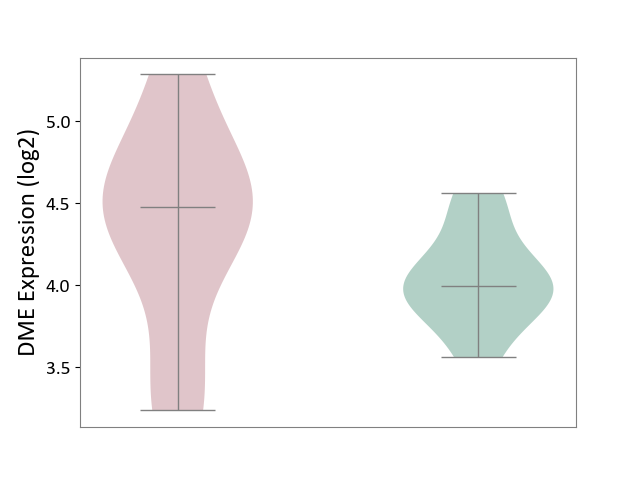
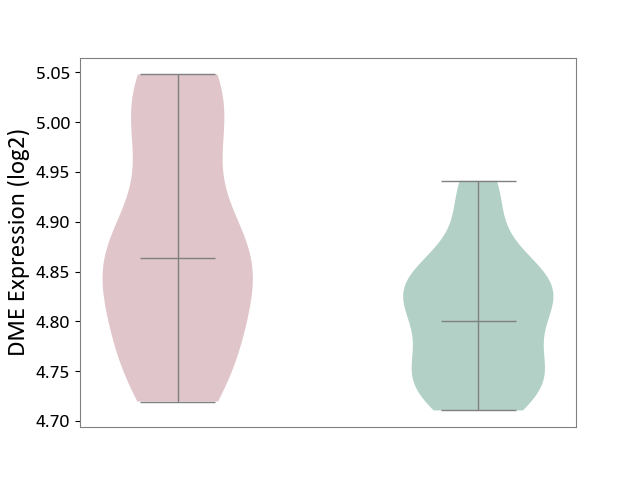
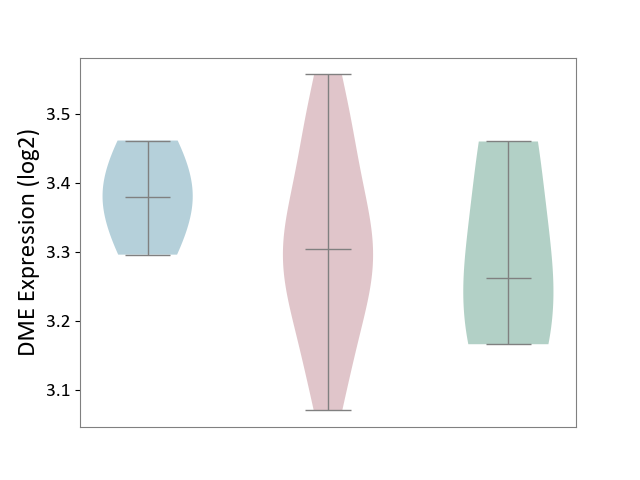
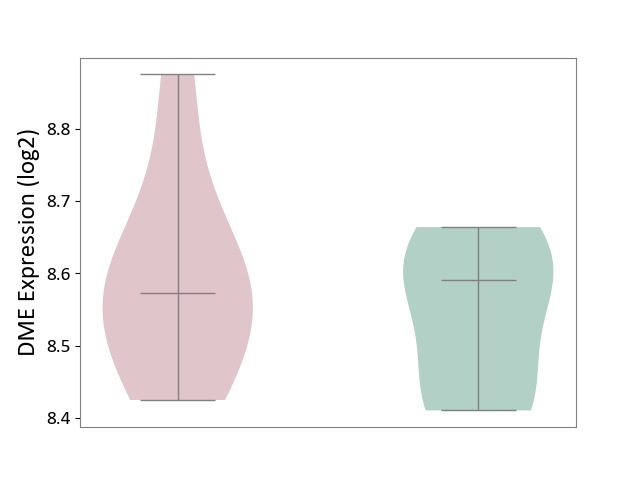
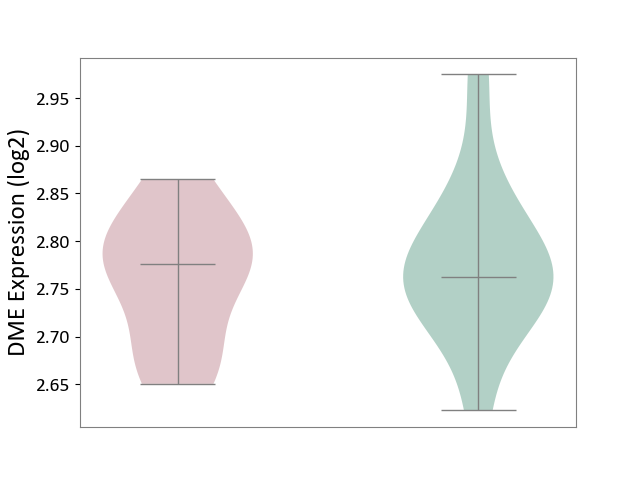
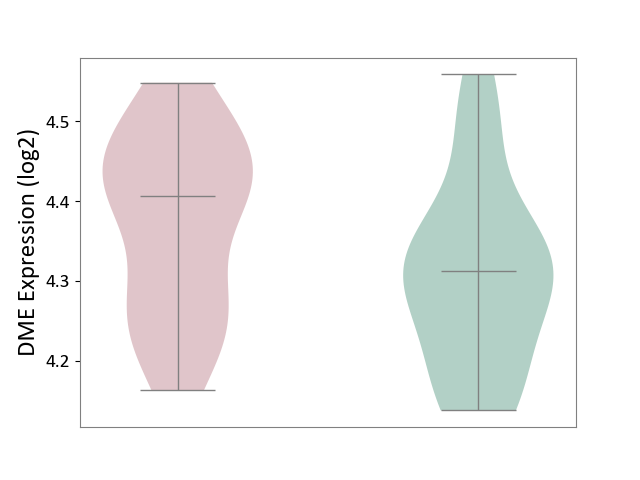
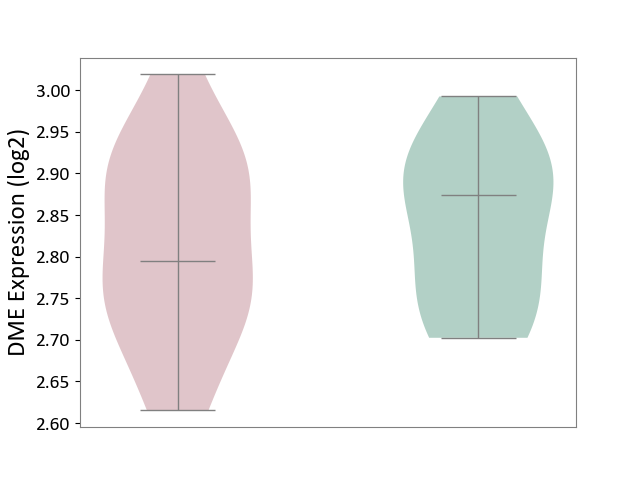
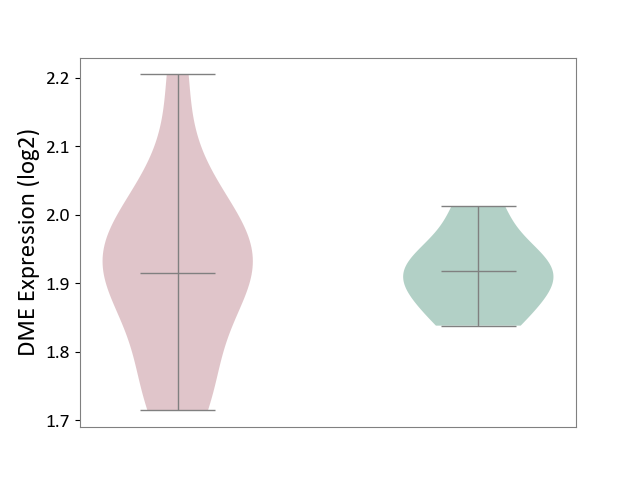
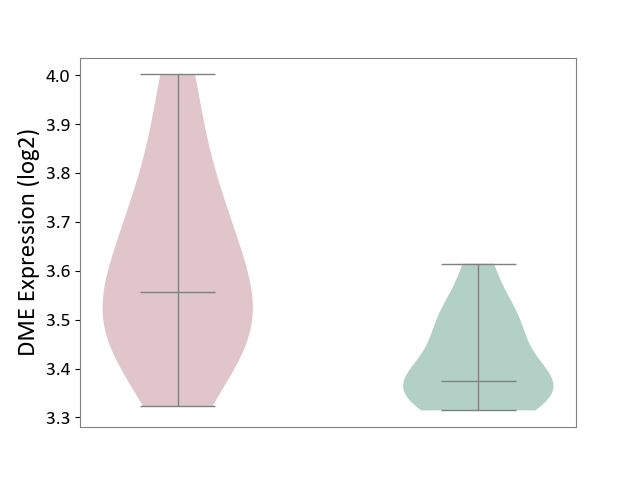
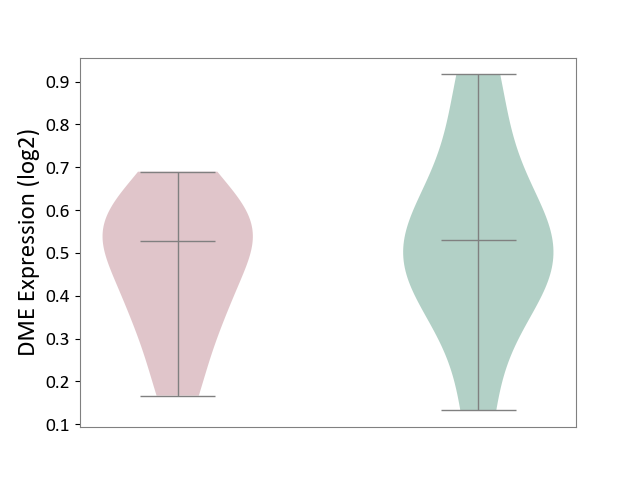
| ICD-11: 1G41 | Sepsis with septic shock | Click to Show/Hide | |||
| The Studied Tissue | Whole blood | ||||
| The Specified Disease | Sepsis with septic shock [ICD-11:1G41] | ||||
| The Expression Level of Disease Section Compare with the Healthy Individual Tissue | p-value: 4.18E-03; Fold-change: 3.05E-02; Z-score: 2.48E-01 | ||||
|
DME expression in the diseased tissue of patients
DME expression in the normal tissue of healthy individuals
|
|||||
| Violin Diagram of DME Disease-specific Protein Abundances |
|
Click to View the Clearer Original Diagram | |||
| ICD-11: CA40 | Respiratory syncytial virus infection | Click to Show/Hide | |||
| The Studied Tissue | Peripheral blood | ||||
| The Specified Disease | Pediatric respiratory syncytial virus infection [ICD-11:CA40.11] | ||||
| The Expression Level of Disease Section Compare with the Healthy Individual Tissue | p-value: 8.81E-01; Fold-change: -2.18E-02; Z-score: -1.84E-01 | ||||
|
DME expression in the diseased tissue of patients
DME expression in the normal tissue of healthy individuals
|
|||||
| Violin Diagram of DME Disease-specific Protein Abundances |
|
Click to View the Clearer Original Diagram | |||
| ICD-11: CA42 | Rhinovirus infection | Click to Show/Hide | |||
| The Studied Tissue | Nasal epithelium tissue | ||||
| The Specified Disease | Rhinovirus infection [ICD-11:CA42.1] | ||||
| The Expression Level of Disease Section Compare with the Healthy Individual Tissue | p-value: 2.43E-01; Fold-change: -6.22E-02; Z-score: -3.13E-01 | ||||
|
DME expression in the diseased tissue of patients
DME expression in the normal tissue of healthy individuals
|
|||||
| Violin Diagram of DME Disease-specific Protein Abundances |
|
Click to View the Clearer Original Diagram | |||
| ICD-11: KA60 | Neonatal sepsis | Click to Show/Hide | |||
| The Studied Tissue | Whole blood | ||||
| The Specified Disease | Neonatal sepsis [ICD-11:KA60] | ||||
| The Expression Level of Disease Section Compare with the Healthy Individual Tissue | p-value: 1.36E-02; Fold-change: -1.84E-02; Z-score: -1.77E-01 | ||||
|
DME expression in the diseased tissue of patients
DME expression in the normal tissue of healthy individuals
|
|||||
| Violin Diagram of DME Disease-specific Protein Abundances |
|
Click to View the Clearer Original Diagram | |||
| ICD Disease Classification 02 | Neoplasm | Click to Show/Hide | |||
| ICD-11: 2A00 | Brain cancer | Click to Show/Hide | |||
| The Studied Tissue | Nervous tissue | ||||
| The Specified Disease | Glioblastopma [ICD-11:2A00.00] | ||||
| The Expression Level of Disease Section Compare with the Healthy Individual Tissue | p-value: 9.91E-19; Fold-change: -2.17E-01; Z-score: -5.99E-01 | ||||
|
DME expression in the diseased tissue of patients
DME expression in the normal tissue of healthy individuals
|
|||||
| Violin Diagram of DME Disease-specific Protein Abundances |
|
Click to View the Clearer Original Diagram | |||
| The Studied Tissue | Brain stem tissue | ||||
| The Specified Disease | Glioma [ICD-11:2A00.0Y-2A00.0Z] | ||||
| The Expression Level of Disease Section Compare with the Healthy Individual Tissue | p-value: 6.52E-01; Fold-change: -3.60E-01; Z-score: -6.10E-01 | ||||
|
DME expression in the diseased tissue of patients
DME expression in the normal tissue of healthy individuals
|
|||||
| Violin Diagram of DME Disease-specific Protein Abundances |
|
Click to View the Clearer Original Diagram | |||
| The Studied Tissue | White matter tissue | ||||
| The Specified Disease | Glioma [ICD-11:2A00.0Y-2A00.0Z] | ||||
| The Expression Level of Disease Section Compare with the Healthy Individual Tissue | p-value: 2.60E-01; Fold-change: -3.65E-02; Z-score: -2.54E-01 | ||||
|
DME expression in the diseased tissue of patients
DME expression in the normal tissue of healthy individuals
|
|||||
| Violin Diagram of DME Disease-specific Protein Abundances |
|
Click to View the Clearer Original Diagram | |||
| The Studied Tissue | Brain stem tissue | ||||
| The Specified Disease | Neuroectodermal tumour [ICD-11:2A00.11] | ||||
| The Expression Level of Disease Section Compare with the Healthy Individual Tissue | p-value: 6.68E-01; Fold-change: -1.36E-01; Z-score: -8.23E-01 | ||||
|
DME expression in the diseased tissue of patients
DME expression in the normal tissue of healthy individuals
|
|||||
| Violin Diagram of DME Disease-specific Protein Abundances |
|
Click to View the Clearer Original Diagram | |||
| ICD-11: 2A20 | Myeloproliferative neoplasm | Click to Show/Hide | |||
| The Studied Tissue | Whole blood | ||||
| The Specified Disease | Myelofibrosis [ICD-11:2A20.2] | ||||
| The Expression Level of Disease Section Compare with the Healthy Individual Tissue | p-value: 3.34E-04; Fold-change: 1.21E-01; Z-score: 1.86E+00 | ||||
|
DME expression in the diseased tissue of patients
DME expression in the normal tissue of healthy individuals
|
|||||
| Violin Diagram of DME Disease-specific Protein Abundances |
|
Click to View the Clearer Original Diagram | |||
| The Studied Tissue | Whole blood | ||||
| The Specified Disease | Polycythemia vera [ICD-11:2A20.4] | ||||
| The Expression Level of Disease Section Compare with the Healthy Individual Tissue | p-value: 3.82E-10; Fold-change: 8.78E-02; Z-score: 1.41E+00 | ||||
|
DME expression in the diseased tissue of patients
DME expression in the normal tissue of healthy individuals
|
|||||
| Violin Diagram of DME Disease-specific Protein Abundances |
|
Click to View the Clearer Original Diagram | |||
| ICD-11: 2A36 | Myelodysplastic syndrome | Click to Show/Hide | |||
| The Studied Tissue | Bone marrow | ||||
| The Specified Disease | Myelodysplastic syndrome [ICD-11:2A36-2A3Z] | ||||
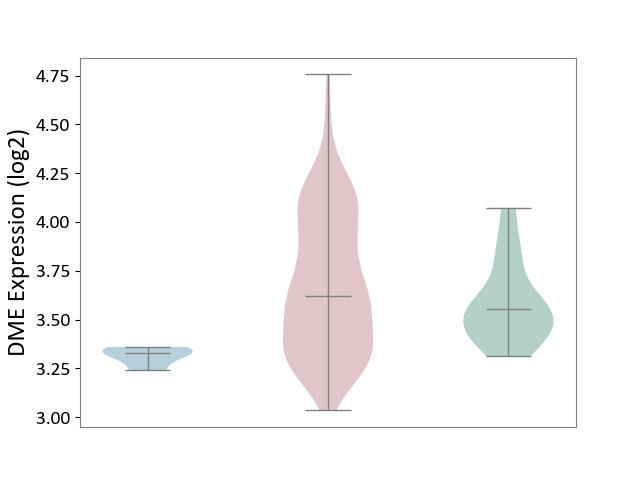
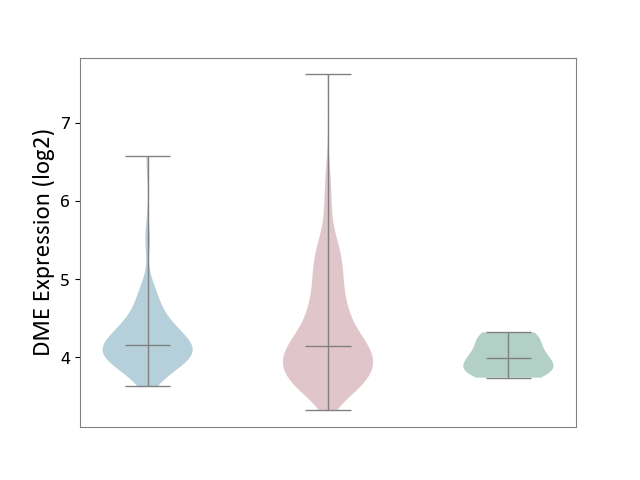
| The Expression Level of Disease Section Compare with the Healthy Individual Tissue | p-value: 3.53E-02; Fold-change: 6.59E-02; Z-score: 3.19E-01 | ||||
| The Expression Level of Disease Section Compare with the Adjacent Tissue | p-value: 3.59E-06; Fold-change: 2.91E-01; Z-score: 5.64E+00 | ||||
|
DME expression in the diseased tissue of patients
DME expression in the normal tissue adjacent to the diseased tissue of patients
DME expression in the normal tissue of healthy individuals
|
|||||
| Violin Diagram of DME Disease-specific Protein Abundances |
|
Click to View the Clearer Original Diagram | |||
| ICD-11: 2A81 | Diffuse large B-cell lymphoma | Click to Show/Hide | |||
| The Studied Tissue | Tonsil tissue | ||||
| The Specified Disease | Diffuse large B-cell lymphoma [ICD-11:2A81] | ||||
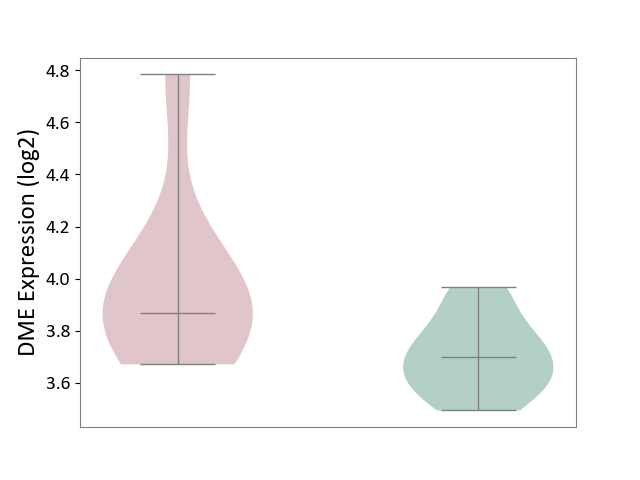
| The Expression Level of Disease Section Compare with the Healthy Individual Tissue | p-value: 6.40E-02; Fold-change: 1.71E-01; Z-score: 1.15E+00 | ||||
|
DME expression in the diseased tissue of patients
DME expression in the normal tissue of healthy individuals
|
|||||
| Violin Diagram of DME Disease-specific Protein Abundances |
|
Click to View the Clearer Original Diagram | |||
| ICD-11: 2A83 | Plasma cell neoplasm | Click to Show/Hide | |||
| The Studied Tissue | Peripheral blood | ||||
| The Specified Disease | Multiple myeloma [ICD-11:2A83.1] | ||||
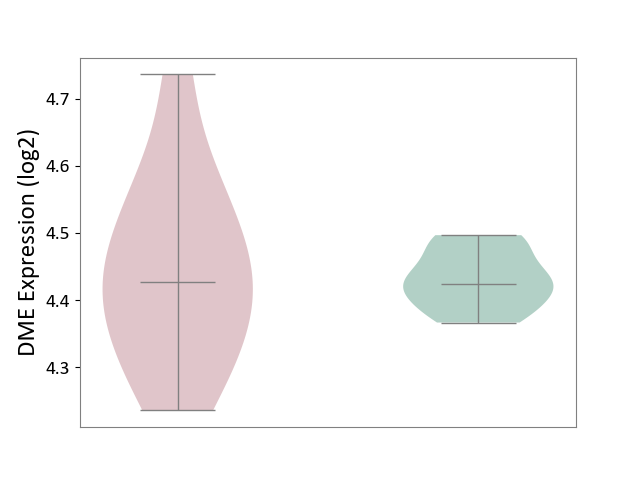
| The Expression Level of Disease Section Compare with the Healthy Individual Tissue | p-value: 7.83E-01; Fold-change: 2.87E-03; Z-score: 6.52E-02 | ||||
|
DME expression in the diseased tissue of patients
DME expression in the normal tissue of healthy individuals
|
|||||
| Violin Diagram of DME Disease-specific Protein Abundances |
|
Click to View the Clearer Original Diagram | |||
| The Studied Tissue | Bone marrow | ||||
| The Specified Disease | Multiple myeloma [ICD-11:2A83.1] | ||||
| The Expression Level of Disease Section Compare with the Healthy Individual Tissue | p-value: 5.86E-02; Fold-change: -1.69E-01; Z-score: -8.79E-01 | ||||
|
DME expression in the diseased tissue of patients
DME expression in the normal tissue of healthy individuals
|
|||||
| Violin Diagram of DME Disease-specific Protein Abundances |
|
Click to View the Clearer Original Diagram | |||
| ICD-11: 2B33 | Leukaemia | Click to Show/Hide | |||
| The Studied Tissue | Bone marrow | ||||
| The Specified Disease | Acute myelocytic leukaemia [ICD-11:2B33.1] | ||||
| The Expression Level of Disease Section Compare with the Healthy Individual Tissue | p-value: 6.69E-07; Fold-change: 4.42E-03; Z-score: 4.31E-02 | ||||
|
DME expression in the diseased tissue of patients
DME expression in the normal tissue of healthy individuals
|
|||||
| Violin Diagram of DME Disease-specific Protein Abundances |
|
Click to View the Clearer Original Diagram | |||
| ICD-11: 2B6E | Oral cancer | Click to Show/Hide | |||
| The Studied Tissue | Oral tissue | ||||
| The Specified Disease | Oral cancer [ICD-11:2B6E] | ||||
| The Expression Level of Disease Section Compare with the Healthy Individual Tissue | p-value: 2.73E-01; Fold-change: -6.13E-02; Z-score: -3.28E-01 | ||||
| The Expression Level of Disease Section Compare with the Adjacent Tissue | p-value: 2.74E-02; Fold-change: -8.48E-02; Z-score: -4.78E-01 | ||||
|
DME expression in the diseased tissue of patients
DME expression in the normal tissue adjacent to the diseased tissue of patients
DME expression in the normal tissue of healthy individuals
|
|||||
| Violin Diagram of DME Disease-specific Protein Abundances |
|
Click to View the Clearer Original Diagram | |||
| ICD-11: 2B70 | Esophageal cancer | Click to Show/Hide | |||
| The Studied Tissue | Esophagus | ||||
| The Specified Disease | Esophagal cancer [ICD-11:2B70] | ||||
| The Expression Level of Disease Section Compare with the Adjacent Tissue | p-value: 6.83E-03; Fold-change: 1.17E-01; Z-score: 1.21E+00 | ||||
|
DME expression in the diseased tissue of patients
DME expression in the normal tissue adjacent to the diseased tissue of patients
|
|||||
| Violin Diagram of DME Disease-specific Protein Abundances |
|
Click to View the Clearer Original Diagram | |||
| ICD-11: 2B72 | Stomach cancer | Click to Show/Hide | |||
| The Studied Tissue | Gastric tissue | ||||
| The Specified Disease | Gastric cancer [ICD-11:2B72] | ||||
| The Expression Level of Disease Section Compare with the Healthy Individual Tissue | p-value: 2.23E-01; Fold-change: -1.33E+00; Z-score: -1.24E+00 | ||||
| The Expression Level of Disease Section Compare with the Adjacent Tissue | p-value: 1.43E-03; Fold-change: -7.19E-01; Z-score: -8.16E-01 | ||||
|
DME expression in the diseased tissue of patients
DME expression in the normal tissue adjacent to the diseased tissue of patients
DME expression in the normal tissue of healthy individuals
|
|||||
| Violin Diagram of DME Disease-specific Protein Abundances |
|
Click to View the Clearer Original Diagram | |||
| ICD-11: 2B90 | Colon cancer | Click to Show/Hide | |||
| The Studied Tissue | Colon tissue | ||||
| The Specified Disease | Colon cancer [ICD-11:2B90] | ||||
| The Expression Level of Disease Section Compare with the Healthy Individual Tissue | p-value: 2.66E-04; Fold-change: -1.21E-01; Z-score: -5.72E-01 | ||||
| The Expression Level of Disease Section Compare with the Adjacent Tissue | p-value: 1.45E-07; Fold-change: -1.57E-01; Z-score: -5.24E-01 | ||||
|
DME expression in the diseased tissue of patients
DME expression in the normal tissue adjacent to the diseased tissue of patients
DME expression in the normal tissue of healthy individuals
|
|||||
| Violin Diagram of DME Disease-specific Protein Abundances |
|
Click to View the Clearer Original Diagram | |||
| ICD-11: 2B92 | Rectal cancer | Click to Show/Hide | |||
| The Studied Tissue | Rectal colon tissue | ||||
| The Specified Disease | Rectal cancer [ICD-11:2B92] | ||||
| The Expression Level of Disease Section Compare with the Healthy Individual Tissue | p-value: 1.51E-01; Fold-change: -1.41E-01; Z-score: -8.46E-01 | ||||
| The Expression Level of Disease Section Compare with the Adjacent Tissue | p-value: 2.66E-01; Fold-change: -8.50E-02; Z-score: -8.23E-01 | ||||
|
DME expression in the diseased tissue of patients
DME expression in the normal tissue adjacent to the diseased tissue of patients
DME expression in the normal tissue of healthy individuals
|
|||||
| Violin Diagram of DME Disease-specific Protein Abundances |
|
Click to View the Clearer Original Diagram | |||
| ICD-11: 2C10 | Pancreatic cancer | Click to Show/Hide | |||
| The Studied Tissue | Pancreas | ||||
| The Specified Disease | Pancreatic cancer [ICD-11:2C10] | ||||
| The Expression Level of Disease Section Compare with the Healthy Individual Tissue | p-value: 2.25E-02; Fold-change: -6.67E-01; Z-score: -6.53E-01 | ||||
| The Expression Level of Disease Section Compare with the Adjacent Tissue | p-value: 9.33E-01; Fold-change: -1.58E-01; Z-score: -3.31E-01 | ||||
|
DME expression in the diseased tissue of patients
DME expression in the normal tissue adjacent to the diseased tissue of patients
DME expression in the normal tissue of healthy individuals
|
|||||
| Violin Diagram of DME Disease-specific Protein Abundances |
|
Click to View the Clearer Original Diagram | |||
| ICD-11: 2C12 | Liver cancer | Click to Show/Hide | |||
| The Studied Tissue | Liver tissue | ||||
| The Specified Disease | Liver cancer [ICD-11:2C12.0] | ||||
| The Expression Level of Disease Section Compare with the Healthy Individual Tissue | p-value: 1.82E-30; Fold-change: -1.89E+00; Z-score: -2.75E+00 | ||||
| The Expression Level of Disease Section Compare with the Adjacent Tissue | p-value: 2.74E-83; Fold-change: -1.59E+00; Z-score: -4.32E+00 | ||||
| The Expression Level of Disease Section Compare with the Other Disease Section | p-value: 7.56E-05; Fold-change: -1.92E+00; Z-score: -5.89E+00 | ||||
|
DME expression in the diseased tissue of patients
DME expression in the normal tissue adjacent to the diseased tissue of patients
DME expression in the normal tissue of healthy individuals
DME expression in tissue other than the diseased tissue of patients
|
|||||
| Violin Diagram of DME Disease-specific Protein Abundances |
|
Click to View the Clearer Original Diagram | |||
| ICD-11: 2C25 | Lung cancer | Click to Show/Hide | |||
| The Studied Tissue | Lung tissue | ||||
| The Specified Disease | Lung cancer [ICD-11:2C25] | ||||
| The Expression Level of Disease Section Compare with the Healthy Individual Tissue | p-value: 5.28E-05; Fold-change: 1.90E-02; Z-score: 1.09E-01 | ||||
| The Expression Level of Disease Section Compare with the Adjacent Tissue | p-value: 2.24E-01; Fold-change: -5.46E-02; Z-score: -2.97E-01 | ||||
|
DME expression in the diseased tissue of patients
DME expression in the normal tissue adjacent to the diseased tissue of patients
DME expression in the normal tissue of healthy individuals
|
|||||
| Violin Diagram of DME Disease-specific Protein Abundances |
|
Click to View the Clearer Original Diagram | |||
| ICD-11: 2C30 | Skin cancer | Click to Show/Hide | |||
| The Studied Tissue | Skin | ||||
| The Specified Disease | Melanoma [ICD-11:2C30] | ||||
| The Expression Level of Disease Section Compare with the Healthy Individual Tissue | p-value: 8.32E-01; Fold-change: -3.32E-02; Z-score: -1.47E-01 | ||||
|
DME expression in the diseased tissue of patients
DME expression in the normal tissue of healthy individuals
|
|||||
| Violin Diagram of DME Disease-specific Protein Abundances |
|
Click to View the Clearer Original Diagram | |||
| The Studied Tissue | Skin | ||||
| The Specified Disease | Skin cancer [ICD-11:2C30-2C3Z] | ||||
| The Expression Level of Disease Section Compare with the Healthy Individual Tissue | p-value: 1.07E-10; Fold-change: 1.05E-01; Z-score: 5.98E-01 | ||||
| The Expression Level of Disease Section Compare with the Adjacent Tissue | p-value: 5.67E-03; Fold-change: 1.92E-02; Z-score: 8.28E-02 | ||||
|
DME expression in the diseased tissue of patients
DME expression in the normal tissue adjacent to the diseased tissue of patients
DME expression in the normal tissue of healthy individuals
|
|||||
| Violin Diagram of DME Disease-specific Protein Abundances |
|
Click to View the Clearer Original Diagram | |||
| ICD-11: 2C6Z | Breast cancer | Click to Show/Hide | |||
| The Studied Tissue | Breast tissue | ||||
| The Specified Disease | Breast cancer [ICD-11:2C60-2C6Z] | ||||
| The Expression Level of Disease Section Compare with the Healthy Individual Tissue | p-value: 5.08E-07; Fold-change: -1.25E-02; Z-score: -6.37E-02 | ||||
| The Expression Level of Disease Section Compare with the Adjacent Tissue | p-value: 9.76E-01; Fold-change: -5.07E-02; Z-score: -1.54E-01 | ||||
|
DME expression in the diseased tissue of patients
DME expression in the normal tissue adjacent to the diseased tissue of patients
DME expression in the normal tissue of healthy individuals
|
|||||
| Violin Diagram of DME Disease-specific Protein Abundances |
|
Click to View the Clearer Original Diagram | |||
| ICD-11: 2C73 | Ovarian cancer | Click to Show/Hide | |||
| The Studied Tissue | Ovarian tissue | ||||
| The Specified Disease | Ovarian cancer [ICD-11:2C73] | ||||
| The Expression Level of Disease Section Compare with the Healthy Individual Tissue | p-value: 1.13E-01; Fold-change: 6.17E-02; Z-score: 2.28E-01 | ||||
| The Expression Level of Disease Section Compare with the Adjacent Tissue | p-value: 6.12E-01; Fold-change: -4.38E-02; Z-score: -6.03E-02 | ||||
|
DME expression in the diseased tissue of patients
DME expression in the normal tissue adjacent to the diseased tissue of patients
DME expression in the normal tissue of healthy individuals
|
|||||
| Violin Diagram of DME Disease-specific Protein Abundances |
|
Click to View the Clearer Original Diagram | |||
| ICD-11: 2C77 | Cervical cancer | Click to Show/Hide | |||
| The Studied Tissue | Cervical tissue | ||||
| The Specified Disease | Cervical cancer [ICD-11:2C77] | ||||
| The Expression Level of Disease Section Compare with the Healthy Individual Tissue | p-value: 6.86E-01; Fold-change: -5.49E-02; Z-score: -2.79E-01 | ||||
|
DME expression in the diseased tissue of patients
DME expression in the normal tissue of healthy individuals
|
|||||
| Violin Diagram of DME Disease-specific Protein Abundances |
|
Click to View the Clearer Original Diagram | |||
| ICD-11: 2C78 | Uterine cancer | Click to Show/Hide | |||
| The Studied Tissue | Endometrium tissue | ||||
| The Specified Disease | Uterine cancer [ICD-11:2C78] | ||||
| The Expression Level of Disease Section Compare with the Healthy Individual Tissue | p-value: 2.03E-01; Fold-change: -6.96E-02; Z-score: -3.05E-01 | ||||
| The Expression Level of Disease Section Compare with the Adjacent Tissue | p-value: 5.90E-03; Fold-change: 1.77E-01; Z-score: 1.49E+00 | ||||
|
DME expression in the diseased tissue of patients
DME expression in the normal tissue adjacent to the diseased tissue of patients
DME expression in the normal tissue of healthy individuals
|
|||||
| Violin Diagram of DME Disease-specific Protein Abundances |
|
Click to View the Clearer Original Diagram | |||
| ICD-11: 2C82 | Prostate cancer | Click to Show/Hide | |||
| The Studied Tissue | Prostate | ||||
| The Specified Disease | Prostate cancer [ICD-11:2C82] | ||||
| The Expression Level of Disease Section Compare with the Healthy Individual Tissue | p-value: 5.27E-01; Fold-change: -1.74E-02; Z-score: -6.97E-02 | ||||
|
DME expression in the diseased tissue of patients
DME expression in the normal tissue of healthy individuals
|
|||||
| Violin Diagram of DME Disease-specific Protein Abundances |
|
Click to View the Clearer Original Diagram | |||
| ICD-11: 2C90 | Renal cancer | Click to Show/Hide | |||
| The Studied Tissue | Kidney | ||||
| The Specified Disease | Renal cancer [ICD-11:2C90-2C91] | ||||
| The Expression Level of Disease Section Compare with the Healthy Individual Tissue | p-value: 1.73E-04; Fold-change: 1.53E-01; Z-score: 7.44E-01 | ||||
| The Expression Level of Disease Section Compare with the Adjacent Tissue | p-value: 1.82E-01; Fold-change: -7.17E-03; Z-score: -1.58E-02 | ||||
|
DME expression in the diseased tissue of patients
DME expression in the normal tissue adjacent to the diseased tissue of patients
DME expression in the normal tissue of healthy individuals
|
|||||
| Violin Diagram of DME Disease-specific Protein Abundances |
|
Click to View the Clearer Original Diagram | |||
| ICD-11: 2C92 | Ureter cancer | Click to Show/Hide | |||
| The Studied Tissue | Urothelium | ||||
| The Specified Disease | Ureter cancer [ICD-11:2C92] | ||||
| The Expression Level of Disease Section Compare with the Healthy Individual Tissue | p-value: 5.65E-01; Fold-change: 2.72E-02; Z-score: 2.78E-01 | ||||
|
DME expression in the diseased tissue of patients
DME expression in the normal tissue of healthy individuals
|
|||||
| Violin Diagram of DME Disease-specific Protein Abundances |
|
Click to View the Clearer Original Diagram | |||
| ICD-11: 2C94 | Bladder cancer | Click to Show/Hide | |||
| The Studied Tissue | Bladder tissue | ||||
| The Specified Disease | Bladder cancer [ICD-11:2C94] | ||||
| The Expression Level of Disease Section Compare with the Healthy Individual Tissue | p-value: 7.15E-03; Fold-change: 1.83E-01; Z-score: 9.23E-01 | ||||
|
DME expression in the diseased tissue of patients
DME expression in the normal tissue of healthy individuals
|
|||||
| Violin Diagram of DME Disease-specific Protein Abundances |
|
Click to View the Clearer Original Diagram | |||
| ICD-11: 2D02 | Retinal cancer | Click to Show/Hide | |||
| The Studied Tissue | Uvea | ||||
| The Specified Disease | Retinoblastoma [ICD-11:2D02.2] | ||||
| The Expression Level of Disease Section Compare with the Healthy Individual Tissue | p-value: 3.09E-09; Fold-change: -1.53E+00; Z-score: -4.40E+00 | ||||
|
DME expression in the diseased tissue of patients
DME expression in the normal tissue of healthy individuals
|
|||||
| Violin Diagram of DME Disease-specific Protein Abundances |

|
Click to View the Clearer Original Diagram | |||
| ICD-11: 2D10 | Thyroid cancer | Click to Show/Hide | |||
| The Studied Tissue | Thyroid | ||||
| The Specified Disease | Thyroid cancer [ICD-11:2D10] | ||||
| The Expression Level of Disease Section Compare with the Healthy Individual Tissue | p-value: 6.39E-01; Fold-change: -5.46E-02; Z-score: -2.77E-01 | ||||
| The Expression Level of Disease Section Compare with the Adjacent Tissue | p-value: 5.07E-01; Fold-change: -4.30E-02; Z-score: -2.18E-01 | ||||
|
DME expression in the diseased tissue of patients
DME expression in the normal tissue adjacent to the diseased tissue of patients
DME expression in the normal tissue of healthy individuals
|
|||||
| Violin Diagram of DME Disease-specific Protein Abundances |
|
Click to View the Clearer Original Diagram | |||
| ICD-11: 2D11 | Adrenal cancer | Click to Show/Hide | |||
| The Studied Tissue | Adrenal cortex | ||||
| The Specified Disease | Adrenocortical carcinoma [ICD-11:2D11.Z] | ||||
| The Expression Level of Disease Section Compare with the Other Disease Section | p-value: 5.93E-01; Fold-change: -1.06E-02; Z-score: -2.70E-02 | ||||
|
DME expression in the diseased tissue of patients
DME expression in tissue other than the diseased tissue of patients
|
|||||
| Violin Diagram of DME Disease-specific Protein Abundances |
|
Click to View the Clearer Original Diagram | |||
| ICD-11: 2D12 | Endocrine gland neoplasm | Click to Show/Hide | |||
| The Studied Tissue | Pituitary tissue | ||||
| The Specified Disease | Pituitary cancer [ICD-11:2D12] | ||||
| The Expression Level of Disease Section Compare with the Healthy Individual Tissue | p-value: 6.90E-01; Fold-change: -1.23E-01; Z-score: -4.33E-01 | ||||
|
DME expression in the diseased tissue of patients
DME expression in the normal tissue of healthy individuals
|
|||||
| Violin Diagram of DME Disease-specific Protein Abundances |
|
Click to View the Clearer Original Diagram | |||
| The Studied Tissue | Pituitary tissue | ||||
| The Specified Disease | Pituitary gonadotrope tumour [ICD-11:2D12] | ||||
| The Expression Level of Disease Section Compare with the Healthy Individual Tissue | p-value: 1.39E-01; Fold-change: 4.85E-01; Z-score: 1.63E+00 | ||||
|
DME expression in the diseased tissue of patients
DME expression in the normal tissue of healthy individuals
|
|||||
| Violin Diagram of DME Disease-specific Protein Abundances |
|
Click to View the Clearer Original Diagram | |||
| ICD-11: 2D42 | Head and neck cancer | Click to Show/Hide | |||
| The Studied Tissue | Head and neck tissue | ||||
| The Specified Disease | Head and neck cancer [ICD-11:2D42] | ||||
| The Expression Level of Disease Section Compare with the Healthy Individual Tissue | p-value: 2.90E-11; Fold-change: -1.06E-01; Z-score: -1.42E-01 | ||||
|
DME expression in the diseased tissue of patients
DME expression in the normal tissue of healthy individuals
|
|||||
| Violin Diagram of DME Disease-specific Protein Abundances |
|
Click to View the Clearer Original Diagram | |||
| ICD Disease Classification 03 | Blood/blood-forming organ disease | Click to Show/Hide | |||
| ICD-11: 3A51 | Sickle cell disorder | Click to Show/Hide | |||
| The Studied Tissue | Peripheral blood | ||||
| The Specified Disease | Sickle cell disease [ICD-11:3A51.0-3A51.3] | ||||
| The Expression Level of Disease Section Compare with the Healthy Individual Tissue | p-value: 3.71E-02; Fold-change: 1.03E-01; Z-score: 7.57E-01 | ||||
|
DME expression in the diseased tissue of patients
DME expression in the normal tissue of healthy individuals
|
|||||
| Violin Diagram of DME Disease-specific Protein Abundances |
|
Click to View the Clearer Original Diagram | |||
| ICD-11: 3A70 | Aplastic anaemia | Click to Show/Hide | |||
| The Studied Tissue | Bone marrow | ||||
| The Specified Disease | Shwachman-Diamond syndrome [ICD-11:3A70.0] | ||||
| The Expression Level of Disease Section Compare with the Healthy Individual Tissue | p-value: 6.03E-01; Fold-change: 7.61E-02; Z-score: 6.10E-01 | ||||
|
DME expression in the diseased tissue of patients
DME expression in the normal tissue of healthy individuals
|
|||||
| Violin Diagram of DME Disease-specific Protein Abundances |
|
Click to View the Clearer Original Diagram | |||
| ICD-11: 3B63 | Thrombocytosis | Click to Show/Hide | |||
| The Studied Tissue | Whole blood | ||||
| The Specified Disease | Thrombocythemia [ICD-11:3B63] | ||||
| The Expression Level of Disease Section Compare with the Healthy Individual Tissue | p-value: 3.60E-03; Fold-change: 6.33E-02; Z-score: 9.75E-01 | ||||
|
DME expression in the diseased tissue of patients
DME expression in the normal tissue of healthy individuals
|
|||||
| Violin Diagram of DME Disease-specific Protein Abundances |
|
Click to View the Clearer Original Diagram | |||
| ICD-11: 3B64 | Thrombocytopenia | Click to Show/Hide | |||
| The Studied Tissue | Whole blood | ||||
| The Specified Disease | Thrombocytopenia [ICD-11:3B64] | ||||
| The Expression Level of Disease Section Compare with the Healthy Individual Tissue | p-value: 4.83E-01; Fold-change: 3.92E-02; Z-score: 2.84E-01 | ||||
|
DME expression in the diseased tissue of patients
DME expression in the normal tissue of healthy individuals
|
|||||
| Violin Diagram of DME Disease-specific Protein Abundances |

|
Click to View the Clearer Original Diagram | |||
| ICD Disease Classification 04 | Immune system disease | Click to Show/Hide | |||
| ICD-11: 4A00 | Immunodeficiency | Click to Show/Hide | |||
| The Studied Tissue | Peripheral blood | ||||
| The Specified Disease | Immunodeficiency [ICD-11:4A00-4A20] | ||||
| The Expression Level of Disease Section Compare with the Healthy Individual Tissue | p-value: 1.03E-01; Fold-change: 6.81E-03; Z-score: 7.23E-02 | ||||
|
DME expression in the diseased tissue of patients
DME expression in the normal tissue of healthy individuals
|
|||||
| Violin Diagram of DME Disease-specific Protein Abundances |
|
Click to View the Clearer Original Diagram | |||
| ICD-11: 4A40 | Lupus erythematosus | Click to Show/Hide | |||
| The Studied Tissue | Whole blood | ||||
| The Specified Disease | Lupus erythematosus [ICD-11:4A40] | ||||
| The Expression Level of Disease Section Compare with the Healthy Individual Tissue | p-value: 2.14E-01; Fold-change: -4.97E-02; Z-score: -1.73E-01 | ||||
|
DME expression in the diseased tissue of patients
DME expression in the normal tissue of healthy individuals
|
|||||
| Violin Diagram of DME Disease-specific Protein Abundances |
|
Click to View the Clearer Original Diagram | |||
| ICD-11: 4A42 | Systemic sclerosis | Click to Show/Hide | |||
| The Studied Tissue | Whole blood | ||||
| The Specified Disease | Scleroderma [ICD-11:4A42.Z] | ||||
| The Expression Level of Disease Section Compare with the Healthy Individual Tissue | p-value: 2.56E-01; Fold-change: 7.80E-03; Z-score: 9.30E-02 | ||||
|
DME expression in the diseased tissue of patients
DME expression in the normal tissue of healthy individuals
|
|||||
| Violin Diagram of DME Disease-specific Protein Abundances |
|
Click to View the Clearer Original Diagram | |||
| ICD-11: 4A43 | Systemic autoimmune disease | Click to Show/Hide | |||
| The Studied Tissue | Salivary gland tissue | ||||
| The Specified Disease | Sjogren's syndrome [ICD-11:4A43.2] | ||||
| The Expression Level of Disease Section Compare with the Healthy Individual Tissue | p-value: 8.93E-01; Fold-change: 4.14E-02; Z-score: 2.77E-01 | ||||
| The Expression Level of Disease Section Compare with the Adjacent Tissue | p-value: 1.67E-01; Fold-change: -7.56E-02; Z-score: -1.10E+00 | ||||
|
DME expression in the diseased tissue of patients
DME expression in the normal tissue adjacent to the diseased tissue of patients
DME expression in the normal tissue of healthy individuals
|
|||||
| Violin Diagram of DME Disease-specific Protein Abundances |
|
Click to View the Clearer Original Diagram | |||
| ICD-11: 4A62 | Behcet disease | Click to Show/Hide | |||
| The Studied Tissue | Peripheral blood | ||||
| The Specified Disease | Behcet's disease [ICD-11:4A62] | ||||
| The Expression Level of Disease Section Compare with the Healthy Individual Tissue | p-value: 2.73E-01; Fold-change: 4.16E-02; Z-score: 2.75E-01 | ||||
|
DME expression in the diseased tissue of patients
DME expression in the normal tissue of healthy individuals
|
|||||
| Violin Diagram of DME Disease-specific Protein Abundances |
|
Click to View the Clearer Original Diagram | |||
| ICD-11: 4B04 | Monocyte count disorder | Click to Show/Hide | |||
| The Studied Tissue | Whole blood | ||||
| The Specified Disease | Autosomal dominant monocytopenia [ICD-11:4B04] | ||||
| The Expression Level of Disease Section Compare with the Healthy Individual Tissue | p-value: 8.46E-01; Fold-change: 2.44E-02; Z-score: 2.39E-01 | ||||
|
DME expression in the diseased tissue of patients
DME expression in the normal tissue of healthy individuals
|
|||||
| Violin Diagram of DME Disease-specific Protein Abundances |
|
Click to View the Clearer Original Diagram | |||
| ICD Disease Classification 05 | Endocrine/nutritional/metabolic disease | Click to Show/Hide | |||
| ICD-11: 5A11 | Type 2 diabetes mellitus | Click to Show/Hide | |||
| The Studied Tissue | Omental adipose tissue | ||||
| The Specified Disease | Obesity related type 2 diabetes [ICD-11:5A11] | ||||
| The Expression Level of Disease Section Compare with the Healthy Individual Tissue | p-value: 7.09E-01; Fold-change: 4.31E-02; Z-score: 5.74E-01 | ||||
|
DME expression in the diseased tissue of patients
DME expression in the normal tissue of healthy individuals
|
|||||
| Violin Diagram of DME Disease-specific Protein Abundances |
|
Click to View the Clearer Original Diagram | |||
| The Studied Tissue | Liver tissue | ||||
| The Specified Disease | Type 2 diabetes [ICD-11:5A11] | ||||
| The Expression Level of Disease Section Compare with the Healthy Individual Tissue | p-value: 4.79E-01; Fold-change: -1.88E-02; Z-score: -1.73E-01 | ||||
|
DME expression in the diseased tissue of patients
DME expression in the normal tissue of healthy individuals
|
|||||
| Violin Diagram of DME Disease-specific Protein Abundances |
|
Click to View the Clearer Original Diagram | |||
| ICD-11: 5A80 | Ovarian dysfunction | Click to Show/Hide | |||
| The Studied Tissue | Vastus lateralis muscle | ||||
| The Specified Disease | Polycystic ovary syndrome [ICD-11:5A80.1] | ||||
| The Expression Level of Disease Section Compare with the Healthy Individual Tissue | p-value: 7.04E-01; Fold-change: -4.02E-03; Z-score: -2.88E-02 | ||||
|
DME expression in the diseased tissue of patients
DME expression in the normal tissue of healthy individuals
|
|||||
| Violin Diagram of DME Disease-specific Protein Abundances |
|
Click to View the Clearer Original Diagram | |||
| ICD-11: 5C51 | Inborn carbohydrate metabolism disorder | Click to Show/Hide | |||
| The Studied Tissue | Biceps muscle | ||||
| The Specified Disease | Pompe disease [ICD-11:5C51.3] | ||||
| The Expression Level of Disease Section Compare with the Healthy Individual Tissue | p-value: 3.45E-03; Fold-change: -9.40E-02; Z-score: -1.00E+00 | ||||
|
DME expression in the diseased tissue of patients
DME expression in the normal tissue of healthy individuals
|
|||||
| Violin Diagram of DME Disease-specific Protein Abundances |
|
Click to View the Clearer Original Diagram | |||
| ICD-11: 5C56 | Lysosomal disease | Click to Show/Hide | |||
| The Studied Tissue | Whole blood | ||||
| The Specified Disease | Batten disease [ICD-11:5C56.1] | ||||
| The Expression Level of Disease Section Compare with the Healthy Individual Tissue | p-value: 9.38E-01; Fold-change: 1.89E-02; Z-score: 1.52E-01 | ||||
|
DME expression in the diseased tissue of patients
DME expression in the normal tissue of healthy individuals
|
|||||
| Violin Diagram of DME Disease-specific Protein Abundances |
|
Click to View the Clearer Original Diagram | |||
| ICD-11: 5C80 | Hyperlipoproteinaemia | Click to Show/Hide | |||
| The Studied Tissue | Peripheral blood | ||||
| The Specified Disease | Familial hypercholesterolemia [ICD-11:5C80.00] | ||||
| The Expression Level of Disease Section Compare with the Healthy Individual Tissue | p-value: 6.28E-01; Fold-change: 1.37E-02; Z-score: 1.60E-01 | ||||
|
DME expression in the diseased tissue of patients
DME expression in the normal tissue of healthy individuals
|
|||||
| Violin Diagram of DME Disease-specific Protein Abundances |
|
Click to View the Clearer Original Diagram | |||
| The Studied Tissue | Whole blood | ||||
| The Specified Disease | Familial hypercholesterolemia [ICD-11:5C80.00] | ||||
| The Expression Level of Disease Section Compare with the Healthy Individual Tissue | p-value: 1.47E-02; Fold-change: -1.13E-01; Z-score: -1.13E+00 | ||||
|
DME expression in the diseased tissue of patients
DME expression in the normal tissue of healthy individuals
|
|||||
| Violin Diagram of DME Disease-specific Protein Abundances |
|
Click to View the Clearer Original Diagram | |||
| ICD Disease Classification 06 | Mental/behavioural/neurodevelopmental disorder | Click to Show/Hide | |||
| ICD-11: 6A02 | Autism spectrum disorder | Click to Show/Hide | |||
| The Studied Tissue | Whole blood | ||||
| The Specified Disease | Autism [ICD-11:6A02] | ||||
| The Expression Level of Disease Section Compare with the Healthy Individual Tissue | p-value: 8.53E-01; Fold-change: -3.07E-02; Z-score: -2.20E-01 | ||||
|
DME expression in the diseased tissue of patients
DME expression in the normal tissue of healthy individuals
|
|||||
| Violin Diagram of DME Disease-specific Protein Abundances |
|
Click to View the Clearer Original Diagram | |||
| ICD-11: 6A20 | Schizophrenia | Click to Show/Hide | |||
| The Studied Tissue | Prefrontal cortex | ||||
| The Specified Disease | Schizophrenia [ICD-11:6A20] | ||||
| The Expression Level of Disease Section Compare with the Healthy Individual Tissue | p-value: 1.94E-01; Fold-change: -1.03E-01; Z-score: -3.08E-01 | ||||
|
DME expression in the diseased tissue of patients
DME expression in the normal tissue of healthy individuals
|
|||||
| Violin Diagram of DME Disease-specific Protein Abundances |
|
Click to View the Clearer Original Diagram | |||
| The Studied Tissue | Superior temporal cortex | ||||
| The Specified Disease | Schizophrenia [ICD-11:6A20] | ||||
| The Expression Level of Disease Section Compare with the Healthy Individual Tissue | p-value: 7.37E-02; Fold-change: 9.49E-02; Z-score: 8.07E-01 | ||||
|
DME expression in the diseased tissue of patients
DME expression in the normal tissue of healthy individuals
|
|||||
| Violin Diagram of DME Disease-specific Protein Abundances |
|
Click to View the Clearer Original Diagram | |||
| ICD-11: 6A60 | Bipolar disorder | Click to Show/Hide | |||
| The Studied Tissue | Prefrontal cortex | ||||
| The Specified Disease | Bipolar disorder [ICD-11:6A60-6A6Z] | ||||
| The Expression Level of Disease Section Compare with the Healthy Individual Tissue | p-value: 3.07E-01; Fold-change: 3.97E-02; Z-score: 1.59E-01 | ||||
|
DME expression in the diseased tissue of patients
DME expression in the normal tissue of healthy individuals
|
|||||
| Violin Diagram of DME Disease-specific Protein Abundances |
|
Click to View the Clearer Original Diagram | |||
| ICD-11: 6A70 | Depressive disorder | Click to Show/Hide | |||
| The Studied Tissue | Whole blood | ||||
| The Specified Disease | Major depressive disorder [ICD-11:6A70-6A7Z] | ||||
| The Expression Level of Disease Section Compare with the Healthy Individual Tissue | p-value: 1.38E-01; Fold-change: -3.36E-04; Z-score: -2.09E-03 | ||||
|
DME expression in the diseased tissue of patients
DME expression in the normal tissue of healthy individuals
|
|||||
| Violin Diagram of DME Disease-specific Protein Abundances |
|
Click to View the Clearer Original Diagram | |||
| The Studied Tissue | Hippocampus | ||||
| The Specified Disease | Major depressive disorder [ICD-11:6A70-6A7Z] | ||||
| The Expression Level of Disease Section Compare with the Healthy Individual Tissue | p-value: 3.17E-01; Fold-change: -6.95E-02; Z-score: -2.88E-01 | ||||
|
DME expression in the diseased tissue of patients
DME expression in the normal tissue of healthy individuals
|
|||||
| Violin Diagram of DME Disease-specific Protein Abundances |
|
Click to View the Clearer Original Diagram | |||
| ICD Disease Classification 08 | Nervous system disease | Click to Show/Hide | |||
| ICD-11: 8A00 | Parkinsonism | Click to Show/Hide | |||
| The Studied Tissue | Substantia nigra tissue | ||||
| The Specified Disease | Parkinson's disease [ICD-11:8A00.0] | ||||
| The Expression Level of Disease Section Compare with the Healthy Individual Tissue | p-value: 5.57E-01; Fold-change: -7.89E-02; Z-score: -7.93E-01 | ||||
|
DME expression in the diseased tissue of patients
DME expression in the normal tissue of healthy individuals
|
|||||
| Violin Diagram of DME Disease-specific Protein Abundances |
|
Click to View the Clearer Original Diagram | |||
| ICD-11: 8A01 | Choreiform disorder | Click to Show/Hide | |||
| The Studied Tissue | Whole blood | ||||
| The Specified Disease | Huntington's disease [ICD-11:8A01.10] | ||||
| The Expression Level of Disease Section Compare with the Healthy Individual Tissue | p-value: 5.93E-01; Fold-change: 3.65E-03; Z-score: 3.43E-02 | ||||
|
DME expression in the diseased tissue of patients
DME expression in the normal tissue of healthy individuals
|
|||||
| Violin Diagram of DME Disease-specific Protein Abundances |
|
Click to View the Clearer Original Diagram | |||
| ICD-11: 8A20 | Alzheimer disease | Click to Show/Hide | |||
| The Studied Tissue | Entorhinal cortex | ||||
| The Specified Disease | Alzheimer's disease [ICD-11:8A20] | ||||
| The Expression Level of Disease Section Compare with the Healthy Individual Tissue | p-value: 1.82E-04; Fold-change: -1.35E-01; Z-score: -5.84E-01 | ||||
|
DME expression in the diseased tissue of patients
DME expression in the normal tissue of healthy individuals
|
|||||
| Violin Diagram of DME Disease-specific Protein Abundances |
|
Click to View the Clearer Original Diagram | |||
| ICD-11: 8A2Y | Neurocognitive impairment | Click to Show/Hide | |||
| The Studied Tissue | White matter tissue | ||||
| The Specified Disease | HIV-associated neurocognitive impairment [ICD-11:8A2Y-8A2Z] | ||||
| The Expression Level of Disease Section Compare with the Healthy Individual Tissue | p-value: 6.78E-01; Fold-change: 9.78E-03; Z-score: 5.42E-02 | ||||
|
DME expression in the diseased tissue of patients
DME expression in the normal tissue of healthy individuals
|
|||||
| Violin Diagram of DME Disease-specific Protein Abundances |
|
Click to View the Clearer Original Diagram | |||
| ICD-11: 8A40 | Multiple sclerosis | Click to Show/Hide | |||
| The Studied Tissue | Plasmacytoid dendritic cells | ||||
| The Specified Disease | Multiple sclerosis [ICD-11:8A40] | ||||
| The Expression Level of Disease Section Compare with the Healthy Individual Tissue | p-value: 9.78E-01; Fold-change: -3.38E-03; Z-score: -5.71E-02 | ||||
|
DME expression in the diseased tissue of patients
DME expression in the normal tissue of healthy individuals
|
|||||
| Violin Diagram of DME Disease-specific Protein Abundances |
|
Click to View the Clearer Original Diagram | |||
| The Studied Tissue | Spinal cord | ||||
| The Specified Disease | Multiple sclerosis [ICD-11:8A40] | ||||
| The Expression Level of Disease Section Compare with the Adjacent Tissue | p-value: 5.62E-01; Fold-change: 6.09E-03; Z-score: 2.36E-02 | ||||
|
DME expression in the diseased tissue of patients
DME expression in the normal tissue adjacent to the diseased tissue of patients
|
|||||
| Violin Diagram of DME Disease-specific Protein Abundances |
|
Click to View the Clearer Original Diagram | |||
| ICD-11: 8A60 | Epilepsy | Click to Show/Hide | |||
| The Studied Tissue | Peritumoral cortex tissue | ||||
| The Specified Disease | Epilepsy [ICD-11:8A60-8A6Z] | ||||
| The Expression Level of Disease Section Compare with the Other Disease Section | p-value: 1.39E-01; Fold-change: 2.09E-01; Z-score: 1.02E+00 | ||||
|
DME expression in the diseased tissue of patients
DME expression in tissue other than the diseased tissue of patients
|
|||||
| Violin Diagram of DME Disease-specific Protein Abundances |
|
Click to View the Clearer Original Diagram | |||
| The Studied Tissue | Whole blood | ||||
| The Specified Disease | Seizure [ICD-11:8A60-8A6Z] | ||||
| The Expression Level of Disease Section Compare with the Healthy Individual Tissue | p-value: 4.57E-01; Fold-change: 6.95E-02; Z-score: 3.56E-01 | ||||
|
DME expression in the diseased tissue of patients
DME expression in the normal tissue of healthy individuals
|
|||||
| Violin Diagram of DME Disease-specific Protein Abundances |
|
Click to View the Clearer Original Diagram | |||
| ICD-11: 8B01 | Subarachnoid haemorrhage | Click to Show/Hide | |||
| The Studied Tissue | Intracranial artery | ||||
| The Specified Disease | Intracranial aneurysm [ICD-11:8B01.0] | ||||
| The Expression Level of Disease Section Compare with the Healthy Individual Tissue | p-value: 4.08E-03; Fold-change: 1.81E-01; Z-score: 1.97E+00 | ||||
|
DME expression in the diseased tissue of patients
DME expression in the normal tissue of healthy individuals
|
|||||
| Violin Diagram of DME Disease-specific Protein Abundances |
|
Click to View the Clearer Original Diagram | |||
| ICD-11: 8B11 | Cerebral ischaemic stroke | Click to Show/Hide | |||
| The Studied Tissue | Whole blood | ||||
| The Specified Disease | Cardioembolic stroke [ICD-11:8B11.20] | ||||
| The Expression Level of Disease Section Compare with the Healthy Individual Tissue | p-value: 7.71E-01; Fold-change: 8.39E-03; Z-score: 3.95E-02 | ||||
|
DME expression in the diseased tissue of patients
DME expression in the normal tissue of healthy individuals
|
|||||
| Violin Diagram of DME Disease-specific Protein Abundances |
|
Click to View the Clearer Original Diagram | |||
| The Studied Tissue | Peripheral blood | ||||
| The Specified Disease | Ischemic stroke [ICD-11:8B11] | ||||
| The Expression Level of Disease Section Compare with the Healthy Individual Tissue | p-value: 3.38E-02; Fold-change: 4.92E-02; Z-score: 6.31E-01 | ||||
|
DME expression in the diseased tissue of patients
DME expression in the normal tissue of healthy individuals
|
|||||
| Violin Diagram of DME Disease-specific Protein Abundances |
|
Click to View the Clearer Original Diagram | |||
| ICD-11: 8B60 | Motor neuron disease | Click to Show/Hide | |||
| The Studied Tissue | Skin | ||||
| The Specified Disease | Lateral sclerosis [ICD-11:8B60.4] | ||||
| The Expression Level of Disease Section Compare with the Healthy Individual Tissue | p-value: 1.14E-01; Fold-change: 7.49E-02; Z-score: 1.11E+00 | ||||
|
DME expression in the diseased tissue of patients
DME expression in the normal tissue of healthy individuals
|
|||||
| Violin Diagram of DME Disease-specific Protein Abundances |
|
Click to View the Clearer Original Diagram | |||
| The Studied Tissue | Cervical spinal cord | ||||
| The Specified Disease | Lateral sclerosis [ICD-11:8B60.4] | ||||
| The Expression Level of Disease Section Compare with the Healthy Individual Tissue | p-value: 5.03E-01; Fold-change: -2.08E-03; Z-score: -9.42E-03 | ||||
|
DME expression in the diseased tissue of patients
DME expression in the normal tissue of healthy individuals
|
|||||
| Violin Diagram of DME Disease-specific Protein Abundances |
|
Click to View the Clearer Original Diagram | |||
| ICD-11: 8C70 | Muscular dystrophy | Click to Show/Hide | |||
| The Studied Tissue | Muscle tissue | ||||
| The Specified Disease | Myopathy [ICD-11:8C70.6] | ||||
| The Expression Level of Disease Section Compare with the Healthy Individual Tissue | p-value: 5.98E-01; Fold-change: -1.02E-01; Z-score: -6.90E-01 | ||||
|
DME expression in the diseased tissue of patients
DME expression in the normal tissue of healthy individuals
|
|||||
| Violin Diagram of DME Disease-specific Protein Abundances |
|
Click to View the Clearer Original Diagram | |||
| ICD-11: 8C75 | Distal myopathy | Click to Show/Hide | |||
| The Studied Tissue | Muscle tissue | ||||
| The Specified Disease | Tibial muscular dystrophy [ICD-11:8C75] | ||||
| The Expression Level of Disease Section Compare with the Healthy Individual Tissue | p-value: 4.13E-02; Fold-change: -4.37E-02; Z-score: -3.73E-01 | ||||
|
DME expression in the diseased tissue of patients
DME expression in the normal tissue of healthy individuals
|
|||||
| Violin Diagram of DME Disease-specific Protein Abundances |
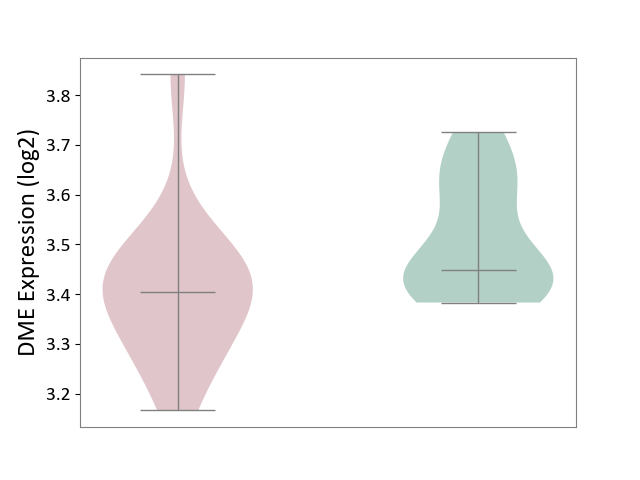
|
Click to View the Clearer Original Diagram | |||
| ICD Disease Classification 09 | Visual system disease | Click to Show/Hide | |||
| ICD-11: 9A96 | Anterior uveitis | Click to Show/Hide | |||
| The Studied Tissue | Peripheral monocyte | ||||
| The Specified Disease | Autoimmune uveitis [ICD-11:9A96] | ||||
| The Expression Level of Disease Section Compare with the Healthy Individual Tissue | p-value: 2.86E-02; Fold-change: -7.09E-02; Z-score: -1.19E+00 | ||||
|
DME expression in the diseased tissue of patients
DME expression in the normal tissue of healthy individuals
|
|||||
| Violin Diagram of DME Disease-specific Protein Abundances |
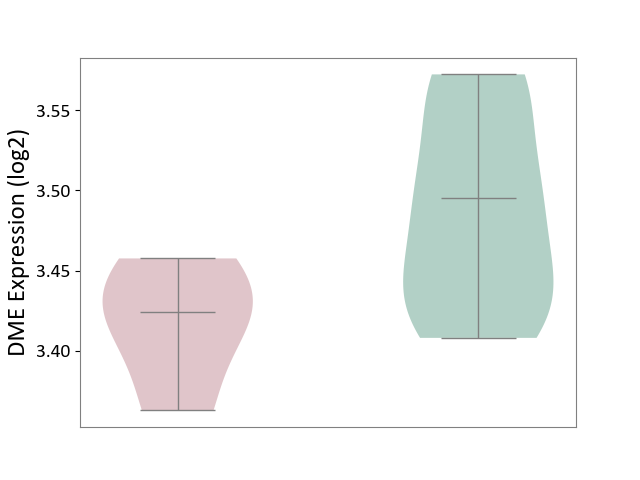
|
Click to View the Clearer Original Diagram | |||
| ICD Disease Classification 11 | Circulatory system disease | Click to Show/Hide | |||
| ICD-11: BA41 | Myocardial infarction | Click to Show/Hide | |||
| The Studied Tissue | Peripheral blood | ||||
| The Specified Disease | Myocardial infarction [ICD-11:BA41-BA50] | ||||
| The Expression Level of Disease Section Compare with the Healthy Individual Tissue | p-value: 8.39E-02; Fold-change: 1.07E-01; Z-score: 3.94E-01 | ||||
|
DME expression in the diseased tissue of patients
DME expression in the normal tissue of healthy individuals
|
|||||
| Violin Diagram of DME Disease-specific Protein Abundances |
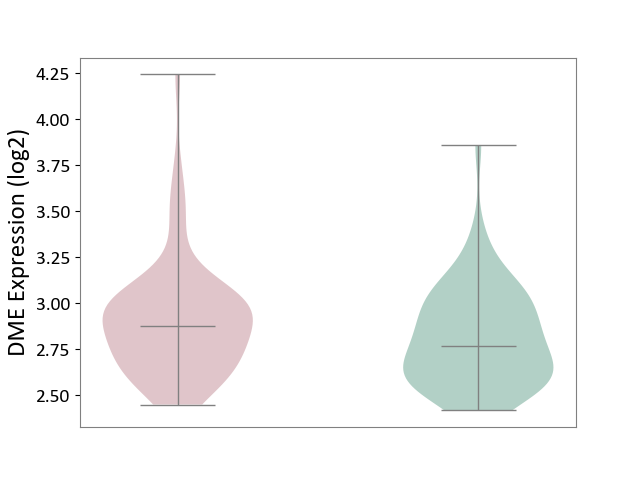
|
Click to View the Clearer Original Diagram | |||
| ICD-11: BA80 | Coronary artery disease | Click to Show/Hide | |||
| The Studied Tissue | Peripheral blood | ||||
| The Specified Disease | Coronary artery disease [ICD-11:BA80-BA8Z] | ||||
| The Expression Level of Disease Section Compare with the Healthy Individual Tissue | p-value: 3.39E-01; Fold-change: 5.91E-02; Z-score: 4.05E-01 | ||||
|
DME expression in the diseased tissue of patients
DME expression in the normal tissue of healthy individuals
|
|||||
| Violin Diagram of DME Disease-specific Protein Abundances |
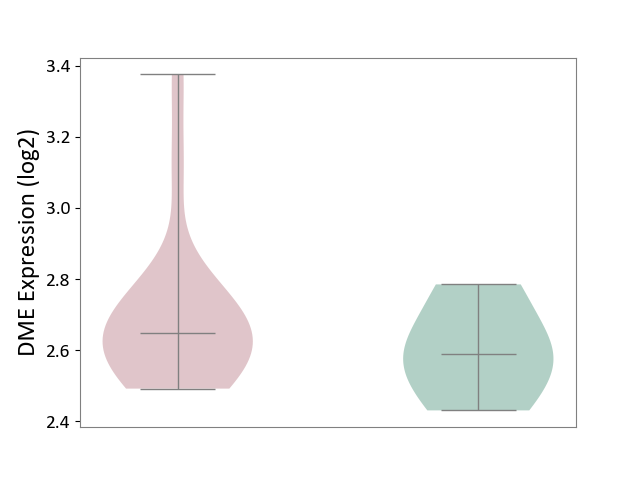
|
Click to View the Clearer Original Diagram | |||
| ICD-11: BB70 | Aortic valve stenosis | Click to Show/Hide | |||
| The Studied Tissue | Calcified aortic valve | ||||
| The Specified Disease | Aortic stenosis [ICD-11:BB70] | ||||
| The Expression Level of Disease Section Compare with the Healthy Individual Tissue | p-value: 9.40E-01; Fold-change: -1.68E-02; Z-score: -3.18E-02 | ||||
|
DME expression in the diseased tissue of patients
DME expression in the normal tissue of healthy individuals
|
|||||
| Violin Diagram of DME Disease-specific Protein Abundances |
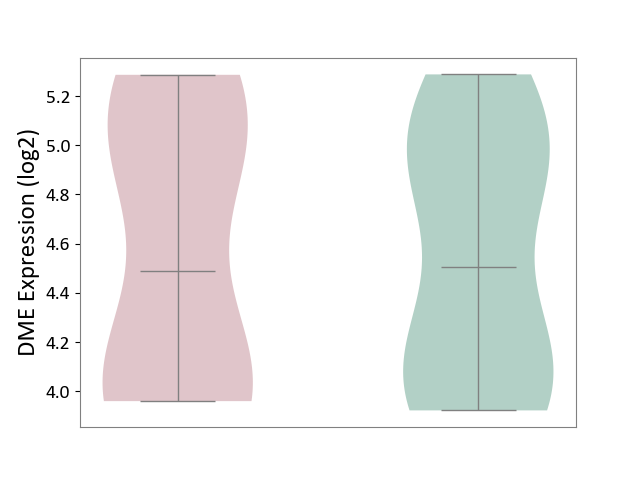
|
Click to View the Clearer Original Diagram | |||
| ICD Disease Classification 12 | Respiratory system disease | Click to Show/Hide | |||
| ICD-11: 7A40 | Central sleep apnoea | Click to Show/Hide | |||
| The Studied Tissue | Hyperplastic tonsil | ||||
| The Specified Disease | Apnea [ICD-11:7A40] | ||||
| The Expression Level of Disease Section Compare with the Healthy Individual Tissue | p-value: 8.00E-02; Fold-change: -5.54E-02; Z-score: -3.69E-01 | ||||
|
DME expression in the diseased tissue of patients
DME expression in the normal tissue of healthy individuals
|
|||||
| Violin Diagram of DME Disease-specific Protein Abundances |
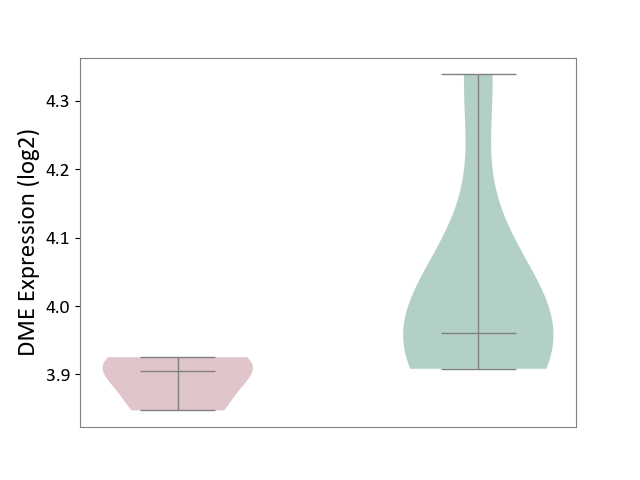
|
Click to View the Clearer Original Diagram | |||
| ICD-11: CA08 | Vasomotor or allergic rhinitis | Click to Show/Hide | |||
| The Studied Tissue | Peripheral blood | ||||
| The Specified Disease | Olive pollen allergy [ICD-11:CA08.00] | ||||
| The Expression Level of Disease Section Compare with the Healthy Individual Tissue | p-value: 8.34E-01; Fold-change: -1.61E-02; Z-score: -1.81E-01 | ||||
|
DME expression in the diseased tissue of patients
DME expression in the normal tissue of healthy individuals
|
|||||
| Violin Diagram of DME Disease-specific Protein Abundances |
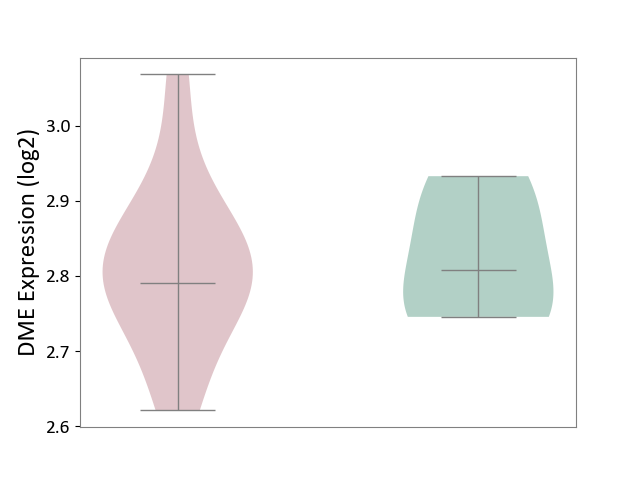
|
Click to View the Clearer Original Diagram | |||
| ICD-11: CA0A | Chronic rhinosinusitis | Click to Show/Hide | |||
| The Studied Tissue | Sinus mucosa tissue | ||||
| The Specified Disease | Chronic rhinosinusitis [ICD-11:CA0A] | ||||
| The Expression Level of Disease Section Compare with the Healthy Individual Tissue | p-value: 5.16E-01; Fold-change: 5.43E-02; Z-score: 1.44E-01 | ||||
|
DME expression in the diseased tissue of patients
DME expression in the normal tissue of healthy individuals
|
|||||
| Violin Diagram of DME Disease-specific Protein Abundances |
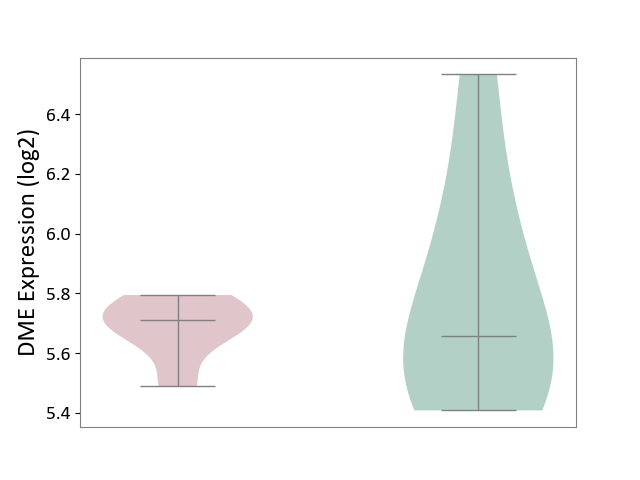
|
Click to View the Clearer Original Diagram | |||
| ICD-11: CA22 | Chronic obstructive pulmonary disease | Click to Show/Hide | |||
| The Studied Tissue | Lung tissue | ||||
| The Specified Disease | Chronic obstructive pulmonary disease [ICD-11:CA22] | ||||
| The Expression Level of Disease Section Compare with the Healthy Individual Tissue | p-value: 2.41E-01; Fold-change: 3.17E-02; Z-score: 2.29E-01 | ||||
|
DME expression in the diseased tissue of patients
DME expression in the normal tissue of healthy individuals
|
|||||
| Violin Diagram of DME Disease-specific Protein Abundances |
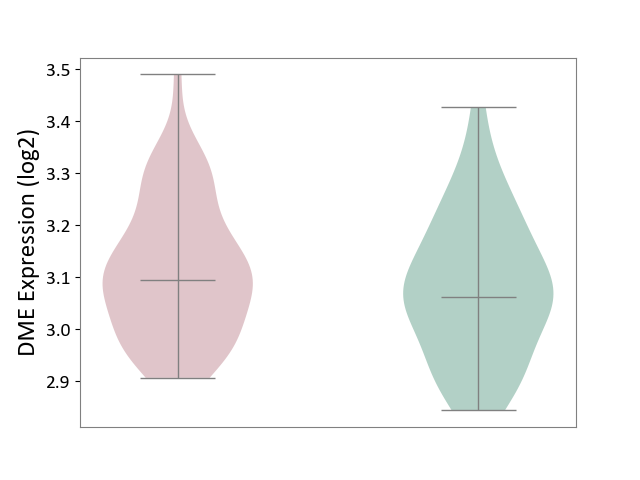
|
Click to View the Clearer Original Diagram | |||
| The Studied Tissue | Small airway epithelium | ||||
| The Specified Disease | Chronic obstructive pulmonary disease [ICD-11:CA22] | ||||
| The Expression Level of Disease Section Compare with the Healthy Individual Tissue | p-value: 5.67E-01; Fold-change: 5.11E-02; Z-score: 1.35E-01 | ||||
|
DME expression in the diseased tissue of patients
DME expression in the normal tissue of healthy individuals
|
|||||
| Violin Diagram of DME Disease-specific Protein Abundances |
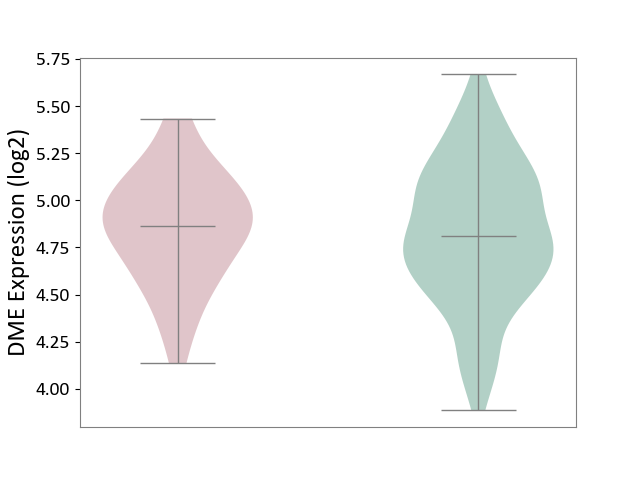
|
Click to View the Clearer Original Diagram | |||
| ICD-11: CA23 | Asthma | Click to Show/Hide | |||
| The Studied Tissue | Nasal and bronchial airway | ||||
| The Specified Disease | Asthma [ICD-11:CA23] | ||||
| The Expression Level of Disease Section Compare with the Healthy Individual Tissue | p-value: 2.93E-03; Fold-change: -2.19E-01; Z-score: -4.49E-01 | ||||
|
DME expression in the diseased tissue of patients
DME expression in the normal tissue of healthy individuals
|
|||||
| Violin Diagram of DME Disease-specific Protein Abundances |
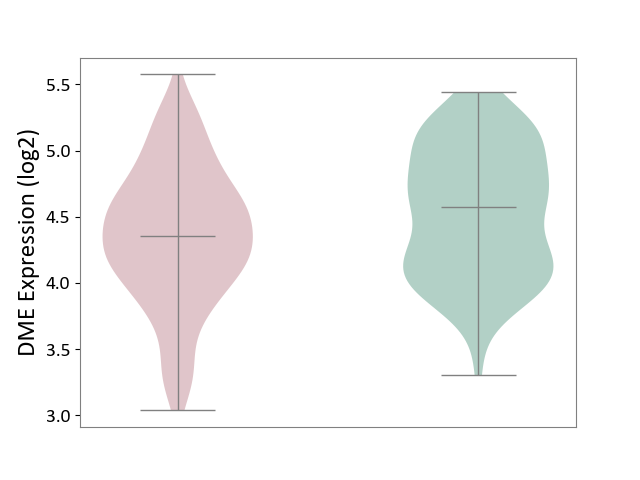
|
Click to View the Clearer Original Diagram | |||
| ICD-11: CB03 | Idiopathic interstitial pneumonitis | Click to Show/Hide | |||
| The Studied Tissue | Lung tissue | ||||
| The Specified Disease | Idiopathic pulmonary fibrosis [ICD-11:CB03.4] | ||||
| The Expression Level of Disease Section Compare with the Healthy Individual Tissue | p-value: 9.63E-01; Fold-change: 1.10E-01; Z-score: 2.91E-01 | ||||
|
DME expression in the diseased tissue of patients
DME expression in the normal tissue of healthy individuals
|
|||||
| Violin Diagram of DME Disease-specific Protein Abundances |
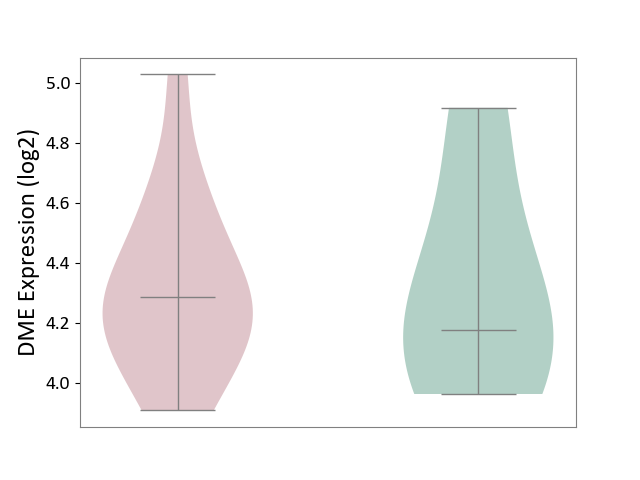
|
Click to View the Clearer Original Diagram | |||
| ICD Disease Classification 13 | Digestive system disease | Click to Show/Hide | |||
| ICD-11: DA0C | Periodontal disease | Click to Show/Hide | |||
| The Studied Tissue | Gingival tissue | ||||
| The Specified Disease | Periodontal disease [ICD-11:DA0C] | ||||
| The Expression Level of Disease Section Compare with the Adjacent Tissue | p-value: 6.62E-02; Fold-change: -4.45E-02; Z-score: -3.26E-01 | ||||
|
DME expression in the diseased tissue of patients
DME expression in the normal tissue adjacent to the diseased tissue of patients
|
|||||
| Violin Diagram of DME Disease-specific Protein Abundances |
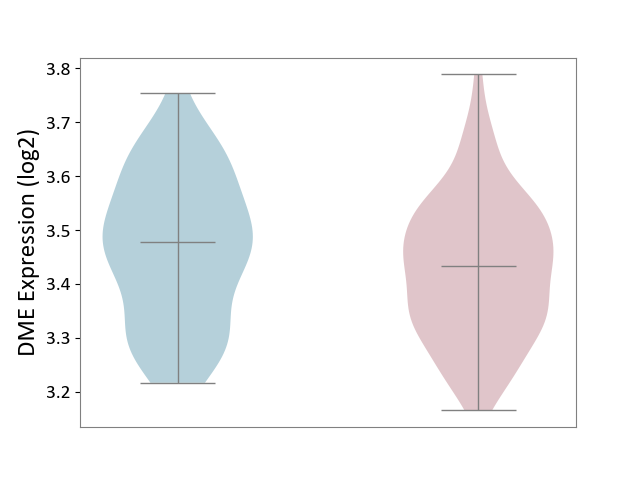
|
Click to View the Clearer Original Diagram | |||
| ICD-11: DA42 | Gastritis | Click to Show/Hide | |||
| The Studied Tissue | Gastric antrum tissue | ||||
| The Specified Disease | Eosinophilic gastritis [ICD-11:DA42.2] | ||||
| The Expression Level of Disease Section Compare with the Adjacent Tissue | p-value: 2.87E-02; Fold-change: -3.82E-01; Z-score: -3.30E+00 | ||||
|
DME expression in the diseased tissue of patients
DME expression in the normal tissue adjacent to the diseased tissue of patients
|
|||||
| Violin Diagram of DME Disease-specific Protein Abundances |
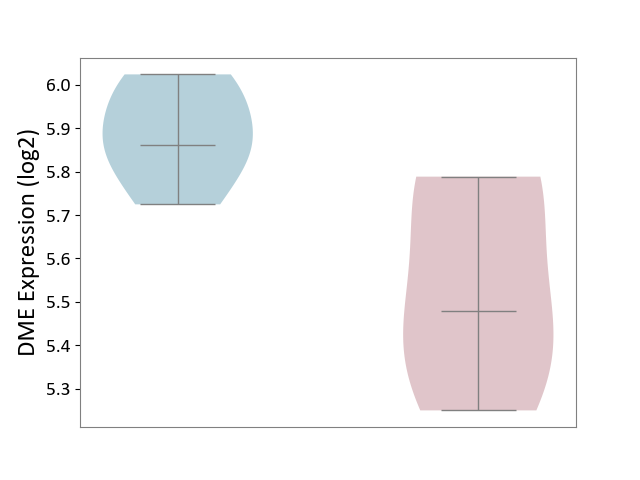
|
Click to View the Clearer Original Diagram | |||
| ICD-11: DB92 | Non-alcoholic fatty liver disease | Click to Show/Hide | |||
| The Studied Tissue | Liver tissue | ||||
| The Specified Disease | Non-alcoholic fatty liver disease [ICD-11:DB92] | ||||
| The Expression Level of Disease Section Compare with the Healthy Individual Tissue | p-value: 4.31E-01; Fold-change: -2.72E-02; Z-score: -4.58E-02 | ||||
|
DME expression in the diseased tissue of patients
DME expression in the normal tissue of healthy individuals
|
|||||
| Violin Diagram of DME Disease-specific Protein Abundances |
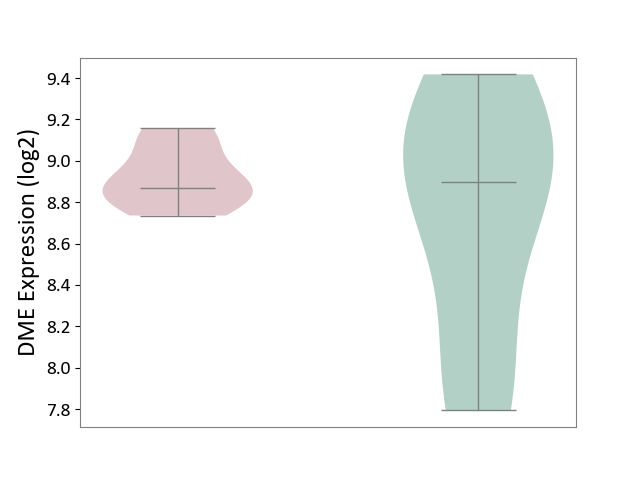
|
Click to View the Clearer Original Diagram | |||
| ICD-11: DB99 | Hepatic failure | Click to Show/Hide | |||
| The Studied Tissue | Liver tissue | ||||
| The Specified Disease | Liver failure [ICD-11:DB99.7-DB99.8] | ||||
| The Expression Level of Disease Section Compare with the Healthy Individual Tissue | p-value: 3.77E-03; Fold-change: -1.94E+00; Z-score: -8.02E+00 | ||||
|
DME expression in the diseased tissue of patients
DME expression in the normal tissue of healthy individuals
|
|||||
| Violin Diagram of DME Disease-specific Protein Abundances |
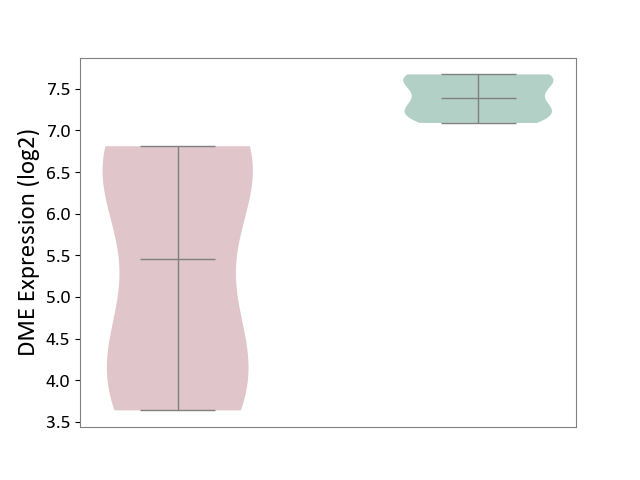
|
Click to View the Clearer Original Diagram | |||
| ICD-11: DD71 | Ulcerative colitis | Click to Show/Hide | |||
| The Studied Tissue | Colon mucosal tissue | ||||
| The Specified Disease | Ulcerative colitis [ICD-11:DD71] | ||||
| The Expression Level of Disease Section Compare with the Adjacent Tissue | p-value: 5.79E-01; Fold-change: -2.96E-03; Z-score: -2.74E-02 | ||||
|
DME expression in the diseased tissue of patients
DME expression in tissue other than the diseased tissue of patients
|
|||||
| Violin Diagram of DME Disease-specific Protein Abundances |
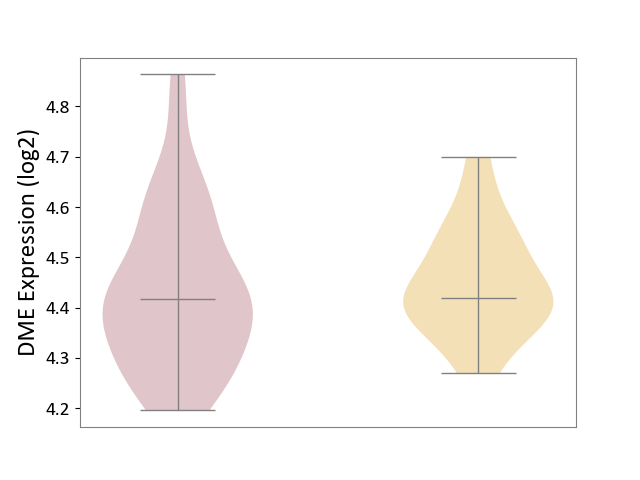
|
Click to View the Clearer Original Diagram | |||
| ICD-11: DD91 | Irritable bowel syndrome | Click to Show/Hide | |||
| The Studied Tissue | Rectal colon tissue | ||||
| The Specified Disease | Irritable bowel syndrome [ICD-11:DD91.0] | ||||
| The Expression Level of Disease Section Compare with the Healthy Individual Tissue | p-value: 9.41E-02; Fold-change: 8.09E-02; Z-score: 3.46E-01 | ||||
|
DME expression in the diseased tissue of patients
DME expression in the normal tissue of healthy individuals
|
|||||
| Violin Diagram of DME Disease-specific Protein Abundances |
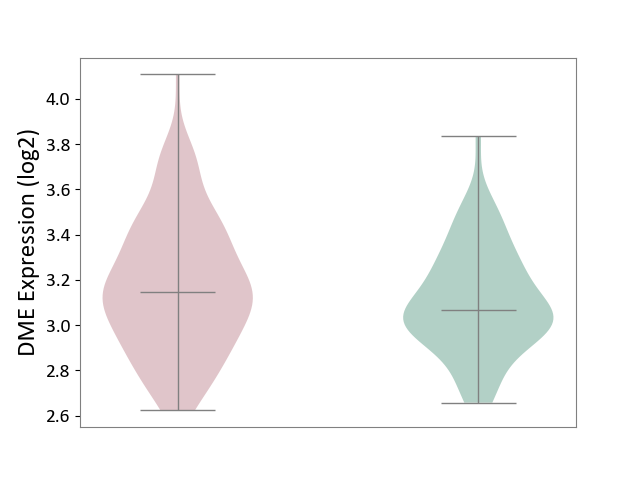
|
Click to View the Clearer Original Diagram | |||
| ICD Disease Classification 14 | Skin disease | Click to Show/Hide | |||
| ICD-11: EA80 | Atopic eczema | Click to Show/Hide | |||
| The Studied Tissue | Skin | ||||
| The Specified Disease | Atopic dermatitis [ICD-11:EA80] | ||||
| The Expression Level of Disease Section Compare with the Healthy Individual Tissue | p-value: 5.96E-04; Fold-change: 9.62E-02; Z-score: 8.89E-01 | ||||
|
DME expression in the diseased tissue of patients
DME expression in the normal tissue of healthy individuals
|
|||||
| Violin Diagram of DME Disease-specific Protein Abundances |
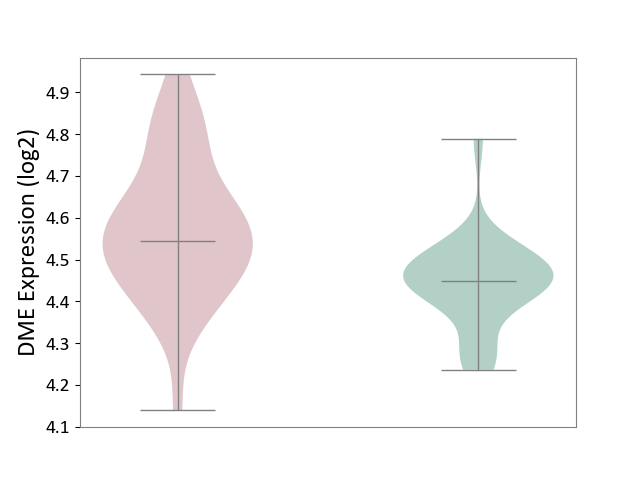
|
Click to View the Clearer Original Diagram | |||
| ICD-11: EA90 | Psoriasis | Click to Show/Hide | |||
| The Studied Tissue | Skin | ||||
| The Specified Disease | Psoriasis [ICD-11:EA90] | ||||
| The Expression Level of Disease Section Compare with the Healthy Individual Tissue | p-value: 4.73E-03; Fold-change: 3.91E-02; Z-score: 2.20E-01 | ||||
| The Expression Level of Disease Section Compare with the Adjacent Tissue | p-value: 6.45E-01; Fold-change: -4.26E-02; Z-score: -2.03E-01 | ||||
|
DME expression in the diseased tissue of patients
DME expression in the normal tissue adjacent to the diseased tissue of patients
DME expression in the normal tissue of healthy individuals
|
|||||
| Violin Diagram of DME Disease-specific Protein Abundances |
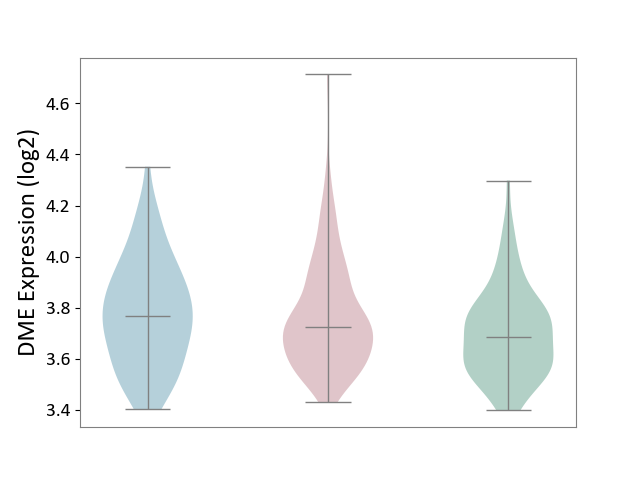
|
Click to View the Clearer Original Diagram | |||
| ICD-11: ED63 | Acquired hypomelanotic disorder | Click to Show/Hide | |||
| The Studied Tissue | Skin | ||||
| The Specified Disease | Vitiligo [ICD-11:ED63.0] | ||||
| The Expression Level of Disease Section Compare with the Healthy Individual Tissue | p-value: 5.34E-01; Fold-change: -7.52E-02; Z-score: -5.09E-01 | ||||
|
DME expression in the diseased tissue of patients
DME expression in the normal tissue of healthy individuals
|
|||||
| Violin Diagram of DME Disease-specific Protein Abundances |
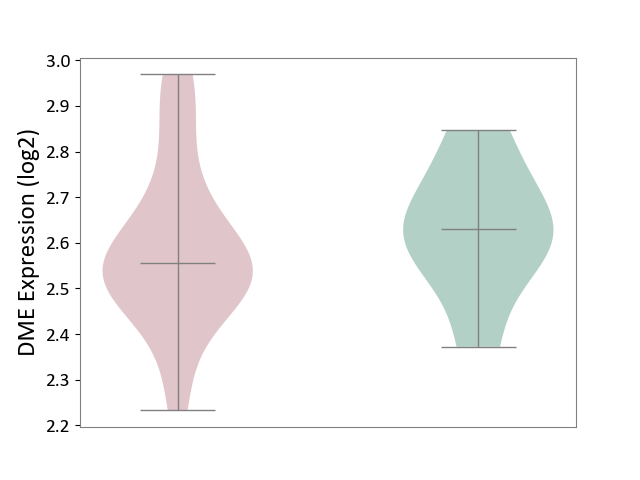
|
Click to View the Clearer Original Diagram | |||
| ICD-11: ED70 | Alopecia or hair loss | Click to Show/Hide | |||
| The Studied Tissue | Skin from scalp | ||||
| The Specified Disease | Alopecia [ICD-11:ED70] | ||||
| The Expression Level of Disease Section Compare with the Healthy Individual Tissue | p-value: 3.37E-02; Fold-change: 1.39E-01; Z-score: 5.78E-01 | ||||
|
DME expression in the diseased tissue of patients
DME expression in the normal tissue of healthy individuals
|
|||||
| Violin Diagram of DME Disease-specific Protein Abundances |
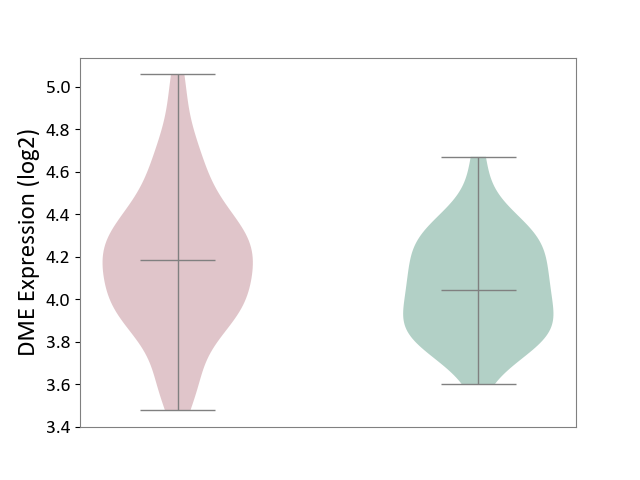
|
Click to View the Clearer Original Diagram | |||
| ICD-11: EK0Z | Contact dermatitis | Click to Show/Hide | |||
| The Studied Tissue | Skin | ||||
| The Specified Disease | Sensitive skin [ICD-11:EK0Z] | ||||
| The Expression Level of Disease Section Compare with the Healthy Individual Tissue | p-value: 6.18E-01; Fold-change: 3.82E-02; Z-score: 5.52E-01 | ||||
|
DME expression in the diseased tissue of patients
DME expression in the normal tissue of healthy individuals
|
|||||
| Violin Diagram of DME Disease-specific Protein Abundances |
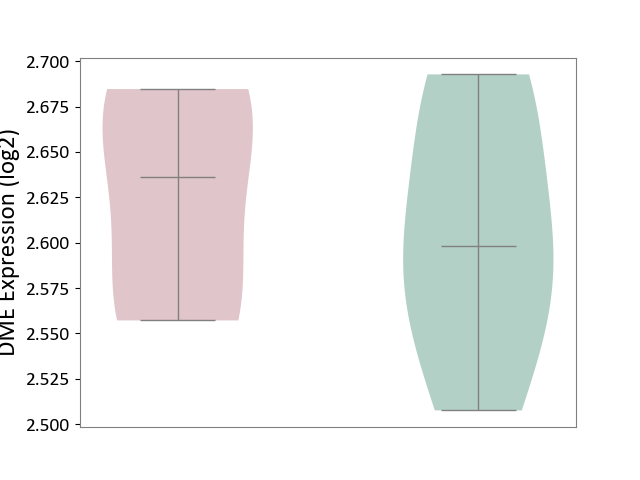
|
Click to View the Clearer Original Diagram | |||
| ICD Disease Classification 15 | Musculoskeletal system/connective tissue disease | Click to Show/Hide | |||
| ICD-11: FA00 | Osteoarthritis | Click to Show/Hide | |||
| The Studied Tissue | Peripheral blood | ||||
| The Specified Disease | Arthropathy [ICD-11:FA00-FA5Z] | ||||
| The Expression Level of Disease Section Compare with the Healthy Individual Tissue | p-value: 8.17E-01; Fold-change: -2.55E-02; Z-score: -1.87E-01 | ||||
|
DME expression in the diseased tissue of patients
DME expression in the normal tissue of healthy individuals
|
|||||
| Violin Diagram of DME Disease-specific Protein Abundances |
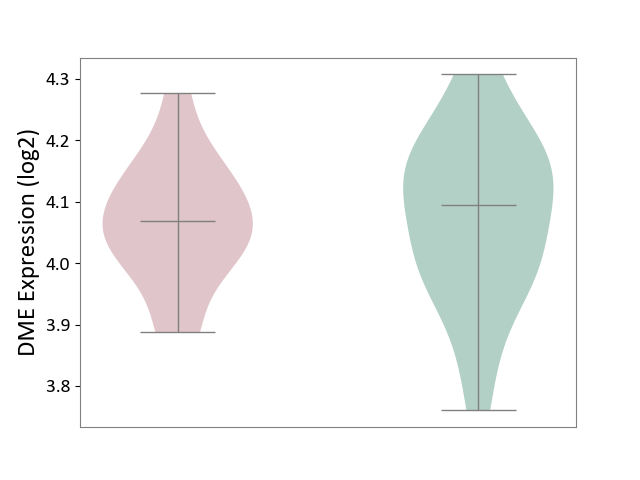
|
Click to View the Clearer Original Diagram | |||
| The Studied Tissue | Synovial tissue | ||||
| The Specified Disease | Osteoarthritis [ICD-11:FA00-FA0Z] | ||||
| The Expression Level of Disease Section Compare with the Healthy Individual Tissue | p-value: 8.71E-01; Fold-change: -6.68E-03; Z-score: -3.03E-02 | ||||
|
DME expression in the diseased tissue of patients
DME expression in the normal tissue of healthy individuals
|
|||||
| Violin Diagram of DME Disease-specific Protein Abundances |
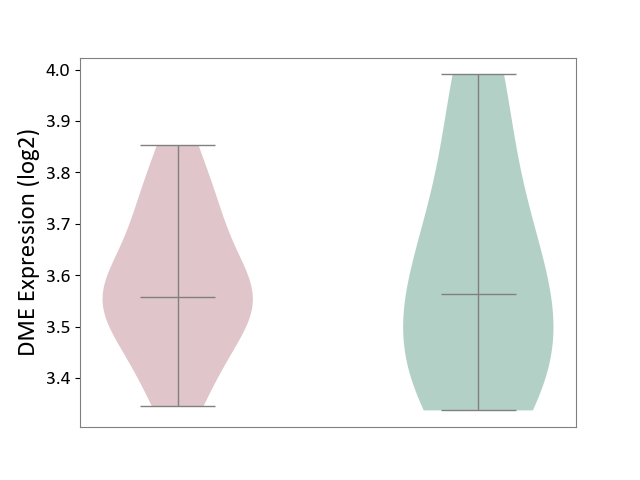
|
Click to View the Clearer Original Diagram | |||
| ICD-11: FA20 | Rheumatoid arthritis | Click to Show/Hide | |||
| The Studied Tissue | Peripheral blood | ||||
| The Specified Disease | Childhood onset rheumatic disease [ICD-11:FA20.Z] | ||||
| The Expression Level of Disease Section Compare with the Healthy Individual Tissue | p-value: 6.66E-01; Fold-change: 2.12E-02; Z-score: 2.25E-01 | ||||
|
DME expression in the diseased tissue of patients
DME expression in the normal tissue of healthy individuals
|
|||||
| Violin Diagram of DME Disease-specific Protein Abundances |
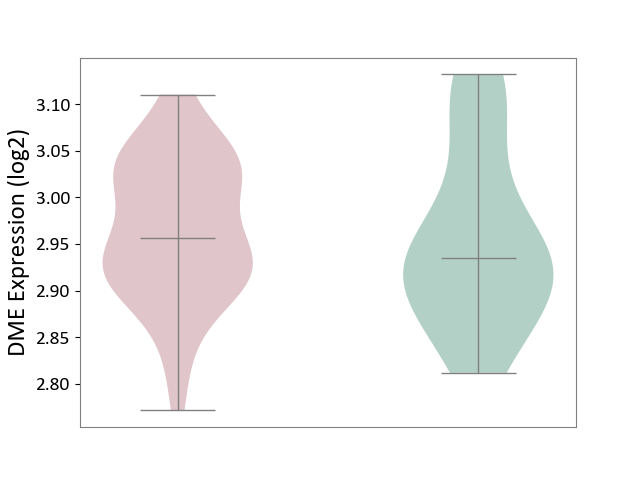
|
Click to View the Clearer Original Diagram | |||
| The Studied Tissue | Synovial tissue | ||||
| The Specified Disease | Rheumatoid arthritis [ICD-11:FA20] | ||||
| The Expression Level of Disease Section Compare with the Healthy Individual Tissue | p-value: 7.62E-02; Fold-change: -1.65E-01; Z-score: -6.38E-01 | ||||
|
DME expression in the diseased tissue of patients
DME expression in the normal tissue of healthy individuals
|
|||||
| Violin Diagram of DME Disease-specific Protein Abundances |
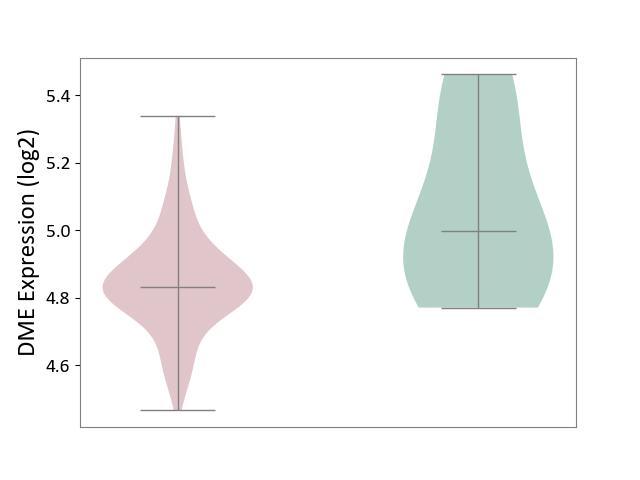
|
Click to View the Clearer Original Diagram | |||
| ICD-11: FA24 | Juvenile idiopathic arthritis | Click to Show/Hide | |||
| The Studied Tissue | Peripheral blood | ||||
| The Specified Disease | Juvenile idiopathic arthritis [ICD-11:FA24] | ||||
| The Expression Level of Disease Section Compare with the Healthy Individual Tissue | p-value: 1.81E-01; Fold-change: 5.13E-02; Z-score: 2.10E-01 | ||||
|
DME expression in the diseased tissue of patients
DME expression in the normal tissue of healthy individuals
|
|||||
| Violin Diagram of DME Disease-specific Protein Abundances |
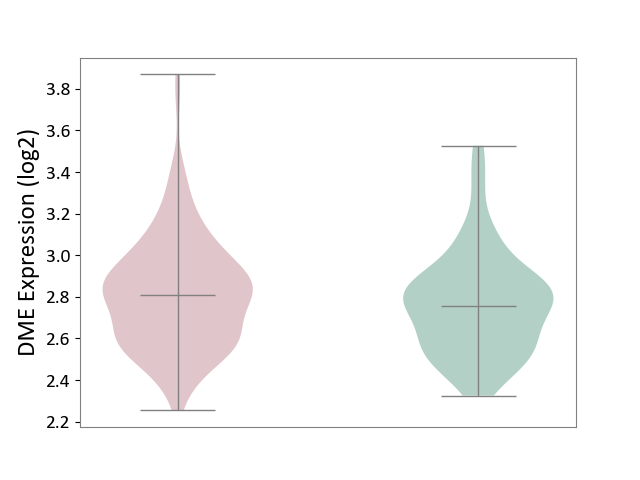
|
Click to View the Clearer Original Diagram | |||
| ICD-11: FA92 | Inflammatory spondyloarthritis | Click to Show/Hide | |||
| The Studied Tissue | Pheripheral blood | ||||
| The Specified Disease | Ankylosing spondylitis [ICD-11:FA92.0Z] | ||||
| The Expression Level of Disease Section Compare with the Healthy Individual Tissue | p-value: 6.98E-01; Fold-change: 2.18E-04; Z-score: 2.03E-03 | ||||
|
DME expression in the diseased tissue of patients
DME expression in the normal tissue of healthy individuals
|
|||||
| Violin Diagram of DME Disease-specific Protein Abundances |
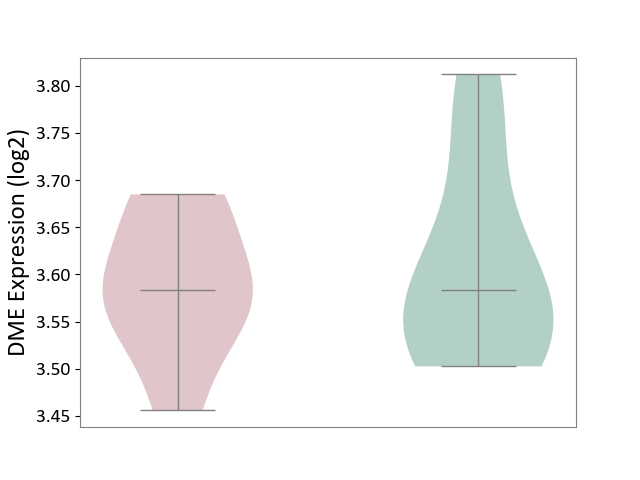
|
Click to View the Clearer Original Diagram | |||
| ICD-11: FB83 | Low bone mass disorder | Click to Show/Hide | |||
| The Studied Tissue | Bone marrow | ||||
| The Specified Disease | Osteoporosis [ICD-11:FB83.1] | ||||
| The Expression Level of Disease Section Compare with the Healthy Individual Tissue | p-value: 1.23E-01; Fold-change: 4.59E-02; Z-score: 6.37E-01 | ||||
|
DME expression in the diseased tissue of patients
DME expression in the normal tissue of healthy individuals
|
|||||
| Violin Diagram of DME Disease-specific Protein Abundances |
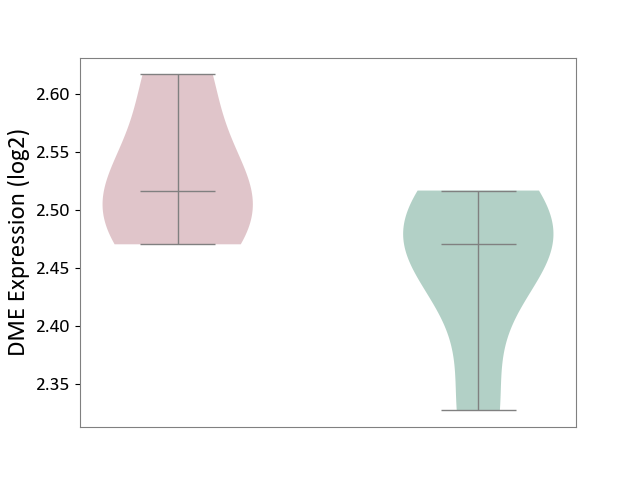
|
Click to View the Clearer Original Diagram | |||
| ICD Disease Classification 16 | Genitourinary system disease | Click to Show/Hide | |||
| ICD-11: GA10 | Endometriosis | Click to Show/Hide | |||
| The Studied Tissue | Endometrium tissue | ||||
| The Specified Disease | Endometriosis [ICD-11:GA10] | ||||
| The Expression Level of Disease Section Compare with the Healthy Individual Tissue | p-value: 7.97E-02; Fold-change: -4.55E-02; Z-score: -3.54E-01 | ||||
|
DME expression in the diseased tissue of patients
DME expression in the normal tissue of healthy individuals
|
|||||
| Violin Diagram of DME Disease-specific Protein Abundances |
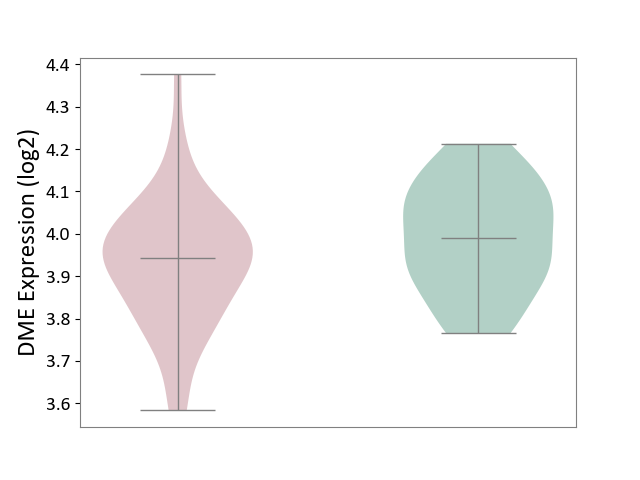
|
Click to View the Clearer Original Diagram | |||
| ICD-11: GC00 | Cystitis | Click to Show/Hide | |||
| The Studied Tissue | Bladder tissue | ||||
| The Specified Disease | Interstitial cystitis [ICD-11:GC00.3] | ||||
| The Expression Level of Disease Section Compare with the Healthy Individual Tissue | p-value: 4.00E-01; Fold-change: -2.09E-02; Z-score: -1.50E-01 | ||||
|
DME expression in the diseased tissue of patients
DME expression in the normal tissue of healthy individuals
|
|||||
| Violin Diagram of DME Disease-specific Protein Abundances |
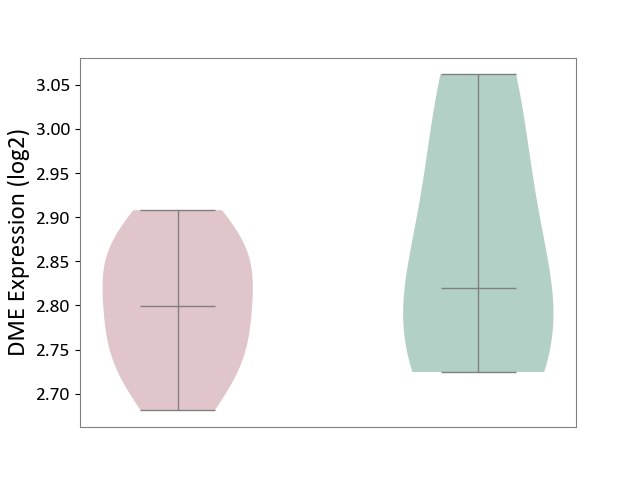
|
Click to View the Clearer Original Diagram | |||
| ICD Disease Classification 19 | Condition originating in perinatal period | Click to Show/Hide | |||
| ICD-11: KA21 | Short gestation disorder | Click to Show/Hide | |||
| The Studied Tissue | Myometrium | ||||
| The Specified Disease | Preterm birth [ICD-11:KA21.4Z] | ||||
| The Expression Level of Disease Section Compare with the Healthy Individual Tissue | p-value: 7.88E-01; Fold-change: 1.19E-02; Z-score: 9.16E-02 | ||||
|
DME expression in the diseased tissue of patients
DME expression in the normal tissue of healthy individuals
|
|||||
| Violin Diagram of DME Disease-specific Protein Abundances |
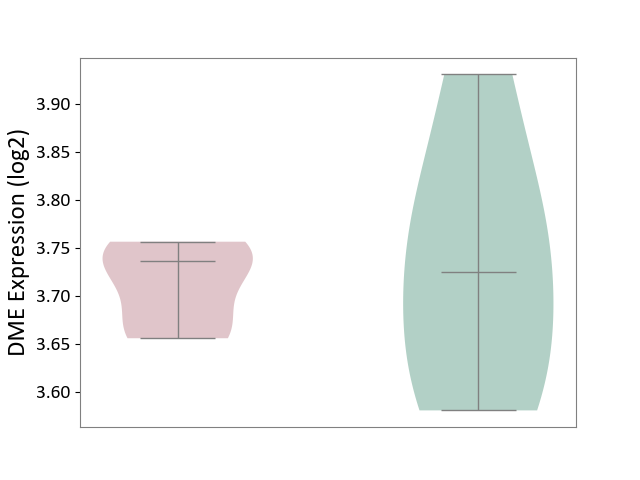
|
Click to View the Clearer Original Diagram | |||
| ICD Disease Classification 20 | Developmental anomaly | Click to Show/Hide | |||
| ICD-11: LD2C | Overgrowth syndrome | Click to Show/Hide | |||
| The Studied Tissue | Adipose tissue | ||||
| The Specified Disease | Simpson golabi behmel syndrome [ICD-11:LD2C] | ||||
| The Expression Level of Disease Section Compare with the Healthy Individual Tissue | p-value: 3.18E-01; Fold-change: -4.49E-03; Z-score: -3.72E-01 | ||||
|
DME expression in the diseased tissue of patients
DME expression in the normal tissue of healthy individuals
|
|||||
| Violin Diagram of DME Disease-specific Protein Abundances |
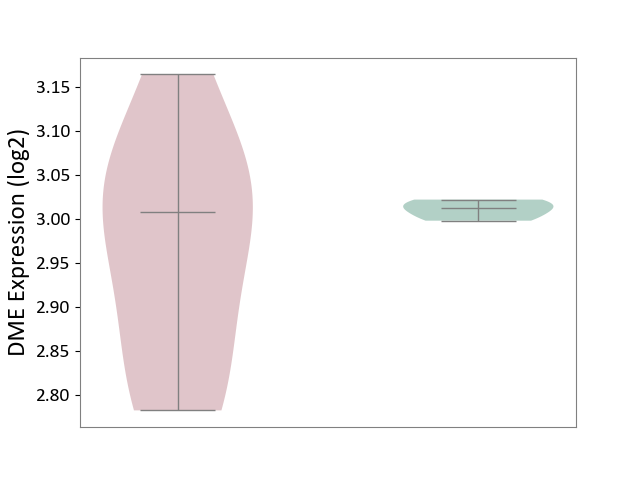
|
Click to View the Clearer Original Diagram | |||
| ICD-11: LD2D | Phakomatoses/hamartoneoplastic syndrome | Click to Show/Hide | |||
| The Studied Tissue | Perituberal tissue | ||||
| The Specified Disease | Tuberous sclerosis complex [ICD-11:LD2D.2] | ||||
| The Expression Level of Disease Section Compare with the Healthy Individual Tissue | p-value: 5.00E-01; Fold-change: -6.51E-03; Z-score: -3.20E-02 | ||||
|
DME expression in the diseased tissue of patients
DME expression in the normal tissue of healthy individuals
|
|||||
| Violin Diagram of DME Disease-specific Protein Abundances |
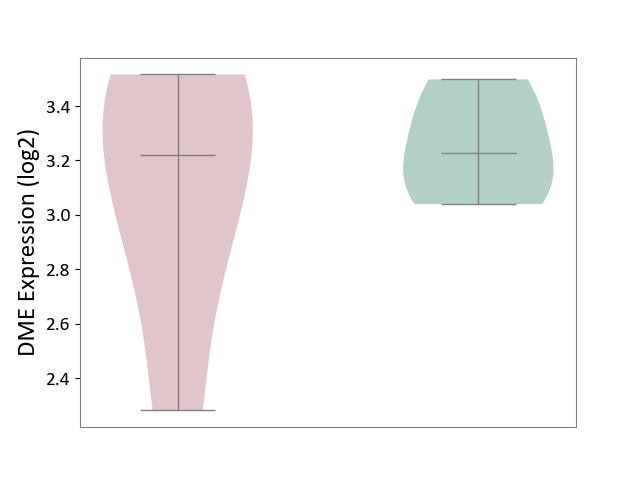
|
Click to View the Clearer Original Diagram | |||
| References | |||||
|---|---|---|---|---|---|
| 1 | Thalidomide metabolism by the CYP2C subfamily. Clin Cancer Res. 2002 Jun;8(6):1964-73. | ||||
| 2 | Involvement of multiple cytochrome P450 isoforms in naproxen O-demethylation. Eur J Clin Pharmacol. 1997;52(4):293-8. | ||||
| 3 | Role of cytochrome P450 2C8 in drug metabolism and interactions. Pharmacol Rev. 2016 Jan;68(1):168-241. | ||||
| 4 | Role of cytochrome P450 in estradiol metabolism in vitro. Acta Pharmacol Sin. 2001 Feb;22(2):148-54. | ||||
| 5 | DrugBank(Pharmacology-Metabolism)Estrone | ||||
| 6 | Roles of CYP2A6 and CYP2B6 in nicotine C-oxidation by human liver microsomes. Arch Toxicol. 1999 Mar;73(2):65-70. | ||||
| 7 | Apalutamide: first global approval. Drugs. 2018 Apr;78(6):699-705. | ||||
| 8 | DrugBank(Pharmacology-Metabolism):Ozanimod | ||||
| 9 | Analysis of human cytochrome P450 2C8 substrate specificity using a substrate pharmacophore and site-directed mutants. Biochemistry. 2004 Dec 14;43(49):15379-92. | ||||
| 10 | Metabolic Profiles of Propofol and Fospropofol: Clinical and Forensic Interpretative Aspects | ||||
| 11 | Determinants of cytochrome P450 2C8 substrate binding: structures of complexes with montelukast, troglitazone, felodipine, and 9-cis-retinoic acid. J Biol Chem. 2008 Jun 20;283(25):17227-37. | ||||
| 12 | Buprenorphine in cancer pain. Support Care Cancer. 2005 Nov;13(11):878-87. | ||||
| 13 | Characterization of the cytochrome P450 enzymes involved in the in vitro metabolism of rosiglitazone. Br J Clin Pharmacol. 1999 Sep;48(3):424-32. | ||||
| 14 | Rosiglitazone Metabolism in Human Liver Microsomes Using a Substrate Depletion Method | ||||
| 15 | DrugBank(Pharmacology-Metabolism):Rosiglitazone | ||||
| 16 | DrugBank(Pharmacology-Metabolism):Almogran | ||||
| 17 | Identification of the human liver enzymes involved in the metabolism of the antimigraine agent almotriptan. Drug Metab Dispos. 2003 Apr;31(4):404-11. | ||||
| 18 | Summary of information on human CYP enzymes: human P450 metabolism data. Drug Metab Rev. 2002 Feb-May;34(1-2):83-448. | ||||
| 19 | Pharmacokinetics and metabolism of 14C-brivaracetam, a novel SV2A ligand, in healthy subjects. Drug Metab Dispos. 2008 Jan;36(1):36-45. | ||||
| 20 | Metabolism of capsaicin by cytochrome P450 produces novel dehydrogenated metabolites and decreases cytotoxicity to lung and liver cells Chem Res Toxicol. 2003 Mar;16(3):336-49. doi: 10.1021/tx025599q. | ||||
| 21 | Metabolism of capsaicin by cytochrome P450 produces novel dehydrogenated metabolites and decreases cytotoxicity to lung and liver cells. Chem Res Toxicol. 2003 Mar;16(3):336-49. | ||||
| 22 | Examination of 209 drugs for inhibition of cytochrome P450 2C8. J Clin Pharmacol. 2005 Jan;45(1):68-78. | ||||
| 23 | Enhanced cyclophosphamide and ifosfamide activation in primary human hepatocyte cultures: response to cytochrome P-450 inducers and autoinduction by oxazaphosphorines. Cancer Res. 1997 May 15;57(10):1946-54. | ||||
| 24 | Mechanism-based inactivation of cytochrome P450 3A4 by lapatinib. Mol Pharmacol. 2010 Oct;78(4):693-703. | ||||
| 25 | PharmGKB summary: mycophenolic acid pathway. Pharmacogenet Genomics. 2014 Jan;24(1):73-9. | ||||
| 26 | CYP2C76-mediated species difference in drug metabolism: a comparison of pitavastatin metabolism between monkeys and humans | ||||
| 27 | Metabolic fate of pitavastatin (NK-104), a new inhibitor of 3-hydroxy-3-methyl-glutaryl coenzyme A reductase. Effects on drug-metabolizing systems in rats and humans | ||||
| 28 | Metabolic fate of pitavastatin, a new inhibitor of HMG-CoA reductase: similarities and difference in the metabolism of pitavastatin in monkeys and humans | ||||
| 29 | Substrates, inducers, inhibitors and structure-activity relationships of human Cytochrome P450 2C9 and implications in drug development. Curr Med Chem. 2009;16(27):3480-675. | ||||
| 30 | Effect of rifampicin on the pharmacokinetics of pioglitazone | ||||
| 31 | Identification of human cytochrome P450s involved in the formation of all-trans-retinoic acid principal metabolites. Mol Pharmacol. 2000 Dec;58(6):1341-8. | ||||
| 32 | DAILYMED.nlm.nih.gov: JEVTANA- cabazitaxel kit. | ||||
| 33 | [Enzalutamide in castration resistant prostate cancer.] | ||||
| 34 | In vitro drug-drug interaction studies with febuxostat, a novel non-purine selective inhibitor of xanthine oxidase: plasma protein binding, identification of metabolic enzymes and cytochrome P450 inhibition Xenobiotica. 2008 May;38(5):496-510. doi: 10.1080/00498250801956350. | ||||
| 35 | Metabolism, excretion and pharmacokinetics of [14C]glasdegib (PF-04449913) in healthy volunteers following oral administration. Xenobiotica. 2017 Dec;47(12):1064-1076. | ||||
| 36 | Ninlaro- European Medicines Agency - European Union | ||||
| 37 | The role of human CYP2C8 and CYP2C9 variants in pioglitazone metabolism in vitro. Basic Clin Pharmacol Toxicol. 2009 Dec;105(6):374-9. | ||||
| 38 | The pharmacology and clinical pharmacokinetics of apomorphine SL BJU Int. 2001 Oct;88 Suppl 3:18-21. doi: 10.1046/j.1464-4096.2001.00124.x. | ||||
| 39 | Genetic polymorphism of cytochrome P450 2D6 determines oestrogen receptor activity of the major infertility drug clomiphene via its active metabolites | ||||
| 40 | Body weight, gender and pregnancy affect enantiomer-specific ketorolac pharmacokinetics. Br J Clin Pharmacol. 2017 Sep;83(9):1966-1975. | ||||
| 41 | Viral target and metabolism-based rationale for combined use of recently authorized small molecule COVID-19 medicines: Molnupiravir, nirmatrelvir, and remdesivir | ||||
| 42 | Open-label, single-center, phase I trial to investigate the mass balance and absolute bioavailability of the highly selective oral MET inhibitor tepotinib in healthy volunteers | ||||
| 43 | Identification of Iminium Intermediates Generation in the Metabolism of Tepotinib Using LC-MS/MS: In Silico and Practical Approaches to Bioactivation Pathway Elucidation | ||||
| 44 | Pharmacokinetics and drug interactions of eslicarbazepine acetate Epilepsia. 2012 Jun;53(6):935-46. doi: 10.1111/j.1528-1167.2012.03519.x. | ||||
| 45 | Elimination of tucatinib, a small molecule kinase inhibitor of HER2, is primarily governed by CYP2C8 enantioselective oxidation of gem-dimethyl | ||||
| 46 | PharmGKB summary: caffeine pathway. Pharmacogenet Genomics. 2012 May;22(5):389-95. | ||||
| 47 | Interaction of cisapride with the human cytochrome P450 system: metabolism and inhibition studies. Drug Metab Dispos. 2000 Jul;28(7):789-800. | ||||
| 48 | Use of inhibitory monoclonal antibodies to assess the contribution of cytochromes P450 to human drug metabolism. Eur J Pharmacol. 2000 Apr 14;394(2-3):199-209. | ||||
| 49 | Reversible inhibition of four important human liver cytochrome P450 enzymes by diethylstilbestrol. Pharmazie. 2011 Mar;66(3):216-21. | ||||
| 50 | Clinical pharmacokinetics of ketoprofen enantiomers in wild type of Cyp 2c8 and Cyp 2c9 patients with rheumatoid arthritis Eur J Drug Metab Pharmacokinet. 2011 Sep;36(3):167-73. doi: 10.1007/s13318-011-0041-1. | ||||
| 51 | Identification of the human P450 enzymes involved in lansoprazole metabolism. J Pharmacol Exp Ther. 1996 May;277(2):805-16. | ||||
| 52 | Clinical pharmacokinetics and pharmacodynamics of the endothelin receptor antagonist macitentan | ||||
| 53 | Drug-drug and food-drug pharmacokinetic interactions with new insulinotropic agents repaglinide and nateglinide. Clin Pharmacokinet. 2007;46(2):93-108. | ||||
| 54 | Pioglitazone is metabolised by CYP2C8 and CYP3A4 in vitro: potential for interactions with CYP2C8 inhibitors. Basic Clin Pharmacol Toxicol. 2006 Jul;99(1):44-51. | ||||
| 55 | Differential expression and function of CYP2C isoforms in human intestine and liver. Pharmacogenetics. 2003 Sep;13(9):565-75. | ||||
| 56 | The xenobiotic inhibitor profile of cytochrome P4502C8. Br J Clin Pharmacol. 2000 Dec;50(6):573-80. | ||||
| 57 | Brigatinib: first global approval. Drugs. 2017 Jul;77(10):1131-1135. | ||||
| 58 | Metabolite profiling and reaction phenotyping for the in vitro assessment of the bioactivation of bromfenac. Chem Res Toxicol. 2020 Jan 21;33(1):249-257. | ||||
| 59 | Absorption, metabolism and excretion of [(14)C]-sotorasib in healthy male subjects: characterization of metabolites and a minor albumin-sotorasib conjugate | ||||
| 60 | Potential interaction between ritonavir and carbamazepine. Pharmacotherapy. 2000 Jul;20(7):851-4. | ||||
| 61 | Role of CYP3A4 in human hepatic diltiazem N-demethylation: inhibition of CYP3A4 activity by oxidized diltiazem metabolites. J Pharmacol Exp Ther. 1997 Jul;282(1):294-300. | ||||
| 62 | Comparison of 3-hydroxy-3-methylglutaryl coenzyme A (HMG-CoA) reductase inhibitors (statins) as inhibitors of cytochrome P450 2C8. Basic Clin Pharmacol Toxicol. 2005 Aug;97(2):104-8. | ||||
| 63 | Influence of CYP2C8 polymorphisms on the hydroxylation metabolism of paclitaxel, repaglinide and ibuprofen enantiomers in vitro. Biopharm Drug Dispos. 2013 Jul;34(5):278-87. | ||||
| 64 | Human cytochrome P450s involved in the metabolism of 9-cis- and 13-cis-retinoic acids | ||||
| 65 | Effects of rifampin on the pharmacokinetics of a single dose of istradefylline in healthy subjects. J Clin Pharmacol. 2018 Feb;58(2):193-201. | ||||
| 66 | In vitro metabolism study of buprenorphine: evidence for new metabolic pathways. Drug Metab Dispos. 2005 May;33(5):689-95. | ||||
| 67 | Drug interactions with lipid-lowering drugs: mechanisms and clinical relevance. Clin Pharmacol Ther. 2006 Dec;80(6):565-81. | ||||
| 68 | DrugBank(Pharmacology-Metabolism):Simvastatin | ||||
| 69 | Functional characterization of five novel CYP2C8 variants, G171S, R186X, R186G, K247R, and K383N, found in a Japanese population. Drug Metab Dispos. 2005 May;33(5):630-6. | ||||
| 70 | In vitro and in vivo oxidative metabolism and glucuronidation of anastrozole. Br J Clin Pharmacol. 2010 Dec;70(6):854-69. | ||||
| 71 | Azelastine N-demethylation by cytochrome P-450 (CYP)3A4, CYP2D6, and CYP1A2 in human liver microsomes: evaluation of approach to predict the contribution of multiple CYPs. Drug Metab Dispos. 1999 Dec;27(12):1381-91. | ||||
| 72 | Bedaquiline metabolism: enzymes and novel metabolites. Drug Metab Dispos. 2014 May;42(5):863-6. | ||||
| 73 | Effects of Rifamycin Coadministration on Bedaquiline Desmethylation in Healthy Adult Volunteers | ||||
| 74 | Clinical Pharmacokinetics and Pharmacodynamics of Cabozantinib Clin Pharmacokinet. 2017 May;56(5):477-491. doi: 10.1007/s40262-016-0461-9. | ||||
| 75 | Elucidation of individual cytochrome P450 enzymes involved in the metabolism of clozapine. Naunyn Schmiedebergs Arch Pharmacol. 1998 Nov;358(5):592-9. | ||||
| 76 | Human CYP2C19 is a major omeprazole 5-hydroxylase, as demonstrated with recombinant cytochrome P450 enzymes. Drug Metab Dispos. 1996 Oct;24(10):1081-7. | ||||
| 77 | Pazopanib, a new therapy for metastatic soft tissue sarcoma. Expert Opin Pharmacother. 2013 May;14(7):929-35. | ||||
| 78 | Identification of the human cytochrome P450 isoforms mediating in vitro N-dealkylation of perphenazine. Br J Clin Pharmacol. 2000 Dec;50(6):563-71. | ||||
| 79 | Identification of cytochromes P450 2C9 and 3A4 as the major catalysts of phenprocoumon hydroxylation in vitro. Eur J Clin Pharmacol. 2004 May;60(3):173-82. | ||||
| 80 | Novel Pathways of Ponatinib Disposition Catalyzed By CYP1A1 Involving Generation of Potentially Toxic Metabolites J Pharmacol Exp Ther. 2017 Oct;363(1):12-19. doi: 10.1124/jpet.117.243246. | ||||
| 81 | Possible involvement of multiple human cytochrome P450 isoforms in the liver metabolism of propofol. Br J Anaesth. 1998 Jun;80(6):788-95. | ||||
| 82 | Sulfamethoxazole and its metabolite nitroso sulfamethoxazole stimulate dendritic cell costimulatory signaling. J Immunol. 2007 May 1;178(9):5533-42. | ||||
| 83 | Mechanism-based inactivation of human cytochrome P4502C8 by drugs in vitro. J Pharmacol Exp Ther. 2004 Dec;311(3):996-1007. | ||||
| 84 | FDA label of Treprostinil. The 2020 official website of the U.S. Food and Drug Administration. | ||||
| 85 | Identification of the cytochrome P450 and other enzymes involved in the in vitro oxidative metabolism of a novel antidepressant, Lu AA21004. Drug Metab Dispos. 2012 Jul;40(7):1357-65. | ||||
| 86 | Apixaban. Hosp Pharm. 2013 Jun;48(6):494-509. | ||||
| 87 | Further characterization of the metabolism of desloratadine and its cytochrome P450 and UDP-glucuronosyltransferase inhibition potential: identification of desloratadine as a relatively selective UGT2B10 inhibitor. Drug Metab Dispos. 2015 Sep;43(9):1294-302. | ||||
| 88 | Roles of cytochromes P450 1A2, 2A6, and 2C8 in 5-fluorouracil formation from tegafur, an anticancer prodrug, in human liver microsomes. Drug Metab Dispos. 2000 Dec;28(12):1457-63. | ||||
| 89 | N-demethylation of levo-alpha-acetylmethadol by human placental aromatase. Biochem Pharmacol. 2004 Mar 1;67(5):885-92. | ||||
| 90 | The role of levomilnacipran in the management of major depressive disorder: a comprehensive review. Curr Neuropharmacol. 2016;14(2):191-9. | ||||
| 91 | Identification of cytochrome P450 isoforms involved in the metabolism of loperamide in human liver microsomes. Eur J Clin Pharmacol. 2004 Oct;60(8):575-81. | ||||
| 92 | Drug-drug interaction between losartan and paclitaxel in human liver microsomes with different CYP2C8 genotypes. Basic Clin Pharmacol Toxicol. 2015 Jun;116(6):493-8. | ||||
| 93 | Pharmacogenomics of statins: understanding susceptibility to adverse effects. Pharmgenomics Pers Med. 2016 Oct 3;9:97-106. | ||||
| 94 | Methadone metabolism and drug-drug interactions: in vitro and in vivo literature review. J Pharm Sci. 2018 Dec;107(12):2983-2991. | ||||
| 95 | Pharmacogenomics knowledge for personalized medicine Clin Pharmacol Ther. 2012 Oct;92(4):414-7. doi: 10.1038/clpt.2012.96. | ||||
| 96 | Characterization of a phase 1 metabolite of mycophenolic acid produced by CYP3A4/5. Ther Drug Monit. 2004 Dec;26(6):600-8. | ||||
| 97 | DrugBank(Pharmacology-Metabolism):Mycophenolic acid | ||||
| 98 | Effects of acid and lactone forms of eight HMG-CoA reductase inhibitors on CYP-mediated metabolism and MDR1-mediated transport. Pharm Res. 2006 Mar;23(3):506-12. | ||||
| 99 | Drug-interaction between paclitaxel and goshajinkigan extract and its constituents | ||||
| 100 | Colchicine down-regulates cytochrome P450 2B6, 2C8, 2C9, and 3A4 in human hepatocytes by affecting their glucocorticoid receptor-mediated regulation. Mol Pharmacol. 2003 Jul;64(1):160-9. | ||||
| 101 | Efficacy of piroxicam for postoperative pain after lower third molar surgery associated with CYP2C8*3 and CYP2C9 J Pain Res. 2017 Jul 6;10:1581-1589. | ||||
| 102 | Comparison of the safety, tolerability, and pharmacokinetic profile of a single oral dose of pitavastatin 4 mg in adult subjects with severe renal impairment not on hemodialysis versus healthy adult subjects. J Cardiovasc Pharmacol. 2012 Jul;60(1):42-8. | ||||
| 103 | Riociguat (adempas): a novel agent for the treatment of pulmonary arterial hypertension and chronic thromboembolic pulmonary hypertension. P T. 2014 Nov;39(11):749-58. | ||||
| 104 | Pharmacokinetics of dipeptidylpeptidase-4 inhibitors. Diabetes Obes Metab. 2010 Aug;12(8):648-58. | ||||
| 105 | Interaction of sorafenib and cytochrome P450 isoenzymes in patients with advanced melanoma: a phase I/II pharmacokinetic interaction study. Cancer Chemother Pharmacol. 2011 Nov;68(5):1111-8. | ||||
| 106 | Reduction of sulfamethoxazole and dapsone hydroxylamines by a microsomal enzyme system purified from pig liver and pig and human liver microsomes. Life Sci. 2005 May 27;77(2):205-19. | ||||
| 107 | Selective inhibition of CYP2C8 by fisetin and its methylated metabolite, geraldol, in human liver microsomes | ||||
| 108 | Polymorphisms of CYP2C8 Alter First-Electron Transfer Kinetics and Increase Catalytic Uncoupling | ||||
| 109 | The Quantification of Paclitaxel and Its Two Major Metabolites in Biological Samples by HPLC-MS/MS and Its Application in a Pharmacokinetic and Tumor Distribution Study in Xenograft Nude Mouse | ||||
| 110 | Cytochrome P450 2C8 and flavin-containing monooxygenases are involved in the metabolism of tazarotenic acid in humans. Drug Metab Dispos. 2003 Apr;31(4):476-81. | ||||
| 111 | Timolol metabolism in human liver microsomes is mediated principally by CYP2D6. Drug Metab Dispos. 2007 Jul;35(7):1135-41. | ||||
| 112 | Prediction of in vivo drug-drug interactions between tolbutamide and various sulfonamides in humans based on in vitro experiments. Drug Metab Dispos. 2000 Apr;28(4):475-81. | ||||
| 113 | Effect of genetic polymorphisms in cytochrome p450 (CYP) 2C9 and CYP2C8 on the pharmacokinetics of oral antidiabetic drugs: clinical relevance. Clin Pharmacokinet. 2005;44(12):1209-25. | ||||
| 114 | Development, validation and application of the liquid chromatography tandem mass spectrometry method for simultaneous quantification of azilsartan medoxomil (TAK-491), azilsartan (TAK-536), and its 2 metabolites in human plasma | ||||
| 115 | Drug Interactions with Angiotensin Receptor Blockers: Role of Human Cytochromes P450 | ||||
| 116 | Lithium Intoxication in the Elderly: A Possible Interaction between Azilsartan, Fluvoxamine, and Lithium | ||||
| 117 | Critical evaluation of the efficacy and tolerability of azilsartan | ||||
| 118 | Cytochrome P450 2C8 pharmacogenetics: a review of clinical studies. Pharmacogenomics. 2009 Sep;10(9):1489-510. | ||||
| 119 | CYP2C8/9 mediate dapsone N-hydroxylation at clinical concentrations of dapsone. Drug Metab Dispos. 2000 Aug;28(8):865-8. | ||||
| 120 | Eltrombopag-induced acute liver failure in a pediatric patient: a pharmacokinetic and pharmacogenetic analysis. Ther Drug Monit. 2018 Aug;40(4):386-388. | ||||
| 121 | LABEL:DDYI- flibanserin tablet, film coated | ||||
| 122 | Evaluation of the effects of the weak CYP3A inhibitors atorvastatin and ethinyl estradiol/norgestimate on lomitapide pharmacokinetics in healthy subjects. J Clin Pharmacol. 2016 Jan;56(1):47-55. | ||||
| 123 | Evidence that CYP2C19 is the major (S)-mephenytoin 4'-hydroxylase in humans. Biochemistry. 1994 Feb 22;33(7):1743-52. | ||||
| 124 | Identification of human cytochrome P(450)s that metabolise anti-parasitic drugs and predictions of in vivo drug hepatic clearance from in vitro data. Eur J Clin Pharmacol. 2003 Sep;59(5-6):429-42. | ||||
| 125 | Comparative studies on the cytochrome p450-associated metabolism and interaction potential of selegiline between human liver-derived in vitro systems. Drug Metab Dispos. 2003 Sep;31(9):1093-102. | ||||
| 126 | FDA Label of Uptravi. The 2020 official website of the U.S. Food and Drug Administration. | ||||
| 127 | Sigmoidal kinetic model for two co-operative substrate-binding sites in a cytochrome P450 3A4 active site: an example of the metabolism of diazepam and its derivatives. Biochem J. 1999 Jun 15;340 ( Pt 3):845-53. | ||||
| 128 | Cytochrome P450 isozymes responsible for the metabolism of toluene and styrene in human liver microsomes. Xenobiotica. 1997 Jul;27(7):657-65. | ||||
| 129 | Short communication: high prevalence of the cytochrome P450 2C8*2 mutation in Northern Ghana. Trop Med Int Health. 2005 Dec;10(12):1271-3. | ||||
| 130 | Metabolism and Interactions of Chloroquine and Hydroxychloroquine with Human Cytochrome P450 Enzymes and Drug Transporters Curr Drug Metab. 2020;21(14):1127-1135. doi: 10.2174/1389200221999201208211537. | ||||
| 131 | FDA Label of Enasidenib. The 2020 official website of the U.S. Food and Drug Administration. | ||||
| 132 | Halofantrine metabolism in microsomes in man: major role of CYP 3A4 and CYP 3A5. J Pharm Pharmacol. 1999 Apr;51(4):419-26. | ||||
| 133 | FDA label of Lorlatinib. The 2020 official website of the U.S. Food and Drug Administration. | ||||
| 134 | Genetically based impairment in CYP2C8- and CYP2C9-dependent NSAID metabolism as a risk factor for gastrointestinal bleeding: is a combination of pharmacogenomics and metabolomics required to improve personalized medicine? Expert Opin Drug Metab Toxicol. 2009 Jun;5(6):607-20. | ||||
| 135 | An Efficient UPLC-MS/MS Method Established to Detect Relugolix Concentration in Rat Plasma | ||||
| 136 | Trimethadione metabolism by human liver cytochrome P450: evidence for the involvement of CYP2E1. Xenobiotica. 1998 Nov;28(11):1041-7. | ||||
| 137 | FDA Label of Vosevi. The 2020 official website of the U.S. Food and Drug Administration. | ||||
| 138 | Preclinical Pharmacokinetics and First-in-Human Pharmacokinetics, Safety, and Tolerability of Velpatasvir, a Pangenotypic Hepatitis C Virus NS5A Inhibitor, in Healthy Subjects | ||||
| 139 | DrugBank(Pharmacology-Metabolism):Voxilaprevir | ||||
| 140 | DrugBank(Pharmacology-Metabolism):Elagolix sodium | ||||
| 141 | Pharmacokinetic comparison of the potential over-the-counter statins simvastatin, lovastatin, fluvastatin and pravastatin. Clin Pharmacokinet. 2008;47(7):463-74. | ||||
| 142 | Delta-9-Tetrahydrocannabinol and Cannabidiol Drug-Drug Interactions | ||||
| 143 | FDA label of Trifarotene. The 2020 official website of the U.S. Food and Drug Administration. | ||||
| 144 | Metabolism and disposition of pan-genotypic inhibitor of hepatitis C virus NS5A ombitasvir in humans. Drug Metab Dispos. 2016 Aug;44(8):1148-57. | ||||
| 145 | Loss of orally administered drugs in GI tract. Saudi Pharm J. 2012 Oct;20(4):331-44. | ||||
| 146 | Ketobemidone is a substrate for cytochrome P4502C9 and 3A4, but not for P-glycoprotein. Xenobiotica. 2005 Aug;35(8):785-96. | ||||
| 147 | Cardiovascular concentration-effect relationships of amodiaquine and its metabolite desethylamodiaquine: Clinical and preclinical studies. Br J Clin Pharmacol. 2023 Mar;89(3):1176-1186. doi: 10.1111/bcp.15569. | ||||
| 148 | Contribution of human hepatic cytochrome P450s and steroidogenic CYP17 to the N-demethylation of aminopyrine. Xenobiotica. 1999 Feb;29(2):187-93. | ||||
| 149 | Cytochrome P-450 3A4 and 2C8 are involved in zopiclone metabolism. Drug Metab Dispos. 1999 Sep;27(9):1068-73. | ||||
| 150 | Excretion and metabolism of milnacipran in humans after oral administration of milnacipran hydrochloride Drug Metab Dispos. 2012 Sep;40(9):1723-35. doi: 10.1124/dmd.112.045120. | ||||
| 151 | FDA LABEL:Milnacipran | ||||
| 152 | In vitro metabolism and inhibitory effects of pranlukast in human liver microsomes | ||||
| 153 | Evaluation of drug-drug interaction potential of beraprost sodium mediated by P450 in vitro. Yakugaku Zasshi. 2008 Oct;128(10):1459-65. | ||||
| 154 | Gemfibrozil and its glucuronide inhibit the organic anion transporting polypeptide 2 (OATP2/OATP1B1:SLC21A6)-mediated hepatic uptake and CYP2C8-mediated metabolism of cerivastatin: analysis of the mechanism of the clinically relevant drug-drug interaction between cerivastatin and gemfibrozil. J Pharmacol Exp Ther. 2004 Oct;311(1):228-36. | ||||
| 155 | Metabolism, Excretion, and Pharmacokinetics of Selumetinib, an MEK1/2 inhibitor, in Healthy Adult Male Subjects | ||||
| 156 | Effect of Kidney Function and Dialysis on the Pharmacokinetics and Pharmacodynamics of Roxadustat, an Oral Hypoxia-Inducible Factor Prolyl Hydroxylase Inhibitor | ||||
| 157 | Identification of cytochrome P450 enzymes involved in the metabolism of 4'-methoxy-alpha-pyrrolidinopropiophenone (MOPPP), a designer drug, in human liver microsomes. Xenobiotica. 2003 Oct;33(10):989-98. | ||||
| 158 | Involvement of multiple cytochrome P450 and UDP-glucuronosyltransferase enzymes in the in vitro metabolism of muraglitazar. Drug Metab Dispos. 2007 Jan;35(1):139-49. | ||||
| 159 | Biotransformation of Finerenone, a Novel Nonsteroidal Mineralocorticoid Receptor Antagonist, in Dogs, Rats, and Humans, In Vivo and In Vitro | ||||
| 160 | Aldosterone and Mineralocorticoid Receptor Signaling as Determinants of Cardiovascular and Renal Injury: From Hans Selye to the Present | ||||
| 161 | Results From Drug-Drug Interaction Studies In Vitro and In Vivo Investigating the Inhibitory Effect of Finerenone on the Drug Transporters BCRP, OATP1B1, and OATP1B3 | ||||
| 162 | Pharmacokinetics of the Novel, Selective, Non-steroidal Mineralocorticoid Receptor Antagonist Finerenone in Healthy Volunteers: Results from an Absolute Bioavailability Study and Drug-Drug Interaction Studies In Vitro and In Vivo | ||||
| 163 | The prokinetic cinitapride has no clinically relevant pharmacokinetic interaction and effect on QT during coadministration with ketoconazole. Drug Metab Dispos. 2007 Jul;35(7):1149-56. | ||||
| 164 | Metabolism and disposition of hepatitis C polymerase inhibitor dasabuvir in humans. Drug Metab Dispos. 2016 Aug;44(8):1139-47. | ||||
| 165 | Characterization of human cytochrome P450 enzymes catalyzing domperidone N-dealkylation and hydroxylation in vitro. Br J Clin Pharmacol. 2004 Sep;58(3):277-87. | ||||
| 166 | Characterization of the metabolism of fenretinide by human liver microsomes, cytochrome P450 enzymes and UDP-glucuronosyltransferases. Br J Pharmacol. 2011 Feb;162(4):989-99. | ||||
| 167 | Effects of arachidonic acid, prostaglandins, retinol, retinoic acid and cholecalciferol on xenobiotic oxidations catalysed by human cytochrome P450 enzymes. Xenobiotica. 1999 Mar;29(3):231-41. | ||||
| 168 | CYP26C1 is a hydroxylase of multiple active retinoids and interacts with cellular retinoic acid binding proteins. Mol Pharmacol. 2018 May;93(5):489-503. | ||||
| 169 | Metabolism and disposition of the SGLT2 inhibitor bexagliflozin in rats, monkeys and humans | ||||
| 170 | Effects of gemfibrozil, itraconazole, and their combination on the pharmacokinetics of pioglitazone. Clin Pharmacol Ther. 2005 May;77(5):404-14. | ||||
| 171 | Cytochromes P450 2C8 and 3A Catalyze the Metabolic Activation of the Tyrosine Kinase Inhibitor Masitinib | ||||
| 172 | Absorption, Distribution, Metabolism, and Excretion of [(14)C]iptacopan in Healthy Male Volunteers and in In Vivo and In Vitro Studies | ||||
| 173 | Disposition and metabolism of semagacestat, a {gamma}-secretase inhibitor, in humans. Drug Metab Dispos. 2010 Apr;38(4):554-65. | ||||
| 174 | DrugBank(Pharmacology-Metabolism):TAK-491 | ||||
| 175 | Evaluation of in vitro drug interactions with karenitecin, a novel, highly lipophilic camptothecin derivative in phase II clinical development. J Clin Pharmacol. 2003 Sep;43(9):1008-14. | ||||
| 176 | DrugBank(Pharmacology-Metabolism):MRTX849 | ||||
| 177 | DrugBank(Pharmacology-Metabolism):Ag-221 | ||||
| 178 | In vitro metabolism of rivoglitazone, a novel peroxisome proliferator-activated receptor gama agonist, in rat, monkey, and human liver microsomes and freshly isolated hepatocytes. Drug Metab Dispos. 2011 Jul;39(7):1311-9. | ||||
| 179 | Pharmacokinetics and disposition of momelotinib revealed a disproportionate human metabolite-resolution for clinical development. Drug Metab Dispos. 2018 Mar;46(3):237-247. | ||||
| 180 | Quantitative Assessment of Elagolix Enzyme-Transporter Interplay and Drug-Drug Interactions Using Physiologically Based Pharmacokinetic Modeling | ||||
| 181 | A Pharmacokinetic, Safety, and Tolerability Trial of Palovarotene in Healthy Japanese and Non-Japanese Participants | ||||
| 182 | Accelerating Clinical Development of Idasanutlin through a Physiologically Based Pharmacokinetic Modeling Risk Assessment for CYP450 Isoenzyme-Related Drug-Drug Interactions | ||||
| 183 | Lactobacillus rhamnosus induces CYP3A and changes the pharmacokinetics of verapamil in rats | ||||
| 184 | A Mechanistic, Enantioselective, Physiologically Based Pharmacokinetic Model of Verapamil and Norverapamil, Built and Evaluated for Drug-Drug Interaction Studies | ||||
| 185 | In vitro characterization of sarizotan metabolism: hepatic clearance, identification and characterization of metabolites, drug-metabolizing enzyme identification, and evaluation of cytochrome p450 inhibition. Drug Metab Dispos. 2010 Jun;38(6):905-16. | ||||
| 186 | Increased serum amiodarone concentration in hypertriglyceridemic patients: Effects of drug distribution to serum lipoproteins | ||||
| 187 | The Effect of Modafinil on the Safety and Pharmacokinetics of Lorlatinib: A Phase I Study in Healthy Participants | ||||
| 188 | Phenotypic and metabolic investigation of a CSF-1R kinase receptor inhibitor (BLZ945) and its pharmacologically active metabolite | ||||
| 189 | Pharmacokinetics, pharmacodynamics and safety of single, oral doses of GSK1278863, a novel HIF-prolyl hydroxylase inhibitor, in healthy Japanese and Caucasian subjects. Drug Metab Pharmacokinet. 2015 Dec;30(6):410-8. | ||||
| 190 | Pharmacokinetics, metabolism, and excretion of licogliflozin, a dual inhibitor of SGLT1/2, in rats, dogs, and humans | ||||
| 191 | First-in-human pharmacokinetic and pharmacodynamic study of the dual m-TORC 1/2 inhibitor AZD2014. Clin Cancer Res. 2015 Aug 1;21(15):3412-9. | ||||
| 192 | Evaluation of the Absorption, Metabolism, and Excretion of a Single Oral 1-mg Dose of Tropifexor in Healthy Male Subjects and the Concentration Dependence of Tropifexor Metabolism | ||||
| 193 | DrugBank(Pharmacology-Metabolism):AP26113 | ||||
| 194 | Predicting the drug interaction potential of AMG 853, a dual antagonist of the D-prostanoid and chemoattractant receptor-homologous molecule expressed on T helper 2 cells receptors | ||||
| 195 | Phosphonate O-deethylation of [4-(4-bromo-2-cyano-phenylcarbamoyl) benzyl]-phosphonic acid diethyl ester, a lipoprotein lipase-promoting agent, catalyzed by cytochrome P450 2C8 and 3A4 in human liver microsomes | ||||
| 196 | Oxidative metabolism of razuprotafib (AKB-9778), a sulfamic acid phosphatase inhibitor, in human microsomes and recombinant human CYP2C8 enzyme | ||||
| 197 | Pharmacokinetics, tissue distribution and identification of putative metabolites of JI-101 - a novel triple kinase inhibitor in rats | ||||
| 198 | Metabolism and Disposition of Verinurad, a Uric Acid Reabsorption Inhibitor, in Humans | ||||
| 199 | Disposition and metabolic profiling of [(14)C]cerlapirdine using accelerator mass spectrometry | ||||
| 200 | Effect of human flavin-containing monooxygenase 3 polymorphism on the metabolism of aurora kinase inhibitors | ||||
| 201 | In vitro metabolism, pharmacokinetics and drug interaction potentials of emvododstat, a DHODH inhibitor | ||||
| 202 | Pre-clinical Characterization of Absorption, Distribution, Metabolism and Excretion Properties of TAK-063 | ||||
| 203 | Evaluation of the drug-drug interaction potential for trazpiroben (TAK-906), a D(2)/D(3) receptor antagonist for gastroparesis, towards cytochrome P450s and transporters | ||||
| 204 | Review of Clinically Relevant Drug Interactions with Next Generation Hepatitis C Direct-acting Antiviral Agents | ||||
| 205 | DrugBank(Pharmacology-Metabolism):KD025 | ||||
| 206 | Pharmacokinetics, safety, and CCR2/CCR5 antagonist activity of cenicriviroc in participants with mild or moderate hepatic impairment. Clin Transl Sci. 2016 Jun;9(3):139-48. | ||||
| 207 | Safety, Tolerability and Pharmacokinetics of Vidofludimus calcium (IMU-838) After Single and Multiple Ascending Oral Doses in Healthy Male Subjects | ||||
| 208 | Identification of enzymes responsible for primary and sequential oxygenation reactions of capravirine in human liver microsomes. Drug Metab Dispos. 2006 Nov;34(11):1798-802. | ||||
| 209 | In vitro metabolism of irosustat, a novel steroid sulfatase inhibitor: interspecies comparison, metabolite identification, and metabolic enzyme identification | ||||
| 210 | Disposition and metabolism of the cathepsin K inhibitor odanacatib in humans. Drug Metab Dispos. 2014 May;42(5):818-27. | ||||
| 211 | Metabolism and pharmacokinetics of allitinib in cancer patients: the roles of cytochrome P450s and epoxide hydrolase in its biotransformation | ||||
| 212 | Nonclinical pharmacokinetics and in vitro metabolism of H3B-6545, a novel selective ERalpha covalent antagonist (SERCA). Cancer Chemother Pharmacol. 2019 Jan;83(1):151-160. | ||||
| 213 | Steady-state pharmacokinetics of a new antipsychotic agent perospirone and its active metabolite, and its relationship with prolactin response. Ther Drug Monit. 2004 Aug;26(4):361-5. | ||||
| 214 | In vitro metabolism of 17-(dimethylaminoethylamino)-17-demethoxygeldanamycin in human liver microsomes | ||||
| 215 | In vitro and in vivo clinical pharmacology of dimethyl benzoylphenylurea, a novel oral tubulin-interactive agent | ||||
| 216 | Phase I study of continuous weekly dosing of dimethylamino benzoylphenylurea (BPU) in patients with solid tumours | ||||
| 217 | Complete substrate inhibition of cytochrome P450 2C8 by AZD9496, an oral selective estrogen receptor degrader. Drug Metab Dispos. 2018 Sep;46(9):1268-1276. | ||||
| 218 | DrugBank(Pharmacology-Metabolism):ARRY-380 | ||||
| 219 | Cilomilast: a second generation phosphodiesterase 4 inhibitor for asthma and chronic obstructive pulmonary disease | ||||
| 220 | Disposition and metabolism of darapladib, a lipoprotein-associated phospholipase A2 inhibitor, in humans | ||||
| 221 | In vitro metabolism of 7 neuronal nicotinic receptor agonist AZD0328 and enzyme identification for its N-oxide metabolite | ||||
| 222 | Behavior of thymidylate kinase toward monophosphate metabolites and its role in the metabolism of 1-(2'-deoxy-2'-fluoro-beta-L-arabinofuranosyl)-5-methyluracil (Clevudine) and 2',3'-didehydro-2',3'-dideoxythymidine in cells. Antimicrob Agents Chemother. 2005 May;49(5):2044-9. doi: 10.1128/AAC.49.5.2044-2049.2005. | ||||
| 223 | Exposure and response analysis of aleglitazar on cardiovascular risk markers and safety outcomes: an analysis of the AleCardio trial. Diabetes Obes Metab. 2020 Jan;22(1):30-38. | ||||
| 224 | Identification of cytochromes P450 involved in the human liver microsomal metabolism of the thromboxane A2 inhibitor seratrodast (ABT-001). Drug Metab Dispos. 1997 Jan;25(1):110-5. | ||||
| 225 | Role of cytochrome P450 enzymes in the bioactivation of polyunsaturated fatty acids. Biochim Biophys Acta. 2011 Jan;1814(1):210-22. | ||||
| 226 | The omega-hydroxlyation of lauric acid: oxidation of 12-hydroxlauric acid to dodecanedioic acid by a purified recombinant fusion protein containing P450 4A1 and NADPH-P450 reductase | ||||
| 227 | Cytochrome P450 4A11 inhibition assays based on characterization of lauric acid metabolites | ||||
| 228 | Characterization of human cytochrome P450 enzymes involved in the metabolism of cyamemazine. Eur J Pharm Sci. 2007 Dec;32(4-5):357-66. | ||||
| 229 | The metabolism of diclofenac--enzymology and toxicology perspectives | ||||
| 230 | Diazinon, chlorpyrifos and parathion are metabolised by multiple cytochromes P450 in human liver. Toxicology. 2006 Jul 5;224(1-2):22-32. | ||||
| 231 | High-performance liquid chromatographic determination of seratrodast and its metabolites in human serum and urine | ||||
| 232 | Clinical pharmacokinetics of almotriptan, a serotonin 5-HT(1B/1D) receptor agonist for the treatment of migraine. Clin Pharmacokinet. 2005;44(3):237-46. | ||||
| 233 | Cytochromes P450: a structure-based summary of biotransformations using representative substrates Drug Metab Rev. 2008;40(1):1-100. doi: 10.1080/03602530802309742. | ||||
| 234 | Determination of the cardiac drug amiodarone and its N-desethyl metabolite in sludge samples | ||||
| 235 | Amiodarone and concurrent antiretroviral therapy: a case report and review of the literature | ||||
| 236 | The metabolism of amiodarone by various CYP isoenzymes of human and rat, and the inhibitory influence of ketoconazole. J Pharm Pharm Sci. 2008;11(1):147-59. | ||||
| 237 | Apalutamide Absorption, Metabolism, and Excretion in Healthy Men, and Enzyme Reaction in Human Hepatocytes Drug Metab Dispos. 2019 May;47(5):453-464. doi: 10.1124/dmd.118.084517. | ||||
| 238 | Apixaban. After hip or knee replacement: LMWH remains the standard treatment. Prescrire Int. 2012 Sep;21(130):201-2, 204. | ||||
| 239 | Phase I study of orally administered (14)Carbon-isotope labelled-vistusertib (AZD2014), a dual TORC1/2 kinase inhibitor, to assess the absorption, metabolism, excretion, and pharmacokinetics in patients with advanced solid malignancies | ||||
| 240 | LABEL: JUXTAPID- lomitapide mesylate capsule | ||||
| 241 | Glucuronidation as a major metabolic clearance pathway of 14c-labeled muraglitazar in humans: metabolic profiles in subjects with or without bile collection Drug Metab Dispos. 2006 Mar;34(3):427-39. doi: 10.1124/dmd.105.007617. | ||||
| 242 | U. S. FDA Label -BNP-1350 | ||||
| 243 | A phase I open-label study investigating the disposition of [14C]-cabazitaxel in patients with advanced solid tumors Anticancer Drugs. 2015 Mar;26(3):350-8. doi: 10.1097/CAD.0000000000000185. | ||||
| 244 | Urine caffeine metabolites are positively associated with cognitive performance in older adults: An analysis of US National Health and Nutrition Examination Survey (NHANES) 2011 to 2014. Nutr Res. 2023 Jan;109:12-25. doi: 10.1016/j.nutres.2022.11.002. | ||||
| 245 | Carbamazepine and its metabolites in human perfused placenta and in maternal and cord blood Epilepsia. 1995 Mar;36(3):241-8. doi: 10.1111/j.1528-1157.1995.tb00991.x. | ||||
| 246 | Celecoxib pathways: pharmacokinetics and pharmacodynamics. Pharmacogenet Genomics. 2012 Apr;22(4):310-8. | ||||
| 247 | DrugBank(Pharmacology-Metabolism)Cerivastatin | ||||
| 248 | Clinical pharmacokinetics and metabolism of chloroquine. Focus on recent advancements Clin Pharmacokinet. 1996 Oct;31(4):257-74. doi: 10.2165/00003088-199631040-00003. | ||||
| 249 | Cytochrome P450 2C8 and CYP3A4/5 are involved in chloroquine metabolism in human liver microsomes. Arch Pharm Res. 2003 Aug;26(8):631-7. | ||||
| 250 | In Vitro metabolism of ciclesonide in human lung and liver precision-cut tissue slices Biopharm Drug Dispos. 2006 May;27(4):197-207. doi: 10.1002/bdd.500. | ||||
| 251 | Clinical pharmacology of Cilomilast | ||||
| 252 | Active cyamemazine metabolites in patients treated with cyamemazine (Tercian?): influence on cerebral dopamine D2 and serotonin 5-HT (2A) receptor occupancy as measured by positron emission tomography (PET) | ||||
| 253 | Metabolism and disposition of oral dabrafenib in cancer patients: proposed participation of aryl nitrogen in carbon-carbon bond cleavage via decarboxylation following enzymatic oxidation | ||||
| 254 | A long-standing mystery solved: the formation of 3-hydroxydesloratadine is catalyzed by CYP2C8 but prior glucuronidation of desloratadine by UDP-glucuronosyltransferase 2B10 is an obligatory requirement Drug Metab Dispos. 2015 Apr;43(4):523-33. doi: 10.1124/dmd.114.062620. | ||||
| 255 | Plasma and synovial fluid concentrations of diclofenac sodium and its major hydroxylated metabolites during long-term treatment of rheumatoid arthritis Eur J Clin Pharmacol. 1983;25(3):389-94. doi: 10.1007/BF01037953. | ||||
| 256 | Simultaneous determination of diclofenac sodium and its hydroxy metabolites by capillary column gas chromatography with electron-capture detection J Chromatogr. 1981 Nov 6;217:263-71. doi: 10.1016/s0021-9673(00)88081-4. | ||||
| 257 | Eltrombopag for use in children with immune thrombocytopenia. Blood Adv. 2018 Feb 27;2(4):454-461. | ||||
| 258 | FDA:Enasidenib | ||||
| 259 | Pharmacokinetic Aspects of the Two Novel Oral Drugs Used for Metastatic Castration-Resistant Prostate Cancer: Abiraterone Acetate and Enzalutamide | ||||
| 260 | Clinical Pharmacokinetic Studies of Enzalutamide | ||||
| 261 | Absorption, Distribution, Metabolism, and Excretion of the Androgen Receptor Inhibitor Enzalutamide in Rats and Dogs | ||||
| 262 | In Vitro Characterization of Ertugliflozin Metabolism by UDP-Glucuronosyltransferase and Cytochrome P450 Enzymes Drug Metab Dispos. 2020 Dec;48(12):1350-1363. doi: 10.1124/dmd.120.000171. | ||||
| 263 | Pharmacokinetics, metabolism, and excretion of the antidiabetic agent ertugliflozin (PF-04971729) in healthy male subjects Drug Metab Dispos. 2013 Feb;41(2):445-56. doi: 10.1124/dmd.112.049551. | ||||
| 264 | Characterization of the oxidative metabolites of 17beta-estradiol and estrone formed by 15 selectively expressed human cytochrome p450 isoforms. Endocrinology. 2003 Aug;144(8):3382-98. | ||||
| 265 | Synthetic and natural compounds that interact with human cytochrome P450 1A2 and implications in drug development. Curr Med Chem. 2009;16(31):4066-218. | ||||
| 266 | Development of a novel tandem mass spectrometry method for the quantification of eszopiclone without interference from 2-amino-5-chloropyridine and application in a pharmacokinetic study of rat J Pharm Biomed Anal. 2020 Sep 5;188:113363. doi: 10.1016/j.jpba.2020.113363. | ||||
| 267 | Sulfotransferase 1E1 is a low km isoform mediating the 3-O-sulfation of ethinyl estradiol Drug Metab Dispos. 2004 Nov;32(11):1299-303. doi: 10.1124/dmd.32.11.. | ||||
| 268 | In vitro drug-drug interaction studies with febuxostat, a novel non-purine selective inhibitor of xanthine oxidase: plasma protein binding, identification of metabolic enzymes and cytochrome P450 inhibition. Xenobiotica. 2008 May;38(5):496-510. | ||||
| 269 | Identification of Hypoxia-inducible factor (HIF) stabilizer roxadustat and its possible metabolites in thoroughbred horses for doping control | ||||
| 270 | Roles of different CYP enzymes in the formation of specific fluvastatin metabolites by human liver microsomes. Basic Clin Pharmacol Toxicol. 2009 Nov;105(5):327-32. | ||||
| 271 | Metabolism and transport of oxazaphosphorines and the clinical implications Drug Metab Rev. 2005;37(4):611-703. doi: 10.1080/03602530500364023. | ||||
| 272 | Assessment of ifosfamide pharmacokinetics, toxicity, and relation to CYP3A4 activity as measured by the erythromycin breath test in patients with sarcoma Cancer. 2007 Jun 1;109(11):2315-22. doi: 10.1002/cncr.22669. | ||||
| 273 | The single dose kinetics of chloroquine and its major metabolite desethylchloroquine in healthy subjects | ||||
| 274 | Pharmacokinetics and metabolism of NO-1886, a lipoprotein lipase-promoting agent, in cynomolgus monkey | ||||
| 275 | The KEGG resource for deciphering the genome | ||||
| 276 | Role of cytochrome P450 activity in the fate of anticancer agents and in drug resistance: focus on tamoxifen, paclitaxel and imatinib metabolism | ||||
| 277 | Participation of CYP2C8 and CYP3A4 in the N-demethylation of imatinib in human hepatic microsomes | ||||
| 278 | In vitro biotransformation of imatinib by the tumor expressed CYP1A1 and CYP1B1 | ||||
| 279 | Clinical pharmacokinetics of ketoprofen enantiomers in wild type of Cyp 2c8 and Cyp 2c9 patients with rheumatoid arthritis. Eur J Drug Metab Pharmacokinet. 2011 Sep;36(3):167-73. | ||||
| 280 | Characterization and quantification of metabolites of racemic ketoprofen excreted in urine following oral administration to man by 1H-NMR spectroscopy, directly coupled HPLC-MS and HPLC-NMR, and circular dichroism Xenobiotica. 2004 Nov-Dec;34(11-12):1075-89. doi: 10.1080/00498250412331281098. | ||||
| 281 | Identification and structural characterization of in vivo metabolites of ketorolac using liquid chromatography electrospray ionization tandem mass spectrometry (LC/ESI-MS/MS) J Mass Spectrom. 2012 Jul;47(7):919-31. doi: 10.1002/jms.3043. | ||||
| 282 | Label:KLH-2109 | ||||
| 283 | Metabolic intermediate complex formation of human cytochrome P450 3A4 by lapatinib Drug Metab Dispos. 2011 Jun;39(6):1022-30. doi: 10.1124/dmd.110.037531. | ||||
| 284 | Pharmacokinetics and metabolism of LNP023 in rats by liquid chromatography combined with electrospray ionization-tandem mass spectrometry | ||||
| 285 | Advances in high-resolution MS and hepatocyte models solve a long-standing metabolism challenge: the loratadine story. Bioanalysis. 2016 Aug;8(16):1645-62. | ||||
| 286 | #N/A | ||||
| 287 | In vitro metabolism of perospirone in rat, monkey and human liver microsomes | ||||
| 288 | The wide variability of perospirone metabolism and the effect of perospirone on prolactin in psychiatric patients | ||||
| 289 | Antimicrobial Resistance, Virulence Factor-Encoding Genes, and Biofilm-Forming Ability of Community-Associated Uropathogenic Escherichia coli in Western Saudi Arabia | ||||
| 290 | Meals, Microbiota and Mental Health in Children and Adolescents (MMM-Study): A protocol for an observational longitudinal case-control study | ||||
| 291 | Corrigendum to: Physiologically-based pharmacokinetic modeling to evaluate in vitro-to-in vivo extrapolation for intestinal P-glycoprotein inhibition | ||||
| 292 | Transient and resident pathogens: Intra-facility genetic diversity of Listeria monocytogenes and Salmonella from food production environments | ||||
| 293 | Insufficient yet improving involvement of the global south in top sustainability science publications | ||||
| 294 | A prospective longitudinal study of growth in twin gestations compared with growth in singleton pregnancies. I. The fetal head J Ultrasound Med. 1991 Aug;10(8):439-43. doi: 10.7863/jum.1991.10.8.439. | ||||
| 295 | Metabolism of Meloxicam in human liver involves cytochromes P4502C9 and 3A4. Xenobiotica. 1998 Jan;28(1):1-13. | ||||
| 296 | Genetic variation in the first-pass metabolism of ethinylestradiol, sex hormone binding globulin levels and venous thrombosis risk Eur J Intern Med. 2017 Jul;42:54-60. doi: 10.1016/j.ejim.2017.05.019. | ||||
| 297 | Metabolism of 17 alpha-ethinylestradiol by human liver microsomes in vitro: aromatic hydroxylation and irreversible protein binding of metabolites J Clin Endocrinol Metab. 1974 Dec;39(6):1072-80. doi: 10.1210/jcem-39-6-1072. | ||||
| 298 | Metamizole (Dipyrone) and the Liver: A Review of the Literature J Clin Pharmacol. 2019 Nov;59(11):1433-1442. doi: 10.1002/jcph.1512. | ||||
| 299 | Clinical pharmacokinetics of dipyrone and its metabolites Clin Pharmacokinet. 1995 Mar;28(3):216-34. doi: 10.2165/00003088-199528030-00004. | ||||
| 300 | Effects of cytochrome P450 single nucleotide polymorphisms on methadone metabolism and pharmacodynamics | ||||
| 301 | In vitro metabolism of montelukast by cytochrome P450s and UDP-glucuronosyltransferases. Drug Metab Dispos. 2015 Dec;43(12):1905-16. | ||||
| 302 | DrugBank(Pharmacology-Metabolism):Adagrasib | ||||
| 303 | DrugBank(Pharmacology-Metabolism):Mycophenolate mofetil | ||||
| 304 | Identification of human cytochrome P450 isozymes involved in the metabolism of naftopidil enantiomers in vitro. J Pharm Pharmacol. 2014 Nov;66(11):1534-51. | ||||
| 305 | Characterization of Ca(2+)-antagonistic effects of three metabolites of the new antihypertensive agent naftopidil, (naphthyl)hydroxy-naftopidil, (phenyl)hydroxy-naftopidil, and O-desmethyl-naftopidil J Cardiovasc Pharmacol. 1991 Dec;18(6):918-25. doi: 10.1097/00005344-199112000-00020. | ||||
| 306 | S-Naproxen and desmethylnaproxen glucuronidation by human liver microsomes and recombinant human UDP-glucuronosyltransferases (UGT): role of UGT2B7 in the elimination of naproxen. Br J Clin Pharmacol. 2005 Oct;60(4):423-33. | ||||
| 307 | [Pharmacokinetics of phenazone after bilateral ovariectomy in female rabbits] | ||||
| 308 | Inhibitory effects of nicardipine to cytochrome P450 (CYP) in human liver microsomes. Biol Pharm Bull. 2005 May;28(5):882-5. | ||||
| 309 | Metabolic pro?ling of tyrosine kinase inhibitor nintedanib using metabolomics J Pharm Biomed Anal. 2020 Feb 20;180:113045. doi: 10.1016/j.jpba.2019.113045. | ||||
| 310 | DrugBank(Pharmacology-Metabolism)Olodaterol hydrochloride | ||||
| 311 | Absorption, Metabolism, and Excretion, In Vitro Pharmacology, and Clinical Pharmacokinetics of Ozanimod, a Novel Sphingosine 1-Phosphate Receptor Modulator | ||||
| 312 | Noise in an ac biased junction: Nonstationary Aharonov-Bohm effect Phys Rev Lett. 1994 Jan 24;72(4):538-541. doi: 10.1103/PhysRevLett.72.538. | ||||
| 313 | Pazopanib: the newest tyrosine kinase inhibitor for the treatment of advanced or metastatic renal cell carcinoma. Drugs. 2011 Mar 5;71(4):443-54. | ||||
| 314 | Bioavailability, metabolism and disposition of oral pazopanib in patients with advanced cancer Xenobiotica. 2013 May;43(5):443-53. doi: 10.3109/00498254.2012.734642. | ||||
| 315 | Anti-Parkinson's disease drugs and pharmacogenetic considerations Expert Opin Drug Metab Toxicol. 2013 Jul;9(7):859-74. doi: 10.1517/17425255.2013.789018. | ||||
| 316 | DrugBank(Pharmacology-Metabolism)Phenobarbital | ||||
| 317 | Simultaneous quantitation of pioglitazone and its metabolites in human serum by liquid chromatography and solid phase extraction J Pharm Biomed Anal. 1996 Feb;14(4):465-73. doi: 10.1016/0731-7085(95)01665-1. | ||||
| 318 | Metabolic fate of pitavastatin, a new inhibitor of HMG-CoA reductase: human UDP-glucuronosyltransferase enzymes involved in lactonization. Xenobiotica. 2003 Jan;33(1):27-41. | ||||
| 319 | Novel pathways of ponatinib disposition catalyzed by CYP1A1 involving generation of potentially toxic metabolites. J Pharmacol Exp Ther. 2017 Oct;363(1):12-19. | ||||
| 320 | Absorption, metabolism, and excretion of [(14)C]ponatinib after a single oral dose in humans Cancer Chemother Pharmacol. 2017 Mar;79(3):507-518. doi: 10.1007/s00280-017-3240-x. | ||||
| 321 | In vitro metabolites characterization of ponatinib in human liver microsomes using ultra-high performance liquid chromatography combined with Q-Exactive-Orbitrap tandem mass spectrometry Biomed Chromatogr. 2020 Jun;34(6):e4819. doi: 10.1002/bmc.4819. | ||||
| 322 | Different effects of SLCO1B1 polymorphism on the pharmacokinetics and pharmacodynamics of repaglinide and nateglinide | ||||
| 323 | Bioanalytical method for in vitro metabolism study of repaglinide using 96-blade thin-film solid-phase microextraction and LC-MS/MS | ||||
| 324 | Repaglinide-gemfibrozil drug interaction: inhibition of repaglinide glucuronidation as a potential additional contributing mechanism. Br J Clin Pharmacol. 2010 Dec;70(6):870-80. | ||||
| 325 | Simultaneous quantification of rosiglitazone and its two major metabolites, N-desmethyl and p-hydroxy rosiglitazone in human plasma by liquid chromatography/tandem mass spectrometry: application to a pharmacokinetic study | ||||
| 326 | Simultaneous Determination of Rosuvastatin, Rosuvastatin-5?S-lactone, and N-desmethyl Rosuvastatin in Human Plasma by UPLC-MS/MS and Its Application to Clinical Study | ||||
| 327 | FDA LABEL:elexipag | ||||
| 328 | Application of liquid chromatography-electrospray ionization-ion trap mass spectrometry to investigate the metabolism of silibinin in human liver microsomes | ||||
| 329 | Metabolism, Transport and Drug-Drug Interactions of Silymarin | ||||
| 330 | A comparison of the effects of 3-hydroxy-3-methylglutaryl-coenzyme a (HMG-CoA) reductase inhibitors on the CYP3A4-dependent oxidation of mexazolam in vitro. Drug Metab Dispos. 2001 Mar;29(3):282-8. | ||||
| 331 | Metabolism and excretion of the dipeptidyl peptidase 4 inhibitor [14C]sitagliptin in humans | ||||
| 332 | Absorption, Distribution, Metabolism, and Excretion of [(14)C]-Sotorasib in Rats and Dogs: Interspecies Differences in Absorption, Protein Conjugation and Metabolism | ||||
| 333 | Identification of cytochrome P450 and arylamine N-acetyltransferase isoforms involved in sulfadiazine metabolism. Drug Metab Dispos. 2005 Jul;33(7):969-76. | ||||
| 334 | The effect of cimetidine on the formation of sulfamethoxazole hydroxylamine in patients with human immunodeficiency virus. J Clin Pharmacol. 1998 May;38(5):463-6. | ||||
| 335 | Clinical pharmacokinetics and drug metabolism of tazarotene: a novel topical treatment for acne and psoriasis Clin Pharmacokinet. 1999 Oct;37(4):273-87. doi: 10.2165/00003088-199937040-00001. | ||||
| 336 | LABEL:AZAROTENE aerosol, foam | ||||
| 337 | Pharmacokinetics and metabolism of temazepam in man and several animal species Br J Clin Pharmacol. 1979;8(1):23S-29S. doi: 10.1111/j.1365-2125.1979.tb00451.x. | ||||
| 338 | Human liver microsomal diazepam metabolism using cDNA-expressed cytochrome P450s: role of CYP2B6, 2C19 and the 3A subfamily. Xenobiotica. 1996 Nov;26(11):1155-66. | ||||
| 339 | Temsirolimus metabolic pathways revisited Xenobiotica. 2020 Jun;50(6):640-653. doi: 10.1080/00498254.2019.1678793. | ||||
| 340 | Multiple cytochrome P-450s involved in the metabolism of terbinafine suggest a limited potential for drug-drug interactions. Drug Metab Dispos. 1999 Sep;27(9):1029-38. | ||||
| 341 | A multi-residue chiral liquid chromatography coupled with tandem mass spectrometry method for analysis of antifungal agents and their metabolites in aqueous environmental matrices. Anal Methods. 2021 Jun 14;13(22):2466-2477. doi: 10.1039/d1ay00556a. | ||||
| 342 | Simultaneous determination of torasemide and its major metabolite M5 in human urine by high-performance liquid chromatography-electrochemical detection | ||||
| 343 | Retinoic acid metabolism and mechanism of action: a review | ||||
| 344 | LABEL:KLIEF- trifarotene cream | ||||
| 345 | Oxidation of troglitazone to a quinone-type metabolite catalyzed by cytochrome P-450 2C8 and P-450 3A4 in human liver microsomes. Drug Metab Dispos. 1999 Nov;27(11):1260-6. | ||||
| 346 | Intestinal motility and its disorders Scand J Urol Nephrol Suppl. 1992;142:18-21. | ||||
| 347 | A simple and sensitive HPLC-FL method for bioanalysis of velpatasvir, a novel hepatitis C virus NS5A inhibitor, in rat plasma: Investigation of factors determining its oral bioavailability J Chromatogr B Analyt Technol Biomed Life Sci. 2022 Oct 1;1208:123399. doi: 10.1016/j.jchromb.2022.123399. | ||||
| 348 | Vortioxetine: clinical pharmacokinetics and drug interactions. Clin Pharmacokinet. 2018 Jun;57(6):673-686. | ||||
| 349 | Comparative pharmacokinetics of vitamin K antagonists: warfarin, phenprocoumon and acenocoumarol. Clin Pharmacokinet. 2005;44(12):1227-46. | ||||
| 350 | Substrates, inducers, inhibitors and structure-activity relationships of human Cytochrome P450 2C9 and implications in drug development Curr Med Chem. 2009;16(27):3480-675. doi: 10.2174/092986709789057635. | ||||
| 351 | Metabolism and pharmacokinetics of the combination Zidovudine plus Lamivudine in the adult Erythrocebus patas monkey determined by liquid chromatography-tandem mass spectrometric analysis | ||||
| 352 | Distribution of zopiclone and main metabolites in hair following a single dose | ||||
If you find any error in data or bug in web service, please kindly report it to Dr. Yin and Dr. Li.