Details of Drug-Metabolizing Enzyme (DME)
| Full List of Drug(s) Metabolized by This DME | |||||
|---|---|---|---|---|---|
| Drugs Approved by FDA | Click to Show/Hide the Full List of Drugs: 210 Drugs | ||||
Thalidomide |
Drug Info | Approved | Breast cancer | ICD11: 2C60 | [1], [2] |
Tamoxifen citrate |
Drug Info | Approved | Breast cancer | ICD11: 2C60 | [3] |
Erlotinib hydrochloride |
Drug Info | Approved | Lung cancer | ICD11: 2C25 | [4] |
Alosetron hydrochloride |
Drug Info | Approved | Irritable bowel syndrome | ICD11: DD91 | [5] |
Idelalisib |
Drug Info | Approved | Chronic lymphocytic leukaemia | ICD11: 2A82 | [6] |
Warfarin sodium |
Drug Info | Approved | Atrial fibrillation | ICD11: BC81 | [7] |
Estradiol acetate |
Drug Info | Approved | Acquired prion disease | ICD11: 8E01 | [8] |
Estradiol cypionate |
Drug Info | Approved | Acquired prion disease | ICD11: 8E01 | [9] |
Estradiol valerate |
Drug Info | Approved | Acquired prion disease | ICD11: 8E01 | [9] |
Estrone |
Drug Info | Approved | Menopausal disorder | ICD11: GA30 | [10] |
Nicotine |
Drug Info | Approved | Nicotine dependence | ICD11: 6C4A | [11] |
Apremilast |
Drug Info | Approved | Psoriasis vulgaris | ICD11: EA90 | [12] |
Nabumetone |
Drug Info | Approved | Rheumatoid arthritis | ICD11: FA20 | [13] |
Bortezomib |
Drug Info | Approved | Breast cancer | ICD11: 2C60 | [14] |
Diclofenac sodium |
Drug Info | Approved | Osteoarthritis | ICD11: FA00 | [15] |
Fospropofol disodium |
Drug Info | Approved | Monitored anaesthesia care | ICD11: N.A. | [16] |
Metoclopramide hydrochloride |
Drug Info | Approved | Functional nausea/vomiting | ICD11: DD90 | [17] |
Primaquine |
Drug Info | Approved | Malaria | ICD11: 1F40 | [18] |
Almogran |
Drug Info | Approved | Migraine | ICD11: 8A80 | [19] |
Imatinib mesylate |
Drug Info | Approved | Chronic myelogenous leukaemia | ICD11: 2A20 | [20] |
Lidocaine |
Drug Info | Approved | Anaesthesia | ICD11: 8E22 | [21] |
Cannabidiol |
Drug Info | Approved | Lennox-Gastaut syndrome | ICD11: 8A62 | [22] |
Capsaicin |
Drug Info | Approved | Herpes zoster | ICD11: 1E91 | [23] |
Clomipramine hydrochloride |
Drug Info | Approved | Obsessive-compulsive disorder | ICD11: 6B20 | [24] |
Lapatinib ditosylate |
Drug Info | Approved | Breast cancer | ICD11: 2C60 | [4] |
Sunitinib malate |
Drug Info | Approved | Renal cell carcinoma | ICD11: 2C90 | [] |
Sunitinib malate |
Drug Info | Approved | Renal cell carcinoma | ICD11: 2C90 | [25] |
Terbinafine hydrochloride |
Drug Info | Approved | Pityriasis versicolor | ICD11: 1F2D | [26] |
Almotriptan malate |
Drug Info | Approved | Migraine | ICD11: 8A80 | [27] |
Aprepitant |
Drug Info | Approved | Functional nausea/vomiting | ICD11: DD90 | [28] |
Asenapine maleate |
Drug Info | Approved | Schizophrenia | ICD11: 6A20 | [29] |
Betaxolol |
Drug Info | Approved | Essential hypertension | ICD11: BA00 | [30] |
Clomipramine |
Drug Info | Approved | Depression | ICD11: 6A70-6A7Z | [31] |
Clomipramine |
Drug Info | Approved | Depression | ICD11: 6A70-6A7Z | [24], [32] |
Conjugated estrogens |
Drug Info | Approved | Menopausal disorder | ICD11: GA30 | [33] |
Cyclobenzaprine |
Drug Info | Approved | Depression | ICD11: 6A71 | [34] |
Daunorubicin |
Drug Info | Approved | Acute myeloid leukaemia | ICD11: 2A60 | [35] |
Duloxetine hydrochloride |
Drug Info | Approved | Depression | ICD11: 6A71 | [36] |
Febuxostat |
Drug Info | Approved | Hyperuricaemia | ICD11: 5C55 | [37] |
Ixazomib |
Drug Info | Approved | Amyloidosis | ICD11: 5D00 | [38] |
Tacrine hydrochloride |
Drug Info | Approved | Alzheimer disease | ICD11: 8A20 | [21] |
Albendazole |
Drug Info | Approved | Giardiasis | ICD11: 1A31 | [39] |
Dopamine hydrochloride |
Drug Info | Approved | Parkinsonism | ICD11: 8A00 | [40] |
Fluvoxamine maleate |
Drug Info | Approved | Obsessive-compulsive disorder | ICD11: 6B20 | [41] |
Osimertinib |
Drug Info | Approved | Lung cancer | ICD11: 2C25 | [42] |
Pentoxifylline |
Drug Info | Approved | Arteriosclerosis obliterans | ICD11: BD40 | [43] |
Perampanel |
Drug Info | Approved | Focal seizure | ICD11: 8A68 | [44] |
Quinine sulfate |
Drug Info | Approved | Malaria | ICD11: 1F40 | [45] |
Alitretinoin |
Drug Info | Approved | Kaposi sarcoma | ICD11: 2B57 | [46] |
Axitinib |
Drug Info | Approved | Renal cell carcinoma | ICD11: 2C90 | [47] |
Caffeine |
Drug Info | Approved | Orthostatic hypotension | ICD11: BA21 | [1] |
Carvedilol |
Drug Info | Approved | Congestive heart failure | ICD11: BD10 | [48] |
Deutetrabenazine |
Drug Info | Approved | Huntington disease | ICD11: 8A01 | [49] |
Diazepam |
Drug Info | Approved | Epilepsy | ICD11: 8A60 | [50] |
Doxepin hydrochloride |
Drug Info | Approved | Depression | ICD11: 6A71 | [51] |
Flutamide |
Drug Info | Approved | Prostate cancer | ICD11: 2C82 | [52] |
Haloperidol decanoate |
Drug Info | Approved | Agitation/aggression | ICD11: 6D86 | [53] |
Levonorgestrel |
Drug Info | Approved | Menorrhagia | ICD11: GA20 | [54] |
Lorcaserin |
Drug Info | Approved | Obesity | ICD11: 5B81 | [55] |
Naproxen |
Drug Info | Approved | Rheumatoid arthritis | ICD11: FA20 | [56] |
Norethindrone acetate |
Drug Info | Approved | Menorrhagia | ICD11: GA20 | [57] |
Norfloxacin |
Drug Info | Approved | Infectious cystitis | ICD11: GC00 | [58] |
Ondansetron |
Drug Info | Approved | Gastritis | ICD11: DA42 | [59] |
Pomalidomide |
Drug Info | Approved | Breast cancer | ICD11: 2C60 | [60] |
Propafenone hydrochloride |
Drug Info | Approved | Ventricular tachyarrhythmia | ICD11: BC71 | [61] |
Propranolol hydrochloride |
Drug Info | Approved | Migraine | ICD11: 8A80 | [21] |
Rofecoxib |
Drug Info | Approved | Rheumatoid arthritis | ICD11: FA20 | [62] |
Tocainide |
Drug Info | Approved | Ventricular tachyarrhythmia | ICD11: BC71 | [63] |
Trimethoprim |
Drug Info | Approved | Infectious cystitis | ICD11: GC00 | [64] |
Verapamil hydrochloride |
Drug Info | Approved | Essential hypertension | ICD11: BA00 | [65] |
Amitriptyline hydrochloride |
Drug Info | Approved | Depression | ICD11: 6A71 | [66] |
Bromfenac |
Drug Info | Approved | Cataract | ICD11: 9B10 | [67] |
Carbamazepine |
Drug Info | Approved | Epilepsy | ICD11: 8A60 | [68] |
Cinacalcet hydrochloride |
Drug Info | Approved | Hyperparathyroidism | ICD11: 5A51 | [69] |
Dasatinib |
Drug Info | Approved | Chronic myelogenous leukaemia | ICD11: 2A20 | [4] |
Dexmedetomidine hydrochloride |
Drug Info | Approved | Tension headache | ICD11: 8A81 | [70] |
Efavirenz |
Drug Info | Approved | Human immunodeficiency virus infection | ICD11: 1C60 | [71] |
Exjade |
Drug Info | Approved | Hyperphosphatemia | ICD11: 5C64 | [72] |
Fluoxetine hydrochloride |
Drug Info | Approved | Depression | ICD11: 6A71 | [58] |
Imipramine hydrochloride |
Drug Info | Approved | Depression | ICD11: 6A71 | [73] |
Indomethacin |
Drug Info | Approved | Rheumatoid arthritis | ICD11: FA20 | [74] |
Istradefylline |
Drug Info | Approved | Parkinsonism | ICD11: 8A00 | [75] |
Leflunomide |
Drug Info | Approved | Rheumatoid arthritis | ICD11: FA20 | [21] |
Levomepromazine |
Drug Info | Approved | Insomnia | ICD11: 7A00 | [76] |
Olanzapine |
Drug Info | Approved | Schizophrenia | ICD11: 6A20 | [77] |
Phenytoin |
Drug Info | Approved | Epilepsy | ICD11: 8A60 | [78] |
Promazine |
Drug Info | Approved | Schizophrenia | ICD11: 6A20 | [78] |
Riluzole |
Drug Info | Approved | Amyotrophic lateral sclerosis | ICD11: 8B60 | [79] |
Ropivacaine hydrochloride |
Drug Info | Approved | Anaesthesia | ICD11: 8E22 | [80] |
Rucaparib |
Drug Info | Approved | Ovarian cancer | ICD11: 2C73 | [81] |
Zileuton |
Drug Info | Approved | Asthma | ICD11: CA23 | [21] |
Zolpidem tartrate |
Drug Info | Approved | Insomnia | ICD11: 7A00 | [82] |
Amiodarone hydrochloride |
Drug Info | Approved | Ventricular tachyarrhythmia | ICD11: BC71 | [83] |
Amoxapine |
Drug Info | Approved | Depression | ICD11: 6A71 | [84] |
Azathioprine |
Drug Info | Approved | Rheumatoid arthritis | ICD11: FA20 | [85] |
Azelastine |
Drug Info | Approved | Allergic rhinitis | ICD11: CA08 | [86] |
Bendamustine |
Drug Info | Approved | Chronic lymphocytic leukaemia | ICD11: 2A82 | [87] |
Chlorpromazine hydrochloride |
Drug Info | Approved | Schizophrenia | ICD11: 6A20 | [88] |
Clofazimine |
Drug Info | Approved | Crohn disease | ICD11: DD70 | [89] |
Clonidine |
Drug Info | Approved | Essential hypertension | ICD11: BA00 | [90] |
Clozapine |
Drug Info | Approved | Schizophrenia | ICD11: 6A20 | [91] |
Diphenhydramine |
Drug Info | Approved | Meniere disease | ICD11: AB31 | [92] |
Ethosuximide |
Drug Info | Approved | Epilepsy | ICD11: 8A60 | [93] |
Exemestane |
Drug Info | Approved | Breast cancer | ICD11: 2C60 | [94] |
Frovatriptan |
Drug Info | Approved | Migraine | ICD11: 8A80 | [95] |
Levobupivacaine |
Drug Info | Approved | Anaesthesia | ICD11: 8E22 | [96] |
Loxapine succinate |
Drug Info | Approved | Schizophrenia | ICD11: 6A20 | [97] |
Malathion |
Drug Info | Approved | Pediculosis | ICD11: 1G00 | [98] |
Mirtazapine |
Drug Info | Approved | Depression | ICD11: 6A71 | [99] |
Paroxetine hydrochloride |
Drug Info | Approved | Depression | ICD11: 6A71 | [100] |
Pazopanib |
Drug Info | Approved | Renal cell carcinoma | ICD11: 2C90 | [101] |
Perphenazine |
Drug Info | Approved | Schizophrenia | ICD11: 6A20 | [102] |
Pimozide |
Drug Info | Approved | Schizophrenia | ICD11: 6A20 | [103] |
Ponatinib hydrochloride |
Drug Info | Approved | Acute lymphoblastic leukemia | ICD11: 2B33 | [104] |
Pralsetinib |
Drug Info | Approved | Lung cancer | ICD11: 2C25 | [105] |
Pralsetinib |
Drug Info | Approved | Lung cancer | ICD11: 2C25 | [106] |
Propofol |
Drug Info | Approved | Anaesthesia | ICD11: 8E22 | [107] |
Ropinirole hydrochloride |
Drug Info | Approved | Parkinsonism | ICD11: 8A00 | [108] |
Sumatriptan |
Drug Info | Approved | Migraine | ICD11: 8A80 | [109] |
Tasimelteon |
Drug Info | Approved | Insomnia | ICD11: 7A00 | [110] |
Theophylline |
Drug Info | Approved | Chronic obstructive pulmonary disease | ICD11: CA22 | [111] |
Thiabendazole |
Drug Info | Approved | Aspergillosis | ICD11: 1F20 | [21] |
Thioridazine |
Drug Info | Approved | Schizophrenia | ICD11: 6A20 | [112] |
Triclosan |
Drug Info | Approved | Malaria | ICD11: 1F40-1F45 | [113] |
Acetaminophen |
Drug Info | Approved | Anaesthesia | ICD11: 8E22 | [114] |
Apixaban |
Drug Info | Approved | Deep vein thrombosis | ICD11: BD71 | [115] |
Benzocaine |
Drug Info | Approved | Anaesthesia | ICD11: 9A76-9A78 | [116] |
Binimetinib |
Drug Info | Approved | Melanoma | ICD11: 2C30 | [117] |
Ciprofloxacin |
Drug Info | Approved | Endocarditis | ICD11: 1B12 | [118] |
Dapagliflozin |
Drug Info | Approved | Diabetes mellitus | ICD11: 5A10 | [119] |
Etoposide |
Drug Info | Approved | Lung cancer | ICD11: 2C25 | [120] |
Fluorouracilo |
Drug Info | Approved | Stomach cancer | ICD11: 2B72 | [121] |
Gefitinib |
Drug Info | Approved | Lung cancer | ICD11: 2C25 | [122] |
Grepafloxacin |
Drug Info | Approved | Bronchitis | ICD11: CA20 | [123] |
Griseofulvin |
Drug Info | Approved | Dermatophytosis | ICD11: 1F28 | [124] |
Lenvatinib |
Drug Info | Approved | Thyroid cancer | ICD11: 2D10 | [125] |
Levomethadyl acetate hydrochloride |
Drug Info | Approved | Opiate dependence | ICD11: 6C43 | [126] |
Maprotiline hydrochloride |
Drug Info | Approved | Depression | ICD11: 6A71 | [127] |
Methadone |
Drug Info | Approved | Anaesthesia | ICD11: 8E22 | [128] |
Methyldopa |
Drug Info | Approved | Essential hypertension | ICD11: BA00 | [129] |
Mexiletine hydrochloride |
Drug Info | Approved | Ventricular tachyarrhythmia | ICD11: BC71 | [130] |
Midodrine |
Drug Info | Approved | Orthostatic hypotension | ICD11: BA21 | [131] |
Olopatadine |
Drug Info | Approved | Conjunctivitis | ICD11: 9A60 | [132] |
Oxtriphylline |
Drug Info | Approved | Congestive heart failure | ICD11: BD10 | [133] |
Pantoprazole sodium |
Drug Info | Approved | Gastro-oesophageal reflux disease | ICD11: DA22 | [134] |
Pirfenidone |
Drug Info | Approved | Acute kidney failure | ICD11: GB60 | [135] |
Procarbazine |
Drug Info | Approved | Anaplastic large cell lymphoma | ICD11: 2A90 | [136] |
Ranitidine |
Drug Info | Approved | Peptic ulcer | ICD11: DA61 | [137] |
Rasagiline mesylate |
Drug Info | Approved | Parkinsonism | ICD11: 8A00 | [138] |
Sorafenib |
Drug Info | Approved | Renal cell carcinoma | ICD11: 2C90 | [139] |
Tapinarof |
Drug Info | Approved | Discovery agent | ICD: N.A. | [140] |
Timolol maleate |
Drug Info | Approved | Essential hypertension | ICD11: BA00 | [141] |
Azilsartan |
Drug Info | Approved | Hypertension | ICD11: BA00-BA04 | [142], [143] |
Cilostazol |
Drug Info | Approved | Arteriosclerosis obliterans | ICD11: BD40 | [69] |
Clofibrate |
Drug Info | Approved | Hypertriglyceridaemia | ICD11: 5C80 | [144] |
Clopidogrel bisulfate |
Drug Info | Approved | Acute coronary syndrome | ICD11: BA4Z | [145] |
Eltrombopag olamine |
Drug Info | Approved | Thrombocytopenia | ICD11: 3B64 | [146] |
Ergotamine tartrate |
Drug Info | Approved | Migraine | ICD11: 8A80 | [95] |
Flecainide acetate |
Drug Info | Approved | Ventricular tachyarrhythmia | ICD11: BC71 | [147] |
Flibanserin |
Drug Info | Approved | Inhibited sexual desire | ICD11: HA00 | [148] |
Fluvoxamine |
Drug Info | Approved | Depression | ICD11: 6A70-6A7Z | [149] |
Granisetron hydrochloride |
Drug Info | Approved | Functional nausea/vomiting | ICD11: DD90 | [150] |
Lomitapide mesylate |
Drug Info | Approved | Hypertriglyceridaemia | ICD11: 5C80 | [151] |
Loratadine |
Drug Info | Approved | Allergic rhinitis | ICD11: CA08 | [152] |
Mephenytoin |
Drug Info | Approved | Epilepsy | ICD11: 8A60 | [153] |
Nifedipine |
Drug Info | Approved | Angina pectoris | ICD11: BA40 | [154] |
Oxaliplatin |
Drug Info | Approved | Colorectal cancer | ICD11: 2B91 | [155] |
Pefloxacin |
Drug Info | Approved | Gonococcal urethritis | ICD11: 1A70-1A7Z | [156] |
Pentamidine isethionate |
Drug Info | Approved | Pneumocystis pneumonia | ICD11: CA40 | [18] |
Pyrazinamide |
Drug Info | Approved | Pulmonary tuberculosis | ICD11: 1B10 | [157] |
Selegiline |
Drug Info | Approved | Major depressive disorder | ICD11: 6A70-6A7Z | [158] |
Selegiline hydrochloride |
Drug Info | Approved | Parkinsonism | ICD11: 8A00 | [158] |
Sertraline hydrochloride |
Drug Info | Approved | Depression | ICD11: 6A71 | [159] |
Stiripentol |
Drug Info | Approved | Epilepsy | ICD11: 8A60 | [160] |
Sulindac |
Drug Info | Approved | Rheumatoid arthritis | ICD11: FA20 | [161] |
Tizanidine hydrochloride |
Drug Info | Approved | Muscle spasticity | ICD11: FB30 | [21] |
Triclabendazole |
Drug Info | Approved | Fascioliasis | ICD11: 1F82 | [162] |
Ulipristal |
Drug Info | Approved | Contraception | ICD11: JA65 | [163] |
Zolmitriptan |
Drug Info | Approved | Migraine | ICD11: 8A80 | [50] |
Anagrelide hydrochloride |
Drug Info | Approved | Thrombocytosis | ICD11: 3B63 | [164] |
Benzyl alcohol |
Drug Info | Approved | Pediculosis | ICD11: 1G00 | [165] |
Carmustine |
Drug Info | Approved | Hepatocellular carcinoma | ICD11: 2C12 | [166] |
Chloroquine |
Drug Info | Approved | Malaria | ICD11: 1F40 | [167] |
Chlorzoxazone |
Drug Info | Approved | Anaesthesia | ICD11: 8E22 | [168] |
Dacarbazine |
Drug Info | Approved | Melanoma | ICD11: 2C30 | [169] |
Desipramine |
Drug Info | Approved | Attention deficit hyperactivity disorder | ICD11: 6A05 | [134] |
Dinoprostone |
Drug Info | Approved | Abortion | ICD11: JA00 | [170] |
Disopyramide phosphate |
Drug Info | Approved | Ventricular tachyarrhythmia | ICD11: BC71 | [171] |
Enasidenib |
Drug Info | Approved | Acute myeloid leukaemia | ICD11: 2A60 | [172] |
Erythromycin stearate |
Drug Info | Approved | Acute upper respiratory infection | ICD11: CA07 | [173] |
Guanabenz |
Drug Info | Approved | Hypertriglyceridaemia | ICD11: 5C80 | [21] |
Imiquimod |
Drug Info | Approved | Basal cell carcinoma | ICD11: 2C32 | [134] |
Lomefloxacin |
Drug Info | Approved | Conjunctivitis | ICD11: 9A60 | [174] |
Nortriptyline hydrochloride |
Drug Info | Approved | Depression | ICD11: 6A71 | [175] |
Praziquantel |
Drug Info | Approved | Schistosomiasis | ICD11: 1F86 | [18] |
Rifampicin |
Drug Info | Approved | Osteoporosis | ICD11: FB83 | [176] |
Roflumilast |
Drug Info | Approved | Chronic obstructive pulmonary disease | ICD11: CA22 | [177] |
Sevoflurane |
Drug Info | Approved | Anaesthesia | ICD11: 8E22 | [178] |
Triamterene |
Drug Info | Approved | Congestive heart failure | ICD11: BD10 | [179] |
Voxilaprevir |
Drug Info | Approved | Viral hepatitis | ICD11: 1E51 | [180] |
Voxilaprevir |
Drug Info | Approved | Viral hepatitis | ICD11: 1E51 | [181] |
Aminophylline |
Drug Info | Approved | Asthma | ICD11: CA23 | [182] |
Menadione |
Drug Info | Approved | Vitamin deficiency | ICD11: 5B55 | [183] |
Methoxyflurane |
Drug Info | Approved | Anaesthesia | ICD11: 8E22 | [184] |
Ramelteon |
Drug Info | Approved | Insomnia | ICD11: 7A00 | [185] |
Thiothixene |
Drug Info | Approved | Schizophrenia | ICD11: 6A20 | [186] |
Trifluoperazine |
Drug Info | Approved | Schizophrenia | ICD11: 6A20 | [187] |
Umbralisib |
Drug Info | Approved | Follicular lymphoma | ICD11: 2A80 | [188] |
Berberine |
Drug Info | Phase 4 | Discovery agent | ICD: N.A. | [190] |
Neupro |
Drug Info | Phase 4 | Restless legs syndrome | ICD11: 7A80 | [194] |
| Drugs in Phase 4 Clinical Trial | Click to Show/Hide the Full List of Drugs: 23 Drugs | ||||
Lumiracoxib |
Drug Info | Phase 4 | Anaesthesia | ICD11: 8E22 | [189] |
Ethinylestradiol propanesulfonate |
Drug Info | Phase 4 | Prostate cancer | ICD11: 2C82 | [191], [192] |
Cinnarizine |
Drug Info | Phase 4 | Haemorrhagic stroke | ICD11: 8B20 | [193] |
Melatonin |
Drug Info | Phase 4 | Foetal growth restriction | ICD11: KA20 | [195] |
Mianserin |
Drug Info | Phase 4 | Depression | ICD11: 6A71 | [196] |
Zotepine |
Drug Info | Phase 4 | Schizophrenia | ICD11: 6A20 | [197] |
Dexfenfluramine |
Drug Info | Phase 4 | Obesity | ICD11: 5B81 | [198] |
Etoricoxib |
Drug Info | Phase 4 | Anaesthesia | ICD11: 8E22 | [199] |
Idebenone |
Drug Info | Phase 4 | Mitochondrial myopathy | ICD11: 8C73 | [200] |
Phenacetin |
Drug Info | Phase 4 | Anaesthesia | ICD11: 8E22 | [201] |
Aminophenazone |
Drug Info | Phase 4 | Anaesthesia | ICD11: 8E22 | [134] |
Dihydralazine |
Drug Info | Phase 4 | Essential hypertension | ICD11: BA00 | [202] |
Flunarizine |
Drug Info | Phase 4 | Schizophrenia | ICD11: 6A20 | [144] |
Flunitrazepam |
Drug Info | Phase 4 | Insomnia | ICD11: 7A00 | [134] |
Perazine |
Drug Info | Phase 4 | Cerebrovascular dementia | ICD11: 6D81 | [203] |
Temafloxacin |
Drug Info | Phase 4 | Acute lower respiratory infection | ICD11: CA4Z | [174] |
Agomelatine |
Drug Info | Phase 4 | Depression | ICD11: 6A71 | [204] |
Lofexidine |
Drug Info | Phase 4 | Opiate dependence | ICD11: 6C43 | [205] |
Proguanil |
Drug Info | Phase 4 | Malaria | ICD11: 1F40 | [153] |
Ramosetron |
Drug Info | Phase 4 | Irritable bowel syndrome | ICD11: DD91 | [206] |
Doxofylline |
Drug Info | Phase 4 | Chronic obstructive pulmonary disease | ICD11: CA22 | [207] |
Tegafur |
Drug Info | Phase 4 | Colon cancer | ICD11: 2B90 | [134] |
Pentifylline |
Drug Info | Phase 4 | Cerebrovascular dementia | ICD11: 6D81 | [207] |
| Drugs in Phase 3 Clinical Trial | Click to Show/Hide the Full List of Drugs: 22 Drugs | ||||
Fidarestat |
Drug Info | Phase 3 | Diabetic complication | ICD11: 5A2Y | [208] |
E-3A |
Drug Info | Phase 3 | Turner syndrome | ICD11: LD50 | [209] |
Selumetinib |
Drug Info | Phase 3 | Neurofibromatosis | ICD11: LD2D | [210], [211] |
BPI-2009 |
Drug Info | Phase 3 | Lung cancer | ICD11: 2C25 | [212] |
Chlorpromazine |
Drug Info | Phase 3 | Coronavirus Disease 2019 (COVID-19) | ICD11: 1D6Y | [213] |
DOV-220075 |
Drug Info | Phase 3 | Depression | ICD11: 6A71 | [214] |
KW-5338 |
Drug Info | Phase 3 | Gastroparesis | ICD11: DA41 | [215] |
NSC-122758 |
Drug Info | Phase 3 | Vitamin deficiency | ICD11: 5B55 | [216] |
Maribavir |
Drug Info | Phase 3 | Cytomegalovirus infection | ICD11: 1D82 | [217] |
SB-939 |
Drug Info | Phase 3 | Acute myeloid leukaemia | ICD11: 2A60 | [218] |
BMS-986165 |
Drug Info | Phase 3 | Psoriasis vulgaris | ICD11: EA90 | [219] |
Brivanib |
Drug Info | Phase 3 | Breast cancer | ICD11: 2C60-2C6Y | [220] |
HSDB-3466 |
Drug Info | Phase 3 | Psoriasis vulgaris | ICD11: EA90 | [221] |
SC-15090 |
Drug Info | Phase 3 | Acute bronchitis | ICD11: CA42 | [222] |
LY-450139 |
Drug Info | Phase 3 | Alzheimer disease | ICD11: 8A20 | [223] |
SRT-501 |
Drug Info | Phase 3 | Nephroptosis | ICD11: GB90 | [224] |
Fenfluramine |
Drug Info | Phase 3 | Dravet syndrome | ICD11: 8A61-8A6Z | [225] |
MRTX849 |
Drug Info | Phase 3 | Lung cancer | ICD11: 2C25 | [226] |
SHP-620 |
Drug Info | Phase 3 | Cytomegalovirus infection | ICD11: 1D82 | [217] |
Ag-221 |
Drug Info | Phase 3 | Acute myelogenous leukaemia | ICD11: 2A41 | [227] |
CYT-387 |
Drug Info | Phase 3 | Myelofibrosis | ICD11: 2A22 | [228] |
PNU-95666 |
Drug Info | Phase 3 | Parkinsonism | ICD11: 8A00 | [229] |
| Drugs in Phase 2 Clinical Trial | Click to Show/Hide the Full List of Drugs: 35 Drugs | ||||
Verapamil |
Drug Info | Phase 2/3 | Hypertension | ICD11: BA00-BA04 | [230] |
EMD-128130 |
Drug Info | Phase 2/3 | Rett syndrome | ICD11: LD90 | [231] |
Fexinidazole |
Drug Info | Phase 2/3 | Trypanosomiasis | ICD11: 1D51-1F53 | [232], [233] |
Fexinidazole |
Drug Info | Phase 2/3 | Trypanosomiasis | ICD11: 1D51-1F53 | [233] |
HOE-239 |
Drug Info | Phase 2/3 | Trypanosomiasis | ICD11: 1F51 | [233] |
Leniolisib |
Drug Info | Phase 2 | Sjogren syndrome | ICD11: 4A43 | [234] |
BIO-300 |
Drug Info | Phase 2 | Prostate cancer | ICD11: 2C82 | [235] |
NITD609 |
Drug Info | Phase 2 | Malaria | ICD11: 1F40-1F45 | [236] |
Ethanol |
Drug Info | Phase 2 | Diabetic nephropathy | ICD11: GB61 | [134] |
ANW-60941 |
Drug Info | Phase 2 | Uterine cancer | ICD11: 2C76 | [237] |
PT2385 |
Drug Info | Phase 2 | Von hippel-lindau disease | ICD11: 5A75 | [238] |
VATALANIB |
Drug Info | Phase 2 | Solid tumour/cancer | ICD11: 2A00-2F9Z | [239] |
VATALANIB |
Drug Info | Phase 2 | Solid tumour/cancer | ICD11: 2A00-2F9Z | [240] |
BCP-13498 |
Drug Info | Phase 2 | Anaesthesia | ICD11: 8E22 | [241] |
Triapine |
Drug Info | Phase 2 | Nerve injury | ICD11: ND56 | [242] |
HP-184 |
Drug Info | Phase 2 | Multiple sclerosis | ICD11: 8A40 | [243] |
Saracatinib |
Drug Info | Phase 2 | Osteosarcoma | ICD11: 2B51 | [244] |
AV-650 |
Drug Info | Phase 2 | Cerebral vasospasm | ICD11: BA85 | [245] |
BMS-911543 |
Drug Info | Phase 2 | Chronic myelogenous leukaemia | ICD11: 2A20 | [246] |
Ladostigil |
Drug Info | Phase 2 | Alzheimer disease | ICD11: 8A20 | [247] |
PD-115934 |
Drug Info | Phase 2 | Breast cancer | ICD11: 2C60 | [157] |
Vincamine |
Drug Info | Phase 2 | Cerebrovascular dementia | ICD11: 6D81 | [248] |
AR-67 |
Drug Info | Phase 2 | Brain cancer | ICD11: 2A00 | [249] |
ASA-404 |
Drug Info | Phase 2 | Prostate cancer | ICD11: 2C82 | [250] |
CT-1501R |
Drug Info | Phase 2 | Diabetes mellitus | ICD11: 5A10 | [251] |
GTS-21 |
Drug Info | Phase 2 | Schizophrenia | ICD11: 6A20 | [252] |
NAB-365 |
Drug Info | Phase 2 | Amyotrophic lateral sclerosis | ICD11: 8B60 | [253] |
SMT-C1100 |
Drug Info | Phase 2 | Muscular dystrophy | ICD11: 8C70 | [254] |
Verubulin |
Drug Info | Phase 2 | Brain cancer | ICD11: 2A00 | [255] |
AZD4635 |
Drug Info | Phase 2 | Prostate cancer | ICD11: 2C82 | [256] |
TAK-906 |
Drug Info | Phase 2 | Gastroparesis | ICD11: DA41 | [257] |
Encequidar |
Drug Info | Phase 2 | Metastatic breast cancer | ICD11: 2C60-2C6Y | [258] |
GS-9857 |
Drug Info | Phase 2 | Hepatitis C virus infection | ICD11: 1E50-1E51 | [259] |
N-DESMETHYLCLOZAPINE |
Drug Info | Phase 2 | Schizophrenia | ICD11: 6A20 | [260] |
SHR-1020 |
Drug Info | Phase 2 | Breast cancer | ICD11: 2C60 | [261] |
| Drugs in Phase 1 Clinical Trial | Click to Show/Hide the Full List of Drugs: 16 Drugs | ||||
CB-3304 |
Drug Info | Phase 1/2 | Chronic lymphocytic leukaemia | ICD11: 2A82 | [262] |
PIPERINE |
Drug Info | Phase 1/2 | Vitiligo | ICD11: ED63 | [263] |
CCRIS-1920 |
Drug Info | Phase 1/2 | Osteoporosis | ICD11: FB83 | [264] |
SB-1317 |
Drug Info | Phase 1/2 | Brain cancer | ICD11: 2A00 | [265] |
AST-1306 |
Drug Info | Phase 1 | Solid tumour/cancer | ICD11: 2A00-2F9Z | [266] |
BE-14348A |
Drug Info | Phase 1 | Viral hepatitis | ICD11: 1E51 | [267] |
Daniquidone |
Drug Info | Phase 1 | Lymphoma | ICD11: 2A80-2A86 | [268] |
H3B-6545 |
Drug Info | Phase 1 | Breast cancer | ICD11: 2C60 | [269] |
Alvespimycin hydrochloride |
Drug Info | Phase 1 | Ovarian cancer | ICD11: 2C73 | [270] |
Xanthine |
Drug Info | Phase 1 | Obstructive sleep apnea | ICD11: 7A41 | [271] |
NSC-38348 |
Drug Info | Phase 1 | Asthma | ICD11: CA23 | [207] |
MLN-8054 |
Drug Info | Phase 1 | Colon cancer | ICD11: 2B90 | [272] |
BAX-2793Z |
Drug Info | Phase 1 | Asthma | ICD11: CA23 | [207] |
HWA-285 |
Drug Info | Phase 1 | Cerebrovascular dementia | ICD11: 6D81 | [207] |
CC-122 |
Drug Info | Phase 1 | Chronic lymphocytic leukaemia | ICD11: 2A82 | [273] |
G-23350 |
Drug Info | Phase 1 | Venous thromboembolism | ICD11: BD72 | [1] |
| Discontinued/withdrawn Drugs | Click to Show/Hide the Full List of Drugs: 13 Drugs | ||||
Cilomilast |
Drug Info | Discontinued in Phase 3 | Emphysema | ICD11: CA21 | [274] |
Almokalant |
Drug Info | Discontinued in Phase 3 | Cardiac arrhythmias | ICD11: BC9Z | [275] |
Tetramethylpyrazine |
Drug Info | Discontinued in Phase 2 | Neurological disorder | ICD11: 6B60 | [276] |
YM-992 |
Drug Info | Discontinued in Phase 2 | Depression | ICD11: 6A70-6A7Z | [277] |
BMS-181168 |
Drug Info | Discontinued in Phase 2 | Cognitive impairment | ICD11: 6D71 | [278] |
ABT-107 |
Drug Info | Discontinued in Phase 1 | Attention deficit hyperactivity disorder | ICD11: 6A05 | [279] |
YM-17E |
Drug Info | Discontinued in Phase 1 | Hypertriglyceridaemia | ICD11: 5C80 | [280] |
CAM-2028 |
Drug Info | Discontinued | Acute nasopharyngitis | ICD11: CA00 | [134] |
Nomifensine |
Drug Info | Discontinued | Depression | ICD11: 6A71 | [281] |
NSC-149027 |
Drug Info | Discontinued | Herpes simplex virus infection | ICD11: 1F00 | [282] |
RO-408757 |
Drug Info | Discontinued | Breast cancer | ICD11: 2C60 | [283] |
AN-16649 |
Drug Info | Discontinued | Acute lymphoblastic leukemia | ICD11: 2B33 | [284], [285], [286] |
INN-00835 |
Drug Info | Discontinued | Depression | ICD11: 6A71 | [287] |
| Preclinical/investigative Agents | Click to Show/Hide the Full List of Drugs: 22 Drugs | ||||
EPX-100 |
Drug Info | Preclinical | Dravet syndrome | ICD11: 8A61 | [288] |
VA-10872 |
Drug Info | Preclinical | Anaesthesia | ICD11: 8E22 | [289] |
Coumarin |
Drug Info | Investigative | Discovery agent | ICD: N.A. | [290] |
Guajazulen |
Drug Info | Investigative | Allergy | ICD11: 4A80 | [291] |
Nitrobenzanthrone |
Drug Info | Investigative | Discovery agent | ICD: N.A. | [292] |
Flavone |
Drug Info | Investigative | Colon cancer | ICD11: 2B90 | [293] |
Bufuralol |
Drug Info | Investigative | Cardiac arrhythmia | ICD11: BC65 | [294] |
Bromazepam |
Drug Info | Investigative | Anxiety disorder | ICD11: 6B00 | [295] |
Fenethylline |
Drug Info | Investigative | Narcolepsy | ICD11: 7A20 | [207] |
Antipyrine |
Drug Info | Investigative | Discovery agent | ICD: N.A. | [1] |
Beta-ionone |
Drug Info | Investigative | Breast cancer | ICD11: 2C60 | [296] |
Estrone sulfate |
Drug Info | Investigative | Discovery agent | ICD: N.A. | [297] |
Hesperetin |
Drug Info | Investigative | Discovery agent | ICD: N.A. | [298] |
Imipramine oxide |
Drug Info | Investigative | Depression | ICD11: 6A71 | [299] |
Lauric acid |
Drug Info | Investigative | Alzheimer disease | ICD11: 8A20 | [300] |
Acriflavinium chloride |
Drug Info | Investigative | Trypanosomiasis | ICD11: 1F51 | [301] |
Cyamemazine |
Drug Info | Investigative | Discovery agent | ICD: N.A. | [302] |
Paraoxon |
Drug Info | Investigative | Discovery agent | ICD: N.A. | [303] |
Hypoxanthine |
Drug Info | Investigative | Discovery agent | ICD: N.A. | [271] |
O-Benzylguanine |
Drug Info | Investigative | Discovery agent | ICD: N.A. | [304] |
Acefylline |
Drug Info | Investigative | Discovery agent | ICD: N.A. | [207] |
NSC-6113 |
Drug Info | Investigative | Discovery agent | ICD: N.A. | [305] |
| Tissue/Disease-Specific Protein Abundances of This DME | |||||
|---|---|---|---|---|---|
| Tissue-specific Protein Abundances in Healthy Individuals | Click to Show/Hide | ||||
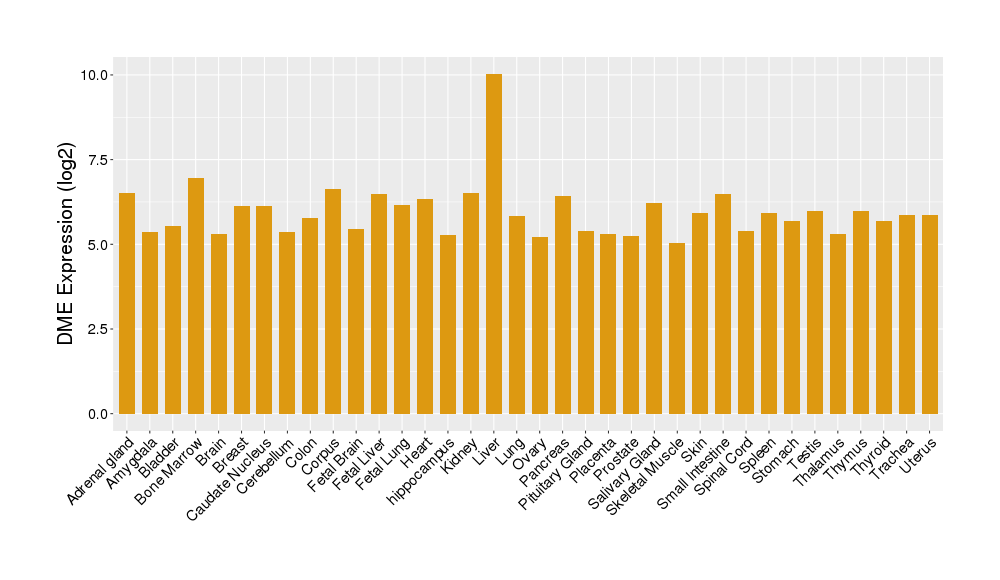
|
|||||
| ICD Disease Classification 01 | Infectious/parasitic disease | Click to Show/Hide | |||
| ICD-11: 1C1H | Necrotising ulcerative gingivitis | Click to Show/Hide | |||
| The Studied Tissue | Gingival tissue | ||||
| The Specified Disease | Bacterial infection of gingival [ICD-11:1C1H] | ||||
| The Expression Level of Disease Section Compare with the Healthy Individual Tissue | p-value: 7.68E-01; Fold-change: 7.33E-03; Z-score: 2.32E-02 | ||||
|
DME expression in the diseased tissue of patients
DME expression in the normal tissue of healthy individuals
|
|||||
| Violin Diagram of DME Disease-specific Protein Abundances |
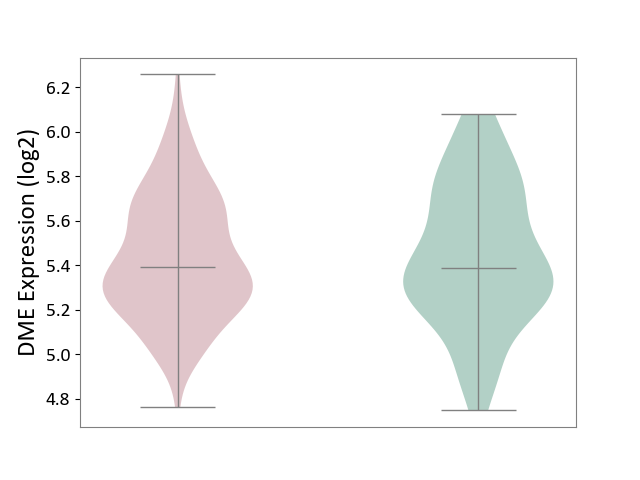
|
Click to View the Clearer Original Diagram | |||
| ICD-11: 1E30 | Influenza | Click to Show/Hide | |||
| The Studied Tissue | Whole blood | ||||
| The Specified Disease | Influenza [ICD-11:1E30] | ||||
| The Expression Level of Disease Section Compare with the Healthy Individual Tissue | p-value: 7.38E-02; Fold-change: 4.76E-01; Z-score: 2.31E+00 | ||||
|
DME expression in the diseased tissue of patients
DME expression in the normal tissue of healthy individuals
|
|||||
| Violin Diagram of DME Disease-specific Protein Abundances |
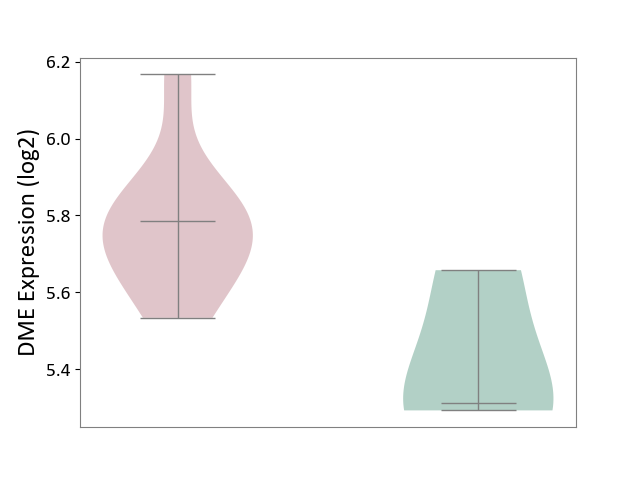
|
Click to View the Clearer Original Diagram | |||
| ICD-11: 1E51 | Chronic viral hepatitis | Click to Show/Hide | |||
| The Studied Tissue | Whole blood | ||||
| The Specified Disease | Chronic hepatitis C [ICD-11:1E51.1] | ||||
| The Expression Level of Disease Section Compare with the Healthy Individual Tissue | p-value: 1.87E-01; Fold-change: 5.65E-02; Z-score: 4.21E-01 | ||||
|
DME expression in the diseased tissue of patients
DME expression in the normal tissue of healthy individuals
|
|||||
| Violin Diagram of DME Disease-specific Protein Abundances |
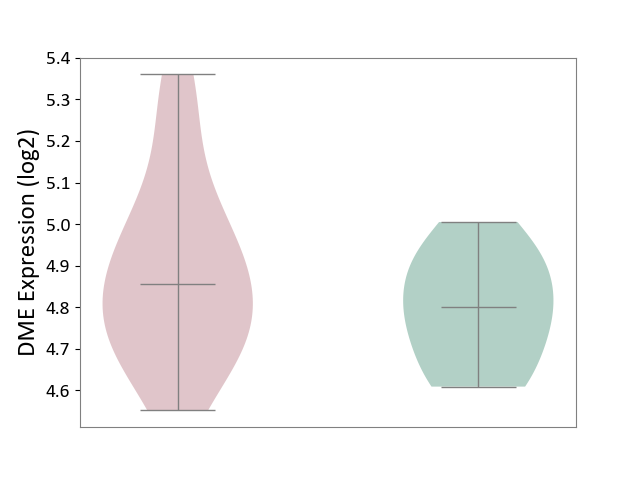
|
Click to View the Clearer Original Diagram | |||
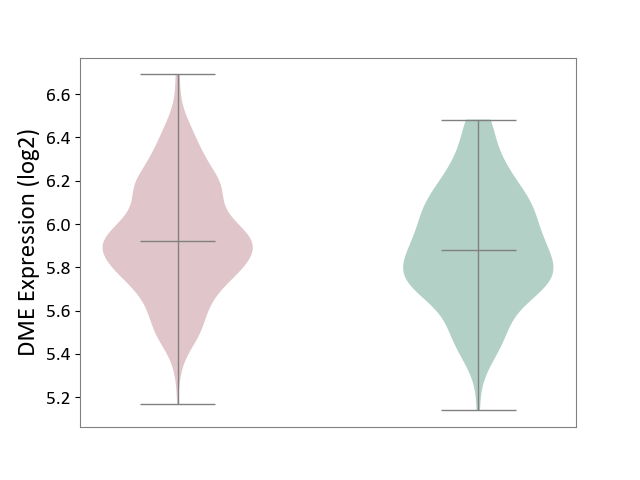
| ICD-11: 1G41 | Sepsis with septic shock | Click to Show/Hide | |||
| The Studied Tissue | Whole blood | ||||
| The Specified Disease | Sepsis with septic shock [ICD-11:1G41] | ||||
| The Expression Level of Disease Section Compare with the Healthy Individual Tissue | p-value: 6.42E-02; Fold-change: 4.07E-02; Z-score: 1.50E-01 | ||||
|
DME expression in the diseased tissue of patients
DME expression in the normal tissue of healthy individuals
|
|||||
| Violin Diagram of DME Disease-specific Protein Abundances |
|
Click to View the Clearer Original Diagram | |||
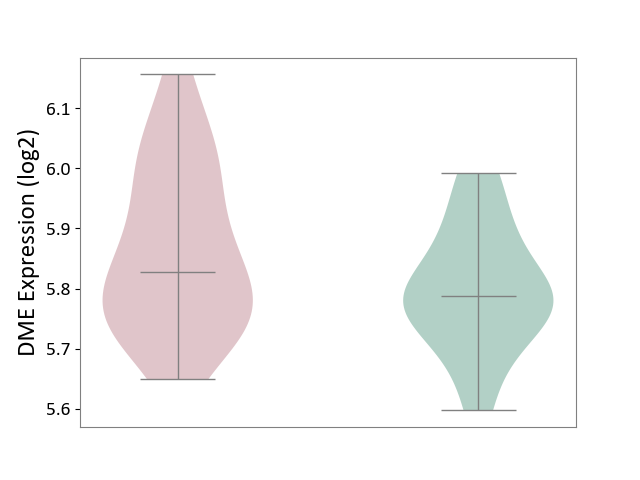
| ICD-11: CA40 | Respiratory syncytial virus infection | Click to Show/Hide | |||
| The Studied Tissue | Peripheral blood | ||||
| The Specified Disease | Pediatric respiratory syncytial virus infection [ICD-11:CA40.11] | ||||
| The Expression Level of Disease Section Compare with the Healthy Individual Tissue | p-value: 9.47E-02; Fold-change: 4.02E-02; Z-score: 3.91E-01 | ||||
|
DME expression in the diseased tissue of patients
DME expression in the normal tissue of healthy individuals
|
|||||
| Violin Diagram of DME Disease-specific Protein Abundances |
|
Click to View the Clearer Original Diagram | |||
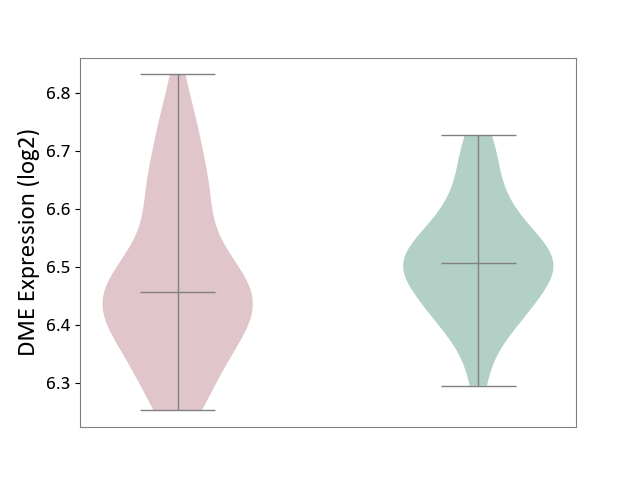
| ICD-11: CA42 | Rhinovirus infection | Click to Show/Hide | |||
| The Studied Tissue | Nasal epithelium tissue | ||||
| The Specified Disease | Rhinovirus infection [ICD-11:CA42.1] | ||||
| The Expression Level of Disease Section Compare with the Healthy Individual Tissue | p-value: 2.28E-01; Fold-change: -5.04E-02; Z-score: -5.16E-01 | ||||
|
DME expression in the diseased tissue of patients
DME expression in the normal tissue of healthy individuals
|
|||||
| Violin Diagram of DME Disease-specific Protein Abundances |
|
Click to View the Clearer Original Diagram | |||
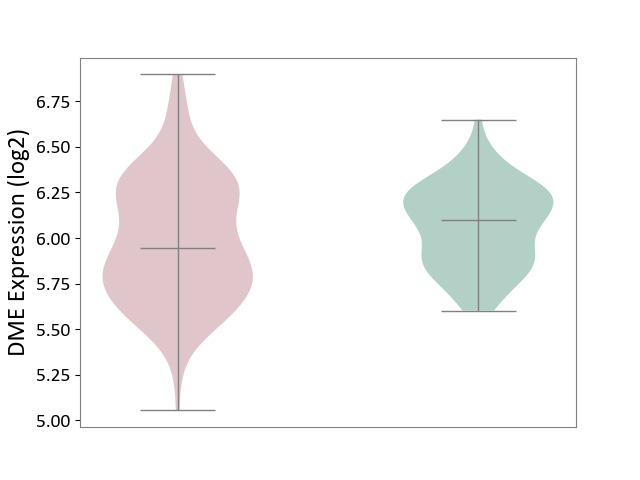
| ICD-11: KA60 | Neonatal sepsis | Click to Show/Hide | |||
| The Studied Tissue | Whole blood | ||||
| The Specified Disease | Neonatal sepsis [ICD-11:KA60] | ||||
| The Expression Level of Disease Section Compare with the Healthy Individual Tissue | p-value: 2.46E-02; Fold-change: -1.52E-01; Z-score: -6.66E-01 | ||||
|
DME expression in the diseased tissue of patients
DME expression in the normal tissue of healthy individuals
|
|||||
| Violin Diagram of DME Disease-specific Protein Abundances |
|
Click to View the Clearer Original Diagram | |||
| ICD Disease Classification 02 | Neoplasm | Click to Show/Hide | |||
| ICD-11: 2A00 | Brain cancer | Click to Show/Hide | |||
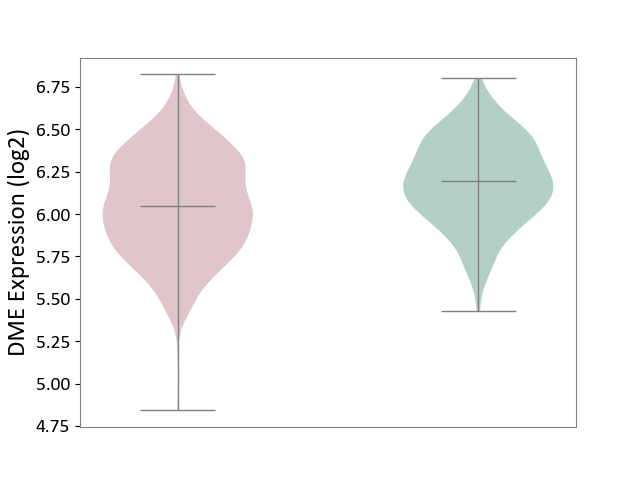
| The Studied Tissue | Nervous tissue | ||||
| The Specified Disease | Glioblastopma [ICD-11:2A00.00] | ||||
| The Expression Level of Disease Section Compare with the Healthy Individual Tissue | p-value: 5.68E-18; Fold-change: -1.46E-01; Z-score: -5.75E-01 | ||||
|
DME expression in the diseased tissue of patients
DME expression in the normal tissue of healthy individuals
|
|||||
| Violin Diagram of DME Disease-specific Protein Abundances |
|
Click to View the Clearer Original Diagram | |||
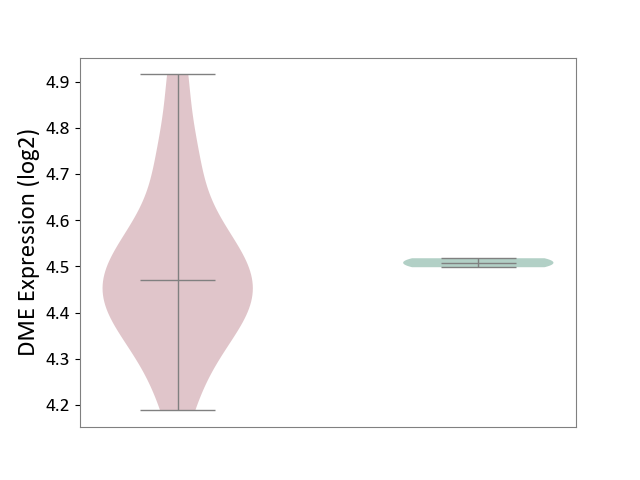
| The Studied Tissue | Brain stem tissue | ||||
| The Specified Disease | Glioma [ICD-11:2A00.0Y-2A00.0Z] | ||||
| The Expression Level of Disease Section Compare with the Healthy Individual Tissue | p-value: 6.80E-01; Fold-change: -3.78E-02; Z-score: -2.75E+00 | ||||
|
DME expression in the diseased tissue of patients
DME expression in the normal tissue of healthy individuals
|
|||||
| Violin Diagram of DME Disease-specific Protein Abundances |
|
Click to View the Clearer Original Diagram | |||
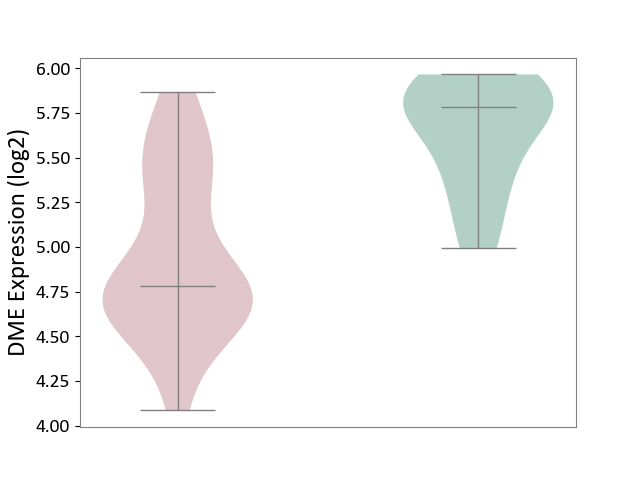
| The Studied Tissue | White matter tissue | ||||
| The Specified Disease | Glioma [ICD-11:2A00.0Y-2A00.0Z] | ||||
| The Expression Level of Disease Section Compare with the Healthy Individual Tissue | p-value: 6.78E-06; Fold-change: -1.01E+00; Z-score: -3.20E+00 | ||||
|
DME expression in the diseased tissue of patients
DME expression in the normal tissue of healthy individuals
|
|||||
| Violin Diagram of DME Disease-specific Protein Abundances |
|
Click to View the Clearer Original Diagram | |||
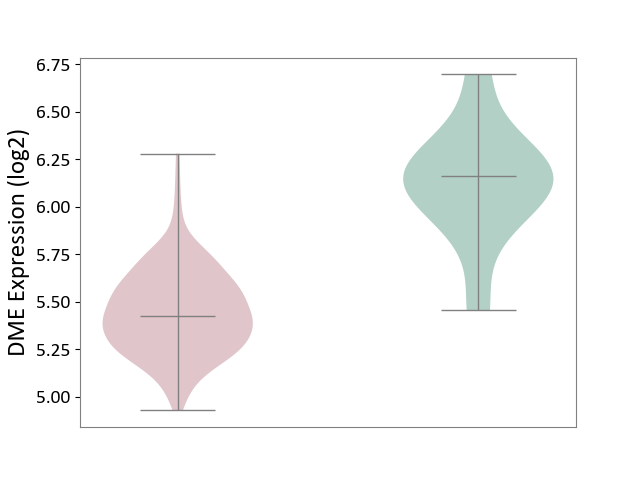
| The Studied Tissue | Brain stem tissue | ||||
| The Specified Disease | Neuroectodermal tumour [ICD-11:2A00.11] | ||||
| The Expression Level of Disease Section Compare with the Healthy Individual Tissue | p-value: 6.17E-05; Fold-change: -7.40E-01; Z-score: -2.38E+00 | ||||
|
DME expression in the diseased tissue of patients
DME expression in the normal tissue of healthy individuals
|
|||||
| Violin Diagram of DME Disease-specific Protein Abundances |
|
Click to View the Clearer Original Diagram | |||
| ICD-11: 2A20 | Myeloproliferative neoplasm | Click to Show/Hide | |||
| The Studied Tissue | Whole blood | ||||
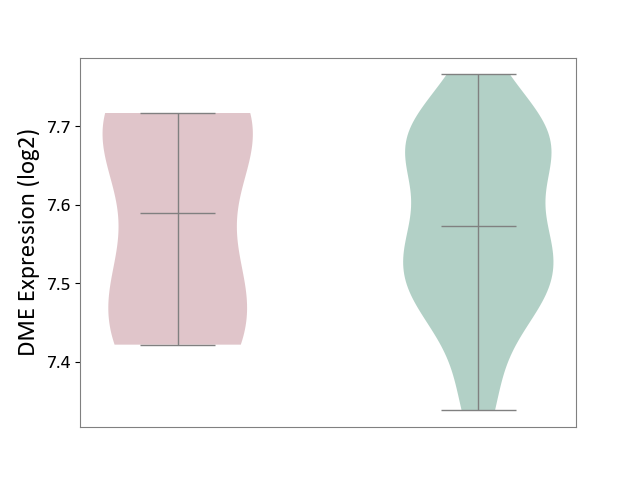
| The Specified Disease | Myelofibrosis [ICD-11:2A20.2] | ||||
| The Expression Level of Disease Section Compare with the Healthy Individual Tissue | p-value: 9.49E-01; Fold-change: 1.64E-02; Z-score: 1.45E-01 | ||||
|
DME expression in the diseased tissue of patients
DME expression in the normal tissue of healthy individuals
|
|||||
| Violin Diagram of DME Disease-specific Protein Abundances |
|
Click to View the Clearer Original Diagram | |||
| The Studied Tissue | Whole blood | ||||
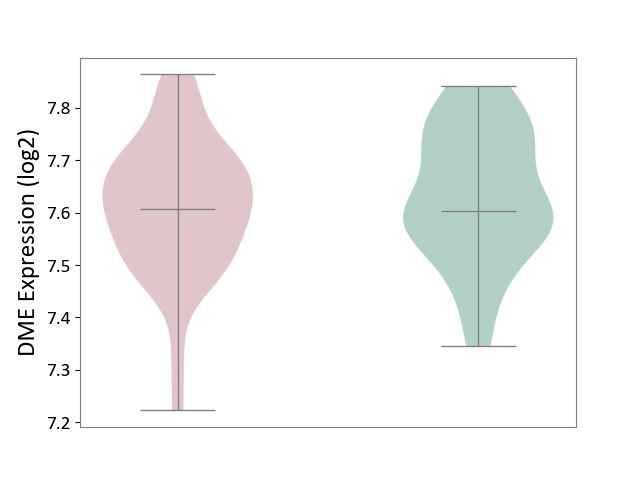
| The Specified Disease | Polycythemia vera [ICD-11:2A20.4] | ||||
| The Expression Level of Disease Section Compare with the Healthy Individual Tissue | p-value: 4.17E-01; Fold-change: 4.45E-03; Z-score: 3.46E-02 | ||||
|
DME expression in the diseased tissue of patients
DME expression in the normal tissue of healthy individuals
|
|||||
| Violin Diagram of DME Disease-specific Protein Abundances |
|
Click to View the Clearer Original Diagram | |||
| ICD-11: 2A36 | Myelodysplastic syndrome | Click to Show/Hide | |||
| The Studied Tissue | Bone marrow | ||||
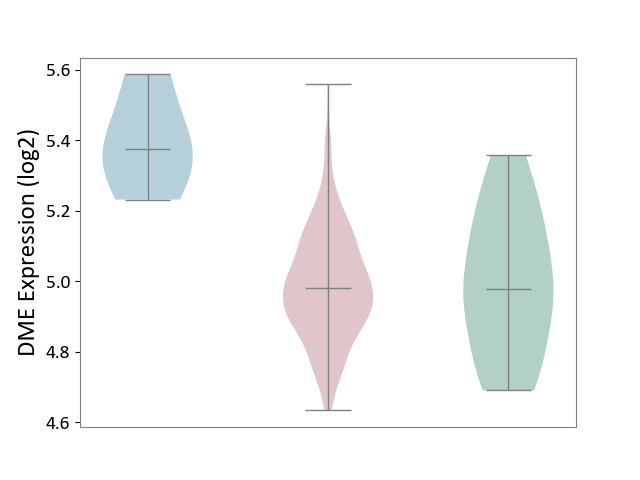
| The Specified Disease | Myelodysplastic syndrome [ICD-11:2A36-2A3Z] | ||||
| The Expression Level of Disease Section Compare with the Healthy Individual Tissue | p-value: 8.12E-01; Fold-change: 3.88E-03; Z-score: 1.91E-02 | ||||
| The Expression Level of Disease Section Compare with the Adjacent Tissue | p-value: 1.09E-02; Fold-change: -3.95E-01; Z-score: -2.70E+00 | ||||
|
DME expression in the diseased tissue of patients
DME expression in the normal tissue adjacent to the diseased tissue of patients
DME expression in the normal tissue of healthy individuals
|
|||||
| Violin Diagram of DME Disease-specific Protein Abundances |
|
Click to View the Clearer Original Diagram | |||
| ICD-11: 2A81 | Diffuse large B-cell lymphoma | Click to Show/Hide | |||
| The Studied Tissue | Tonsil tissue | ||||
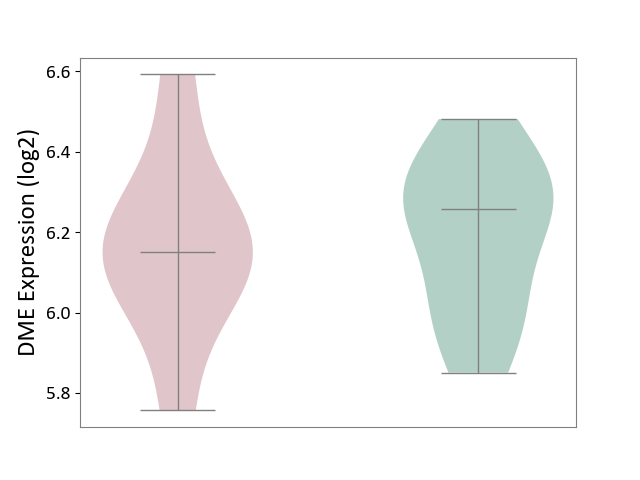
| The Specified Disease | Diffuse large B-cell lymphoma [ICD-11:2A81] | ||||
| The Expression Level of Disease Section Compare with the Healthy Individual Tissue | p-value: 7.86E-01; Fold-change: -1.05E-01; Z-score: -5.26E-01 | ||||
|
DME expression in the diseased tissue of patients
DME expression in the normal tissue of healthy individuals
|
|||||
| Violin Diagram of DME Disease-specific Protein Abundances |
|
Click to View the Clearer Original Diagram | |||
| ICD-11: 2A83 | Plasma cell neoplasm | Click to Show/Hide | |||
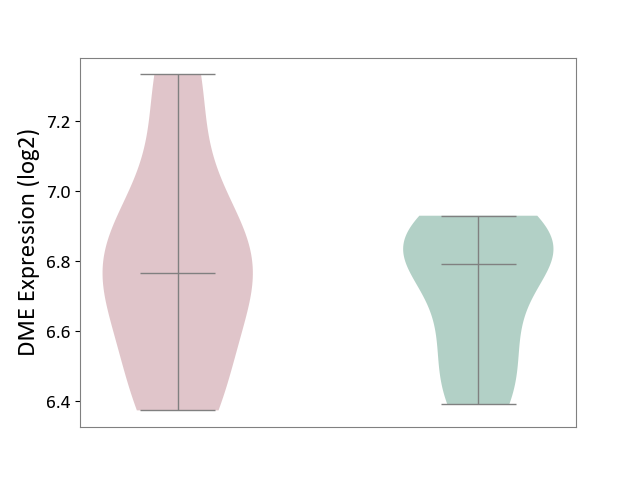
| The Studied Tissue | Peripheral blood | ||||
| The Specified Disease | Multiple myeloma [ICD-11:2A83.1] | ||||
| The Expression Level of Disease Section Compare with the Healthy Individual Tissue | p-value: 4.57E-01; Fold-change: -2.61E-02; Z-score: -1.37E-01 | ||||
|
DME expression in the diseased tissue of patients
DME expression in the normal tissue of healthy individuals
|
|||||
| Violin Diagram of DME Disease-specific Protein Abundances |
|
Click to View the Clearer Original Diagram | |||
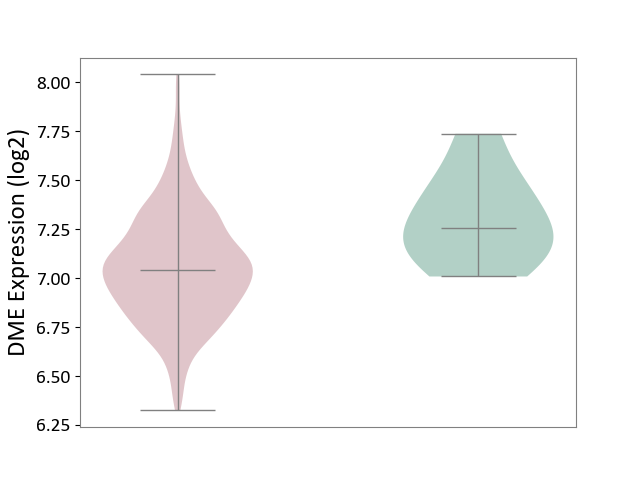
| The Studied Tissue | Bone marrow | ||||
| The Specified Disease | Multiple myeloma [ICD-11:2A83.1] | ||||
| The Expression Level of Disease Section Compare with the Healthy Individual Tissue | p-value: 1.91E-02; Fold-change: -2.13E-01; Z-score: -9.08E-01 | ||||
|
DME expression in the diseased tissue of patients
DME expression in the normal tissue of healthy individuals
|
|||||
| Violin Diagram of DME Disease-specific Protein Abundances |
|
Click to View the Clearer Original Diagram | |||
| ICD-11: 2B33 | Leukaemia | Click to Show/Hide | |||
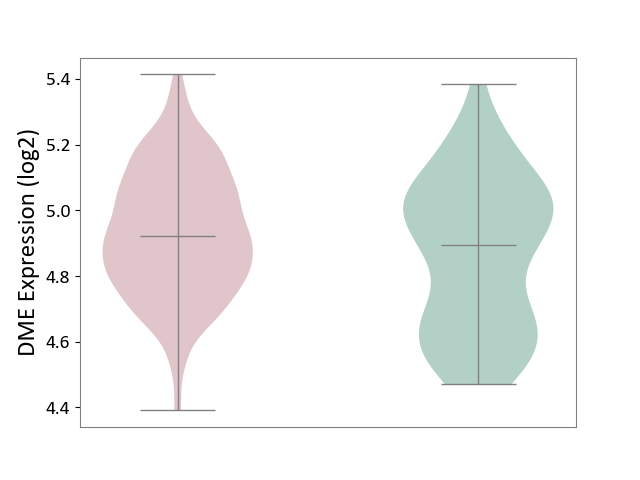
| The Studied Tissue | Bone marrow | ||||
| The Specified Disease | Acute myelocytic leukaemia [ICD-11:2B33.1] | ||||
| The Expression Level of Disease Section Compare with the Healthy Individual Tissue | p-value: 7.09E-03; Fold-change: 2.84E-02; Z-score: 1.20E-01 | ||||
|
DME expression in the diseased tissue of patients
DME expression in the normal tissue of healthy individuals
|
|||||
| Violin Diagram of DME Disease-specific Protein Abundances |
|
Click to View the Clearer Original Diagram | |||
| ICD-11: 2B6E | Oral cancer | Click to Show/Hide | |||
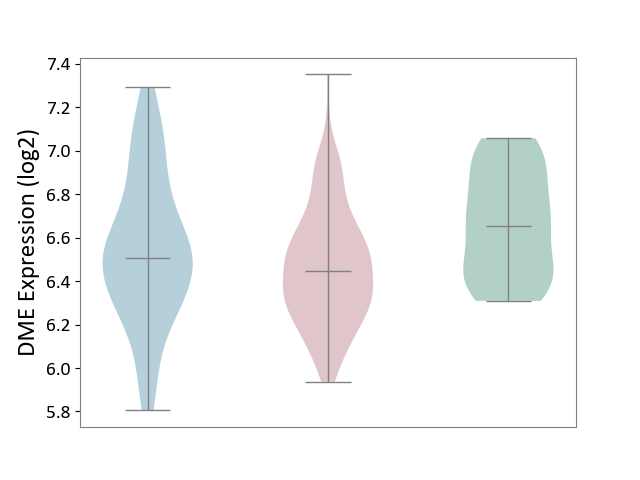
| The Studied Tissue | Oral tissue | ||||
| The Specified Disease | Oral cancer [ICD-11:2B6E] | ||||
| The Expression Level of Disease Section Compare with the Healthy Individual Tissue | p-value: 2.86E-04; Fold-change: -2.07E-01; Z-score: -8.44E-01 | ||||
| The Expression Level of Disease Section Compare with the Adjacent Tissue | p-value: 4.38E-02; Fold-change: -6.23E-02; Z-score: -1.85E-01 | ||||
|
DME expression in the diseased tissue of patients
DME expression in the normal tissue adjacent to the diseased tissue of patients
DME expression in the normal tissue of healthy individuals
|
|||||
| Violin Diagram of DME Disease-specific Protein Abundances |
|
Click to View the Clearer Original Diagram | |||
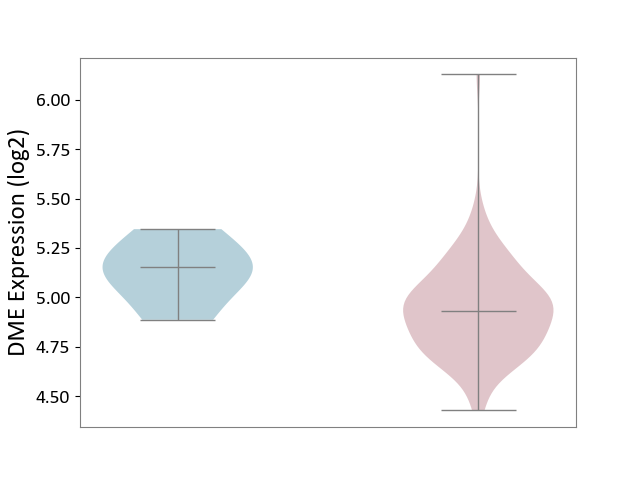
| ICD-11: 2B70 | Esophageal cancer | Click to Show/Hide | |||
| The Studied Tissue | Esophagus | ||||
| The Specified Disease | Esophagal cancer [ICD-11:2B70] | ||||
| The Expression Level of Disease Section Compare with the Adjacent Tissue | p-value: 6.12E-02; Fold-change: -2.22E-01; Z-score: -1.32E+00 | ||||
|
DME expression in the diseased tissue of patients
DME expression in the normal tissue adjacent to the diseased tissue of patients
|
|||||
| Violin Diagram of DME Disease-specific Protein Abundances |
|
Click to View the Clearer Original Diagram | |||
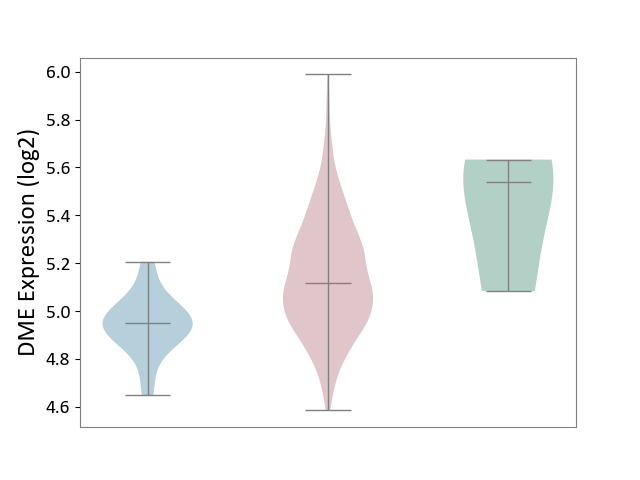
| ICD-11: 2B72 | Stomach cancer | Click to Show/Hide | |||
| The Studied Tissue | Gastric tissue | ||||
| The Specified Disease | Gastric cancer [ICD-11:2B72] | ||||
| The Expression Level of Disease Section Compare with the Healthy Individual Tissue | p-value: 2.47E-01; Fold-change: -4.22E-01; Z-score: -1.43E+00 | ||||
| The Expression Level of Disease Section Compare with the Adjacent Tissue | p-value: 5.23E-06; Fold-change: 1.68E-01; Z-score: 1.33E+00 | ||||
|
DME expression in the diseased tissue of patients
DME expression in the normal tissue adjacent to the diseased tissue of patients
DME expression in the normal tissue of healthy individuals
|
|||||
| Violin Diagram of DME Disease-specific Protein Abundances |
|
Click to View the Clearer Original Diagram | |||
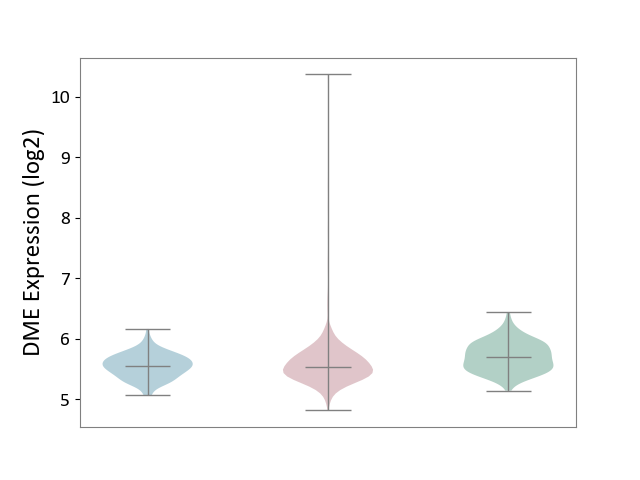
| ICD-11: 2B90 | Colon cancer | Click to Show/Hide | |||
| The Studied Tissue | Colon tissue | ||||
| The Specified Disease | Colon cancer [ICD-11:2B90] | ||||
| The Expression Level of Disease Section Compare with the Healthy Individual Tissue | p-value: 7.40E-09; Fold-change: -1.57E-01; Z-score: -6.38E-01 | ||||
| The Expression Level of Disease Section Compare with the Adjacent Tissue | p-value: 2.39E-01; Fold-change: -7.32E-03; Z-score: -3.62E-02 | ||||
|
DME expression in the diseased tissue of patients
DME expression in the normal tissue adjacent to the diseased tissue of patients
DME expression in the normal tissue of healthy individuals
|
|||||
| Violin Diagram of DME Disease-specific Protein Abundances |
|
Click to View the Clearer Original Diagram | |||
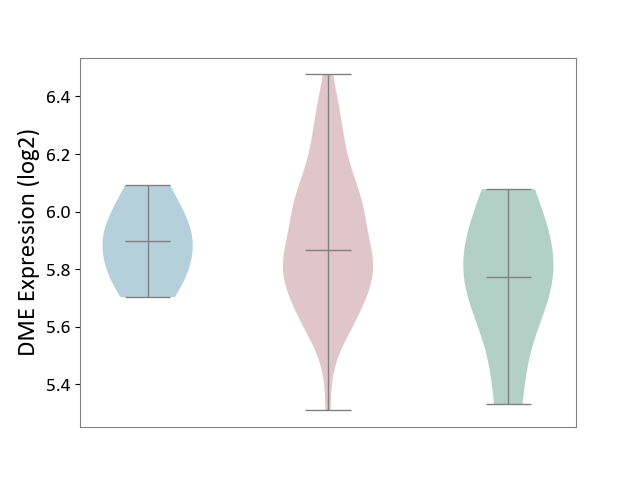
| ICD-11: 2B92 | Rectal cancer | Click to Show/Hide | |||
| The Studied Tissue | Rectal colon tissue | ||||
| The Specified Disease | Rectal cancer [ICD-11:2B92] | ||||
| The Expression Level of Disease Section Compare with the Healthy Individual Tissue | p-value: 2.43E-01; Fold-change: 9.13E-02; Z-score: 3.60E-01 | ||||
| The Expression Level of Disease Section Compare with the Adjacent Tissue | p-value: 8.24E-01; Fold-change: -3.09E-02; Z-score: -2.26E-01 | ||||
|
DME expression in the diseased tissue of patients
DME expression in the normal tissue adjacent to the diseased tissue of patients
DME expression in the normal tissue of healthy individuals
|
|||||
| Violin Diagram of DME Disease-specific Protein Abundances |
|
Click to View the Clearer Original Diagram | |||
| ICD-11: 2C10 | Pancreatic cancer | Click to Show/Hide | |||
| The Studied Tissue | Pancreas | ||||
| The Specified Disease | Pancreatic cancer [ICD-11:2C10] | ||||
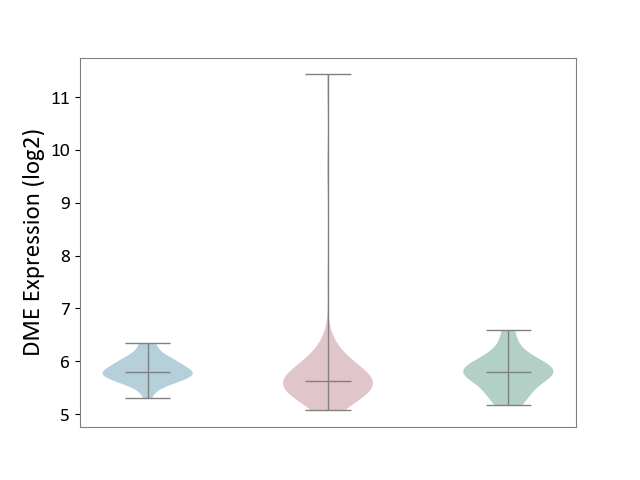
| The Expression Level of Disease Section Compare with the Healthy Individual Tissue | p-value: 8.07E-01; Fold-change: -1.65E-01; Z-score: -4.62E-01 | ||||
| The Expression Level of Disease Section Compare with the Adjacent Tissue | p-value: 2.75E-01; Fold-change: -1.73E-01; Z-score: -7.49E-01 | ||||
|
DME expression in the diseased tissue of patients
DME expression in the normal tissue adjacent to the diseased tissue of patients
DME expression in the normal tissue of healthy individuals
|
|||||
| Violin Diagram of DME Disease-specific Protein Abundances |
|
Click to View the Clearer Original Diagram | |||
| ICD-11: 2C12 | Liver cancer | Click to Show/Hide | |||
| The Studied Tissue | Liver tissue | ||||
| The Specified Disease | Liver cancer [ICD-11:2C12.0] | ||||
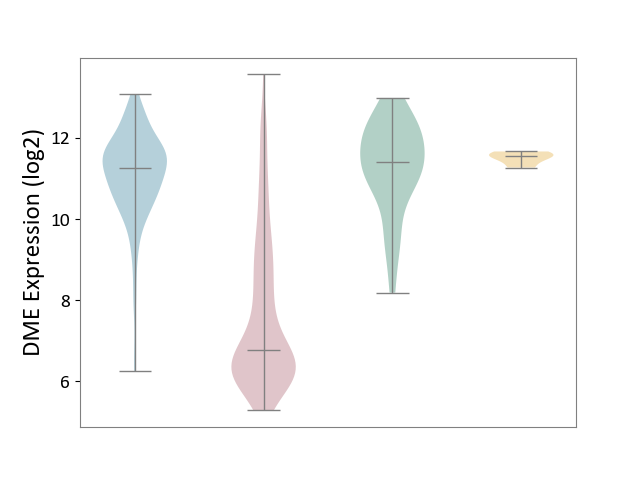
| The Expression Level of Disease Section Compare with the Healthy Individual Tissue | p-value: 1.81E-28; Fold-change: -4.64E+00; Z-score: -4.14E+00 | ||||
| The Expression Level of Disease Section Compare with the Adjacent Tissue | p-value: 1.99E-115; Fold-change: -4.51E+00; Z-score: -4.21E+00 | ||||
| The Expression Level of Disease Section Compare with the Other Disease Section | p-value: 2.85E-14; Fold-change: -4.79E+00; Z-score: -2.82E+01 | ||||
|
DME expression in the diseased tissue of patients
DME expression in the normal tissue adjacent to the diseased tissue of patients
DME expression in the normal tissue of healthy individuals
DME expression in tissue other than the diseased tissue of patients
|
|||||
| Violin Diagram of DME Disease-specific Protein Abundances |
|
Click to View the Clearer Original Diagram | |||
| ICD-11: 2C25 | Lung cancer | Click to Show/Hide | |||
| The Studied Tissue | Lung tissue | ||||
| The Specified Disease | Lung cancer [ICD-11:2C25] | ||||
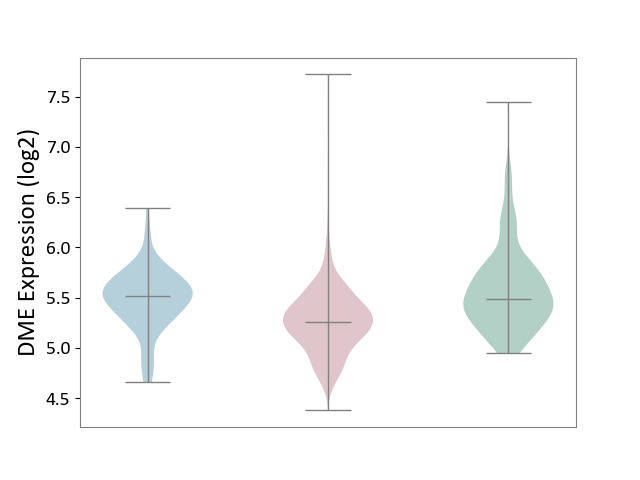
| The Expression Level of Disease Section Compare with the Healthy Individual Tissue | p-value: 5.52E-19; Fold-change: -2.25E-01; Z-score: -5.53E-01 | ||||
| The Expression Level of Disease Section Compare with the Adjacent Tissue | p-value: 1.68E-11; Fold-change: -2.55E-01; Z-score: -8.41E-01 | ||||
|
DME expression in the diseased tissue of patients
DME expression in the normal tissue adjacent to the diseased tissue of patients
DME expression in the normal tissue of healthy individuals
|
|||||
| Violin Diagram of DME Disease-specific Protein Abundances |
|
Click to View the Clearer Original Diagram | |||
| ICD-11: 2C30 | Skin cancer | Click to Show/Hide | |||
| The Studied Tissue | Skin | ||||
| The Specified Disease | Melanoma [ICD-11:2C30] | ||||
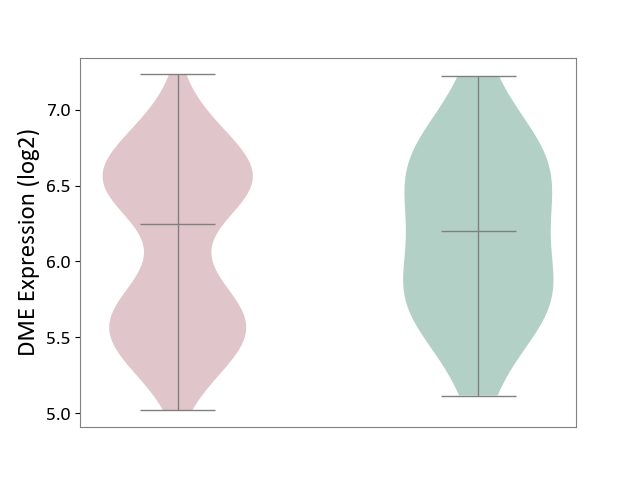
| The Expression Level of Disease Section Compare with the Healthy Individual Tissue | p-value: 5.08E-01; Fold-change: 4.54E-02; Z-score: 8.43E-02 | ||||
|
DME expression in the diseased tissue of patients
DME expression in the normal tissue of healthy individuals
|
|||||
| Violin Diagram of DME Disease-specific Protein Abundances |
|
Click to View the Clearer Original Diagram | |||
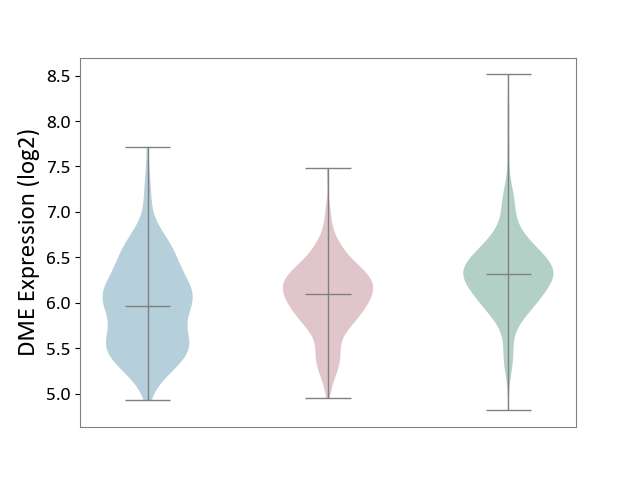
| The Studied Tissue | Skin | ||||
| The Specified Disease | Skin cancer [ICD-11:2C30-2C3Z] | ||||
| The Expression Level of Disease Section Compare with the Healthy Individual Tissue | p-value: 5.21E-12; Fold-change: -2.23E-01; Z-score: -4.75E-01 | ||||
| The Expression Level of Disease Section Compare with the Adjacent Tissue | p-value: 5.24E-02; Fold-change: 1.36E-01; Z-score: 2.70E-01 | ||||
|
DME expression in the diseased tissue of patients
DME expression in the normal tissue adjacent to the diseased tissue of patients
DME expression in the normal tissue of healthy individuals
|
|||||
| Violin Diagram of DME Disease-specific Protein Abundances |
|
Click to View the Clearer Original Diagram | |||
| ICD-11: 2C6Z | Breast cancer | Click to Show/Hide | |||
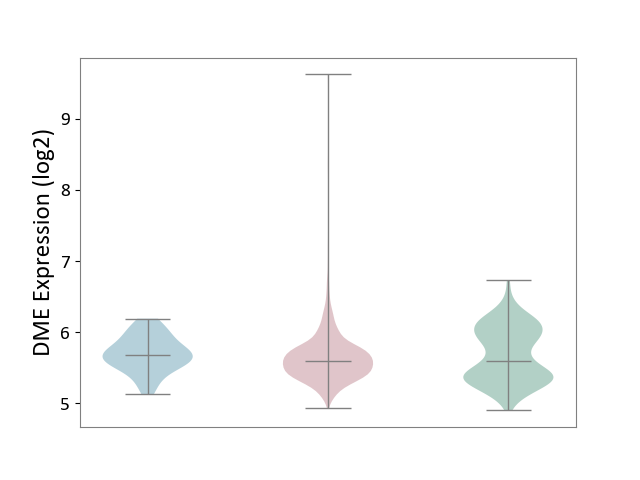
| The Studied Tissue | Breast tissue | ||||
| The Specified Disease | Breast cancer [ICD-11:2C60-2C6Z] | ||||
| The Expression Level of Disease Section Compare with the Healthy Individual Tissue | p-value: 4.34E-02; Fold-change: -5.62E-03; Z-score: -1.44E-02 | ||||
| The Expression Level of Disease Section Compare with the Adjacent Tissue | p-value: 7.29E-02; Fold-change: -8.55E-02; Z-score: -3.43E-01 | ||||
|
DME expression in the diseased tissue of patients
DME expression in the normal tissue adjacent to the diseased tissue of patients
DME expression in the normal tissue of healthy individuals
|
|||||
| Violin Diagram of DME Disease-specific Protein Abundances |
|
Click to View the Clearer Original Diagram | |||
| ICD-11: 2C73 | Ovarian cancer | Click to Show/Hide | |||
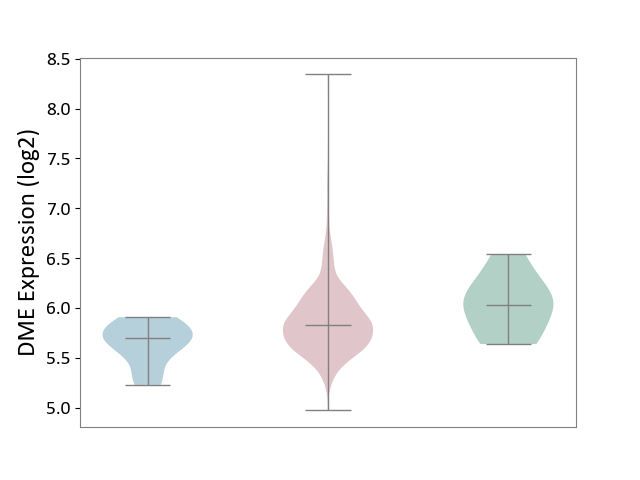
| The Studied Tissue | Ovarian tissue | ||||
| The Specified Disease | Ovarian cancer [ICD-11:2C73] | ||||
| The Expression Level of Disease Section Compare with the Healthy Individual Tissue | p-value: 1.57E-01; Fold-change: -2.01E-01; Z-score: -6.73E-01 | ||||
| The Expression Level of Disease Section Compare with the Adjacent Tissue | p-value: 1.60E-03; Fold-change: 1.33E-01; Z-score: 6.21E-01 | ||||
|
DME expression in the diseased tissue of patients
DME expression in the normal tissue adjacent to the diseased tissue of patients
DME expression in the normal tissue of healthy individuals
|
|||||
| Violin Diagram of DME Disease-specific Protein Abundances |
|
Click to View the Clearer Original Diagram | |||
| ICD-11: 2C77 | Cervical cancer | Click to Show/Hide | |||
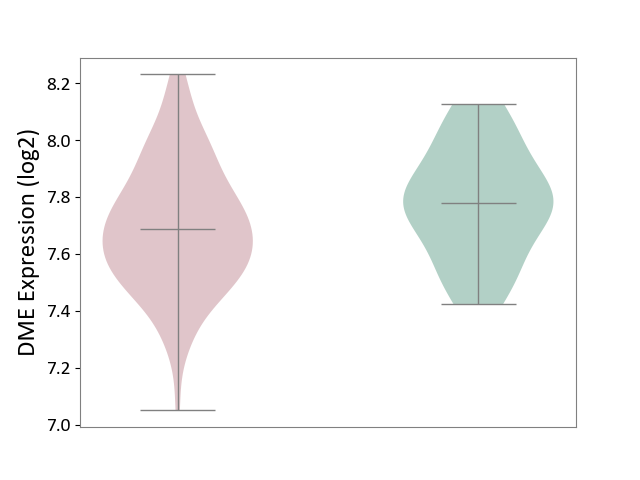
| The Studied Tissue | Cervical tissue | ||||
| The Specified Disease | Cervical cancer [ICD-11:2C77] | ||||
| The Expression Level of Disease Section Compare with the Healthy Individual Tissue | p-value: 1.02E-01; Fold-change: -9.34E-02; Z-score: -4.78E-01 | ||||
|
DME expression in the diseased tissue of patients
DME expression in the normal tissue of healthy individuals
|
|||||
| Violin Diagram of DME Disease-specific Protein Abundances |
|
Click to View the Clearer Original Diagram | |||
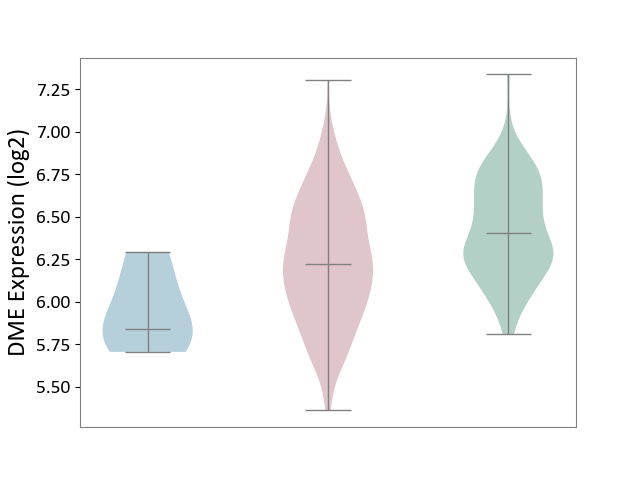
| ICD-11: 2C78 | Uterine cancer | Click to Show/Hide | |||
| The Studied Tissue | Endometrium tissue | ||||
| The Specified Disease | Uterine cancer [ICD-11:2C78] | ||||
| The Expression Level of Disease Section Compare with the Healthy Individual Tissue | p-value: 2.25E-08; Fold-change: -1.79E-01; Z-score: -6.25E-01 | ||||
| The Expression Level of Disease Section Compare with the Adjacent Tissue | p-value: 4.93E-02; Fold-change: 3.82E-01; Z-score: 1.62E+00 | ||||
|
DME expression in the diseased tissue of patients
DME expression in the normal tissue adjacent to the diseased tissue of patients
DME expression in the normal tissue of healthy individuals
|
|||||
| Violin Diagram of DME Disease-specific Protein Abundances |
|
Click to View the Clearer Original Diagram | |||
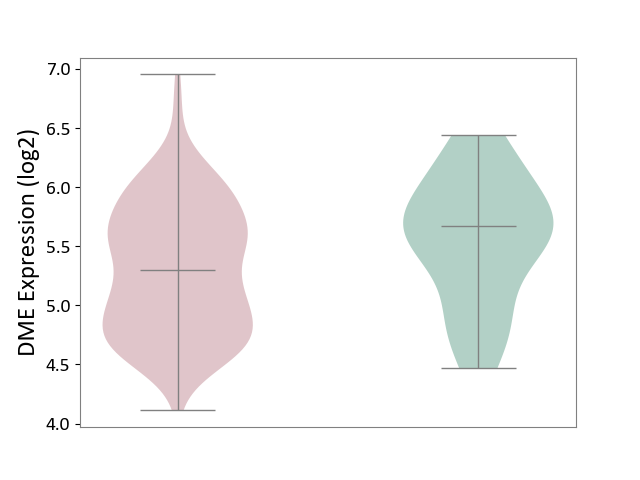
| ICD-11: 2C82 | Prostate cancer | Click to Show/Hide | |||
| The Studied Tissue | Prostate | ||||
| The Specified Disease | Prostate cancer [ICD-11:2C82] | ||||
| The Expression Level of Disease Section Compare with the Healthy Individual Tissue | p-value: 4.89E-02; Fold-change: -3.74E-01; Z-score: -6.96E-01 | ||||
|
DME expression in the diseased tissue of patients
DME expression in the normal tissue of healthy individuals
|
|||||
| Violin Diagram of DME Disease-specific Protein Abundances |
|
Click to View the Clearer Original Diagram | |||
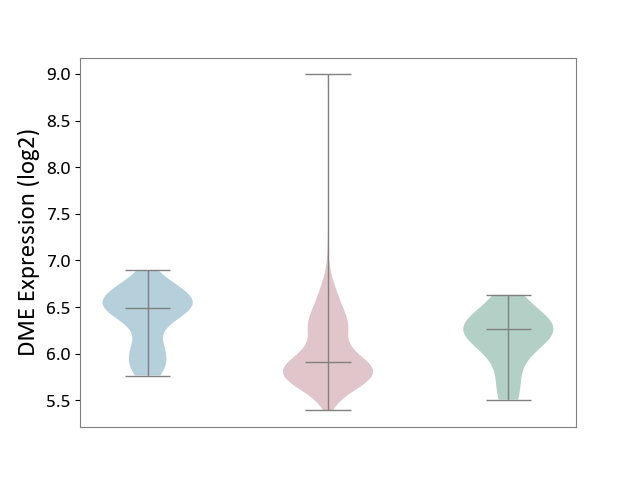
| ICD-11: 2C90 | Renal cancer | Click to Show/Hide | |||
| The Studied Tissue | Kidney | ||||
| The Specified Disease | Renal cancer [ICD-11:2C90-2C91] | ||||
| The Expression Level of Disease Section Compare with the Healthy Individual Tissue | p-value: 1.44E-01; Fold-change: -3.59E-01; Z-score: -1.14E+00 | ||||
| The Expression Level of Disease Section Compare with the Adjacent Tissue | p-value: 1.05E-14; Fold-change: -5.81E-01; Z-score: -1.87E+00 | ||||
|
DME expression in the diseased tissue of patients
DME expression in the normal tissue adjacent to the diseased tissue of patients
DME expression in the normal tissue of healthy individuals
|
|||||
| Violin Diagram of DME Disease-specific Protein Abundances |
|
Click to View the Clearer Original Diagram | |||
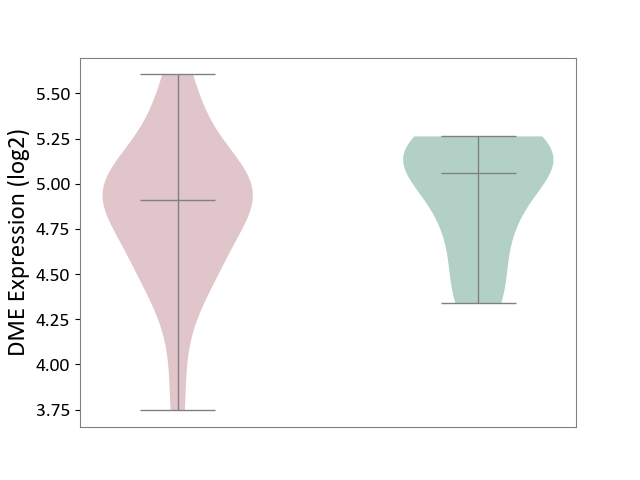
| ICD-11: 2C92 | Ureter cancer | Click to Show/Hide | |||
| The Studied Tissue | Urothelium | ||||
| The Specified Disease | Ureter cancer [ICD-11:2C92] | ||||
| The Expression Level of Disease Section Compare with the Healthy Individual Tissue | p-value: 4.20E-01; Fold-change: -1.49E-01; Z-score: -4.71E-01 | ||||
|
DME expression in the diseased tissue of patients
DME expression in the normal tissue of healthy individuals
|
|||||
| Violin Diagram of DME Disease-specific Protein Abundances |
|
Click to View the Clearer Original Diagram | |||
| ICD-11: 2C94 | Bladder cancer | Click to Show/Hide | |||
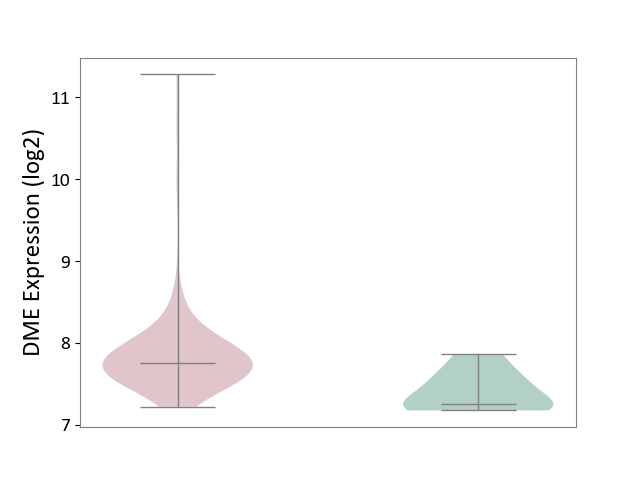
| The Studied Tissue | Bladder tissue | ||||
| The Specified Disease | Bladder cancer [ICD-11:2C94] | ||||
| The Expression Level of Disease Section Compare with the Healthy Individual Tissue | p-value: 1.80E-03; Fold-change: 5.04E-01; Z-score: 1.94E+00 | ||||
|
DME expression in the diseased tissue of patients
DME expression in the normal tissue of healthy individuals
|
|||||
| Violin Diagram of DME Disease-specific Protein Abundances |
|
Click to View the Clearer Original Diagram | |||
| ICD-11: 2D02 | Retinal cancer | Click to Show/Hide | |||
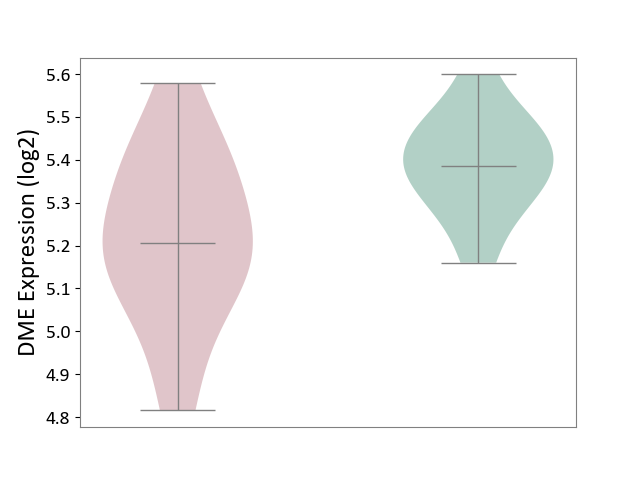
| The Studied Tissue | Uvea | ||||
| The Specified Disease | Retinoblastoma [ICD-11:2D02.2] | ||||
| The Expression Level of Disease Section Compare with the Healthy Individual Tissue | p-value: 1.36E-02; Fold-change: -1.81E-01; Z-score: -1.54E+00 | ||||
|
DME expression in the diseased tissue of patients
DME expression in the normal tissue of healthy individuals
|
|||||
| Violin Diagram of DME Disease-specific Protein Abundances |
|
Click to View the Clearer Original Diagram | |||
| ICD-11: 2D10 | Thyroid cancer | Click to Show/Hide | |||
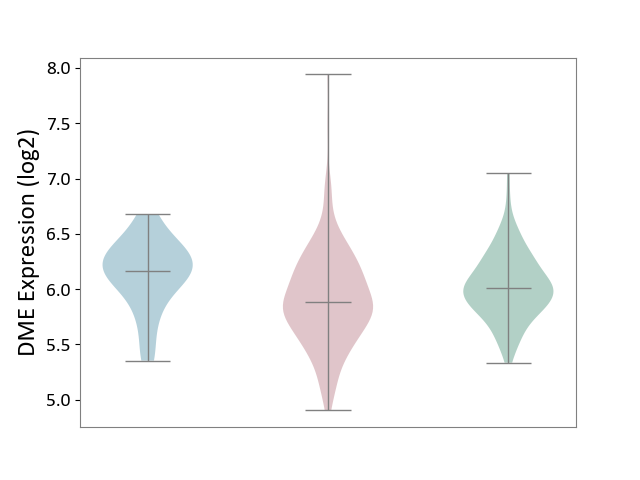
| The Studied Tissue | Thyroid | ||||
| The Specified Disease | Thyroid cancer [ICD-11:2D10] | ||||
| The Expression Level of Disease Section Compare with the Healthy Individual Tissue | p-value: 3.17E-03; Fold-change: -1.33E-01; Z-score: -4.42E-01 | ||||
| The Expression Level of Disease Section Compare with the Adjacent Tissue | p-value: 1.16E-04; Fold-change: -2.84E-01; Z-score: -9.01E-01 | ||||
|
DME expression in the diseased tissue of patients
DME expression in the normal tissue adjacent to the diseased tissue of patients
DME expression in the normal tissue of healthy individuals
|
|||||
| Violin Diagram of DME Disease-specific Protein Abundances |
|
Click to View the Clearer Original Diagram | |||
| ICD-11: 2D11 | Adrenal cancer | Click to Show/Hide | |||
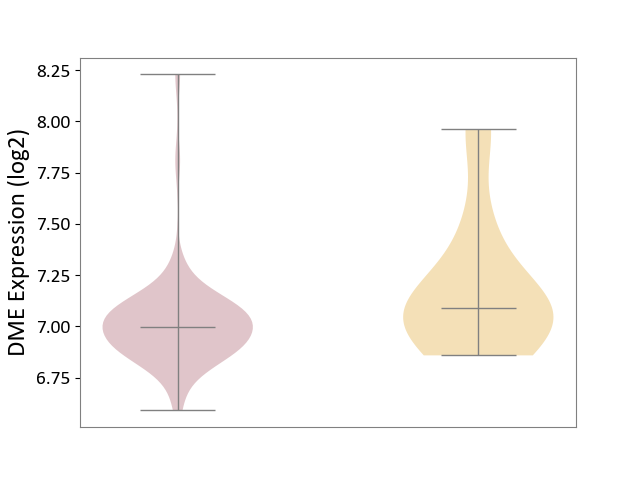
| The Studied Tissue | Adrenal cortex | ||||
| The Specified Disease | Adrenocortical carcinoma [ICD-11:2D11.Z] | ||||
| The Expression Level of Disease Section Compare with the Other Disease Section | p-value: 7.28E-02; Fold-change: -9.14E-02; Z-score: -2.74E-01 | ||||
|
DME expression in the diseased tissue of patients
DME expression in tissue other than the diseased tissue of patients
|
|||||
| Violin Diagram of DME Disease-specific Protein Abundances |
|
Click to View the Clearer Original Diagram | |||
| ICD-11: 2D12 | Endocrine gland neoplasm | Click to Show/Hide | |||
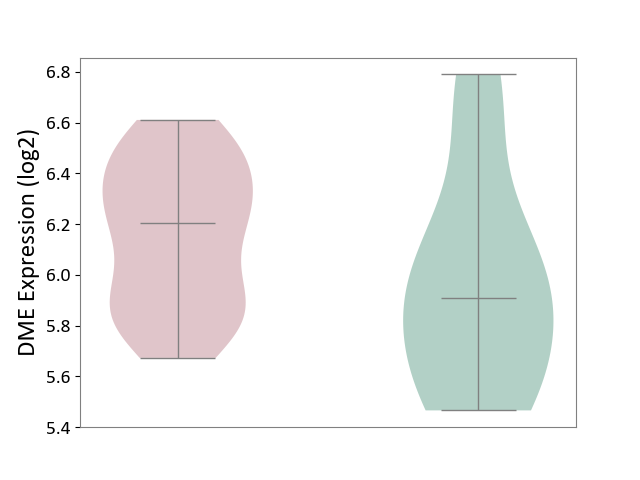
| The Studied Tissue | Pituitary tissue | ||||
| The Specified Disease | Pituitary cancer [ICD-11:2D12] | ||||
| The Expression Level of Disease Section Compare with the Healthy Individual Tissue | p-value: 1.93E-01; Fold-change: 2.93E-01; Z-score: 6.82E-01 | ||||
|
DME expression in the diseased tissue of patients
DME expression in the normal tissue of healthy individuals
|
|||||
| Violin Diagram of DME Disease-specific Protein Abundances |
|
Click to View the Clearer Original Diagram | |||
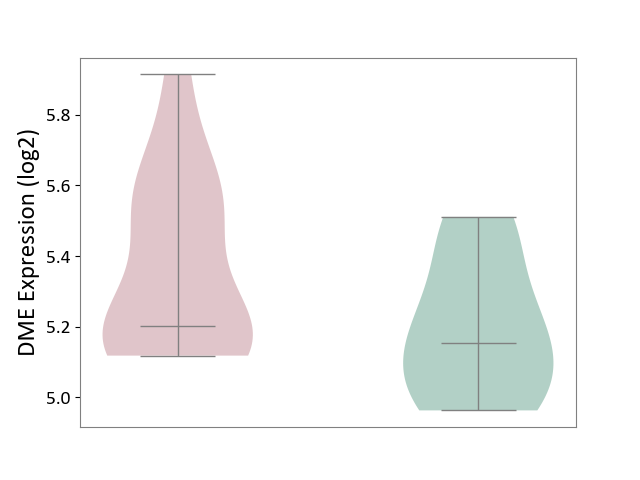
| The Studied Tissue | Pituitary tissue | ||||
| The Specified Disease | Pituitary gonadotrope tumour [ICD-11:2D12] | ||||
| The Expression Level of Disease Section Compare with the Healthy Individual Tissue | p-value: 9.18E-02; Fold-change: 4.85E-02; Z-score: 2.43E-01 | ||||
|
DME expression in the diseased tissue of patients
DME expression in the normal tissue of healthy individuals
|
|||||
| Violin Diagram of DME Disease-specific Protein Abundances |
|
Click to View the Clearer Original Diagram | |||
| ICD-11: 2D42 | Head and neck cancer | Click to Show/Hide | |||
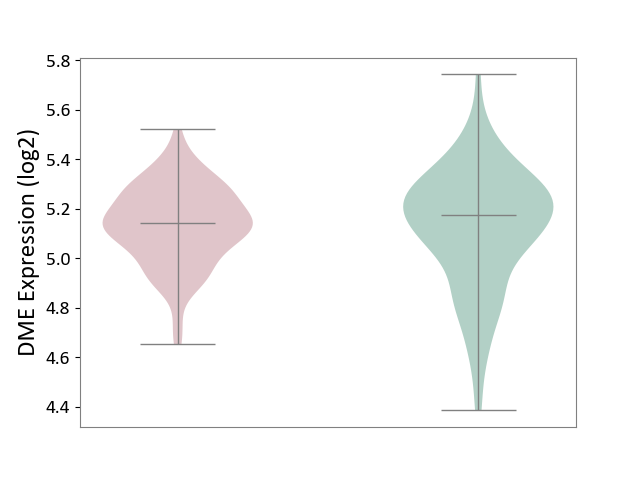
| The Studied Tissue | Head and neck tissue | ||||
| The Specified Disease | Head and neck cancer [ICD-11:2D42] | ||||
| The Expression Level of Disease Section Compare with the Healthy Individual Tissue | p-value: 7.26E-01; Fold-change: -3.16E-02; Z-score: -1.31E-01 | ||||
|
DME expression in the diseased tissue of patients
DME expression in the normal tissue of healthy individuals
|
|||||
| Violin Diagram of DME Disease-specific Protein Abundances |
|
Click to View the Clearer Original Diagram | |||
| ICD Disease Classification 03 | Blood/blood-forming organ disease | Click to Show/Hide | |||
| ICD-11: 3A51 | Sickle cell disorder | Click to Show/Hide | |||
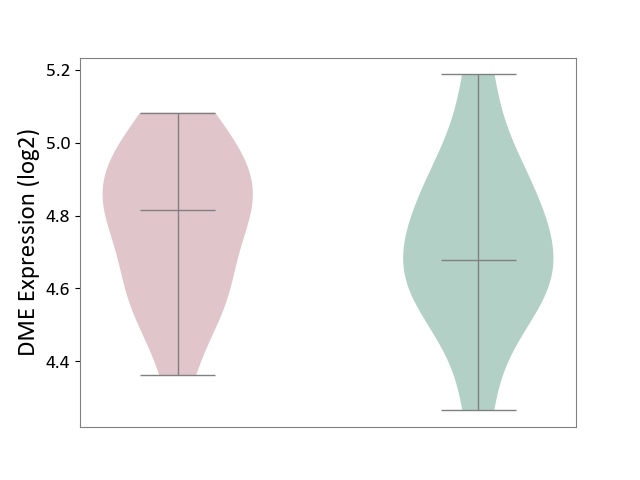
| The Studied Tissue | Peripheral blood | ||||
| The Specified Disease | Sickle cell disease [ICD-11:3A51.0-3A51.3] | ||||
| The Expression Level of Disease Section Compare with the Healthy Individual Tissue | p-value: 5.47E-01; Fold-change: 1.36E-01; Z-score: 5.68E-01 | ||||
|
DME expression in the diseased tissue of patients
DME expression in the normal tissue of healthy individuals
|
|||||
| Violin Diagram of DME Disease-specific Protein Abundances |
|
Click to View the Clearer Original Diagram | |||
| ICD-11: 3A70 | Aplastic anaemia | Click to Show/Hide | |||
| The Studied Tissue | Bone marrow | ||||
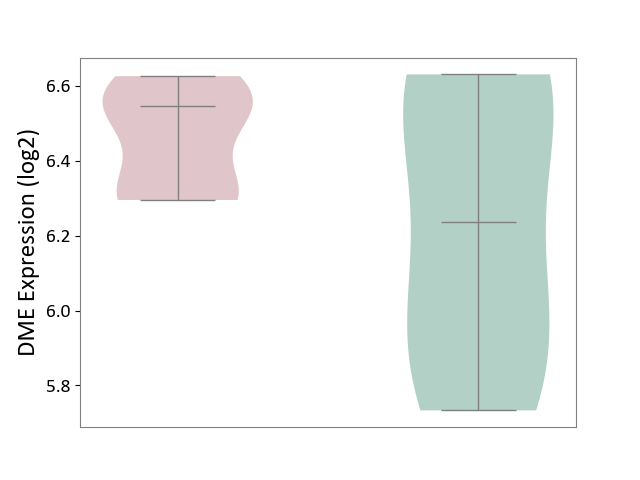
| The Specified Disease | Shwachman-Diamond syndrome [ICD-11:3A70.0] | ||||
| The Expression Level of Disease Section Compare with the Healthy Individual Tissue | p-value: 1.93E-01; Fold-change: 3.11E-01; Z-score: 8.10E-01 | ||||
|
DME expression in the diseased tissue of patients
DME expression in the normal tissue of healthy individuals
|
|||||
| Violin Diagram of DME Disease-specific Protein Abundances |
|
Click to View the Clearer Original Diagram | |||
| ICD-11: 3B63 | Thrombocytosis | Click to Show/Hide | |||
| The Studied Tissue | Whole blood | ||||
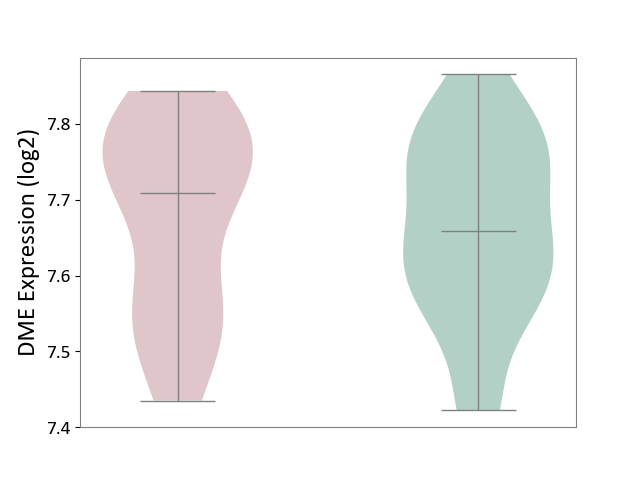
| The Specified Disease | Thrombocythemia [ICD-11:3B63] | ||||
| The Expression Level of Disease Section Compare with the Healthy Individual Tissue | p-value: 6.75E-01; Fold-change: 4.94E-02; Z-score: 4.06E-01 | ||||
|
DME expression in the diseased tissue of patients
DME expression in the normal tissue of healthy individuals
|
|||||
| Violin Diagram of DME Disease-specific Protein Abundances |
|
Click to View the Clearer Original Diagram | |||
| ICD-11: 3B64 | Thrombocytopenia | Click to Show/Hide | |||
| The Studied Tissue | Whole blood | ||||
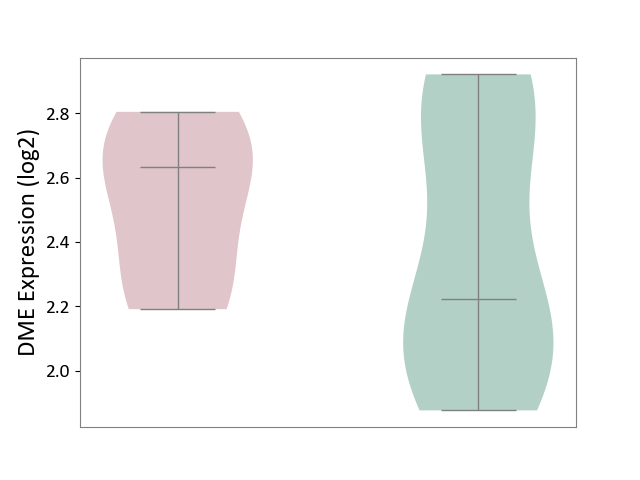
| The Specified Disease | Thrombocytopenia [ICD-11:3B64] | ||||
| The Expression Level of Disease Section Compare with the Healthy Individual Tissue | p-value: 4.45E-01; Fold-change: 4.11E-01; Z-score: 1.01E+00 | ||||
|
DME expression in the diseased tissue of patients
DME expression in the normal tissue of healthy individuals
|
|||||
| Violin Diagram of DME Disease-specific Protein Abundances |
|
Click to View the Clearer Original Diagram | |||
| ICD Disease Classification 04 | Immune system disease | Click to Show/Hide | |||
| ICD-11: 4A00 | Immunodeficiency | Click to Show/Hide | |||
| The Studied Tissue | Peripheral blood | ||||
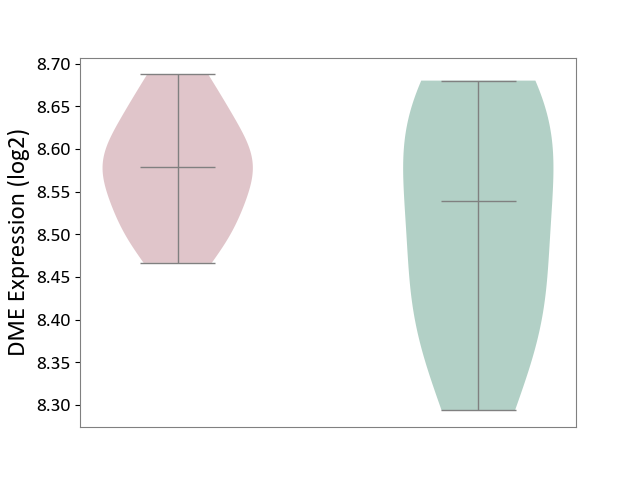
| The Specified Disease | Immunodeficiency [ICD-11:4A00-4A20] | ||||
| The Expression Level of Disease Section Compare with the Healthy Individual Tissue | p-value: 2.10E-01; Fold-change: 3.91E-02; Z-score: 2.93E-01 | ||||
|
DME expression in the diseased tissue of patients
DME expression in the normal tissue of healthy individuals
|
|||||
| Violin Diagram of DME Disease-specific Protein Abundances |
|
Click to View the Clearer Original Diagram | |||
| ICD-11: 4A40 | Lupus erythematosus | Click to Show/Hide | |||
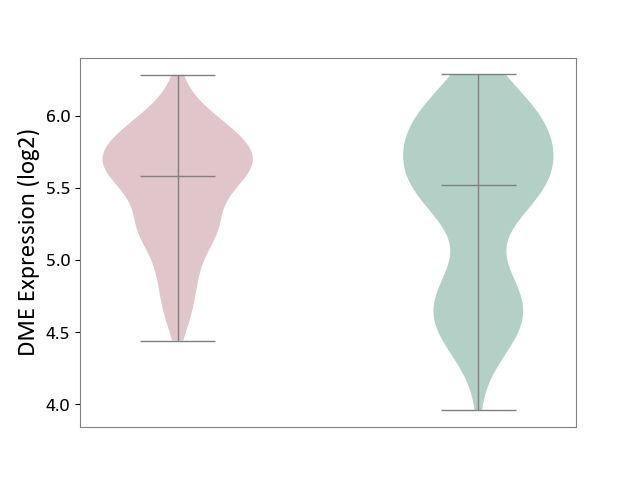
| The Studied Tissue | Whole blood | ||||
| The Specified Disease | Lupus erythematosus [ICD-11:4A40] | ||||
| The Expression Level of Disease Section Compare with the Healthy Individual Tissue | p-value: 7.82E-02; Fold-change: 6.06E-02; Z-score: 1.05E-01 | ||||
|
DME expression in the diseased tissue of patients
DME expression in the normal tissue of healthy individuals
|
|||||
| Violin Diagram of DME Disease-specific Protein Abundances |
|
Click to View the Clearer Original Diagram | |||
| ICD-11: 4A42 | Systemic sclerosis | Click to Show/Hide | |||
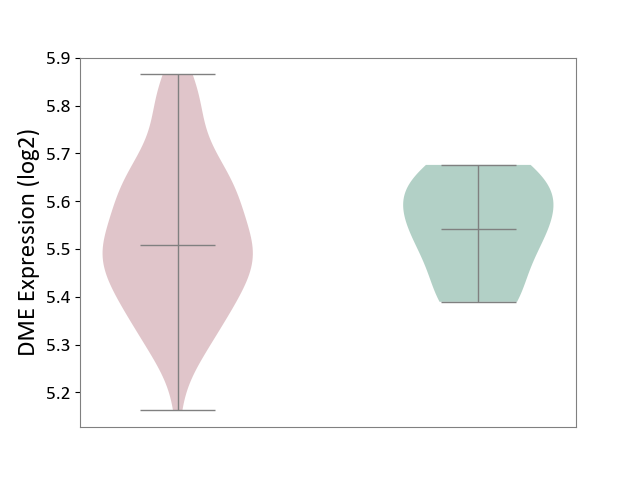
| The Studied Tissue | Whole blood | ||||
| The Specified Disease | Scleroderma [ICD-11:4A42.Z] | ||||
| The Expression Level of Disease Section Compare with the Healthy Individual Tissue | p-value: 7.03E-01; Fold-change: -3.32E-02; Z-score: -3.25E-01 | ||||
|
DME expression in the diseased tissue of patients
DME expression in the normal tissue of healthy individuals
|
|||||
| Violin Diagram of DME Disease-specific Protein Abundances |
|
Click to View the Clearer Original Diagram | |||
| ICD-11: 4A43 | Systemic autoimmune disease | Click to Show/Hide | |||
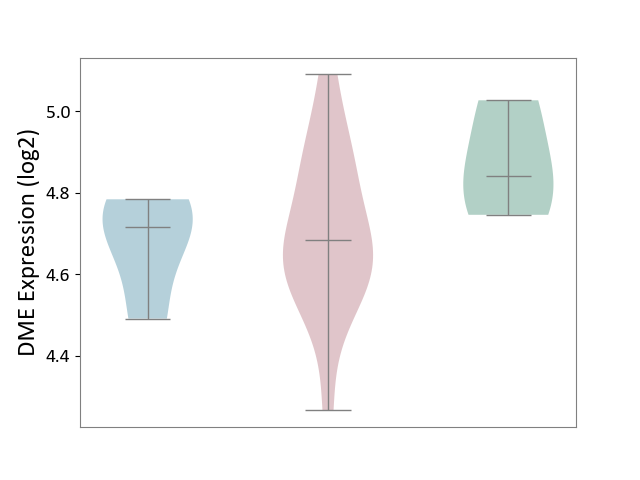
| The Studied Tissue | Salivary gland tissue | ||||
| The Specified Disease | Sjogren's syndrome [ICD-11:4A43.2] | ||||
| The Expression Level of Disease Section Compare with the Healthy Individual Tissue | p-value: 1.58E-01; Fold-change: -1.57E-01; Z-score: -1.10E+00 | ||||
| The Expression Level of Disease Section Compare with the Adjacent Tissue | p-value: 7.73E-01; Fold-change: -3.25E-02; Z-score: -2.49E-01 | ||||
|
DME expression in the diseased tissue of patients
DME expression in the normal tissue adjacent to the diseased tissue of patients
DME expression in the normal tissue of healthy individuals
|
|||||
| Violin Diagram of DME Disease-specific Protein Abundances |
|
Click to View the Clearer Original Diagram | |||
| ICD-11: 4A62 | Behcet disease | Click to Show/Hide | |||
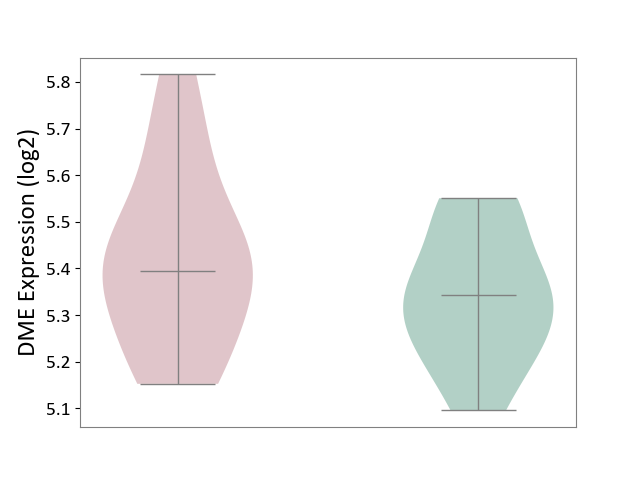
| The Studied Tissue | Peripheral blood | ||||
| The Specified Disease | Behcet's disease [ICD-11:4A62] | ||||
| The Expression Level of Disease Section Compare with the Healthy Individual Tissue | p-value: 2.40E-01; Fold-change: 5.14E-02; Z-score: 3.61E-01 | ||||
|
DME expression in the diseased tissue of patients
DME expression in the normal tissue of healthy individuals
|
|||||
| Violin Diagram of DME Disease-specific Protein Abundances |
|
Click to View the Clearer Original Diagram | |||
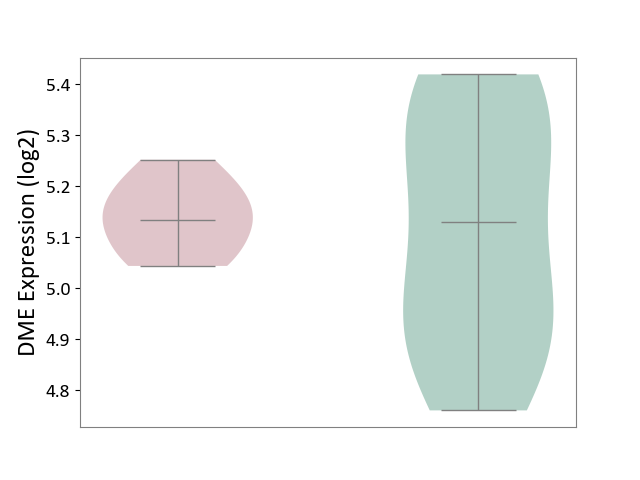
| ICD-11: 4B04 | Monocyte count disorder | Click to Show/Hide | |||
| The Studied Tissue | Whole blood | ||||
| The Specified Disease | Autosomal dominant monocytopenia [ICD-11:4B04] | ||||
| The Expression Level of Disease Section Compare with the Healthy Individual Tissue | p-value: 7.11E-01; Fold-change: 4.86E-03; Z-score: 2.07E-02 | ||||
|
DME expression in the diseased tissue of patients
DME expression in the normal tissue of healthy individuals
|
|||||
| Violin Diagram of DME Disease-specific Protein Abundances |
|
Click to View the Clearer Original Diagram | |||
| ICD Disease Classification 05 | Endocrine/nutritional/metabolic disease | Click to Show/Hide | |||
| ICD-11: 5A11 | Type 2 diabetes mellitus | Click to Show/Hide | |||
| The Studied Tissue | Omental adipose tissue | ||||
| The Specified Disease | Obesity related type 2 diabetes [ICD-11:5A11] | ||||
| The Expression Level of Disease Section Compare with the Healthy Individual Tissue | p-value: 6.35E-02; Fold-change: 7.63E-02; Z-score: 7.60E-01 | ||||
|
DME expression in the diseased tissue of patients
DME expression in the normal tissue of healthy individuals
|
|||||
| Violin Diagram of DME Disease-specific Protein Abundances |

|
Click to View the Clearer Original Diagram | |||
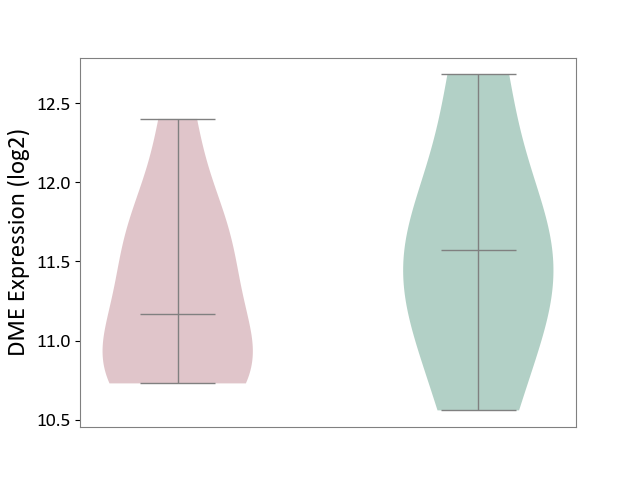
| The Studied Tissue | Liver tissue | ||||
| The Specified Disease | Type 2 diabetes [ICD-11:5A11] | ||||
| The Expression Level of Disease Section Compare with the Healthy Individual Tissue | p-value: 5.25E-01; Fold-change: -4.04E-01; Z-score: -5.29E-01 | ||||
|
DME expression in the diseased tissue of patients
DME expression in the normal tissue of healthy individuals
|
|||||
| Violin Diagram of DME Disease-specific Protein Abundances |
|
Click to View the Clearer Original Diagram | |||
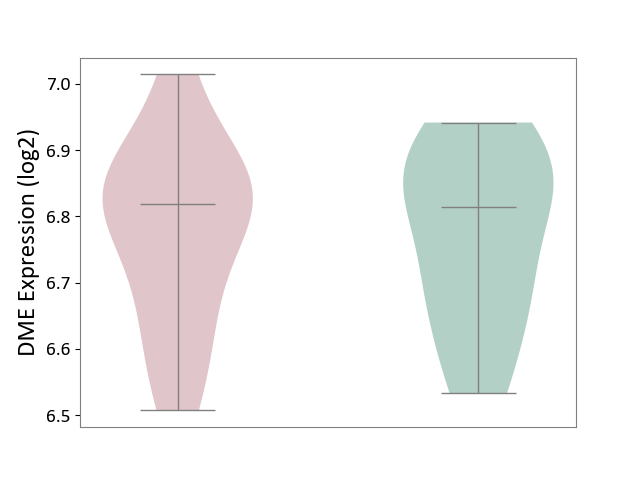
| ICD-11: 5A80 | Ovarian dysfunction | Click to Show/Hide | |||
| The Studied Tissue | Vastus lateralis muscle | ||||
| The Specified Disease | Polycystic ovary syndrome [ICD-11:5A80.1] | ||||
| The Expression Level of Disease Section Compare with the Healthy Individual Tissue | p-value: 9.40E-01; Fold-change: 4.31E-03; Z-score: 3.22E-02 | ||||
|
DME expression in the diseased tissue of patients
DME expression in the normal tissue of healthy individuals
|
|||||
| Violin Diagram of DME Disease-specific Protein Abundances |
|
Click to View the Clearer Original Diagram | |||
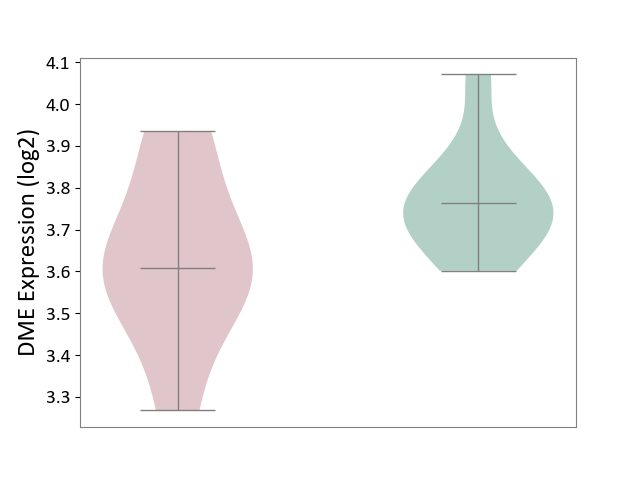
| ICD-11: 5C51 | Inborn carbohydrate metabolism disorder | Click to Show/Hide | |||
| The Studied Tissue | Biceps muscle | ||||
| The Specified Disease | Pompe disease [ICD-11:5C51.3] | ||||
| The Expression Level of Disease Section Compare with the Healthy Individual Tissue | p-value: 1.21E-01; Fold-change: -1.54E-01; Z-score: -1.17E+00 | ||||
|
DME expression in the diseased tissue of patients
DME expression in the normal tissue of healthy individuals
|
|||||
| Violin Diagram of DME Disease-specific Protein Abundances |
|
Click to View the Clearer Original Diagram | |||
| ICD-11: 5C56 | Lysosomal disease | Click to Show/Hide | |||
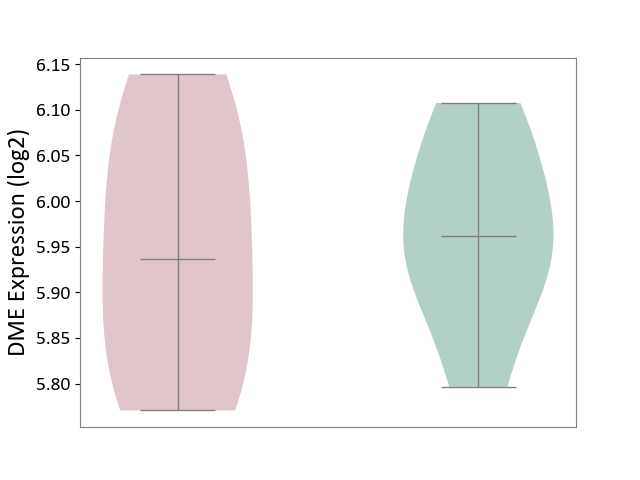
| The Studied Tissue | Whole blood | ||||
| The Specified Disease | Batten disease [ICD-11:5C56.1] | ||||
| The Expression Level of Disease Section Compare with the Healthy Individual Tissue | p-value: 7.58E-01; Fold-change: -2.44E-02; Z-score: -2.37E-01 | ||||
|
DME expression in the diseased tissue of patients
DME expression in the normal tissue of healthy individuals
|
|||||
| Violin Diagram of DME Disease-specific Protein Abundances |
|
Click to View the Clearer Original Diagram | |||
| ICD-11: 5C80 | Hyperlipoproteinaemia | Click to Show/Hide | |||
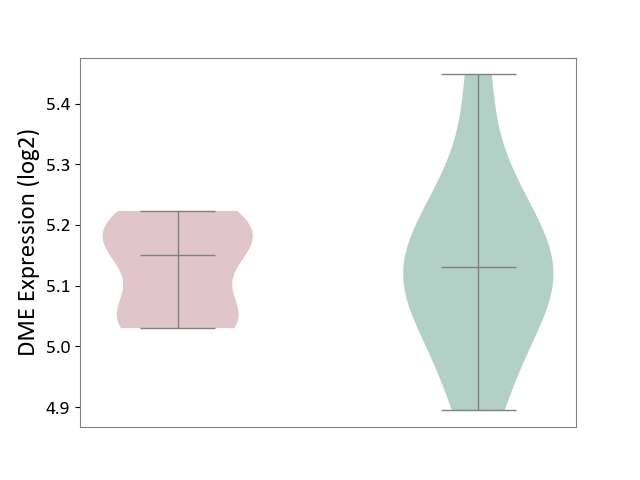
| The Studied Tissue | Peripheral blood | ||||
| The Specified Disease | Familial hypercholesterolemia [ICD-11:5C80.00] | ||||
| The Expression Level of Disease Section Compare with the Healthy Individual Tissue | p-value: 9.47E-01; Fold-change: 2.03E-02; Z-score: 1.38E-01 | ||||
|
DME expression in the diseased tissue of patients
DME expression in the normal tissue of healthy individuals
|
|||||
| Violin Diagram of DME Disease-specific Protein Abundances |
|
Click to View the Clearer Original Diagram | |||
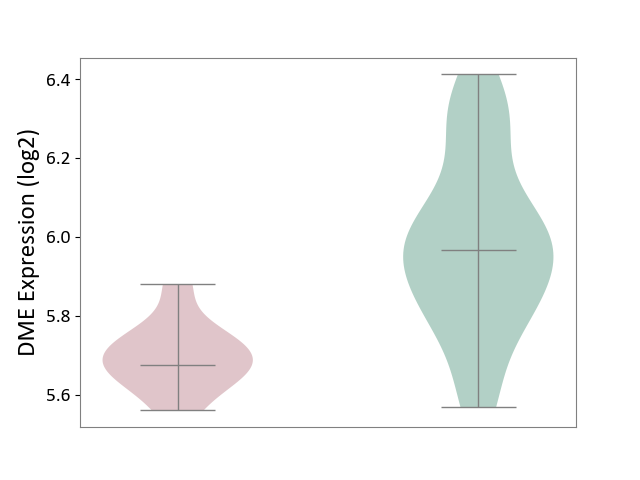
| The Studied Tissue | Whole blood | ||||
| The Specified Disease | Familial hypercholesterolemia [ICD-11:5C80.00] | ||||
| The Expression Level of Disease Section Compare with the Healthy Individual Tissue | p-value: 2.57E-07; Fold-change: -2.91E-01; Z-score: -1.32E+00 | ||||
|
DME expression in the diseased tissue of patients
DME expression in the normal tissue of healthy individuals
|
|||||
| Violin Diagram of DME Disease-specific Protein Abundances |
|
Click to View the Clearer Original Diagram | |||
| ICD Disease Classification 06 | Mental/behavioural/neurodevelopmental disorder | Click to Show/Hide | |||
| ICD-11: 6A02 | Autism spectrum disorder | Click to Show/Hide | |||
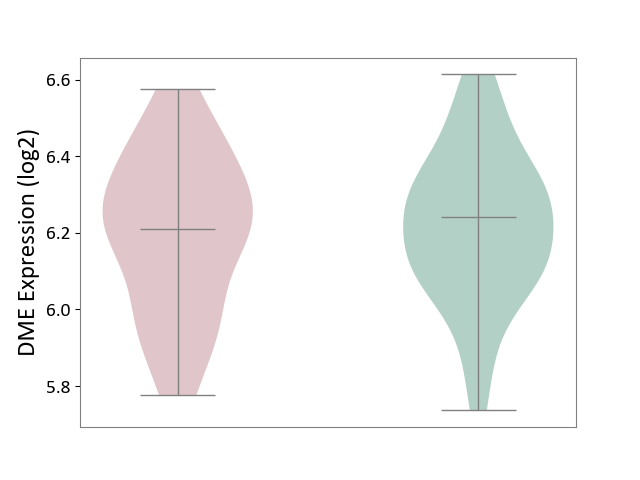
| The Studied Tissue | Whole blood | ||||
| The Specified Disease | Autism [ICD-11:6A02] | ||||
| The Expression Level of Disease Section Compare with the Healthy Individual Tissue | p-value: 6.97E-01; Fold-change: -3.00E-02; Z-score: -1.52E-01 | ||||
|
DME expression in the diseased tissue of patients
DME expression in the normal tissue of healthy individuals
|
|||||
| Violin Diagram of DME Disease-specific Protein Abundances |
|
Click to View the Clearer Original Diagram | |||
| ICD-11: 6A20 | Schizophrenia | Click to Show/Hide | |||
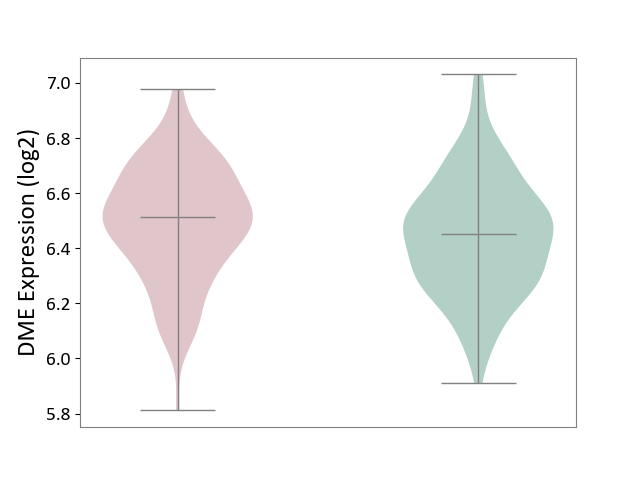
| The Studied Tissue | Prefrontal cortex | ||||
| The Specified Disease | Schizophrenia [ICD-11:6A20] | ||||
| The Expression Level of Disease Section Compare with the Healthy Individual Tissue | p-value: 6.73E-02; Fold-change: 6.49E-02; Z-score: 3.07E-01 | ||||
|
DME expression in the diseased tissue of patients
DME expression in the normal tissue of healthy individuals
|
|||||
| Violin Diagram of DME Disease-specific Protein Abundances |
|
Click to View the Clearer Original Diagram | |||
| The Studied Tissue | Superior temporal cortex | ||||
| The Specified Disease | Schizophrenia [ICD-11:6A20] | ||||
| The Expression Level of Disease Section Compare with the Healthy Individual Tissue | p-value: 6.45E-01; Fold-change: 2.07E-02; Z-score: 1.74E-01 | ||||
|
DME expression in the diseased tissue of patients
DME expression in the normal tissue of healthy individuals
|
|||||
| Violin Diagram of DME Disease-specific Protein Abundances |

|
Click to View the Clearer Original Diagram | |||
| ICD-11: 6A60 | Bipolar disorder | Click to Show/Hide | |||
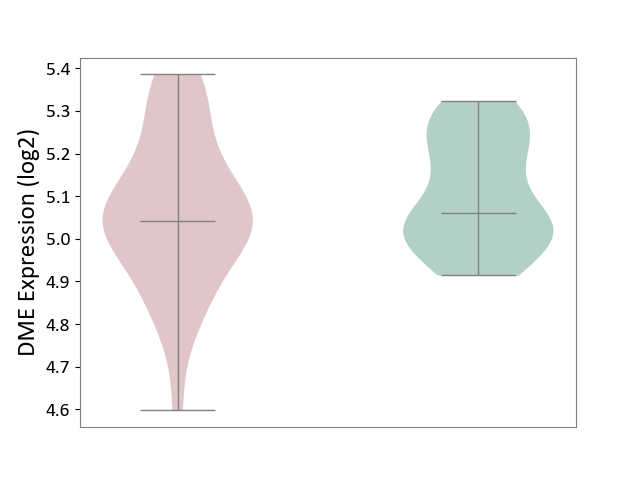
| The Studied Tissue | Prefrontal cortex | ||||
| The Specified Disease | Bipolar disorder [ICD-11:6A60-6A6Z] | ||||
| The Expression Level of Disease Section Compare with the Healthy Individual Tissue | p-value: 2.61E-01; Fold-change: -1.90E-02; Z-score: -1.45E-01 | ||||
|
DME expression in the diseased tissue of patients
DME expression in the normal tissue of healthy individuals
|
|||||
| Violin Diagram of DME Disease-specific Protein Abundances |
|
Click to View the Clearer Original Diagram | |||
| ICD-11: 6A70 | Depressive disorder | Click to Show/Hide | |||
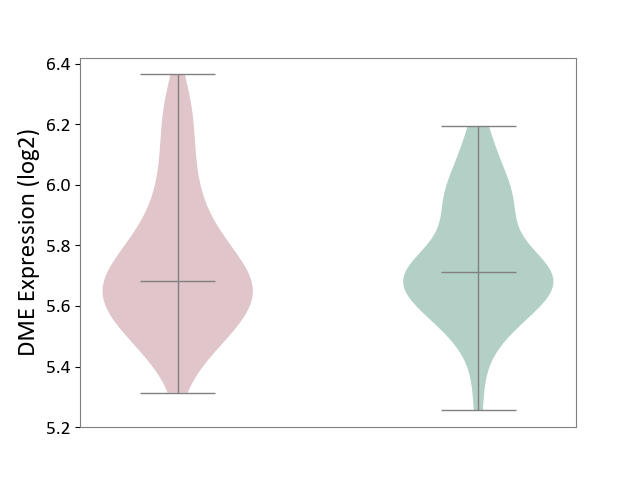
| The Studied Tissue | Whole blood | ||||
| The Specified Disease | Major depressive disorder [ICD-11:6A70-6A7Z] | ||||
| The Expression Level of Disease Section Compare with the Healthy Individual Tissue | p-value: 8.16E-01; Fold-change: -3.19E-02; Z-score: -1.62E-01 | ||||
|
DME expression in the diseased tissue of patients
DME expression in the normal tissue of healthy individuals
|
|||||
| Violin Diagram of DME Disease-specific Protein Abundances |
|
Click to View the Clearer Original Diagram | |||
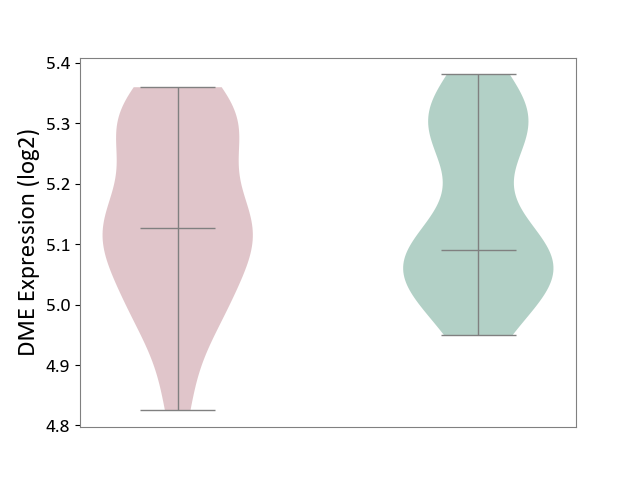
| The Studied Tissue | Hippocampus | ||||
| The Specified Disease | Major depressive disorder [ICD-11:6A70-6A7Z] | ||||
| The Expression Level of Disease Section Compare with the Healthy Individual Tissue | p-value: 8.68E-01; Fold-change: 3.64E-02; Z-score: 2.72E-01 | ||||
|
DME expression in the diseased tissue of patients
DME expression in the normal tissue of healthy individuals
|
|||||
| Violin Diagram of DME Disease-specific Protein Abundances |
|
Click to View the Clearer Original Diagram | |||
| ICD Disease Classification 08 | Nervous system disease | Click to Show/Hide | |||
| ICD-11: 8A00 | Parkinsonism | Click to Show/Hide | |||
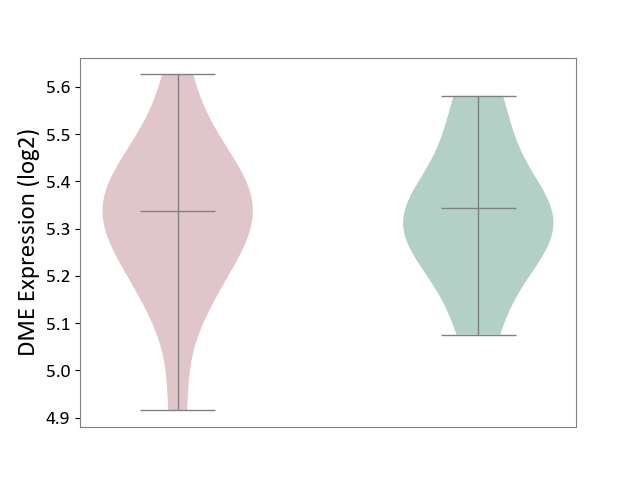
| The Studied Tissue | Substantia nigra tissue | ||||
| The Specified Disease | Parkinson's disease [ICD-11:8A00.0] | ||||
| The Expression Level of Disease Section Compare with the Healthy Individual Tissue | p-value: 8.46E-01; Fold-change: -6.63E-03; Z-score: -4.49E-02 | ||||
|
DME expression in the diseased tissue of patients
DME expression in the normal tissue of healthy individuals
|
|||||
| Violin Diagram of DME Disease-specific Protein Abundances |
|
Click to View the Clearer Original Diagram | |||
| ICD-11: 8A01 | Choreiform disorder | Click to Show/Hide | |||
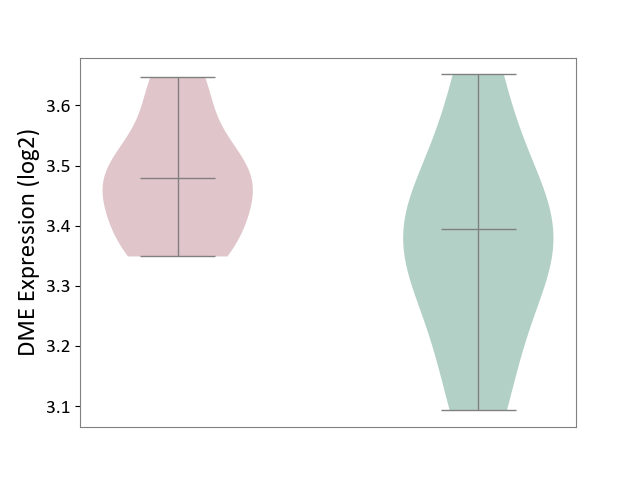
| The Studied Tissue | Whole blood | ||||
| The Specified Disease | Huntington's disease [ICD-11:8A01.10] | ||||
| The Expression Level of Disease Section Compare with the Healthy Individual Tissue | p-value: 1.24E-01; Fold-change: 8.50E-02; Z-score: 5.05E-01 | ||||
|
DME expression in the diseased tissue of patients
DME expression in the normal tissue of healthy individuals
|
|||||
| Violin Diagram of DME Disease-specific Protein Abundances |
|
Click to View the Clearer Original Diagram | |||
| ICD-11: 8A20 | Alzheimer disease | Click to Show/Hide | |||
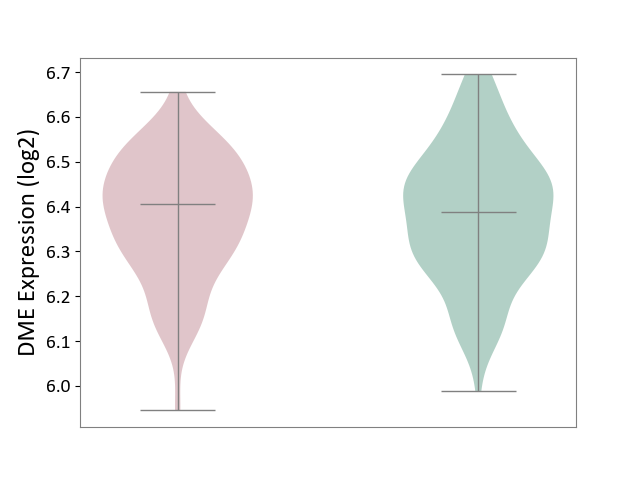
| The Studied Tissue | Entorhinal cortex | ||||
| The Specified Disease | Alzheimer's disease [ICD-11:8A20] | ||||
| The Expression Level of Disease Section Compare with the Healthy Individual Tissue | p-value: 7.36E-01; Fold-change: 1.62E-02; Z-score: 1.08E-01 | ||||
|
DME expression in the diseased tissue of patients
DME expression in the normal tissue of healthy individuals
|
|||||
| Violin Diagram of DME Disease-specific Protein Abundances |
|
Click to View the Clearer Original Diagram | |||
| ICD-11: 8A2Y | Neurocognitive impairment | Click to Show/Hide | |||
| The Studied Tissue | White matter tissue | ||||
| The Specified Disease | HIV-associated neurocognitive impairment [ICD-11:8A2Y-8A2Z] | ||||
| The Expression Level of Disease Section Compare with the Healthy Individual Tissue | p-value: 1.83E-02; Fold-change: -8.34E-02; Z-score: -4.89E-01 | ||||
|
DME expression in the diseased tissue of patients
DME expression in the normal tissue of healthy individuals
|
|||||
| Violin Diagram of DME Disease-specific Protein Abundances |
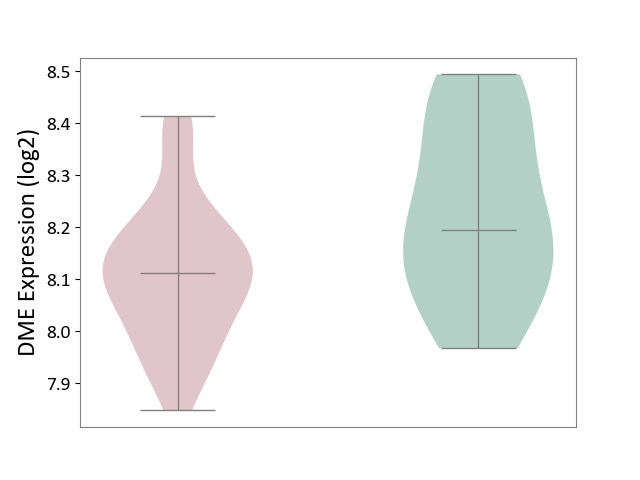
|
Click to View the Clearer Original Diagram | |||
| ICD-11: 8A40 | Multiple sclerosis | Click to Show/Hide | |||
| The Studied Tissue | Plasmacytoid dendritic cells | ||||
| The Specified Disease | Multiple sclerosis [ICD-11:8A40] | ||||
| The Expression Level of Disease Section Compare with the Healthy Individual Tissue | p-value: 9.96E-01; Fold-change: -7.53E-02; Z-score: -5.68E-01 | ||||
|
DME expression in the diseased tissue of patients
DME expression in the normal tissue of healthy individuals
|
|||||
| Violin Diagram of DME Disease-specific Protein Abundances |
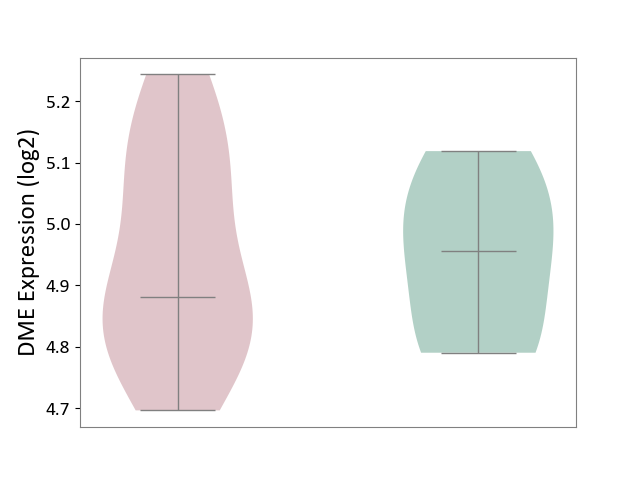
|
Click to View the Clearer Original Diagram | |||
| The Studied Tissue | Spinal cord | ||||
| The Specified Disease | Multiple sclerosis [ICD-11:8A40] | ||||
| The Expression Level of Disease Section Compare with the Adjacent Tissue | p-value: 5.35E-02; Fold-change: -1.45E-01; Z-score: -7.56E-01 | ||||
|
DME expression in the diseased tissue of patients
DME expression in the normal tissue adjacent to the diseased tissue of patients
|
|||||
| Violin Diagram of DME Disease-specific Protein Abundances |
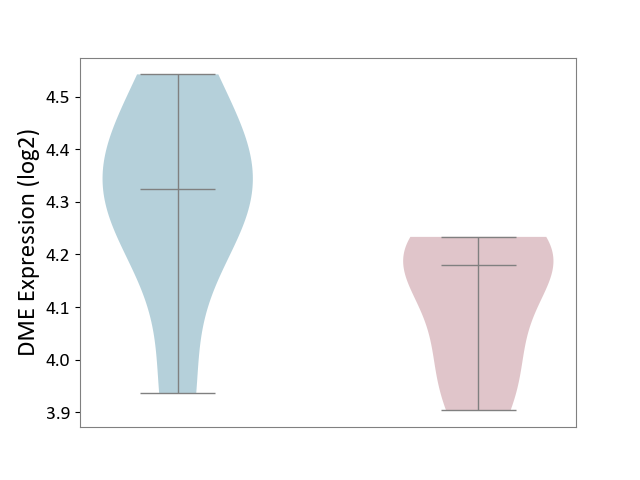
|
Click to View the Clearer Original Diagram | |||
| ICD-11: 8A60 | Epilepsy | Click to Show/Hide | |||
| The Studied Tissue | Peritumoral cortex tissue | ||||
| The Specified Disease | Epilepsy [ICD-11:8A60-8A6Z] | ||||
| The Expression Level of Disease Section Compare with the Other Disease Section | p-value: 4.13E-01; Fold-change: 3.57E-02; Z-score: 2.91E-01 | ||||
|
DME expression in the diseased tissue of patients
DME expression in tissue other than the diseased tissue of patients
|
|||||
| Violin Diagram of DME Disease-specific Protein Abundances |
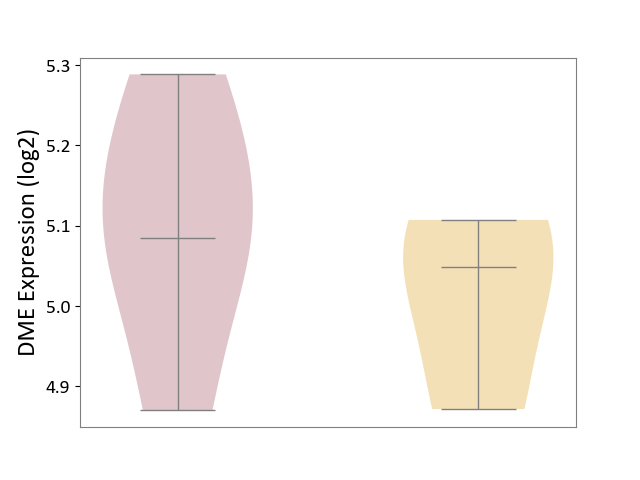
|
Click to View the Clearer Original Diagram | |||
| The Studied Tissue | Whole blood | ||||
| The Specified Disease | Seizure [ICD-11:8A60-8A6Z] | ||||
| The Expression Level of Disease Section Compare with the Healthy Individual Tissue | p-value: 9.71E-01; Fold-change: 2.51E-02; Z-score: 1.55E-01 | ||||
|
DME expression in the diseased tissue of patients
DME expression in the normal tissue of healthy individuals
|
|||||
| Violin Diagram of DME Disease-specific Protein Abundances |
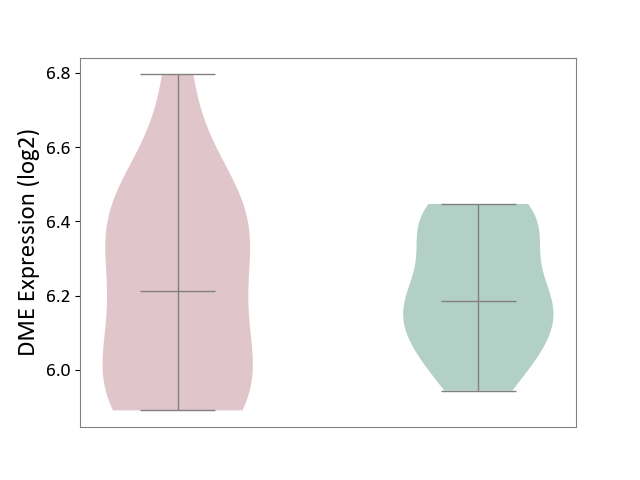
|
Click to View the Clearer Original Diagram | |||
| ICD-11: 8B01 | Subarachnoid haemorrhage | Click to Show/Hide | |||
| The Studied Tissue | Intracranial artery | ||||
| The Specified Disease | Intracranial aneurysm [ICD-11:8B01.0] | ||||
| The Expression Level of Disease Section Compare with the Healthy Individual Tissue | p-value: 1.95E-01; Fold-change: 6.90E-02; Z-score: 3.70E-01 | ||||
|
DME expression in the diseased tissue of patients
DME expression in the normal tissue of healthy individuals
|
|||||
| Violin Diagram of DME Disease-specific Protein Abundances |
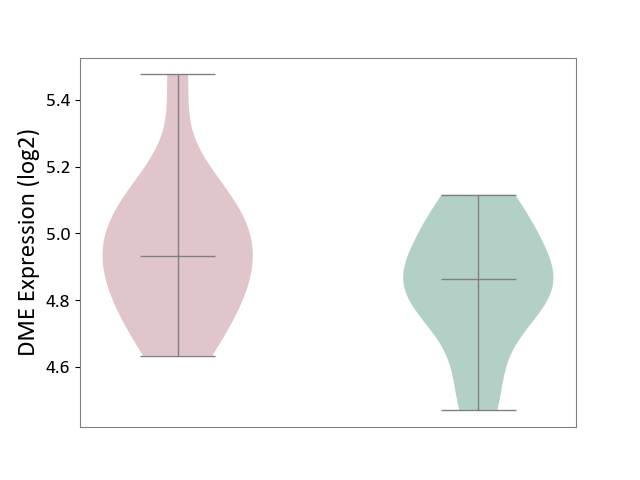
|
Click to View the Clearer Original Diagram | |||
| ICD-11: 8B11 | Cerebral ischaemic stroke | Click to Show/Hide | |||
| The Studied Tissue | Whole blood | ||||
| The Specified Disease | Cardioembolic stroke [ICD-11:8B11.20] | ||||
| The Expression Level of Disease Section Compare with the Healthy Individual Tissue | p-value: 7.40E-01; Fold-change: -5.05E-02; Z-score: -3.04E-01 | ||||
|
DME expression in the diseased tissue of patients
DME expression in the normal tissue of healthy individuals
|
|||||
| Violin Diagram of DME Disease-specific Protein Abundances |
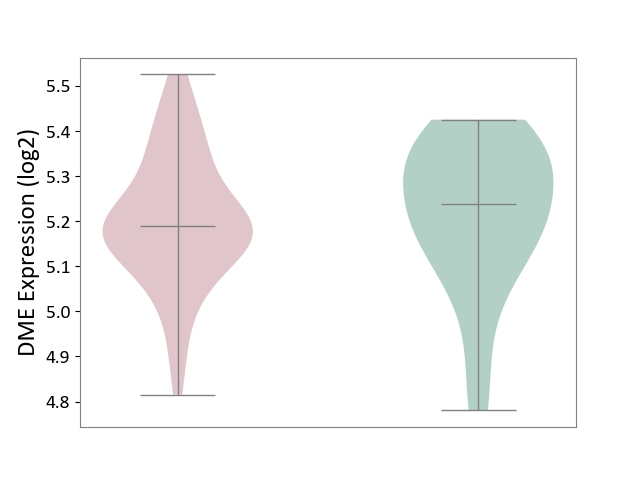
|
Click to View the Clearer Original Diagram | |||
| The Studied Tissue | Peripheral blood | ||||
| The Specified Disease | Ischemic stroke [ICD-11:8B11] | ||||
| The Expression Level of Disease Section Compare with the Healthy Individual Tissue | p-value: 9.40E-02; Fold-change: 1.42E-01; Z-score: 6.39E-01 | ||||
|
DME expression in the diseased tissue of patients
DME expression in the normal tissue of healthy individuals
|
|||||
| Violin Diagram of DME Disease-specific Protein Abundances |
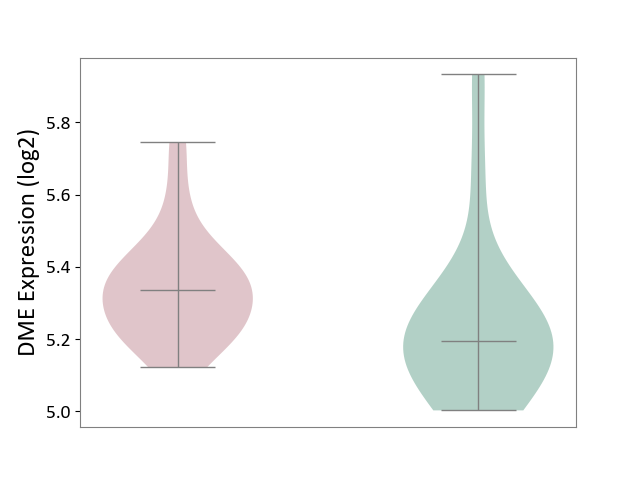
|
Click to View the Clearer Original Diagram | |||
| ICD-11: 8B60 | Motor neuron disease | Click to Show/Hide | |||
| The Studied Tissue | Skin | ||||
| The Specified Disease | Lateral sclerosis [ICD-11:8B60.4] | ||||
| The Expression Level of Disease Section Compare with the Healthy Individual Tissue | p-value: 1.78E-01; Fold-change: -1.19E-01; Z-score: -1.50E+00 | ||||
|
DME expression in the diseased tissue of patients
DME expression in the normal tissue of healthy individuals
|
|||||
| Violin Diagram of DME Disease-specific Protein Abundances |
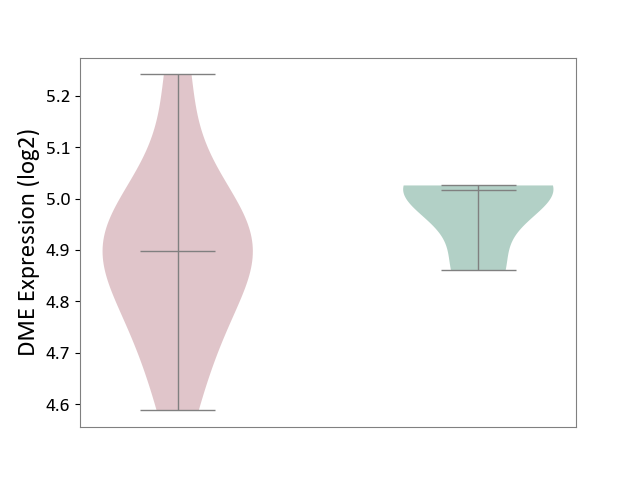
|
Click to View the Clearer Original Diagram | |||
| The Studied Tissue | Cervical spinal cord | ||||
| The Specified Disease | Lateral sclerosis [ICD-11:8B60.4] | ||||
| The Expression Level of Disease Section Compare with the Healthy Individual Tissue | p-value: 4.96E-02; Fold-change: 5.36E-01; Z-score: 1.70E+00 | ||||
|
DME expression in the diseased tissue of patients
DME expression in the normal tissue of healthy individuals
|
|||||
| Violin Diagram of DME Disease-specific Protein Abundances |
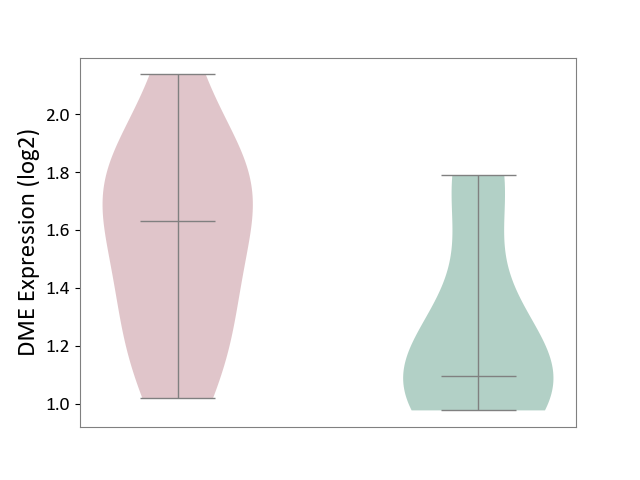
|
Click to View the Clearer Original Diagram | |||
| ICD-11: 8C70 | Muscular dystrophy | Click to Show/Hide | |||
| The Studied Tissue | Muscle tissue | ||||
| The Specified Disease | Myopathy [ICD-11:8C70.6] | ||||
| The Expression Level of Disease Section Compare with the Healthy Individual Tissue | p-value: 2.66E-01; Fold-change: -1.64E-01; Z-score: -9.58E-01 | ||||
|
DME expression in the diseased tissue of patients
DME expression in the normal tissue of healthy individuals
|
|||||
| Violin Diagram of DME Disease-specific Protein Abundances |
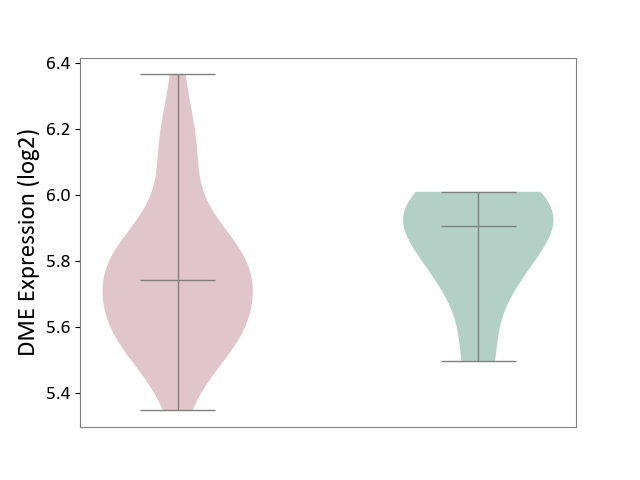
|
Click to View the Clearer Original Diagram | |||
| ICD-11: 8C75 | Distal myopathy | Click to Show/Hide | |||
| The Studied Tissue | Muscle tissue | ||||
| The Specified Disease | Tibial muscular dystrophy [ICD-11:8C75] | ||||
| The Expression Level of Disease Section Compare with the Healthy Individual Tissue | p-value: 4.39E-01; Fold-change: -4.78E-02; Z-score: -2.19E-01 | ||||
|
DME expression in the diseased tissue of patients
DME expression in the normal tissue of healthy individuals
|
|||||
| Violin Diagram of DME Disease-specific Protein Abundances |
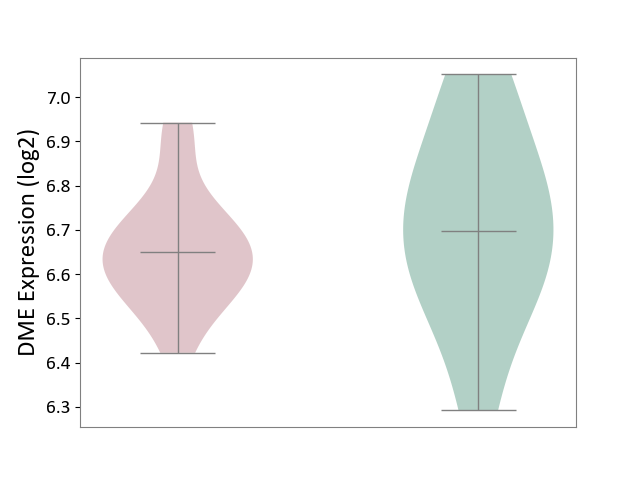
|
Click to View the Clearer Original Diagram | |||
| ICD Disease Classification 09 | Visual system disease | Click to Show/Hide | |||
| ICD-11: 9A96 | Anterior uveitis | Click to Show/Hide | |||
| The Studied Tissue | Peripheral monocyte | ||||
| The Specified Disease | Autoimmune uveitis [ICD-11:9A96] | ||||
| The Expression Level of Disease Section Compare with the Healthy Individual Tissue | p-value: 4.41E-01; Fold-change: -5.06E-02; Z-score: -3.68E-01 | ||||
|
DME expression in the diseased tissue of patients
DME expression in the normal tissue of healthy individuals
|
|||||
| Violin Diagram of DME Disease-specific Protein Abundances |
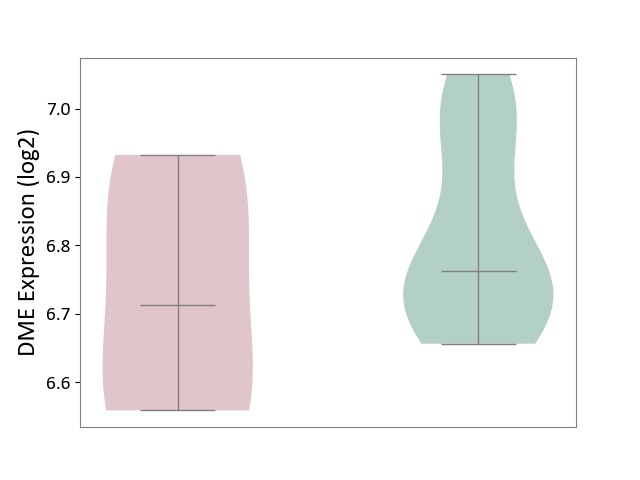
|
Click to View the Clearer Original Diagram | |||
| ICD Disease Classification 11 | Circulatory system disease | Click to Show/Hide | |||
| ICD-11: BA41 | Myocardial infarction | Click to Show/Hide | |||
| The Studied Tissue | Peripheral blood | ||||
| The Specified Disease | Myocardial infarction [ICD-11:BA41-BA50] | ||||
| The Expression Level of Disease Section Compare with the Healthy Individual Tissue | p-value: 1.89E-01; Fold-change: 1.87E-01; Z-score: 3.46E-01 | ||||
|
DME expression in the diseased tissue of patients
DME expression in the normal tissue of healthy individuals
|
|||||
| Violin Diagram of DME Disease-specific Protein Abundances |
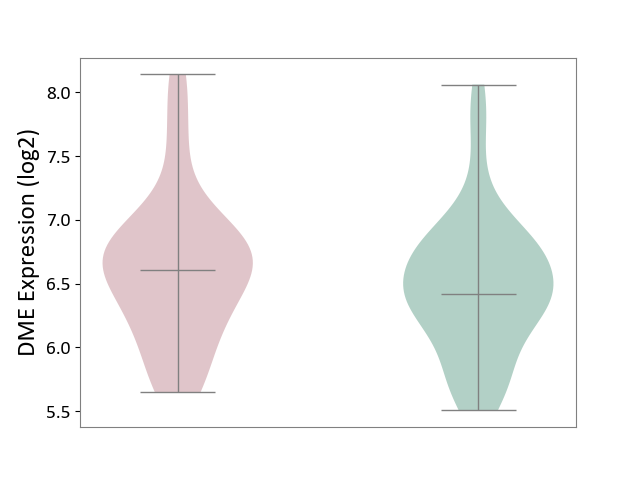
|
Click to View the Clearer Original Diagram | |||
| ICD-11: BA80 | Coronary artery disease | Click to Show/Hide | |||
| The Studied Tissue | Peripheral blood | ||||
| The Specified Disease | Coronary artery disease [ICD-11:BA80-BA8Z] | ||||
| The Expression Level of Disease Section Compare with the Healthy Individual Tissue | p-value: 4.37E-01; Fold-change: -1.71E-01; Z-score: -1.07E+00 | ||||
|
DME expression in the diseased tissue of patients
DME expression in the normal tissue of healthy individuals
|
|||||
| Violin Diagram of DME Disease-specific Protein Abundances |
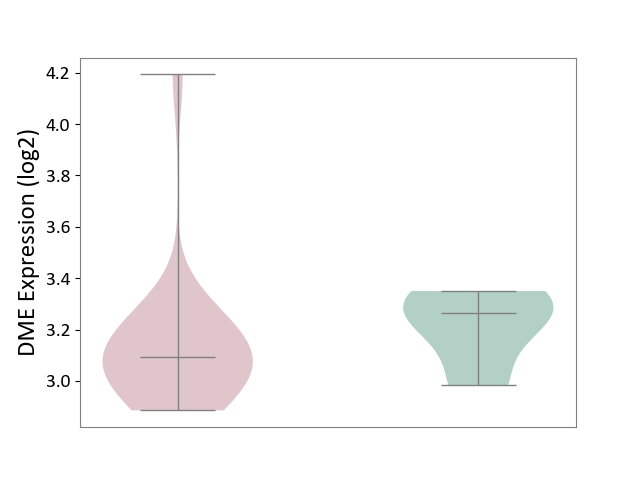
|
Click to View the Clearer Original Diagram | |||
| ICD-11: BB70 | Aortic valve stenosis | Click to Show/Hide | |||
| The Studied Tissue | Calcified aortic valve | ||||
| The Specified Disease | Aortic stenosis [ICD-11:BB70] | ||||
| The Expression Level of Disease Section Compare with the Healthy Individual Tissue | p-value: 8.87E-01; Fold-change: 2.16E-02; Z-score: 3.19E-02 | ||||
|
DME expression in the diseased tissue of patients
DME expression in the normal tissue of healthy individuals
|
|||||
| Violin Diagram of DME Disease-specific Protein Abundances |
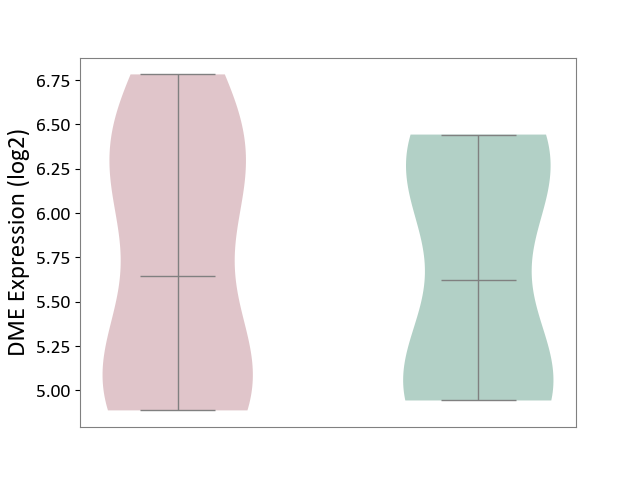
|
Click to View the Clearer Original Diagram | |||
| ICD Disease Classification 12 | Respiratory system disease | Click to Show/Hide | |||
| ICD-11: 7A40 | Central sleep apnoea | Click to Show/Hide | |||
| The Studied Tissue | Hyperplastic tonsil | ||||
| The Specified Disease | Apnea [ICD-11:7A40] | ||||
| The Expression Level of Disease Section Compare with the Healthy Individual Tissue | p-value: 4.45E-01; Fold-change: -2.01E-01; Z-score: -9.71E-01 | ||||
|
DME expression in the diseased tissue of patients
DME expression in the normal tissue of healthy individuals
|
|||||
| Violin Diagram of DME Disease-specific Protein Abundances |
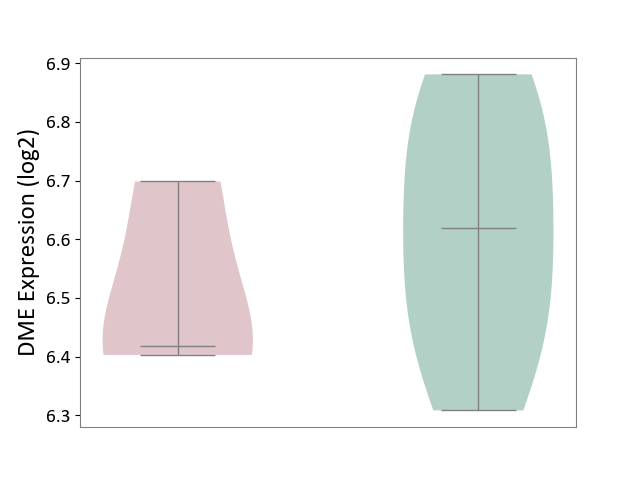
|
Click to View the Clearer Original Diagram | |||
| ICD-11: CA08 | Vasomotor or allergic rhinitis | Click to Show/Hide | |||
| The Studied Tissue | Peripheral blood | ||||
| The Specified Disease | Olive pollen allergy [ICD-11:CA08.00] | ||||
| The Expression Level of Disease Section Compare with the Healthy Individual Tissue | p-value: 1.55E-02; Fold-change: 3.24E-01; Z-score: 3.18E+00 | ||||
|
DME expression in the diseased tissue of patients
DME expression in the normal tissue of healthy individuals
|
|||||
| Violin Diagram of DME Disease-specific Protein Abundances |
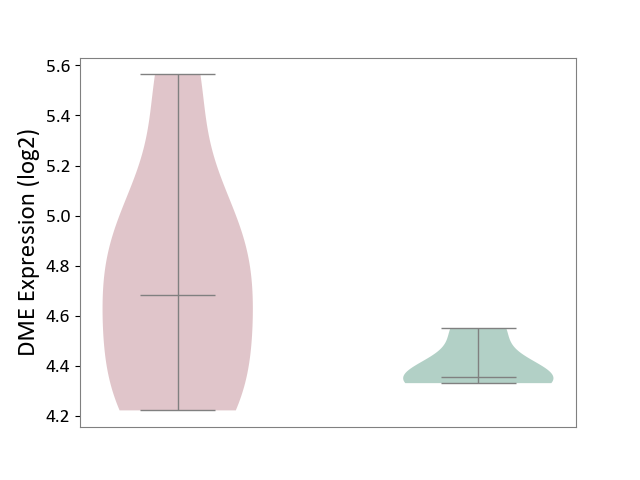
|
Click to View the Clearer Original Diagram | |||
| ICD-11: CA0A | Chronic rhinosinusitis | Click to Show/Hide | |||
| The Studied Tissue | Sinus mucosa tissue | ||||
| The Specified Disease | Chronic rhinosinusitis [ICD-11:CA0A] | ||||
| The Expression Level of Disease Section Compare with the Healthy Individual Tissue | p-value: 1.58E-01; Fold-change: 8.92E-02; Z-score: 6.05E-01 | ||||
|
DME expression in the diseased tissue of patients
DME expression in the normal tissue of healthy individuals
|
|||||
| Violin Diagram of DME Disease-specific Protein Abundances |
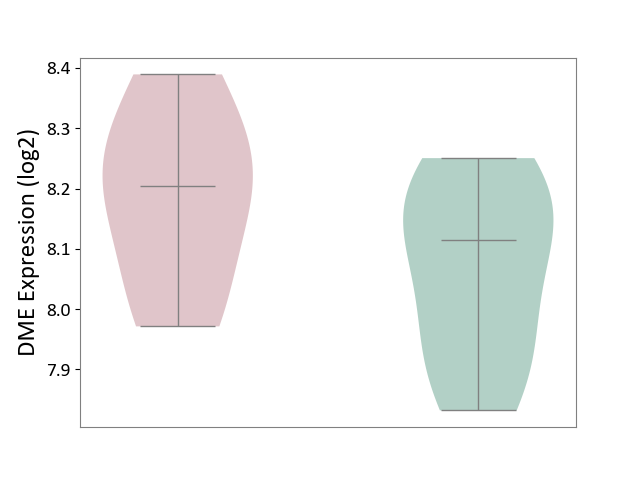
|
Click to View the Clearer Original Diagram | |||
| ICD-11: CA22 | Chronic obstructive pulmonary disease | Click to Show/Hide | |||
| The Studied Tissue | Lung tissue | ||||
| The Specified Disease | Chronic obstructive pulmonary disease [ICD-11:CA22] | ||||
| The Expression Level of Disease Section Compare with the Healthy Individual Tissue | p-value: 1.10E-01; Fold-change: 1.11E-01; Z-score: 3.52E-01 | ||||
|
DME expression in the diseased tissue of patients
DME expression in the normal tissue of healthy individuals
|
|||||
| Violin Diagram of DME Disease-specific Protein Abundances |
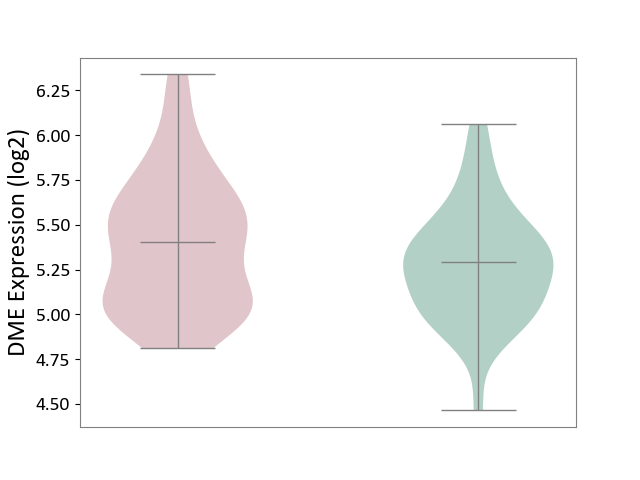
|
Click to View the Clearer Original Diagram | |||
| The Studied Tissue | Small airway epithelium | ||||
| The Specified Disease | Chronic obstructive pulmonary disease [ICD-11:CA22] | ||||
| The Expression Level of Disease Section Compare with the Healthy Individual Tissue | p-value: 9.15E-01; Fold-change: -4.48E-02; Z-score: -1.91E-01 | ||||
|
DME expression in the diseased tissue of patients
DME expression in the normal tissue of healthy individuals
|
|||||
| Violin Diagram of DME Disease-specific Protein Abundances |
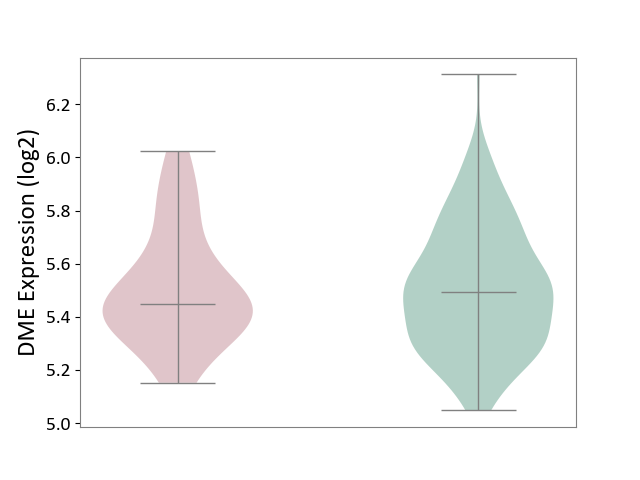
|
Click to View the Clearer Original Diagram | |||
| ICD-11: CA23 | Asthma | Click to Show/Hide | |||
| The Studied Tissue | Nasal and bronchial airway | ||||
| The Specified Disease | Asthma [ICD-11:CA23] | ||||
| The Expression Level of Disease Section Compare with the Healthy Individual Tissue | p-value: 7.57E-07; Fold-change: -1.95E-01; Z-score: -4.24E-01 | ||||
|
DME expression in the diseased tissue of patients
DME expression in the normal tissue of healthy individuals
|
|||||
| Violin Diagram of DME Disease-specific Protein Abundances |
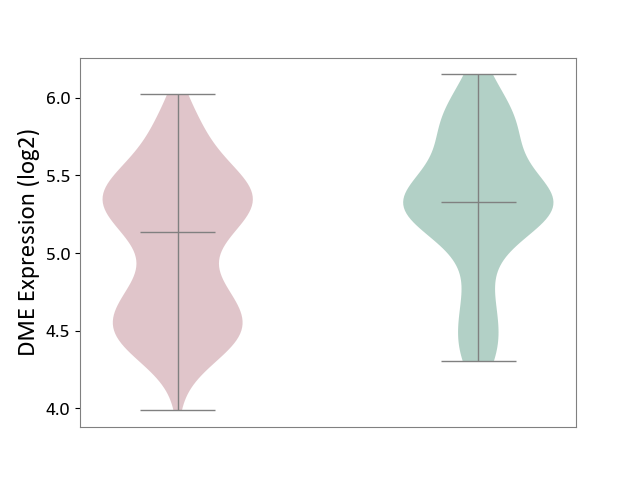
|
Click to View the Clearer Original Diagram | |||
| ICD-11: CB03 | Idiopathic interstitial pneumonitis | Click to Show/Hide | |||
| The Studied Tissue | Lung tissue | ||||
| The Specified Disease | Idiopathic pulmonary fibrosis [ICD-11:CB03.4] | ||||
| The Expression Level of Disease Section Compare with the Healthy Individual Tissue | p-value: 5.17E-01; Fold-change: -1.52E-01; Z-score: -5.12E-01 | ||||
|
DME expression in the diseased tissue of patients
DME expression in the normal tissue of healthy individuals
|
|||||
| Violin Diagram of DME Disease-specific Protein Abundances |
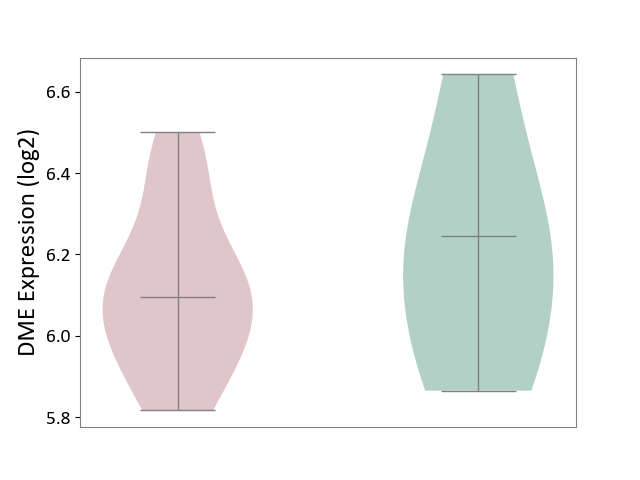
|
Click to View the Clearer Original Diagram | |||
| ICD Disease Classification 13 | Digestive system disease | Click to Show/Hide | |||
| ICD-11: DA0C | Periodontal disease | Click to Show/Hide | |||
| The Studied Tissue | Gingival tissue | ||||
| The Specified Disease | Periodontal disease [ICD-11:DA0C] | ||||
| The Expression Level of Disease Section Compare with the Adjacent Tissue | p-value: 3.39E-01; Fold-change: 3.28E-02; Z-score: 1.03E-01 | ||||
|
DME expression in the diseased tissue of patients
DME expression in the normal tissue adjacent to the diseased tissue of patients
|
|||||
| Violin Diagram of DME Disease-specific Protein Abundances |
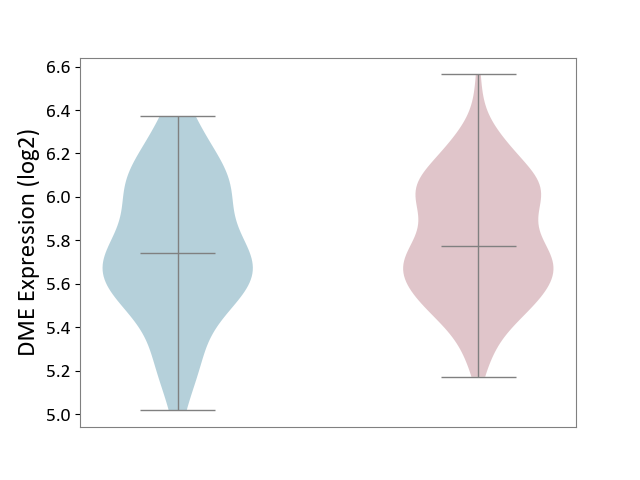
|
Click to View the Clearer Original Diagram | |||
| ICD-11: DA42 | Gastritis | Click to Show/Hide | |||
| The Studied Tissue | Gastric antrum tissue | ||||
| The Specified Disease | Eosinophilic gastritis [ICD-11:DA42.2] | ||||
| The Expression Level of Disease Section Compare with the Adjacent Tissue | p-value: 1.86E-01; Fold-change: -3.06E-01; Z-score: -2.02E+00 | ||||
|
DME expression in the diseased tissue of patients
DME expression in the normal tissue adjacent to the diseased tissue of patients
|
|||||
| Violin Diagram of DME Disease-specific Protein Abundances |
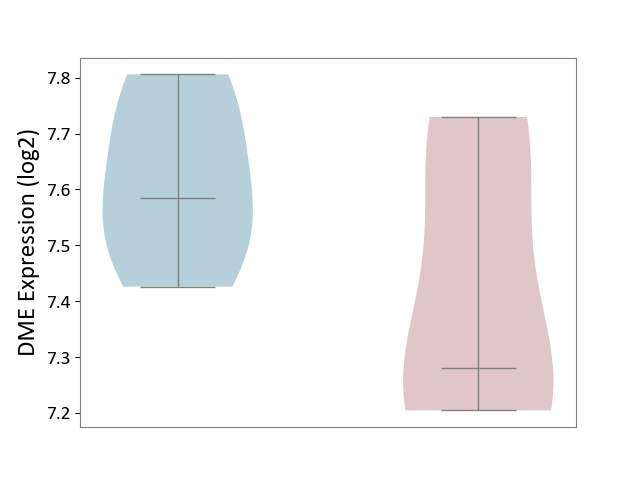
|
Click to View the Clearer Original Diagram | |||
| ICD-11: DB92 | Non-alcoholic fatty liver disease | Click to Show/Hide | |||
| The Studied Tissue | Liver tissue | ||||
| The Specified Disease | Non-alcoholic fatty liver disease [ICD-11:DB92] | ||||
| The Expression Level of Disease Section Compare with the Healthy Individual Tissue | p-value: 5.12E-01; Fold-change: -4.38E-02; Z-score: -3.17E-02 | ||||
|
DME expression in the diseased tissue of patients
DME expression in the normal tissue of healthy individuals
|
|||||
| Violin Diagram of DME Disease-specific Protein Abundances |
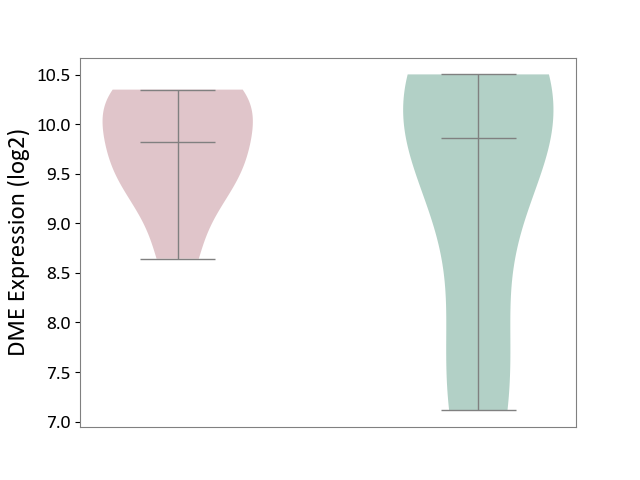
|
Click to View the Clearer Original Diagram | |||
| ICD-11: DB99 | Hepatic failure | Click to Show/Hide | |||
| The Studied Tissue | Liver tissue | ||||
| The Specified Disease | Liver failure [ICD-11:DB99.7-DB99.8] | ||||
| The Expression Level of Disease Section Compare with the Healthy Individual Tissue | p-value: 1.41E-08; Fold-change: -4.43E+00; Z-score: -5.74E+00 | ||||
|
DME expression in the diseased tissue of patients
DME expression in the normal tissue of healthy individuals
|
|||||
| Violin Diagram of DME Disease-specific Protein Abundances |
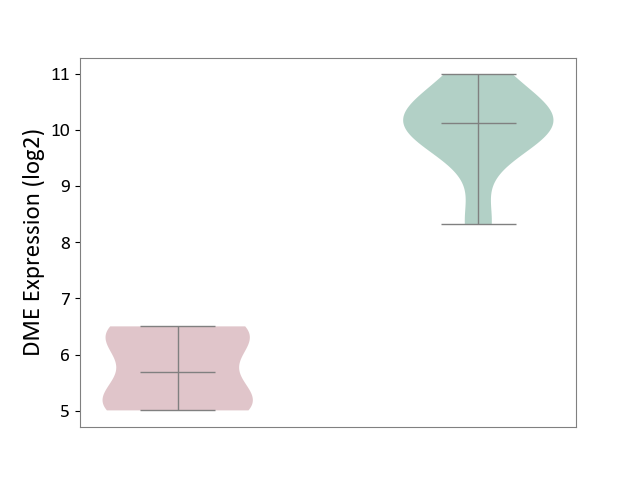
|
Click to View the Clearer Original Diagram | |||
| ICD-11: DD71 | Ulcerative colitis | Click to Show/Hide | |||
| The Studied Tissue | Colon mucosal tissue | ||||
| The Specified Disease | Ulcerative colitis [ICD-11:DD71] | ||||
| The Expression Level of Disease Section Compare with the Adjacent Tissue | p-value: 7.06E-01; Fold-change: 2.42E-02; Z-score: 9.02E-02 | ||||
|
DME expression in the diseased tissue of patients
DME expression in tissue other than the diseased tissue of patients
|
|||||
| Violin Diagram of DME Disease-specific Protein Abundances |
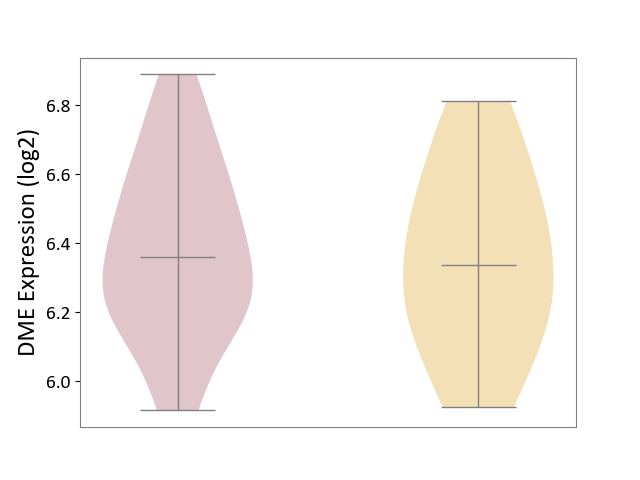
|
Click to View the Clearer Original Diagram | |||
| ICD-11: DD91 | Irritable bowel syndrome | Click to Show/Hide | |||
| The Studied Tissue | Rectal colon tissue | ||||
| The Specified Disease | Irritable bowel syndrome [ICD-11:DD91.0] | ||||
| The Expression Level of Disease Section Compare with the Healthy Individual Tissue | p-value: 7.61E-02; Fold-change: 4.91E-02; Z-score: 2.36E-01 | ||||
|
DME expression in the diseased tissue of patients
DME expression in the normal tissue of healthy individuals
|
|||||
| Violin Diagram of DME Disease-specific Protein Abundances |
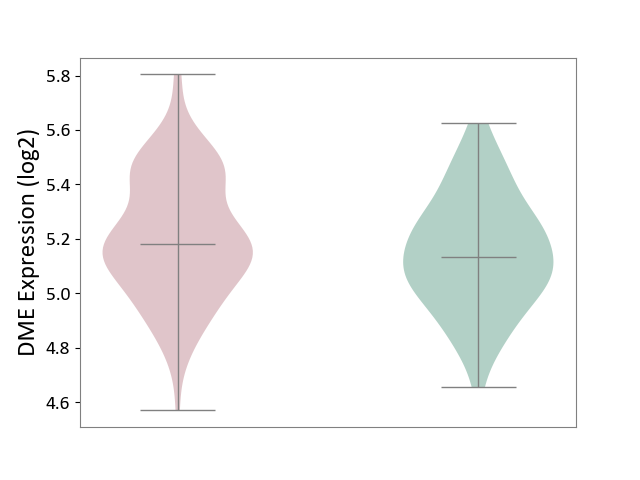
|
Click to View the Clearer Original Diagram | |||
| ICD Disease Classification 14 | Skin disease | Click to Show/Hide | |||
| ICD-11: EA80 | Atopic eczema | Click to Show/Hide | |||
| The Studied Tissue | Skin | ||||
| The Specified Disease | Atopic dermatitis [ICD-11:EA80] | ||||
| The Expression Level of Disease Section Compare with the Healthy Individual Tissue | p-value: 3.19E-04; Fold-change: 1.36E-01; Z-score: 1.10E+00 | ||||
|
DME expression in the diseased tissue of patients
DME expression in the normal tissue of healthy individuals
|
|||||
| Violin Diagram of DME Disease-specific Protein Abundances |
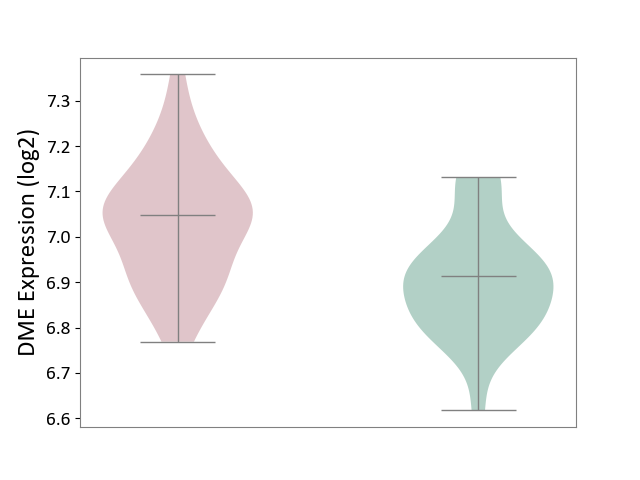
|
Click to View the Clearer Original Diagram | |||
| ICD-11: EA90 | Psoriasis | Click to Show/Hide | |||
| The Studied Tissue | Skin | ||||
| The Specified Disease | Psoriasis [ICD-11:EA90] | ||||
| The Expression Level of Disease Section Compare with the Healthy Individual Tissue | p-value: 4.87E-15; Fold-change: -3.01E-01; Z-score: -6.41E-01 | ||||
| The Expression Level of Disease Section Compare with the Adjacent Tissue | p-value: 2.42E-01; Fold-change: 3.12E-01; Z-score: 6.07E-01 | ||||
|
DME expression in the diseased tissue of patients
DME expression in the normal tissue adjacent to the diseased tissue of patients
DME expression in the normal tissue of healthy individuals
|
|||||
| Violin Diagram of DME Disease-specific Protein Abundances |
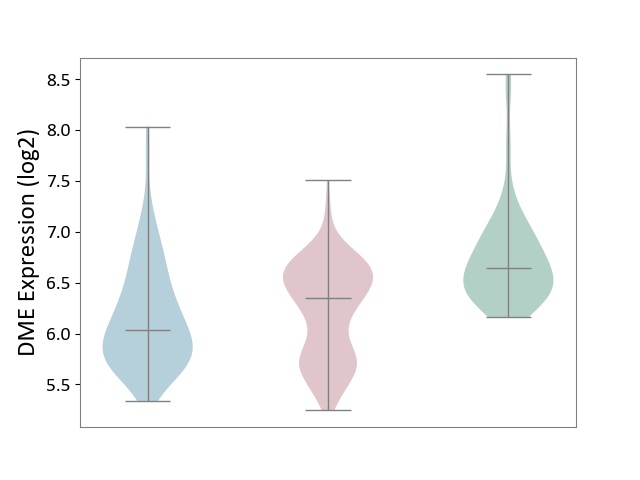
|
Click to View the Clearer Original Diagram | |||
| ICD-11: ED63 | Acquired hypomelanotic disorder | Click to Show/Hide | |||
| The Studied Tissue | Skin | ||||
| The Specified Disease | Vitiligo [ICD-11:ED63.0] | ||||
| The Expression Level of Disease Section Compare with the Healthy Individual Tissue | p-value: 4.27E-01; Fold-change: -1.60E-01; Z-score: -3.99E-01 | ||||
|
DME expression in the diseased tissue of patients
DME expression in the normal tissue of healthy individuals
|
|||||
| Violin Diagram of DME Disease-specific Protein Abundances |
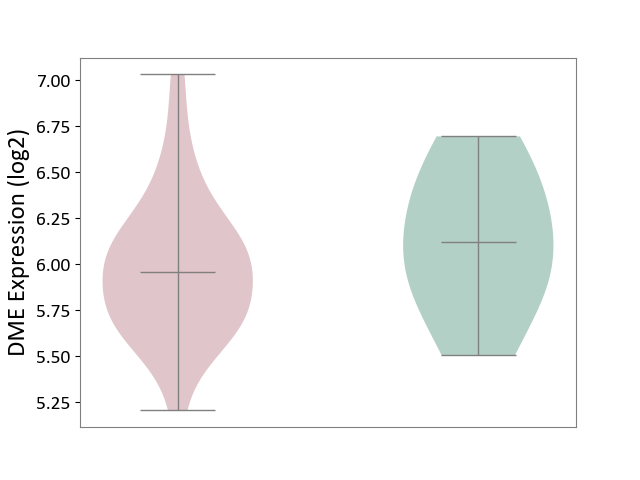
|
Click to View the Clearer Original Diagram | |||
| ICD-11: ED70 | Alopecia or hair loss | Click to Show/Hide | |||
| The Studied Tissue | Skin from scalp | ||||
| The Specified Disease | Alopecia [ICD-11:ED70] | ||||
| The Expression Level of Disease Section Compare with the Healthy Individual Tissue | p-value: 2.61E-01; Fold-change: 1.30E-02; Z-score: 4.47E-02 | ||||
|
DME expression in the diseased tissue of patients
DME expression in the normal tissue of healthy individuals
|
|||||
| Violin Diagram of DME Disease-specific Protein Abundances |
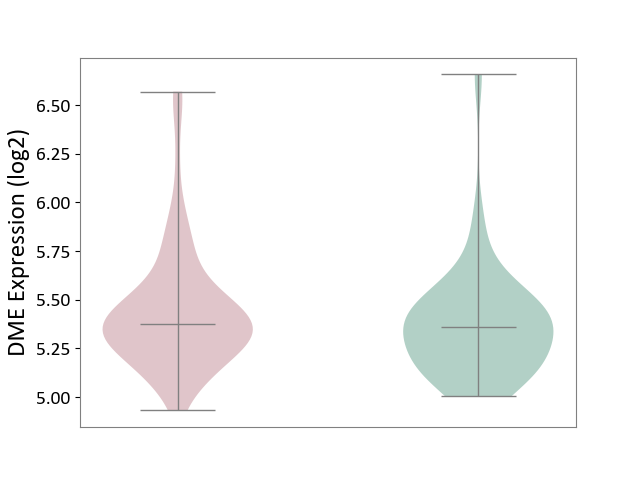
|
Click to View the Clearer Original Diagram | |||
| ICD-11: EK0Z | Contact dermatitis | Click to Show/Hide | |||
| The Studied Tissue | Skin | ||||
| The Specified Disease | Sensitive skin [ICD-11:EK0Z] | ||||
| The Expression Level of Disease Section Compare with the Healthy Individual Tissue | p-value: 3.39E-01; Fold-change: -5.00E-02; Z-score: -4.71E-01 | ||||
|
DME expression in the diseased tissue of patients
DME expression in the normal tissue of healthy individuals
|
|||||
| Violin Diagram of DME Disease-specific Protein Abundances |
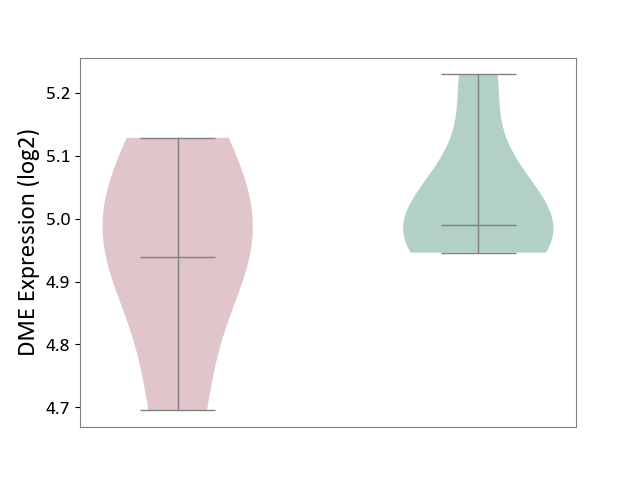
|
Click to View the Clearer Original Diagram | |||
| ICD Disease Classification 15 | Musculoskeletal system/connective tissue disease | Click to Show/Hide | |||
| ICD-11: FA00 | Osteoarthritis | Click to Show/Hide | |||
| The Studied Tissue | Peripheral blood | ||||
| The Specified Disease | Arthropathy [ICD-11:FA00-FA5Z] | ||||
| The Expression Level of Disease Section Compare with the Healthy Individual Tissue | p-value: 1.58E-01; Fold-change: 5.31E-02; Z-score: 3.04E-01 | ||||
|
DME expression in the diseased tissue of patients
DME expression in the normal tissue of healthy individuals
|
|||||
| Violin Diagram of DME Disease-specific Protein Abundances |
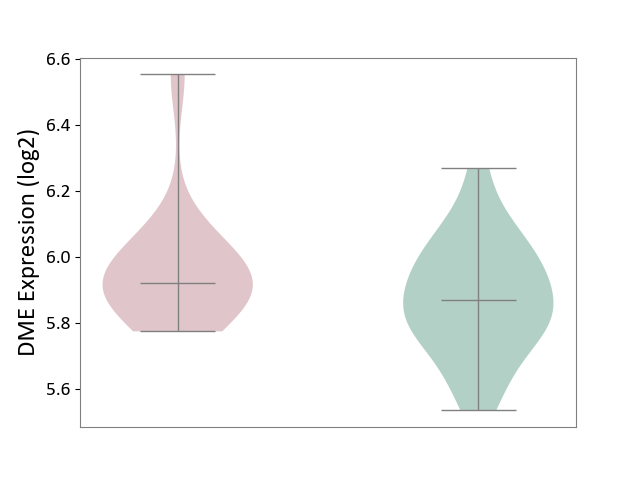
|
Click to View the Clearer Original Diagram | |||
| The Studied Tissue | Synovial tissue | ||||
| The Specified Disease | Osteoarthritis [ICD-11:FA00-FA0Z] | ||||
| The Expression Level of Disease Section Compare with the Healthy Individual Tissue | p-value: 6.49E-01; Fold-change: -7.95E-02; Z-score: -4.15E-01 | ||||
|
DME expression in the diseased tissue of patients
DME expression in the normal tissue of healthy individuals
|
|||||
| Violin Diagram of DME Disease-specific Protein Abundances |
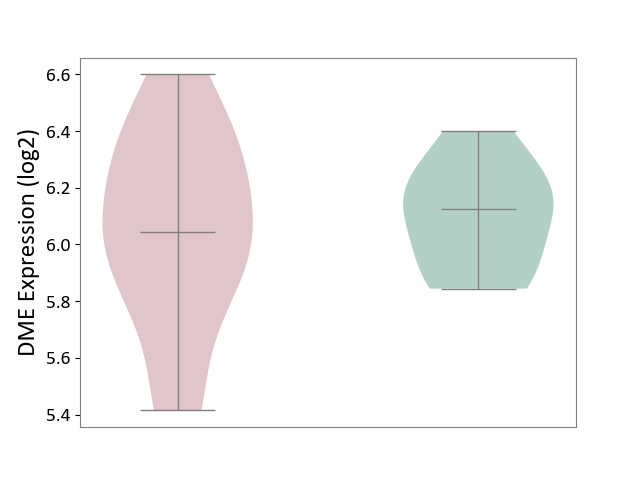
|
Click to View the Clearer Original Diagram | |||
| ICD-11: FA20 | Rheumatoid arthritis | Click to Show/Hide | |||
| The Studied Tissue | Peripheral blood | ||||
| The Specified Disease | Childhood onset rheumatic disease [ICD-11:FA20.Z] | ||||
| The Expression Level of Disease Section Compare with the Healthy Individual Tissue | p-value: 2.84E-01; Fold-change: 8.25E-02; Z-score: 5.13E-01 | ||||
|
DME expression in the diseased tissue of patients
DME expression in the normal tissue of healthy individuals
|
|||||
| Violin Diagram of DME Disease-specific Protein Abundances |
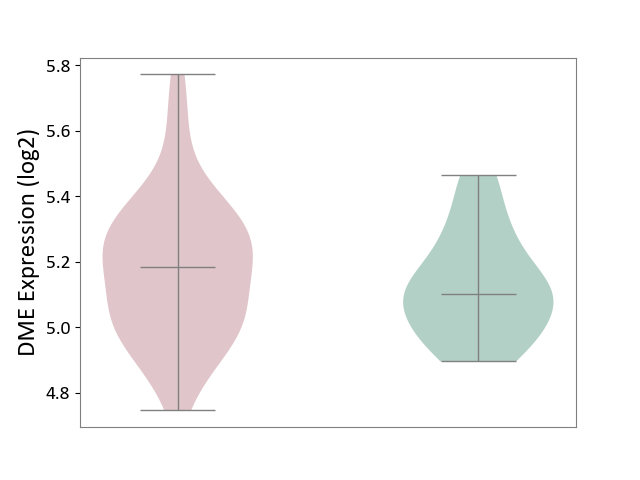
|
Click to View the Clearer Original Diagram | |||
| The Studied Tissue | Synovial tissue | ||||
| The Specified Disease | Rheumatoid arthritis [ICD-11:FA20] | ||||
| The Expression Level of Disease Section Compare with the Healthy Individual Tissue | p-value: 7.68E-02; Fold-change: -2.10E-01; Z-score: -6.42E-01 | ||||
|
DME expression in the diseased tissue of patients
DME expression in the normal tissue of healthy individuals
|
|||||
| Violin Diagram of DME Disease-specific Protein Abundances |
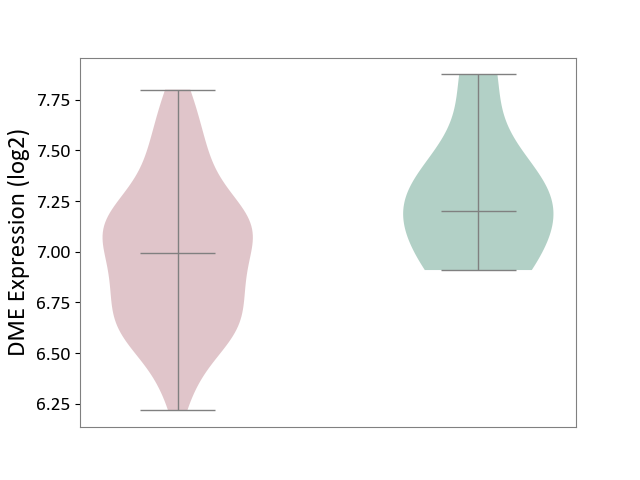
|
Click to View the Clearer Original Diagram | |||
| ICD-11: FA24 | Juvenile idiopathic arthritis | Click to Show/Hide | |||
| The Studied Tissue | Peripheral blood | ||||
| The Specified Disease | Juvenile idiopathic arthritis [ICD-11:FA24] | ||||
| The Expression Level of Disease Section Compare with the Healthy Individual Tissue | p-value: 1.08E-03; Fold-change: 8.52E-02; Z-score: 4.34E-01 | ||||
|
DME expression in the diseased tissue of patients
DME expression in the normal tissue of healthy individuals
|
|||||
| Violin Diagram of DME Disease-specific Protein Abundances |
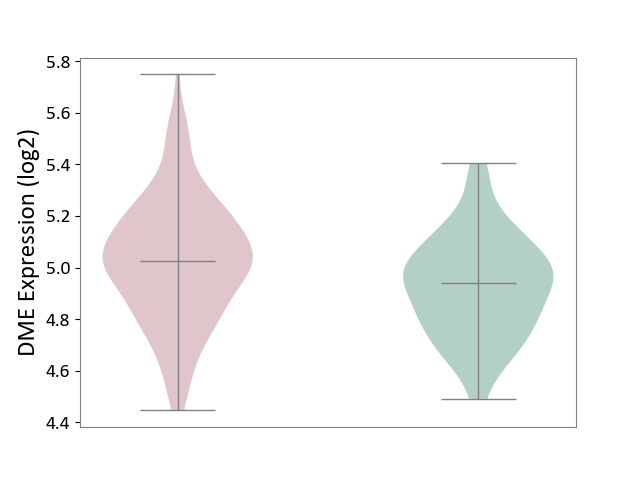
|
Click to View the Clearer Original Diagram | |||
| ICD-11: FA92 | Inflammatory spondyloarthritis | Click to Show/Hide | |||
| The Studied Tissue | Pheripheral blood | ||||
| The Specified Disease | Ankylosing spondylitis [ICD-11:FA92.0Z] | ||||
| The Expression Level of Disease Section Compare with the Healthy Individual Tissue | p-value: 9.79E-01; Fold-change: -4.52E-03; Z-score: -4.20E-02 | ||||
|
DME expression in the diseased tissue of patients
DME expression in the normal tissue of healthy individuals
|
|||||
| Violin Diagram of DME Disease-specific Protein Abundances |
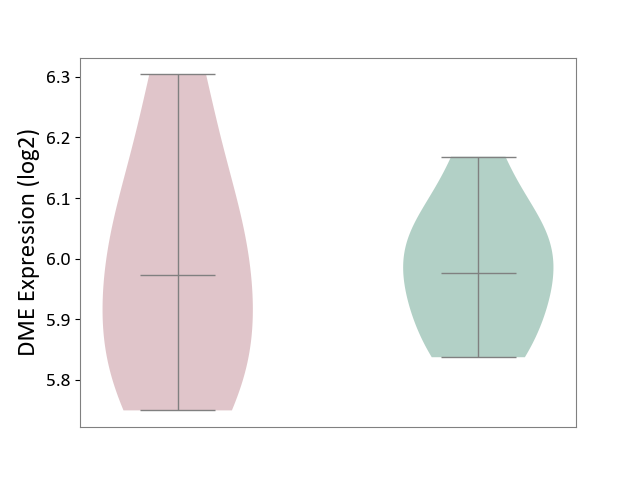
|
Click to View the Clearer Original Diagram | |||
| ICD-11: FB83 | Low bone mass disorder | Click to Show/Hide | |||
| The Studied Tissue | Bone marrow | ||||
| The Specified Disease | Osteoporosis [ICD-11:FB83.1] | ||||
| The Expression Level of Disease Section Compare with the Healthy Individual Tissue | p-value: 1.54E-02; Fold-change: 2.08E-01; Z-score: 1.34E+00 | ||||
|
DME expression in the diseased tissue of patients
DME expression in the normal tissue of healthy individuals
|
|||||
| Violin Diagram of DME Disease-specific Protein Abundances |
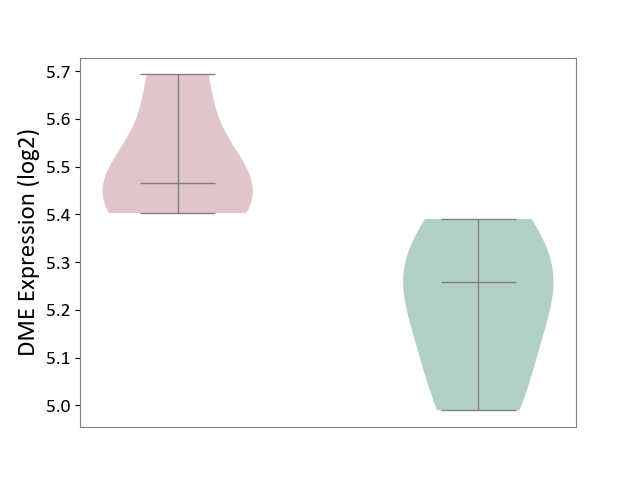
|
Click to View the Clearer Original Diagram | |||
| ICD Disease Classification 16 | Genitourinary system disease | Click to Show/Hide | |||
| ICD-11: GA10 | Endometriosis | Click to Show/Hide | |||
| The Studied Tissue | Endometrium tissue | ||||
| The Specified Disease | Endometriosis [ICD-11:GA10] | ||||
| The Expression Level of Disease Section Compare with the Healthy Individual Tissue | p-value: 8.54E-01; Fold-change: -5.96E-03; Z-score: -1.84E-02 | ||||
|
DME expression in the diseased tissue of patients
DME expression in the normal tissue of healthy individuals
|
|||||
| Violin Diagram of DME Disease-specific Protein Abundances |
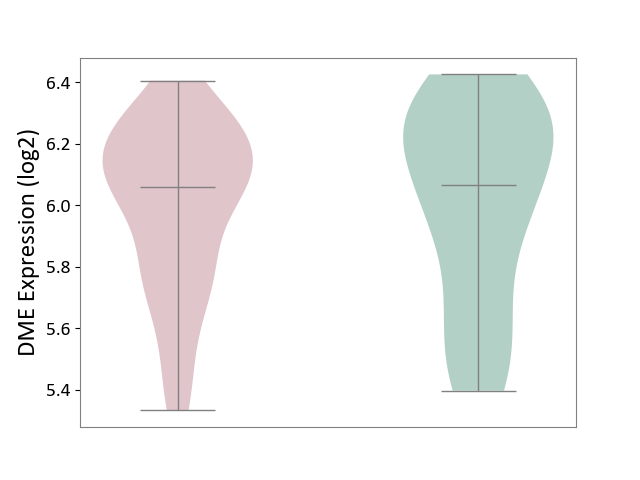
|
Click to View the Clearer Original Diagram | |||
| ICD-11: GC00 | Cystitis | Click to Show/Hide | |||
| The Studied Tissue | Bladder tissue | ||||
| The Specified Disease | Interstitial cystitis [ICD-11:GC00.3] | ||||
| The Expression Level of Disease Section Compare with the Healthy Individual Tissue | p-value: 2.89E-01; Fold-change: -1.42E-01; Z-score: -6.04E-01 | ||||
|
DME expression in the diseased tissue of patients
DME expression in the normal tissue of healthy individuals
|
|||||
| Violin Diagram of DME Disease-specific Protein Abundances |
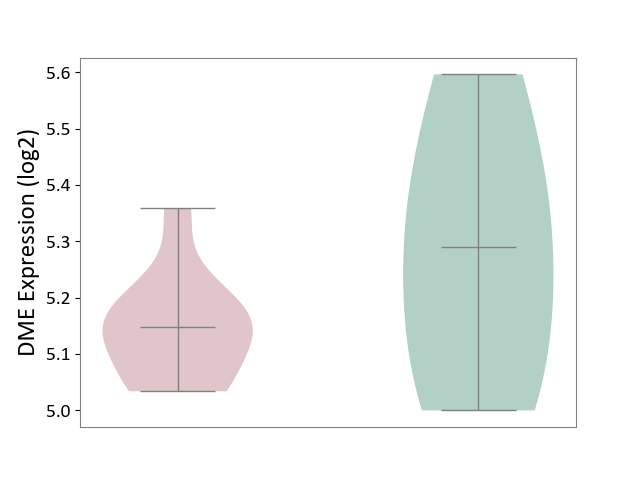
|
Click to View the Clearer Original Diagram | |||
| ICD Disease Classification 19 | Condition originating in perinatal period | Click to Show/Hide | |||
| ICD-11: KA21 | Short gestation disorder | Click to Show/Hide | |||
| The Studied Tissue | Myometrium | ||||
| The Specified Disease | Preterm birth [ICD-11:KA21.4Z] | ||||
| The Expression Level of Disease Section Compare with the Healthy Individual Tissue | p-value: 1.65E-01; Fold-change: -5.01E-02; Z-score: -9.53E-01 | ||||
|
DME expression in the diseased tissue of patients
DME expression in the normal tissue of healthy individuals
|
|||||
| Violin Diagram of DME Disease-specific Protein Abundances |
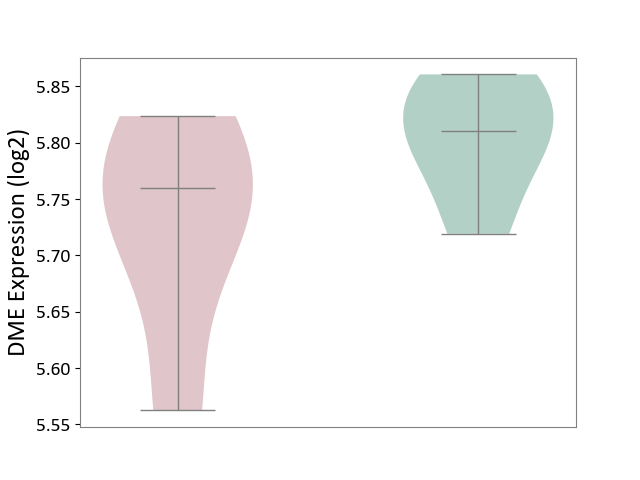
|
Click to View the Clearer Original Diagram | |||
| ICD Disease Classification 20 | Developmental anomaly | Click to Show/Hide | |||
| ICD-11: LD2C | Overgrowth syndrome | Click to Show/Hide | |||
| The Studied Tissue | Adipose tissue | ||||
| The Specified Disease | Simpson golabi behmel syndrome [ICD-11:LD2C] | ||||
| The Expression Level of Disease Section Compare with the Healthy Individual Tissue | p-value: 4.54E-01; Fold-change: 3.27E-02; Z-score: 5.50E-01 | ||||
|
DME expression in the diseased tissue of patients
DME expression in the normal tissue of healthy individuals
|
|||||
| Violin Diagram of DME Disease-specific Protein Abundances |
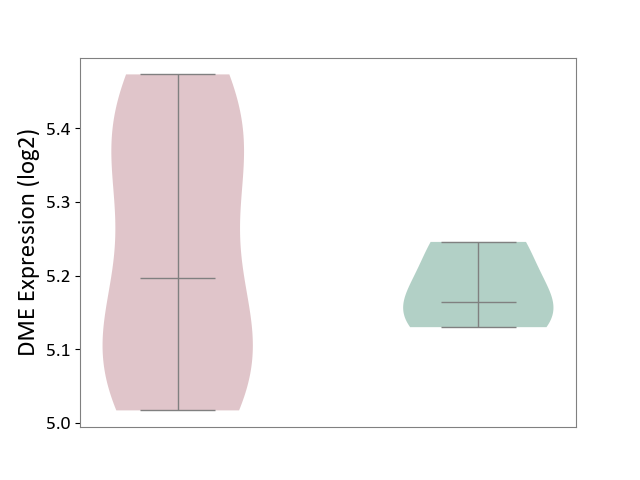
|
Click to View the Clearer Original Diagram | |||
| ICD-11: LD2D | Phakomatoses/hamartoneoplastic syndrome | Click to Show/Hide | |||
| The Studied Tissue | Perituberal tissue | ||||
| The Specified Disease | Tuberous sclerosis complex [ICD-11:LD2D.2] | ||||
| The Expression Level of Disease Section Compare with the Healthy Individual Tissue | p-value: 3.06E-01; Fold-change: 1.61E-01; Z-score: 1.16E+00 | ||||
|
DME expression in the diseased tissue of patients
DME expression in the normal tissue of healthy individuals
|
|||||
| Violin Diagram of DME Disease-specific Protein Abundances |
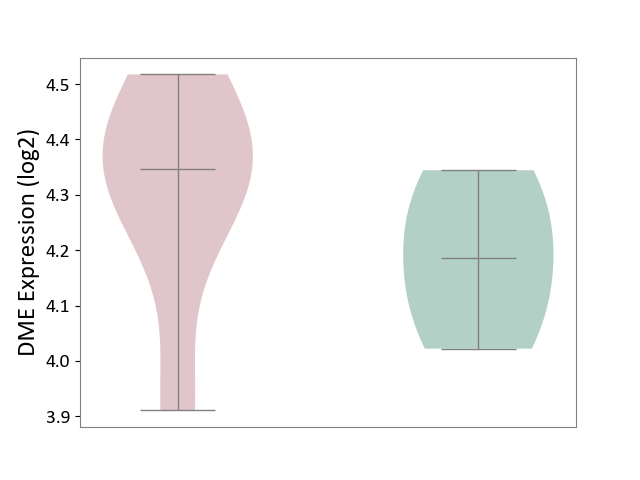
|
Click to View the Clearer Original Diagram | |||
| References | |||||
|---|---|---|---|---|---|
| 1 | Substrates, inducers, inhibitors and structure-activity relationships of human Cytochrome P450 2C9 and implications in drug development. Curr Med Chem. 2009;16(27):3480-675. | ||||
| 2 | Thalidomide metabolism and hydrolysis: mechanisms and implications | ||||
| 3 | Endoxifen and other metabolites of tamoxifen inhibit human hydroxysteroid sulfotransferase 2A1 (hSULT2A1). Drug Metab Dispos. 2014 Nov;42(11):1843-50. | ||||
| 4 | Clinical pharmacokinetics of tyrosine kinase inhibitors. Cancer Treat Rev. 2009 Dec;35(8):692-706. | ||||
| 5 | Optimizing outcomes with alosetron hydrochloride in severe diarrhea-predominant irritable bowel syndrome. Therap Adv Gastroenterol. 2010 May;3(3):165-72. | ||||
| 6 | Identification of Novel Pathways in Idelalisib Metabolism and Bioactivation | ||||
| 7 | Metabolism of R- and S-warfarin by CYP2C19 into four hydroxywarfarins. Drug Metab Lett. 2012 Sep 1;6(3):157-64. | ||||
| 8 | Characterization of the oxidative metabolites of 17beta-estradiol and estrone formed by 15 selectively expressed human cytochrome p450 isoforms. Endocrinology. 2003 Aug;144(8):3382-98. | ||||
| 9 | Inhibition of the human liver microsomal and human cytochrome P450 1A2 and 3A4 metabolism of estradiol by deployment-related and other chemicals. Drug Metab Dispos. 2006 Sep;34(9):1606-14. | ||||
| 10 | A transgenic mouse expressing human CYP1A2 in the pancreas. Biochem Pharmacol. 2000 Sep 15;60(6):857-63. | ||||
| 11 | Roles of CYP2A6 and CYP2B6 in nicotine C-oxidation by human liver microsomes. Arch Toxicol. 1999 Mar;73(2):65-70. | ||||
| 12 | Apremilast (Otezla): a new oral treatment for adults with psoriasis and psoriatic arthritis. P T. 2015 Aug;40(8):495-500. | ||||
| 13 | A predominate role of CYP1A2 for the metabolism of nabumetone to the active metabolite, 6-methoxy-2-naphthylacetic acid, in human liver microsomes. Drug Metab Dispos. 2009 May;37(5):1017-24. | ||||
| 14 | Human metabolism of the proteasome inhibitor bortezomib: identification of circulating metabolites. Drug Metab Dispos. 2005 Jun;33(6):771-7. | ||||
| 15 | Metabolism and metabolic inhibition of xanthotoxol in human liver microsomes. Evid Based Complement Alternat Med. 2016;2016:5416509. | ||||
| 16 | Metabolic Profiles of Propofol and Fospropofol: Clinical and Forensic Interpretative Aspects | ||||
| 17 | Metoclopramide is metabolized by CYP2D6 and is a reversible inhibitor, but not inactivator, of CYP2D6. Xenobiotica. 2014 Apr;44(4):309-319. | ||||
| 18 | Identification of human cytochrome P(450)s that metabolise anti-parasitic drugs and predictions of in vivo drug hepatic clearance from in vitro data. Eur J Clin Pharmacol. 2003 Sep;59(5-6):429-42. | ||||
| 19 | DrugBank(Pharmacology-Metabolism):Almogran | ||||
| 20 | The effect of apigenin on pharmacokinetics of imatinib and its metabolite N-desmethyl imatinib in rats. Biomed Res Int. 2013;2013:789184. | ||||
| 21 | Synthetic and natural compounds that interact with human cytochrome P450 1A2 and implications in drug development. Curr Med Chem. 2009;16(31):4066-218. | ||||
| 22 | Metabolism of capsaicin by cytochrome P450 produces novel dehydrogenated metabolites and decreases cytotoxicity to lung and liver cells Chem Res Toxicol. 2003 Mar;16(3):336-49. doi: 10.1021/tx025599q. | ||||
| 23 | Metabolism of capsaicin by cytochrome P450 produces novel dehydrogenated metabolites and decreases cytotoxicity to lung and liver cells. Chem Res Toxicol. 2003 Mar;16(3):336-49. | ||||
| 24 | Erythromycin interaction with risperidone or clomipramine in an adolescent. J Child Adolesc Psychopharmacol. 1996 Summer;6(2):133-8. | ||||
| 25 | Acute pancreatitis in a patient treated with imatinib and gefitinib. J Oncol Pharm Pract. 2021 Jun;27(4):980-983. doi: 10.1177/1078155220949639. | ||||
| 26 | Multiple cytochrome P-450s involved in the metabolism of terbinafine suggest a limited potential for drug-drug interactions. Drug Metab Dispos. 1999 Sep;27(9):1029-38. | ||||
| 27 | Identification of the human liver enzymes involved in the metabolism of the antimigraine agent almotriptan Drug Metab Dispos. 2003 Apr;31(4):404-11. doi: 10.1124/dmd.31.4.404. | ||||
| 28 | Cytochrome P450 3A4 is the major enzyme involved in the metabolism of the substance P receptor antagonist aprepitant. Drug Metab Dispos. 2004 Nov;32(11):1287-92. | ||||
| 29 | Asenapine review, part I: chemistry, receptor affinity profile, pharmacokinetics and metabolism. Expert Opin Drug Metab Toxicol. 2014 Jun;10(6):893-903. | ||||
| 30 | Drugs that may have potential CYP1A2 interactions. | ||||
| 31 | The effect of CYP2C19 and CYP2D6 genotypes on the metabolism of clomipramine in Japanese psychiatric patients. J Clin Psychopharmacol. 2001 Dec;21(6):549-55. | ||||
| 32 | The biotransformation of clomipramine in vitro, identification of the cytochrome P450s responsible for the separate metabolic pathways. J Pharmacol Exp Ther. 1996 Jun;277(3):1659-64. | ||||
| 33 | Effect of conjugated equine estrogens on oxidative metabolism in middle-aged and elderly postmenopausal women. J Clin Pharmacol. 2006 Nov;46(11):1299-307. | ||||
| 34 | Identification of human liver cytochrome P450 isoforms involved in the in vitro metabolism of cyclobenzaprine. Drug Metab Dispos. 1996 Jul;24(7):786-91. | ||||
| 35 | The effect of new lipophilic chelators on the activities of cytosolic reductases and P450 cytochromes involved in the metabolism of anthracycline antibiotics: studies in vitro. Physiol Res. 2004;53(6):683-91. | ||||
| 36 | Duloxetine: clinical pharmacokinetics and drug interactions. Clin Pharmacokinet. 2011 May;50(5):281-94. | ||||
| 37 | In vitro drug-drug interaction studies with febuxostat, a novel non-purine selective inhibitor of xanthine oxidase: plasma protein binding, identification of metabolic enzymes and cytochrome P450 inhibition Xenobiotica. 2008 May;38(5):496-510. doi: 10.1080/00498250801956350. | ||||
| 38 | Phase 1/2 trial of ixazomib, cyclophosphamide and dexamethasone in patients with previously untreated symptomatic multiple myeloma. Blood Cancer J. 2018 Jul 30;8(8):70. | ||||
| 39 | Cytochrome P450 1A1/2 induction by antiparasitic drugs: dose-dependent increase in ethoxyresorufin O-deethylase activity and mRNA caused by quinine, primaquine and albendazole in HepG2 cells. Eur J Clin Pharmacol. 2002 Nov;58(8):537-42. | ||||
| 40 | Modulation of CYP1A2 enzyme activity by indoleamines: inhibition by serotonin and tryptamine. Pharmacogenetics. 1998 Jun;8(3):251-8. | ||||
| 41 | Effect of fluvoxamine on the pharmacokinetics of roflumilast and roflumilast N-oxide. Clin Pharmacokinet. 2007;46(7):613-22. | ||||
| 42 | FDA Label of Osimertinib. The 2020 official website of the U.S. Food and Drug Administration. | ||||
| 43 | Cytochrome P450 isozymes involved in lisofylline metabolism to pentoxifylline in human liver microsomes. Drug Metab Dispos. 1997 Dec;25(12):1354-8. | ||||
| 44 | Perampanel (Fycompa): a review of clinical efficacy and safety in epilepsy. P T. 2016 Nov;41(11):683-698. | ||||
| 45 | The roles of cytochrome P450 3A4 and 1A2 in the 3-hydroxylation of quinine in vivo. Clin Pharmacol Ther. 1999 Nov;66(5):454-60. | ||||
| 46 | DailyMed : Alitretinoin | ||||
| 47 | Clinical pharmacology of axitinib. Clin Pharmacokinet. 2013 Sep;52(9):713-25. | ||||
| 48 | Pharmacokinetic interactions study between carvedilol and some antidepressants in rat liver microsomes - a comparative study. Med Pharm Rep. 2019 Apr;92(2):158-164. | ||||
| 49 | FDA Label of Deutetrabenazine. The 2020 official website of the U.S. Food and Drug Administration. | ||||
| 50 | In vitro metabolism of zolmitriptan in rat cytochromes induced with beta-naphthoflavone and the interaction between six drugs and zolmitriptan. Chem Biol Interact. 2003 Dec 15;146(3):263-72. | ||||
| 51 | The N-demethylation of the doxepin isomers is mainly catalyzed by the polymorphic CYP2C19. Pharm Res. 2002 Jul;19(7):1034-7. | ||||
| 52 | Metabolism of the antiandrogenic drug (Flutamide) by human CYP1A2. Drug Metab Dispos. 1997 Nov;25(11):1298-303. | ||||
| 53 | In vitro characterization of the metabolism of haloperidol using recombinant cytochrome p450 enzymes and human liver microsomes. Drug Metab Dispos. 2001 Dec;29(12):1638-43. | ||||
| 54 | In?vitro assessment of the potential for dolutegravir to affect hepatic clearance of levonorgestrel | ||||
| 55 | Identification of human cytochrome P450 and flavin-containing monooxygenase enzymes involved in the metabolism of lorcaserin, a novel selective human 5-hydroxytryptamine 2C agonist. Drug Metab Dispos. 2012 Apr;40(4):761-71. | ||||
| 56 | Involvement of multiple cytochrome P450 isoforms in naproxen O-demethylation. Eur J Clin Pharmacol. 1997;52(4):293-8. | ||||
| 57 | Drug Interactions Flockhart Table | ||||
| 58 | Clinically significant psychotropic drug-drug interactions in the primary care setting. Curr Psychiatry Rep. 2012 Aug;14(4):376-90. | ||||
| 59 | Effects of serotonin-3 receptor antagonists on cytochrome P450 activities in human liver microsomes. Biol Pharm Bull. 2006 Sep;29(9):1931-5. | ||||
| 60 | Population pharmacokinetics of pomalidomide. J Clin Pharmacol. 2015 May;55(5):563-72. | ||||
| 61 | Inhibitory effects of antiarrhythmic drugs on phenacetin O-deethylation catalysed by human CYP1A2. Br J Clin Pharmacol. 1998 Apr;45(4):361-8. | ||||
| 62 | Rofecoxib is a potent inhibitor of cytochrome P450 1A2: studies with tizanidine and caffeine in healthy subjects. Br J Clin Pharmacol. 2006 Sep;62(3):345-57. | ||||
| 63 | The effect of tocainide on theophylline metabolism. Br J Clin Pharmacol. 1993 Apr;35(4):437-40. | ||||
| 64 | In Vitro Hepatic Oxidative Biotransformation of Trimethoprim Drug Metab Dispos. 2015 Sep;43(9):1372-80. doi: 10.1124/dmd.115.065193. | ||||
| 65 | Identification of P450 enzymes involved in metabolism of verapamil in humans. Naunyn Schmiedebergs Arch Pharmacol. 1993 Sep;348(3):332-7. | ||||
| 66 | The genetic profiles of CYP1A1, CYP1A2 and CYP2E1 enzymes as susceptibility factor in xenobiotic toxicity in Turkish population. Saudi Pharm J. 2017 Feb;25(2):294-297. | ||||
| 67 | Metabolite Profiling and Reaction Phenotyping for the in Vitro Assessment of the Bioactivation of Bromfenac ? Chem Res Toxicol. 2020 Jan 21;33(1):249-257. doi: 10.1021/acs.chemrestox.9b00268. | ||||
| 68 | Interactions between antiepileptics and second-generation antipsychotics. Expert Opin Drug Metab Toxicol. 2012 Mar;8(3):311-34. | ||||
| 69 | Effects of CYP3A inhibition on the metabolism of cilostazol. Clin Pharmacokinet. 1999;37 Suppl 2:61-8. | ||||
| 70 | Predominant role of peripheral catecholamines in the stress-induced modulation of CYP1A2 inducibility by benzo(alpha)pyrene. Basic Clin Pharmacol Toxicol. 2008 Jan;102(1):35-44. | ||||
| 71 | CYP2B6 genotype-dependent inhibition of CYP1A2 and induction of CYP2A6 by the antiretroviral drug efavirenz in healthy volunteers. Clin Transl Sci. 2019 Nov;12(6):657-666. | ||||
| 72 | Evidence for the Metabolic Activation of Deferasirox In Vitro and In Vivo | ||||
| 73 | Reappraisal of human CYP isoforms involved in imipramine N-demethylation and 2-hydroxylation: a study using microsomes obtained from putative extensive and poor metabolizers of S-mephenytoin and eleven recombinant human CYPs. J Pharmacol Exp Ther. 1997 Jun;281(3):1199-210. | ||||
| 74 | Contribution of UDP-glucuronosyltransferases 1A9 and 2B7 to the glucuronidation of indomethacin in the human liver. Eur J Clin Pharmacol. 2007 Mar;63(3):289-96. | ||||
| 75 | Effects of rifampin on the pharmacokinetics of a single dose of istradefylline in healthy subjects. J Clin Pharmacol. 2018 Feb;58(2):193-201. | ||||
| 76 | Resin haemoperfusion in levomepromazine poisoning: evaluation of effect on plasma drug and metabolite levels | ||||
| 77 | Interactions between the cytochrome P450 system and the second-generation antipsychotics. J Psychiatry Neurosci. 2003 Mar;28(2):99-112. | ||||
| 78 | Substrates, inducers, inhibitors and structure-activity relationships of human Cytochrome P450 2C9 and implications in drug development Curr Med Chem. 2009;16(27):3480-675. doi: 10.2174/092986709789057635. | ||||
| 79 | Association between CYP1A2 activity and riluzole clearance in patients with amyotrophic lateral sclerosis. Br J Clin Pharmacol. 2005 Mar;59(3):310-3. | ||||
| 80 | Metabolism of ropivacaine in humans is mediated by CYP1A2 and to a minor extent by CYP3A4: an interaction study with fluvoxamine and ketoconazole as in vivo inhibitors. Clin Pharmacol Ther. 1998 Nov;64(5):484-91. | ||||
| 81 | Rucaparib: the past, present, and future of a newly approved PARP inhibitor for ovarian cancer. Onco Targets Ther. 2017 Jun 19;10:3029-3037. | ||||
| 82 | Adverse reactions to zolpidem: case reports and a review of the literature. Prim Care Companion J Clin Psychiatry. 2010;12(6). pii: PCC.09r00849. | ||||
| 83 | Role of desethylamiodarone in the anticoagulant effect of concurrent amiodarone and warfarin therapy. J Cardiovasc Pharmacol Ther. 2001 Oct;6(4):363-7. | ||||
| 84 | Addition of amoxapine improves positive and negative symptoms in a patient with schizophrenia Ther Adv Psychopharmacol. 2013 Dec;3(6):340-2. doi: 10.1177/2045125313499363. | ||||
| 85 | Brassica vegetables increase and apiaceous vegetables decrease cytochrome P450 1A2 activity in humans: changes in caffeine metabolite ratios in response to controlled vegetable diets. Carcinogenesis. 2000 Jun;21(6):1157-62. | ||||
| 86 | In vitro identification of the human cytochrome P-450 enzymes involved in the N-demethylation of azelastine. Drug Metab Dispos. 1999 Aug;27(8):942-6. | ||||
| 87 | Pharmacokinetic and pharmacodynamic profile of bendamustine and its metabolites. Cancer Chemother Pharmacol. 2015 Jun;75(6):1143-54. | ||||
| 88 | Functional polymorphisms of the cytochrome P450 1A2 (CYP1A2) gene and prolonged QTc interval in schizophrenia. Prog Neuropsychopharmacol Biol Psychiatry. 2007 Aug 15;31(6):1297-302. | ||||
| 89 | Characterization of Clofazimine Metabolism in Human Liver Microsomal Incubation In Vitro | ||||
| 90 | CYP2D6 mediates 4-hydroxylation of clonidine in vitro: implication for pregnancy-induced changes in clonidine clearance. Drug Metab Dispos. 2010 Sep;38(9):1393-6. | ||||
| 91 | Metabolic drug interactions with newer antipsychotics: a comparative review. Basic Clin Pharmacol Toxicol. 2007 Jan;100(1):4-22. | ||||
| 92 | Identification of human cytochrome p450 isozymes involved in diphenhydramine N-demethylation Drug Metab Dispos. 2007 Jan;35(1):72-8. doi: 10.1124/dmd.106.012088. | ||||
| 93 | Characterization of the cytochrome P450 enzymes involved in the in vitro metabolism of ethosuximide by human hepatic microsomal enzymes Xenobiotica. 2003 Mar;33(3):265-76. doi: 10.1080/0049825021000061606. | ||||
| 94 | In vitro metabolism of exemestane by hepatic cytochrome P450s: impact of nonsynonymous polymorphisms on formation of the active metabolite 17-dihydroexemestane Pharmacol Res Perspect. 2017 Apr 27;5(3):e00314. doi: 10.1002/prp2.314. | ||||
| 95 | Frovatriptan: a review of drug-drug interactions. Headache. 2002 Apr;42 Suppl 2:S63-73. | ||||
| 96 | Pharmacokinetics of levobupivacaine after caudal epidural administration in infants less than 3 months of age. Br J Anaesth. 2005 Oct;95(4):524-9. | ||||
| 97 | In vitro identification of the human cytochrome p450 enzymes involved in the oxidative metabolism of loxapine. Biopharm Drug Dispos. 2011 Oct;32(7):398-407. | ||||
| 98 | Malathion bioactivation in the human liver: the contribution of different cytochrome p450 isoforms. Drug Metab Dispos. 2005 Mar;33(3):295-302. | ||||
| 99 | Impact of the CYP2D6 ultrarapid metabolizer genotype on mirtazapine pharmacokinetics and adverse events in healthy volunteers. J Clin Psychopharmacol. 2004 Dec;24(6):647-52. | ||||
| 100 | CYP1A2 genetic polymorphisms are associated with treatment response to the antidepressant paroxetine. Pharmacogenomics. 2010 Nov;11(11):1535-43. | ||||
| 101 | Pazopanib, a new therapy for metastatic soft tissue sarcoma. Expert Opin Pharmacother. 2013 May;14(7):929-35. | ||||
| 102 | Effect of antipsychotic drugs on human liver cytochrome P-450 (CYP) isoforms in vitro: preferential inhibition of CYP2D6. Drug Metab Dispos. 1999 Sep;27(9):1078-84. | ||||
| 103 | Identification and characterization of human cytochrome P450 isoforms interacting with pimozide. J Pharmacol Exp Ther. 1998 May;285(2):428-37. | ||||
| 104 | Novel Pathways of Ponatinib Disposition Catalyzed By CYP1A1 Involving Generation of Potentially Toxic Metabolites J Pharmacol Exp Ther. 2017 Oct;363(1):12-19. doi: 10.1124/jpet.117.243246. | ||||
| 105 | ABCB1 and ABCG2, but not CYP3A4 limit oral availability and brain accumulation of the RET inhibitor pralsetinib | ||||
| 106 | DrugBank(Pharmacology-Metabolism):Pralsetinib | ||||
| 107 | Inhibition of cytochrome P450 2E1 by propofol in human and porcine liver microsomes. Biochem Pharmacol. 2002 Oct 1;64(7):1151-6. | ||||
| 108 | Receptor-binding and pharmacokinetic properties of dopaminergic agonists. Curr Top Med Chem. 2008;8(12):1049-67. | ||||
| 109 | Metabolism of sumatriptan revisited | ||||
| 110 | Clinical assessment of drug-drug interactions of tasimelteon, a novel dual melatonin receptor agonist. J Clin Pharmacol. 2015 Sep;55(9):1004-11. | ||||
| 111 | Association between common CYP1A2 polymorphisms and theophylline metabolism in non-smoking healthy volunteers. Basic Clin Pharmacol Toxicol. 2013 Apr;112(4):257-63. | ||||
| 112 | Extraction of structure-activity relationship information from high-throughput screening data Curr Med Chem. 2009;16(31):4049-57. doi: 10.2174/092986709789378189. | ||||
| 113 | Cytochrome P450-mediated metabolism of triclosan attenuates its cytotoxicity in hepatic cells | ||||
| 114 | PharmGKB summary: pathways of acetaminophen metabolism at the therapeutic versus toxic doses. Pharmacogenet Genomics. 2015 Aug;25(8):416-26. | ||||
| 115 | Apixaban. Hosp Pharm. 2013 Jun;48(6):494-509. | ||||
| 116 | More methemoglobin is produced by benzocaine treatment than lidocaine treatment in human in vitro systems | ||||
| 117 | FDA Label of Binimetinib. The 2020 official website of the U.S. Food and Drug Administration. | ||||
| 118 | FDA Approved Drug Products: CIPRO XR (ciprofloxacin) extended-release tablets | ||||
| 119 | Clinical pharmacokinetics and pharmacodynamics of dapagliflozin, a selective inhibitor of sodium-glucose co-transporter type 2. Clin Pharmacokinet. 2014 Jan;53(1):17-27. | ||||
| 120 | Effects of morin on the pharmacokinetics of etoposide in rats. Biopharm Drug Dispos. 2007 Apr;28(3):151-6. | ||||
| 121 | Roles of cytochromes P450 1A2, 2A6, and 2C8 in 5-fluorouracil formation from tegafur, an anticancer prodrug, in human liver microsomes. Drug Metab Dispos. 2000 Dec;28(12):1457-63. | ||||
| 122 | Differential metabolism of gefitinib and erlotinib by human cytochrome P450 enzymes. Clin Cancer Res. 2007 Jun 15;13(12):3731-7. | ||||
| 123 | PubChem:Grepafloxacin | ||||
| 124 | Kinetic mechanism of the activation of human plasminogen by streptokinase. Biochemistry. 1975 Oct 7;14(20):4459-65. | ||||
| 125 | The impact of individual human cytochrome P450 enzymes on oxidative metabolism of anticancer drug lenvatinib | ||||
| 126 | N-demethylation of levo-alpha-acetylmethadol by human placental aromatase. Biochem Pharmacol. 2004 Mar 1;67(5):885-92. | ||||
| 127 | Cytochrome P450 enzymes contributing to demethylation of maprotiline in man. Pharmacol Toxicol. 2002 Mar;90(3):144-9. | ||||
| 128 | Methadone--metabolism, pharmacokinetics and interactions. Pharmacol Res. 2004 Dec;50(6):551-9. | ||||
| 129 | Lack of interaction between amiodarone and mexiletine in cardiac arrhythmia patients. J Clin Pharmacol. 2002 Mar;42(3):342-6. | ||||
| 130 | Inhibition of human liver cytochrome P-450 1A2 by the class IB antiarrhythmics mexiletine, lidocaine, and tocainide. J Pharmacol Exp Ther. 1999 May;289(2):853-8. | ||||
| 131 | The in vitro metabolism of desglymidodrine, an active metabolite of prodrug midodrine by human liver microsomes | ||||
| 132 | Effects of olopatadine, a new antiallergic agent, on human liver microsomal cytochrome P450 activities Drug Metab Dispos. 2002 Dec;30(12):1504-11. doi: 10.1124/dmd.30.12.1504. | ||||
| 133 | PharmGKB summary: very important pharmacogene information for CYP1A2. Pharmacogenet Genomics. 2012 Jan;22(1):73-7. | ||||
| 134 | Summary of information on human CYP enzymes: human P450 metabolism data. Drug Metab Rev. 2002 Feb-May;34(1-2):83-448. | ||||
| 135 | Risk of clinically relevant pharmacokinetic-based drug-drug interactions with drugs approved by the U.S. Food and Drug Administration between 2013 and 2016. Drug Metab Dispos. 2018 Jun;46(6):835-845. | ||||
| 136 | In vitro and in vivo evidence for the formation of methyl radical from procarbazine: a spin-trapping study. Carcinogenesis. 1992 May;13(5):799-805. | ||||
| 137 | Comparative in vitro and in vivo inhibition of cytochrome P450 CYP1A2, CYP2D6, and CYP3A by H2-receptor antagonists. Clin Pharmacol Ther. 1999 Apr;65(4):369-76. | ||||
| 138 | Rasagiline (TVP-1012): a new selective monoamine oxidase inhibitor for Parkinson's disease. Am J Geriatr Pharmacother. 2006 Dec;4(4):330-46. | ||||
| 139 | Ontogeny and sorafenib metabolism. Clin Cancer Res. 2012 Oct 15;18(20):5788-95. | ||||
| 140 | PubChem:Tapinarof | ||||
| 141 | Timolol metabolism in human liver microsomes is mediated principally by CYP2D6. Drug Metab Dispos. 2007 Jul;35(7):1135-41. | ||||
| 142 | Drug Interactions with Angiotensin Receptor Blockers: Role of Human Cytochromes P450 | ||||
| 143 | Lithium Intoxication in the Elderly: A Possible Interaction between Azilsartan, Fluvoxamine, and Lithium | ||||
| 144 | Oxidative metabolism of flunarizine and cinnarizine by microsomes from B-lymphoblastoid cell lines expressing human cytochrome P450 enzymes. Biol Pharm Bull. 1996 Nov;19(11):1511-4. | ||||
| 145 | Clinical pharmacokinetics and pharmacodynamics of clopidogrel. Clin Pharmacokinet. 2015 Feb;54(2):147-66. | ||||
| 146 | Eltrombopag for use in children with immune thrombocytopenia. Blood Adv. 2018 Feb 27;2(4):454-461. | ||||
| 147 | Flecainide: current status and perspectives in arrhythmia management. World J Cardiol. 2015 Feb 26;7(2):76-85. | ||||
| 148 | LABEL:DDYI- flibanserin tablet, film coated | ||||
| 149 | Disposition of fluvoxamine in humans is determined by the polymorphic CYP2D6 and also by the CYP1A2 activity | ||||
| 150 | Heterogeneity in systemic availability of ondansetron and granisetron following oral administration. Drug Metab Dispos. 1999 Jan;27(1):110-2. | ||||
| 151 | Evaluation of the effects of the weak CYP3A inhibitors atorvastatin and ethinyl estradiol/norgestimate on lomitapide pharmacokinetics in healthy subjects. J Clin Pharmacol. 2016 Jan;56(1):47-55. | ||||
| 152 | Metabolism of loratadine and further characterization of its in vitro metabolites. Drug Metab Lett. 2009 Aug;3(3):162-70. | ||||
| 153 | Comparison of (S)-mephenytoin and proguanil oxidation in vitro: contribution of several CYP isoforms. Br J Clin Pharmacol. 1999 Aug;48(2):158-67. | ||||
| 154 | Inhibition of human cytochrome P450 enzymes by 1,4-dihydropyridine calcium antagonists: prediction of in vivo drug-drug interactions. Eur J Clin Pharmacol. 2000 Feb-Mar;55(11-12):843-52. | ||||
| 155 | The influence of metabolic gene polymorphisms on urinary 1-hydroxypyrene concentrations in Chinese coke oven workers. Sci Total Environ. 2007 Aug 1;381(1-3):38-46. | ||||
| 156 | Interaction of pefloxacin and enoxacin with the human cytochrome P450 enzyme CYP1A2 | ||||
| 157 | The metabolism of pyrazoloacridine (NSC 366140) by cytochromes p450 and flavin monooxygenase in human liver microsomes. Clin Cancer Res. 2004 Feb 15;10(4):1471-80. | ||||
| 158 | Comparative studies on the cytochrome p450-associated metabolism and interaction potential of selegiline between human liver-derived in vitro systems. Drug Metab Dispos. 2003 Sep;31(9):1093-102. | ||||
| 159 | The selective serotonin reuptake inhibitor sertraline: its profile and use in psychiatric disorders. CNS Drug Rev. 2001 Spring;7(1):1-24. | ||||
| 160 | Stiripentol. Expert Opin Investig Drugs. 2005 Jul;14(7):905-11. | ||||
| 161 | Studies on the metabolism and biological activity of the epimers of sulindac | ||||
| 162 | In vitro drug-drug interaction potential of sulfoxide and/or sulfone metabolites of albendazole, triclabendazole, aldicarb, methiocarb, montelukast and ziprasidone. Drug Metab Lett. 2018;12(2):101-116. | ||||
| 163 | The clinical pharmacology and pharmacokinetics of ulipristal acetate for the treatment of uterine fibroids. Reprod Sci. 2015 Apr;22(4):476-83. | ||||
| 164 | Open-label, dose-titration and continuation study to assess efficacy, safety, and pharmacokinetics of anagrelide in treatment-nae Japanese patients with essential thrombocythemia. Int J Hematol. 2013 Mar;97(3):360-8. | ||||
| 165 | Cytochrome P450 isozymes responsible for the metabolism of toluene and styrene in human liver microsomes. Xenobiotica. 1997 Jul;27(7):657-65. | ||||
| 166 | Principal drug-metabolizing enzyme systems in L1210 leukemia sensitive or resistant to BCNU in vivo. Leuk Res. 1994 Nov;18(11):829-35. | ||||
| 167 | Metabolism and Interactions of Chloroquine and Hydroxychloroquine with Human Cytochrome P450 Enzymes and Drug Transporters Curr Drug Metab. 2020;21(14):1127-1135. doi: 10.2174/1389200221999201208211537. | ||||
| 168 | Prediction of human liver microsomal oxidations of 7-ethoxycoumarin and chlorzoxazone with kinetic parameters of recombinant cytochrome P-450 enzymes. Drug Metab Dispos. 1999 Nov;27(11):1274-80. | ||||
| 169 | Study on mesenchymal stem cells mediated enzyme-prodrug gene CYP1A2 targeting anti-tumor effect. Zhonghua Xue Ye Xue Za Zhi. 2009 Oct;30(10):667-71. | ||||
| 170 | Effects of polyunsaturated fatty acids on prostaglandin synthesis and cyclooxygenase-mediated DNA adduct formation by heterocyclic aromatic amines in human adenocarcinoma colon cells. Mol Carcinog. 2004 Jul;40(3):180-8. | ||||
| 171 | Species difference in stereoselective involvement of CYP3A in the mono-N-dealkylation of disopyramide. Xenobiotica. 2001 Feb;31(2):73-83. | ||||
| 172 | FDA Label of Enasidenib. The 2020 official website of the U.S. Food and Drug Administration. | ||||
| 173 | Comparative studies of in vitro inhibition of cytochrome P450 3A4-dependent testosterone 6beta-hydroxylation by roxithromycin and its metabolites, troleandomycin, and erythromycin. Drug Metab Dispos. 1998 Nov;26(11):1053-7. | ||||
| 174 | Inhibitory potency of quinolone antibacterial agents against cytochrome P450IA2 activity in vivo and in vitro. Antimicrob Agents Chemother. 1992 May;36(5):942-8. | ||||
| 175 | Hydroxylation and demethylation of the tricyclic antidepressant nortriptyline by cDNA-expressed human cytochrome P-450 isozymes. Drug Metab Dispos. 1997 Jun;25(6):740-4. | ||||
| 176 | Effects of prototypical microsomal enzyme inducers on cytochrome P450 expression in cultured human hepatocytes. Drug Metab Dispos. 2003 Apr;31(4):421-31. | ||||
| 177 | Effect of steady-state enoxacin on single-dose pharmacokinetics of roflumilast and roflumilast N-oxide. J Clin Pharmacol. 2011 Apr;51(4):586-93. | ||||
| 178 | SULT 1A3 single-nucleotide polymorphism and the single dose pharmacokinetics of inhaled salbutamol enantiomers: are some athletes at risk of higher urine levels? Drug Test Anal. 2015 Feb;7(2):109-13. doi: 10.1002/dta.1645. | ||||
| 179 | Rate-limiting biotransformation of triamterene is mediated by CYP1A2. Int J Clin Pharmacol Ther. 2005 Jul;43(7):327-34. | ||||
| 180 | Management of Unique Populations with HCV Infection | ||||
| 181 | DrugBank(Pharmacology-Metabolism):Voxilaprevir | ||||
| 182 | Lack of effect of olanzapine on the pharmacokinetics of a single aminophylline dose in healthy men. Pharmacotherapy. 1998 Nov-Dec;18(6):1237-48. | ||||
| 183 | Rat hepatic CYP1A1 and CYP1A2 induction by menadione. Toxicol Lett. 2005 Feb 15;155(2):253-8. | ||||
| 184 | Identification of cytochrome P450 2E1 as the predominant enzyme catalyzing human liver microsomal defluorination of sevoflurane, isoflurane, and methoxyflurane. Anesthesiology. 1993 Oct;79(4):795-807. | ||||
| 185 | Metabolism of ramelteon in human liver microsomes and correlation with the effect of fluvoxamine on ramelteon pharmacokinetics. Drug Metab Dispos. 2010 Aug;38(8):1381-91. | ||||
| 186 | In vitro analysis of factors influencing CYP1A2 expression as potential determinants of interindividual variation. Pharmacol Res Perspect. 2017 Mar 2;5(2):e00299. | ||||
| 187 | Psychotropic Medications Metabolized by Cytochromes P450 (CYP) 1A2 Enzyme and Relevant Drug Interactions: Review of Articles | ||||
| 188 | Umbralisib: First Approval | ||||
| 189 | Clinical pharmacology of lumiracoxib: a selective cyclo-oxygenase-2 inhibitor. Clin Pharmacokinet. 2005;44(12):1247-66. | ||||
| 190 | CYP2D plays a major role in berberine metabolism in liver of mice and humans | ||||
| 191 | Genetic variation in the first-pass metabolism of ethinylestradiol, sex hormone binding globulin levels and venous thrombosis risk Eur J Intern Med. 2017 Jul;42:54-60. doi: 10.1016/j.ejim.2017.05.019. | ||||
| 192 | Metabolism of 17 alpha-ethinylestradiol by human liver microsomes in vitro: aromatic hydroxylation and irreversible protein binding of metabolites J Clin Endocrinol Metab. 1974 Dec;39(6):1072-80. doi: 10.1210/jcem-39-6-1072. | ||||
| 193 | Insights into the substrate specificity, inhibitors, regulation, and polymorphisms and the clinical impact of human cytochrome P450 1A2. AAPS J. 2009 Sep;11(3):481-94. | ||||
| 194 | No influence of the CYP2C19-selective inhibitor omeprazole on the pharmacokinetics of the dopamine receptor agonist rotigotine | ||||
| 195 | Multiple P450 substrates in a single run: rapid and comprehensive in vitro interaction assay. Eur J Pharm Sci. 2005 Jan;24(1):123-32. | ||||
| 196 | Identification of human cytochrome P450 isoforms involved in the stereoselective metabolism of mianserin enantiomers. J Pharmacol Exp Ther. 1996 Jul;278(1):21-30. | ||||
| 197 | Identification of cytochrome P450 enzymes involved in the metabolism of zotepine, an antipsychotic drug, in human liver microsomes. Xenobiotica. 1999 Mar;29(3):217-29. | ||||
| 198 | Appetite suppressant drugs as inhibitors of human cytochromes P450: in vitro inhibition of P450-2D6 by D- and L-fenfluramine, but not phentermine. J Clin Psychopharmacol. 1998 Aug;18(4):338-41. | ||||
| 199 | Role of human liver cytochrome P4503A in the metabolism of etoricoxib, a novel cyclooxygenase-2 selective inhibitor. Drug Metab Dispos. 2001 Jun;29(6):813-20. | ||||
| 200 | Pharmacokinetic evaluation of idebenone. Expert Opin Drug Metab Toxicol. 2010 Nov;6(11):1437-44. | ||||
| 201 | CYP2A13 metabolizes the substrates of human CYP1A2, phenacetin, and theophylline. Drug Metab Dispos. 2007 Mar;35(3):335-9. | ||||
| 202 | Mechanism-based inactivation of cytochrome P450s 1A2 and 3A4 by dihydralazine in human liver microsomes. Chem Res Toxicol. 1999 Oct;12(10):1028-32. | ||||
| 203 | Perazine as a potent inhibitor of human CYP1A2 but not CYP3A4. Pol J Pharmacol. 2002 Jul-Aug;54(4):407-10. | ||||
| 204 | Does celecoxib inhibit agomelatine metabolism via CYP2C9 or CYP1A2? Drug Des Devel Ther. 2018 Jul 11;12:2169-2172. | ||||
| 205 | DrugBank(Pharmacology-Metabolism)Lofexidine | ||||
| 206 | Ondansetron, ramosetron, or palonosetron: which is a better choice of antiemetic to prevent postoperative nausea and vomiting in patients undergoing laparoscopic cholecystectomy? Anesth Essays Res. 2011 Jul-Dec;5(2):182-6. | ||||
| 207 | PharmGKB summary: caffeine pathway. Pharmacogenet Genomics. 2012 May;22(5):389-95. | ||||
| 208 | Plasma protein binding, pharmacokinetics, tissue distribution and CYP450 biotransformation studies of fidarestat by ultra high performance liquid chromatography-high resolution mass spectrometry | ||||
| 209 | Cytochrome P450 1A2 (CYP1A2) activity and risk factors for breast cancer: a cross-sectional study. Breast Cancer Res. 2004;6(4):R352-65. | ||||
| 210 | Physiologically Based Pharmacokinetic Modeling for Selumetinib to Evaluate Drug-Drug Interactions and Pediatric Dose Regimens | ||||
| 211 | Metabolism, Excretion, and Pharmacokinetics of Selumetinib, an MEK1/2 inhibitor, in Healthy Adult Male Subjects | ||||
| 212 | Metabolic pathway of icotinib in vitro: the differential roles of CYP3A4, CYP3A5, and CYP1A2 on potential pharmacokinetic drug-drug interaction. J Pharm Sci. 2018 Apr;107(4):979-983. | ||||
| 213 | DrugBank(Pharmacology-Metabolism):Chlorpromazine | ||||
| 214 | In vitro metabolism of the analgesic bicifadine in the mouse, rat, monkey, and human. Drug Metab Dispos. 2007 Dec;35(12):2232-41. | ||||
| 215 | Characterization of human cytochrome P450 enzymes catalyzing domperidone N-dealkylation and hydroxylation in vitro. Br J Clin Pharmacol. 2004 Sep;58(3):277-87. | ||||
| 216 | Carotenoids as regulators for inter-species difference in cytochrome P450 1A expression and activity in ungulates and rats. Food Chem Toxicol. 2010 Nov;48(11):3201-8. | ||||
| 217 | Effect of ketoconazole on the pharmacokinetics of maribavir in healthy adults | ||||
| 218 | Preclinical metabolism and disposition of SB939 (Pracinostat), an orally active histone deacetylase inhibitor, and prediction of human pharmacokinetics. Drug Metab Dispos. 2011 Dec;39(12):2219-32. | ||||
| 219 | DrugBank(Pharmacology-Metabolism):BMS-986165 | ||||
| 220 | Identification of the oxidative and conjugative enzymes involved in the biotransformation of brivanib | ||||
| 221 | Cytochrome P450 CYP1B1 interacts with 8-methoxypsoralen (8-MOP) and influences psoralen-ultraviolet A (PUVA) sensitivity. PLoS One. 2013 Sep 23;8(9):e75494. | ||||
| 222 | Cytochrome P450 isoform selectivity in human hepatic theobromine metabolism. Br J Clin Pharmacol. 1999 Mar;47(3):299-305. | ||||
| 223 | Disposition and metabolism of semagacestat, a {gamma}-secretase inhibitor, in humans. Drug Metab Dispos. 2010 Apr;38(4):554-65. | ||||
| 224 | Involvement of cytochrome P450 1A2 in the biotransformation of trans-resveratrol in human liver microsomes. Biochem Pharmacol. 2004 Aug 15;68(4):773-82. | ||||
| 225 | In vitro evaluation of fenfluramine and norfenfluramine as victims of drug interactions | ||||
| 226 | DrugBank(Pharmacology-Metabolism):MRTX849 | ||||
| 227 | DrugBank(Pharmacology-Metabolism):Ag-221 | ||||
| 228 | Pharmacokinetics and disposition of momelotinib revealed a disproportionate human metabolite-resolution for clinical development. Drug Metab Dispos. 2018 Mar;46(3):237-247. | ||||
| 229 | Psychological effects of dopamine agonist treatment in patients with hyperprolactinemia and prolactin-secreting adenomas. Eur J Endocrinol. 2019 Jan 1;180(1):31-40. | ||||
| 230 | DrugBank(Pharmacology-Metabolism):Verapamil | ||||
| 231 | In vitro characterization of sarizotan metabolism: hepatic clearance, identification and characterization of metabolites, drug-metabolizing enzyme identification, and evaluation of cytochrome p450 inhibition. Drug Metab Dispos. 2010 Jun;38(6):905-16. | ||||
| 232 | Determination of an optimal dosing regimen for fexinidazole, a novel oral drug for the treatment of human African trypanosomiasis: first-in-human studies | ||||
| 233 | Fexinidazole--a new oral nitroimidazole drug candidate entering clinical development for the treatment of sleeping sickness. PLoS Negl Trop Dis. 2010 Dec 21;4(12):e923. | ||||
| 234 | CYP3A but not P-gp plays a relevant role in the in vivo intestinal and hepatic clearance of the delta-specific phosphoinositide-3 kinase inhibitor leniolisib | ||||
| 235 | Differential mechanisms for the inhibition of human cytochrome P450 1A2 by apigenin and genistein. J Biochem Mol Toxicol. 2010 Jul-Aug;24(4):230-4. | ||||
| 236 | KAE609 (Cipargamin), a New Spiroindolone Agent for the Treatment of Malaria: Evaluation of the Absorption, Distribution, Metabolism, and Excretion of a Single Oral 300-mg Dose of [14C]KAE609 in Healthy Male Subjects | ||||
| 237 | A drug-drug interaction study to assess the effect of the CYP1A2 inhibitor fluvoxamine on the pharmacokinetics of dovitinib (TKI258) in patients with advanced solid tumors. Cancer Chemother Pharmacol. 2018 Jan;81(1):73-80. | ||||
| 238 | Metabolic Profiling of the Novel Hypoxia-Inducible Factor 2 Inhibitor PT2385 In Vivo and In Vitro | ||||
| 239 | Metabolism and disposition of vatalanib (PTK787/ZK-222584) in cancer patients | ||||
| 240 | Vatalanib population pharmacokinetics in patients with myelodysplastic syndrome: CALGB 10105 (Alliance) | ||||
| 241 | Acetaminophen activation by human liver cytochromes P450IIE1 and P450IA2. Arch Biochem Biophys. 1989 Jun;271(2):270-83. | ||||
| 242 | In vitro evaluation of the metabolic enzymes and drug interaction potential of triapine | ||||
| 243 | Effect of deuteration on metabolism and clearance of Nerispirdine (HP184) and AVE5638 | ||||
| 244 | Cytochrome P450 Mediated Bioactivation of Saracatinib | ||||
| 245 | Identification of metabolic pathways involved in the biotransformation of tolperisone by human microsomal enzymes. Drug Metab Dispos. 2003 May;31(5):631-6. | ||||
| 246 | Integration of Physiologically-Based Pharmacokinetic Modeling into Early Clinical Development: An Investigation of the Pharmacokinetic Nonlinearity | ||||
| 247 | Anti-inflammatory effects of ladostigil and its metabolites in aged rat brain and in microglial cells | ||||
| 248 | Characterization of human cytochrome P450 isoenzymes involved in the metabolism of vinorelbine. Fundam Clin Pharmacol. 2005 Oct;19(5):545-53. | ||||
| 249 | Metabolic pathways of the camptothecin analog AR-67 | ||||
| 250 | Preclinical factors affecting the interindividual variability in the clearance of the investigational anti-cancer drug 5,6-dimethylxanthenone-4-acetic acid. Biochem Pharmacol. 2003 Jun 1;65(11):1853-65. | ||||
| 251 | Physiologically based modeling of lisofylline pharmacokinetics following intravenous administration in mice. Eur J Drug Metab Pharmacokinet. 2016 Aug;41(4):403-12. | ||||
| 252 | Metabolism and disposition of GTS-21, a novel drug for Alzheimer's disease. Xenobiotica. 1999 Jul;29(7):747-62. | ||||
| 253 | Beta-adrenergic receptor modulation of the LPS-mediated depression in CYP1A activity in astrocytes. Biochem Pharmacol. 2005 Mar 1;69(5):741-50. | ||||
| 254 | Isolation, Structural Identification, Synthesis, and Pharmacological Profiling of 1,2-trans-Dihydro-1,2-diol Metabolites of the Utrophin Modulator Ezutromid | ||||
| 255 | Phase I clinical trial of MPC-6827 (Azixa), a microtubule destabilizing agent, in patients with advanced cancer | ||||
| 256 | Phase Ia/b, Open-Label, Multicenter Study of AZD4635 (an Adenosine A2A Receptor Antagonist) as Monotherapy or Combined with Durvalumab, in Patients with Solid Tumors | ||||
| 257 | Evaluation of the drug-drug interaction potential for trazpiroben (TAK-906), a D(2)/D(3) receptor antagonist for gastroparesis, towards cytochrome P450s and transporters | ||||
| 258 | Discovery of Encequidar, First-in-Class Intestine Specific P-glycoprotein Inhibitor | ||||
| 259 | Review of Clinically Relevant Drug Interactions with Next Generation Hepatitis C Direct-acting Antiviral Agents | ||||
| 260 | The Potential Role of POR*28 and CYP1A2*F Genetic Variations and Lifestyle Factors on Clozapine and N-DesmethylClozapine Plasma Levels in Schizophrenia Patients | ||||
| 261 | Metabolism and bioactivation of famitinib, a novel inhibitor of receptor tyrosine kinase, in cancer patients. Br J Pharmacol. 2013 Apr;168(7):1687-706. | ||||
| 262 | Metabolic map and bioactivation of the anti-tumour drug noscapine | ||||
| 263 | GABA(A) receptor activity modulating piperine analogs: In vitro metabolic stability, metabolite identification, CYP450 reaction phenotyping, and protein binding | ||||
| 264 | Characterization of cytochrome P450s mediating ipriflavone metabolism in human liver microsomes. Xenobiotica. 2007 Mar;37(3):246-59. | ||||
| 265 | Preclinical metabolism and pharmacokinetics of SB1317 (TG02), a potent CDK/JAK2/FLT3 inhibitor. Drug Metab Lett. 2012 Mar;6(1):33-42. | ||||
| 266 | Metabolism and pharmacokinetics of allitinib in cancer patients: the roles of cytochrome P450s and epoxide hydrolase in its biotransformation | ||||
| 267 | Pharmacokinetics and Metabolism of Naringin and Active Metabolite Naringenin in Rats, Dogs, Humans, and the Differences Between Species | ||||
| 268 | Comparative Metabolism of Batracylin (NSC 320846) and N-acetylbatracylin (NSC 611001) Using Human, Dog, and Rat Preparations In Vitro | ||||
| 269 | Nonclinical pharmacokinetics and in vitro metabolism of H3B-6545, a novel selective ERalpha covalent antagonist (SERCA). Cancer Chemother Pharmacol. 2019 Jan;83(1):151-160. | ||||
| 270 | In vitro metabolism of 17-(dimethylaminoethylamino)-17-demethoxygeldanamycin in human liver microsomes | ||||
| 271 | Rapid determination of five probe drugs and their metabolites in human plasma and urine by liquid chromatography/tandem mass spectrometry: application to cytochrome P450 phenotyping studies. Rapid Commun Mass Spectrom. 2004;18(23):2921-33. | ||||
| 272 | MLN8054 and Alisertib (MLN8237): discovery of selective oral aurora A inhibitors. ACS Med Chem Lett. 2015 Apr 22;6(6):630-4. | ||||
| 273 | Drug-Drug Interaction Study to Assess the Effect of Cytochrome P450 Inhibition and Induction on the Pharmacokinetics of the Novel Cereblon Modulator Avadomide (CC-122) in Healthy Adult Subjects | ||||
| 274 | Cilomilast: a second generation phosphodiesterase 4 inhibitor for asthma and chronic obstructive pulmonary disease | ||||
| 275 | An assessment of human liver-derived in vitro systems to predict the in vivo metabolism and clearance of almokalant | ||||
| 276 | [Investigation of metabolic kinetics and reaction phenotyping of ligustrazin by using liver microsomes and recombinant human enzymes] | ||||
| 277 | Identification of cytochrome P450 isoform involved in the metabolism of YM992, a novel selective serotonin re-uptake inhibitor, in human liver microsomes | ||||
| 278 | Behavior of thymidylate kinase toward monophosphate metabolites and its role in the metabolism of 1-(2'-deoxy-2'-fluoro-beta-L-arabinofuranosyl)-5-methyluracil (Clevudine) and 2',3'-didehydro-2',3'-dideoxythymidine in cells. Antimicrob Agents Chemother. 2005 May;49(5):2044-9. doi: 10.1128/AAC.49.5.2044-2049.2005. | ||||
| 279 | Species-dependent metabolism of a novel selective 7 neuronal acetylcholine receptor agonist ABT-107 | ||||
| 280 | In-vitro metabolism of YM17E, an inhibitor of acyl coenzyme A:cholesterol acyltransferase, by liver microsomes in man | ||||
| 281 | In vitro metabolism studies of nomifensine monooxygenation pathways: metabolite identification, reaction phenotyping, and bioactivation mechanism | ||||
| 282 | Human biotransformation of bropirimine. Characterization of the major bropirimine oxidative metabolites formed in vitro. Drug Metab Dispos. 1998 Oct;26(10):1048-51. | ||||
| 283 | Metabolism of mofarotene in hepatocytes and liver microsomes from different species. Comparison with in vivo data and evaluation of the cytochrome P450 isoenzymes involved in human biotransformation. Drug Metab Dispos. 1995 Oct;23(10):1051-7. | ||||
| 284 | Effects of cytokine-induced macrophages on the response of tumor cells to banoxantrone (AQ4N) | ||||
| 285 | Bioreductively activated antitumor N-oxides: the case of AQ4N, a unique approach to hypoxia-activated cancer chemotherapy | ||||
| 286 | CYP2S1 is negatively regulated by corticosteroids in human cell lines. Toxicol Lett. 2012 Feb 25;209(1):30-4. | ||||
| 287 | Antidepressants: Past, Present and Future. Edited by Sheldon H. Preskorn Christina Y. Stanga John P. Feighner Ruth Ross. Page: 574. | ||||
| 288 | Using chimeric mice with humanized livers to predict human drug metabolism and a drug-drug interaction. J Pharmacol Exp Ther. 2013 Feb;344(2):388-96. | ||||
| 289 | Cytochrome P450 isozymes involved in propranolol metabolism in human liver microsomes. The role of CYP2D6 as ring-hydroxylase and CYP1A2 as N-desisopropylase. Drug Metab Dispos. 1994 Nov-Dec;22(6):909-15. | ||||
| 290 | Identification of the cytochromes P450 that catalyze coumarin 3,4-epoxidation and 3-hydroxylation | ||||
| 291 | The influence of the sparteine/debrisoquine genetic polymorphism on the disposition of dexfenfluramine. Br J Clin Pharmacol. 1996 Apr;41(4):311-7. | ||||
| 292 | Carcinogenic 3-nitrobenzanthrone but not 2-nitrobenzanthrone is metabolised to an unusual mercapturic acid in rats | ||||
| 293 | Urinary metabolites of dibutyl phthalate and benzophenone-3 are potential chemical risk factors of chronic kidney function markers among healthy women | ||||
| 294 | Bufuralol hydroxylation by cytochrome P450 2D6 and 1A2 enzymes in human liver microsomes | ||||
| 295 | Selective serotonin reuptake inhibitors and CNS drug interactions. A critical review of the evidence. Clin Pharmacokinet. 1997 Dec;33(6):454-71. | ||||
| 296 | In Vitro Regio- and Stereoselective Oxidation of -Ionone by Human Liver Microsomes | ||||
| 297 | Role of polymorphic human cytochrome P450 enzymes in estrone oxidation. Cancer Epidemiol Biomarkers Prev. 2006 Mar;15(3):551-8. | ||||
| 298 | In vitro investigation of cytochrome P450-mediated metabolism of dietary flavonoids. Food Chem Toxicol. 2002 May;40(5):609-16. | ||||
| 299 | Major pathway of imipramine metabolism is catalyzed by cytochromes P-450 1A2 and P-450 3A4 in human liver. Mol Pharmacol. 1993 May;43(5):827-32. | ||||
| 300 | Cytochrome P450 4A11 inhibition assays based on characterization of lauric acid metabolites | ||||
| 301 | Activation of the antitumor agent aminoflavone (NSC 686288) is mediated by induction of tumor cell cytochrome P450 1A1/1A2. Mol Pharmacol. 2002 Jul;62(1):143-53. | ||||
| 302 | Characterization of human cytochrome P450 enzymes involved in the metabolism of cyamemazine. Eur J Pharm Sci. 2007 Dec;32(4-5):357-66. | ||||
| 303 | Diazinon, chlorpyrifos and parathion are metabolised by multiple cytochromes P450 in human liver. Toxicology. 2006 Jul 5;224(1-2):22-32. | ||||
| 304 | Human liver oxidative metabolism of O6-benzylguanine. Biochem Pharmacol. 1995 Oct 26;50(9):1385-9. | ||||
| 305 | Coleman J., Cox A. and Cowley N. (2011). Side Effects of Drugs Annual. Elsevier. | ||||
| 306 | Acetaminophen, via its reactive metabolite N-acetyl-p-benzo-quinoneimine and transient receptor potential ankyrin-1 stimulation, causes neurogenic inflammation in the airways and other tissues in rodents FASEB J. 2010 Dec;24(12):4904-16. doi: 10.1096/fj.10-162438. | ||||
| 307 | Rapid detection and quantification of paracetamol and its major metabolites using surface enhanced Raman scattering. Analyst. 2023 Apr 11;148(8):1805-1814. doi: 10.1039/d3an00249g. | ||||
| 308 | Identification of the human liver enzymes involved in the metabolism of the antimigraine agent almotriptan. Drug Metab Dispos. 2003 Apr;31(4):404-11. | ||||
| 309 | Clinical pharmacokinetics of almotriptan, a serotonin 5-HT(1B/1D) receptor agonist for the treatment of migraine. Clin Pharmacokinet. 2005;44(3):237-46. | ||||
| 310 | Cytochromes P450: a structure-based summary of biotransformations using representative substrates Drug Metab Rev. 2008;40(1):1-100. doi: 10.1080/03602530802309742. | ||||
| 311 | Addition of amoxapine improves positive and negative symptoms in a patient with schizophrenia. Ther Adv Psychopharmacol. 2013 Dec;3(6):340-2. | ||||
| 312 | DrugBank(Pharmacology-Metabolism)Amoxapine | ||||
| 313 | DrugBank(Pharmacology-Metabolism)Anagrelide hydrochloride | ||||
| 314 | Colorimetric detection of human caeruloplasmin oxidase activity after electrophoresis in agar plates or after immunoelectrophoresis. Nature. 1958 Apr 5;181(4614):999-1000. doi: 10.1038/181999b0. | ||||
| 315 | Apixaban. After hip or knee replacement: LMWH remains the standard treatment. Prescrire Int. 2012 Sep;21(130):201-2, 204. | ||||
| 316 | Disposition, metabolism and mass balance of [(14)C]apremilast following oral administration. Xenobiotica. 2011 Dec;41(12):1063-75. | ||||
| 317 | Lack of effect of aprepitant on the pharmacokinetics of docetaxel in cancer patients. Cancer Chemother Pharmacol. 2005 Jun;55(6):609-16. | ||||
| 318 | Role of cytochrome P450 enzymes in the bioactivation of polyunsaturated fatty acids. Biochim Biophys Acta. 2011 Jan;1814(1):210-22. | ||||
| 319 | Predicting pharmacokinetics and drug interactions in patients from in vitro and in vivo models: the experience with 5,6-dimethylxanthenone-4-acetic acid (DMXAA), an anti-cancer drug eliminated mainly by conjugation. Drug Metab Rev. 2002 Nov;34(4):751-90. | ||||
| 320 | In Vitro Kinetic Characterization of Axitinib Metabolism | ||||
| 321 | The metabolism of berberine and its contribution to the pharmacological effects | ||||
| 322 | Transformation of berberine to its demethylated metabolites by the CYP51 enzyme in the gut microbiota | ||||
| 323 | LABEL: JUXTAPID- lomitapide mesylate capsule | ||||
| 324 | The effect of itraconazole on the pharmacokinetics and pharmacodynamics of bromazepam in healthy volunteers | ||||
| 325 | Metabolite profiling and reaction phenotyping for the in vitro assessment of the bioactivation of bromfenac. Chem Res Toxicol. 2020 Jan 21;33(1):249-257. | ||||
| 326 | Metabolic disposition of 14C-bromfenac in healthy male volunteers J Clin Pharmacol. 1998 Aug;38(8):744-52. doi: 10.1002/j.1552-4604.1998.tb04815.x. | ||||
| 327 | Role of CYP3A in bromperidol metabolism in rat in vitro and in vivo Xenobiotica. 1999 Aug;29(8):839-46. doi: 10.1080/004982599238281. | ||||
| 328 | Urine caffeine metabolites are positively associated with cognitive performance in older adults: An analysis of US National Health and Nutrition Examination Survey (NHANES) 2011 to 2014. Nutr Res. 2023 Jan;109:12-25. doi: 10.1016/j.nutres.2022.11.002. | ||||
| 329 | Pharmacokinetic analysis and comparison of caffeine administered rapidly or slowly in coffee chilled or hot versus chilled energy drink in healthy young adults Clin Toxicol (Phila). 2016;54(4):308-12. doi: 10.3109/15563650.2016.1146740. | ||||
| 330 | In vivo evaluation of CYP1A2, CYP2A6, NAT-2 and xanthine oxidase activities in a Greek population sample by the RP-HPLC monitoring of caffeine metabolic ratios Biomed Chromatogr. 2007 Feb;21(2):190-200. doi: 10.1002/bmc.736. | ||||
| 331 | Metabolism of carvedilol in dogs, rats, and mice Drug Metab Dispos. 1998 Oct;26(10):958-69. | ||||
| 332 | Cytochromes P450 and experimental models of drug metabolism. J Cell Mol Med. 2002 Apr-Jun;6(2):189-98. | ||||
| 333 | Antiserotonergic properties of terguride in blood vessels, platelets, and valvular interstitial cells | ||||
| 334 | Classics in Chemical Neuroscience: Chlorpromazine ACS Chem Neurosci. 2019 Jan 16;10(1):79-88. doi: 10.1021/acschemneuro.8b00258. | ||||
| 335 | Determination of chlorpromazine and its metabolites in animal-derived foods using QuEChERS-based extraction, EMR-Lipid cleanup, and UHPLC-Q-Orbitrap MS analysis. Food Chem. 2023 Mar 1;403:134298. doi: 10.1016/j.foodchem.2022.134298. | ||||
| 336 | DrugBank : Cinnarizine | ||||
| 337 | Pharmacogenomics knowledge for personalized medicine Clin Pharmacol Ther. 2012 Oct;92(4):414-7. doi: 10.1038/clpt.2012.96. | ||||
| 338 | Metabolism of clomipramine in a Japanese psychiatric population: hydroxylation, desmethylation, and glucuronidation | ||||
| 339 | Population pharmacokinetics of clomipramine, desmethylclomipramine, and hydroxylated metabolites in patients with depression receiving chronic treatment: model evaluation | ||||
| 340 | Species differences and interindividual variation in liver microsomal cytochrome P450 2A enzymes: effects on coumarin, dicumarol, and testosterone oxidation | ||||
| 341 | In vitro metabolism of CP-122,721 ((2S,3S)-2-phenyl-3-[(5-trifluoromethoxy-2-methoxy)benzylamino]piperidine), a non-peptide antagonist of the substance P receptor. Drug Metab Pharmacokinet. 2007 Oct;22(5):336-49. | ||||
| 342 | Metabolism, pharmacokinetics, and excretion of the substance P receptor antagonist CP-122,721 in humans: structural characterization of the novel major circulating metabolite 5-trifluoromethoxy salicylic acid by high-performance liquid chromatography-tandem mass spectrometry and NMR spectroscopy | ||||
| 343 | Active cyamemazine metabolites in patients treated with cyamemazine (Tercian?): influence on cerebral dopamine D2 and serotonin 5-HT (2A) receptor occupancy as measured by positron emission tomography (PET) | ||||
| 344 | Pharmacokinetics of dacarbazine (DTIC) in pregnancy | ||||
| 345 | In vitro characterization and pharmacokinetics of dapagliflozin (BMS-512148), a potent sodium-glucose cotransporter type II inhibitor, in animals and humans Drug Metab Dispos. 2010 Mar;38(3):405-14. doi: 10.1124/dmd.109.029165. | ||||
| 346 | Metabolism of dexfenfluramine in human liver microsomes and by recombinant enzymes: role of CYP2D6 and 1A2. Pharmacogenetics. 1998 Oct;8(5):423-32. | ||||
| 347 | DrugBank(Pharmacology-Metabolism)Diazepam | ||||
| 348 | Pharmacokinetics of Diazepam and Its Metabolites in Urine of Chinese Participants. Drugs R D. 2022 Mar;22(1):43-50. doi: 10.1007/s40268-021-00375-y. | ||||
| 349 | Kinetic disposition of diazepam and its metabolites after intravenous administration of diazepam in the horse: Relevance for doping control. J Vet Pharmacol Ther. 2021 Sep;44(5):733-744. doi: 10.1111/jvp.12991. | ||||
| 350 | Plasma and synovial fluid concentrations of diclofenac sodium and its major hydroxylated metabolites during long-term treatment of rheumatoid arthritis Eur J Clin Pharmacol. 1983;25(3):389-94. doi: 10.1007/BF01037953. | ||||
| 351 | Simultaneous determination of diclofenac sodium and its hydroxy metabolites by capillary column gas chromatography with electron-capture detection J Chromatogr. 1981 Nov 6;217:263-71. doi: 10.1016/s0021-9673(00)88081-4. | ||||
| 352 | Identification of human cytochrome p450 isozymes involved in diphenhydramine N-demethylation. Drug Metab Dispos. 2007 Jan;35(1):72-8. | ||||
| 353 | Bioconcentration, metabolism and effects of diphenhydramine on behavioral and biochemical markers in crucian carp (Carassius auratus) Sci Total Environ. 2016 Feb 15;544:400-9. doi: 10.1016/j.scitotenv.2015.11.132. | ||||
| 354 | Non-invasive skin sampling detects systemically administered drugs in humans. PLoS One. 2022 Jul 26;17(7):e0271794. doi: 10.1371/journal.pone.0271794. | ||||
| 355 | Characterization of human cytochrome P450 enzymes involved in the biotransformation of eperisone. Xenobiotica. 2009 Jan;39(1):1-10. | ||||
| 356 | DrugBank(Pharmacology-Metabolism)Estradiol acetate | ||||
| 357 | Cytochrome P450-mediated metabolism of estrogens and its regulation in human. Cancer Lett. 2005 Sep 28;227(2):115-24. | ||||
| 358 | Induction of CYP3A4 by efavirenz in primary human hepatocytes: comparison with rifampin and phenobarbital. J Clin Pharmacol. 2004 Nov;44(11):1273-81. | ||||
| 359 | Biotransformation of Efavirenz and Proteomic Analysis of Cytochrome P450s and UDP-Glucuronosyltransferases in Mouse, Macaque, and Human Brain-Derived In Vitro Systems. Drug Metab Dispos. 2023 Apr;51(4):521-531. doi: 10.1124/dmd.122.001195. | ||||
| 360 | Liver Cirrhosis Affects the Pharmacokinetics of the Six Substrates of the Basel?Phenotyping Cocktail Differently. Clin Pharmacokinet. 2022 Jul;61(7):1039-1055. doi: 10.1007/s40262-022-01119-0. | ||||
| 361 | Instability of Efavirenz Metabolites Identified During Method Development and Validation. J Pharm Sci. 2021 Oct;110(10):3362-3366. doi: 10.1016/j.xphs.2021.06.028. | ||||
| 362 | Bioactivity and metabolism of trans-resveratrol orally administered to Wistar rats | ||||
| 363 | FDA:Enasidenib | ||||
| 364 | The metabolism of estradiol; oral compared to intravenous administration J Steroid Biochem. 1985 Dec;23(6A):1065-70. doi: 10.1016/0022-4731(85)90068-8. | ||||
| 365 | Sulfotransferase 1E1 is a low km isoform mediating the 3-O-sulfation of ethinyl estradiol Drug Metab Dispos. 2004 Nov;32(11):1299-303. doi: 10.1124/dmd.32.11.. | ||||
| 366 | Absorption, metabolism, and excretion of etoricoxib, a potent and selective cyclooxygenase-2 inhibitor, in healthy male volunteers | ||||
| 367 | In vitro metabolism of exemestane by hepatic cytochrome P450s: impact of nonsynonymous polymorphisms on formation of the active metabolite 17beta-dihydroexemestane. Pharmacol Res Perspect. 2017 Apr 27;5(3):e00314. | ||||
| 368 | Inhibition of the aromatase enzyme by exemestane cysteine conjugates. Mol Pharmacol. 2022 Aug 11;102(5):216-22. doi: 10.1124/molpharm.122.000545. | ||||
| 369 | Influence of Glutathione-S-Transferase A1*B Allele on the Metabolism of the Aromatase Inhibitor, Exemestane, in Human Liver Cytosols and in Patients Treated With Exemestane. J Pharmacol Exp Ther. 2022 Sep;382(3):327-334. doi: 10.1124/jpet.122.001232. | ||||
| 370 | In vitro drug-drug interaction studies with febuxostat, a novel non-purine selective inhibitor of xanthine oxidase: plasma protein binding, identification of metabolic enzymes and cytochrome P450 inhibition. Xenobiotica. 2008 May;38(5):496-510. | ||||
| 371 | U. S. FDA Label -Fenfluramine | ||||
| 372 | Effects of CYP2D6 genotypes on age-related change of flecainide metabolism: involvement of CYP1A2-mediated metabolism. Br J Clin Pharmacol. 2009 Jul;68(1):89-96. | ||||
| 373 | (R)-, (S)-, and racemic fluoxetine N-demethylation by human cytochrome P450 enzymes. Drug Metab Dispos. 2000 Oct;28(10):1187-91. | ||||
| 374 | Simultaneous identification and quantitation of fluoxetine and its metabolite, norfluoxetine, in biological samples by GC-MS | ||||
| 375 | DrugBank(Pharmacology-Metabolism):Flutamide | ||||
| 376 | DrugBank(Pharmacology-Metabolism):Fluvoxamine | ||||
| 377 | DrugBank(Pharmacology-Metabolism)Fluvoxamine maleate | ||||
| 378 | DrugBank(Pharmacology-Metabolism)Frovatriptan | ||||
| 379 | DrugBank(Pharmacology-Metabolism):Guanabenz | ||||
| 380 | DrugBank(Pharmacology-Metabolism):Haloperidol decanoate | ||||
| 381 | DrugBank(Pharmacology-Metabolism):Hesperetin | ||||
| 382 | Role of cytochrome P450 activity in the fate of anticancer agents and in drug resistance: focus on tamoxifen, paclitaxel and imatinib metabolism | ||||
| 383 | Participation of CYP2C8 and CYP3A4 in the N-demethylation of imatinib in human hepatic microsomes | ||||
| 384 | In vitro biotransformation of imatinib by the tumor expressed CYP1A1 and CYP1B1 | ||||
| 385 | Eight inhibitory monoclonal antibodies define the role of individual P-450s in human liver microsomal diazepam, 7-ethoxycoumarin, and imipramine metabolism. Drug Metab Dispos. 1999 Jan;27(1):102-9. | ||||
| 386 | Imipramine metabolites in blood of patients during therapy and after overdose | ||||
| 387 | Deletion of the mouse Fmo1 gene results in enhanced pharmacological behavioural responses to imipramine | ||||
| 388 | Roles of UGT, P450, and Gut Microbiota in the Metabolism of Epacadostat in Humans | ||||
| 389 | In vitro metabolism of indiplon and an assessment of its drug interaction potential | ||||
| 390 | In vitro metabolism of leflunomide by mouse and human liver microsomes Drug Metab Lett. 2007 Dec;1(4):299-305. doi: 10.2174/187231207783221402. | ||||
| 391 | In vitro metabolism studies on the isoxazole ring scission in the anti-inflammatory agent lefluonomide to its active alpha-cyanoenol metabolite A771726: mechanistic similarities with the cytochrome P450-catalyzed dehydration of aldoximes Drug Metab Dispos. 2003 Oct;31(10):1240-50. doi: 10.1124/dmd.31.10.1240. | ||||
| 392 | Clinical profile of levobupivacaine in regional anesthesia: A systematic review. J Anaesthesiol Clin Pharmacol. 2013 Oct;29(4):530-9. | ||||
| 393 | The Use and Method of Action of Intravenous Lidocaine and Its Metabolite in Headache Disorders Headache. 2018 May;58(5):783-789. doi: 10.1111/head.13298. | ||||
| 394 | Involvement of CYP1A2 and CYP3A4 in lidocaine N-deethylation and 3-hydroxylation in humans. Drug Metab Dispos. 2000 Aug;28(8):959-65. | ||||
| 395 | Methadone metabolism and drug-drug interactions: in vitro and in vivo literature review. J Pharm Sci. 2018 Dec;107(12):2983-2991. | ||||
| 396 | Effects of cytochrome P450 single nucleotide polymorphisms on methadone metabolism and pharmacodynamics | ||||
| 397 | Identification of novel metoclopramide metabolites in humans: in vitro and in vivo studies | ||||
| 398 | Involvement of CYP1A2 in mexiletine metabolism. Br J Clin Pharmacol. 1998 Jul;46(1):55-62. | ||||
| 399 | Clinical pharmacokinetics of mirtazapine | ||||
| 400 | Safety assessment, in vitro and in vivo, and pharmacokinetics of emivirine, a potent and selective nonnucleoside reverse transcriptase inhibitor of human immunodeficiency virus type 1. Antimicrob Agents Chemother. 2000 Jan;44(1):123-30. | ||||
| 401 | DrugBank(Pharmacology-Metabolism):Adagrasib | ||||
| 402 | Clinical pharmacokinetics of nabumetone. The dawn of selective cyclo-oxygenase-2 inhibition? | ||||
| 403 | Identification of human cytochrome P450 isozymes involved in the metabolism of naftopidil enantiomers in vitro. J Pharm Pharmacol. 2014 Nov;66(11):1534-51. | ||||
| 404 | Characterization of Ca(2+)-antagonistic effects of three metabolites of the new antihypertensive agent naftopidil, (naphthyl)hydroxy-naftopidil, (phenyl)hydroxy-naftopidil, and O-desmethyl-naftopidil J Cardiovasc Pharmacol. 1991 Dec;18(6):918-25. doi: 10.1097/00005344-199112000-00020. | ||||
| 405 | S-Naproxen and desmethylnaproxen glucuronidation by human liver microsomes and recombinant human UDP-glucuronosyltransferases (UGT): role of UGT2B7 in the elimination of naproxen. Br J Clin Pharmacol. 2005 Oct;60(4):423-33. | ||||
| 406 | [Pharmacokinetics of phenazone after bilateral ovariectomy in female rabbits] | ||||
| 407 | Absorption, disposition, metabolic fate, and elimination of the dopamine agonist rotigotine in man: administration by intravenous infusion or transdermal delivery | ||||
| 408 | Inhibitory effects of nicardipine to cytochrome P450 (CYP) in human liver microsomes. Biol Pharm Bull. 2005 May;28(5):882-5. | ||||
| 409 | Metabolism of the anthelmintic drug niclosamide by cytochrome P450 enzymes and UDP-glucuronosyltransferases: metabolite elucidation and main contributions from CYP1A2 and UGT1A1 Xenobiotica. 2016;46(1):1-13. doi: 10.3109/00498254.2015.1047812. | ||||
| 410 | Neutrophil- and myeloperoxidase-mediated metabolism of reduced nimesulide: evidence for bioactivation Chem Res Toxicol. 2010 Nov 15;23(11):1691-700. doi: 10.1021/tx1001496. | ||||
| 411 | Activation of 3-nitrobenzanthrone and its metabolites by human acetyltransferases, sulfotransferases and cytochrome P450 expressed in Chinese hamster V79 cells | ||||
| 412 | Quantitative Modeling Analysis Demonstrates the Impact of CYP2C19 and CYP2D6 Genetic Polymorphisms on the Pharmacokinetics of Amitriptyline and Its Metabolite, Nortriptyline J Clin Pharmacol. 2019 Apr;59(4):532-540. doi: 10.1002/jcph.1344. | ||||
| 413 | DrugBank(Pharmacology-Metabolism)Nortriptyline hydrochloride | ||||
| 414 | Role of cytochrome P450 isoenzymes in metabolism of O(6)-benzylguanine: implications for dacarbazine activation. Clin Cancer Res. 2001 Dec;7(12):4239-44. | ||||
| 415 | Olanzapine. Pharmacokinetic and pharmacodynamic profile. Clin Pharmacokinet. 1999 Sep;37(3):177-93. | ||||
| 416 | The Unique Human N10-Glucuronidated Metabolite Formation from Olanzapine in Chimeric NOG-TKm30 Mice with Humanized Livers. Drug Metab Dispos. 2023 Apr;51(4):480-491. doi: 10.1124/dmd.122.001102. | ||||
| 417 | Identification of novel ondansetron metabolites using LC/MS(n) and NMR J Chromatogr B Analyt Technol Biomed Life Sci. 2018 Sep 15;1095:138-141. doi: 10.1016/j.jchromb.2018.07.013. | ||||
| 418 | Polymorphisms in the CYP1A2 gene and theophylline metabolism in patients with asthma Clin Pharmacol Ther. 2003 May;73(5):468-74. doi: 10.1016/s0009-9236(03)00013-4. | ||||
| 419 | Identification of cytochrome P450 isoforms involved in the metabolism of paroxetine and estimation of their importance for human paroxetine metabolism using a population-based simulator. Drug Metab Dispos. 2010 Mar;38(3):376-85. | ||||
| 420 | Pazopanib: the newest tyrosine kinase inhibitor for the treatment of advanced or metastatic renal cell carcinoma. Drugs. 2011 Mar 5;71(4):443-54. | ||||
| 421 | Bioavailability, metabolism and disposition of oral pazopanib in patients with advanced cancer Xenobiotica. 2013 May;43(5):443-53. doi: 10.3109/00498254.2012.734642. | ||||
| 422 | Metabolism of lisofylline and pentoxifylline in human liver microsomes and cytosol Drug Metab Dispos. 1996 Nov;24(11):1174-9. | ||||
| 423 | Role of CYP1A2 and CYP2E1 in the pentoxifylline ciprofloxacin drug interaction Biochem Pharmacol. 2004 Jul 15;68(2):395-402. doi: 10.1016/j.bcp.2004.03.035. | ||||
| 424 | The metabolism of the piperazine-type phenothiazine neuroleptic perazine by the human cytochrome P-450 isoenzymes. Eur Neuropsychopharmacol. 2004 May;14(3):199-208. | ||||
| 425 | Anti-Parkinson's disease drugs and pharmacogenetic considerations Expert Opin Drug Metab Toxicol. 2013 Jul;9(7):859-74. doi: 10.1517/17425255.2013.789018. | ||||
| 426 | DrugBank(Pharmacology-Metabolism)Phenacetin | ||||
| 427 | The Respective Roles of CYP3A4 and CYP2D6 in the Metabolism of Pimozide to Established and Novel Metabolites Drug Metab Dispos. 2020 Nov;48(11):1113-1120. doi: 10.1124/dmd.120.000188. | ||||
| 428 | Pharmacokinetic evaluation of tissue distribution of pirfenidone and its metabolites for idiopathic pulmonary fibrosis therapy Biopharm Drug Dispos. 2015 May;36(4):205-15. doi: 10.1002/bdd.1932. | ||||
| 429 | Pharmacokinetic and pharmacometabolomic study of pirfenidone in normal mouse tissues using high mass resolution MALDI-FTICR-mass spectrometry imaging Histochem Cell Biol. 2016 Feb;145(2):201-11. doi: 10.1007/s00418-015-1382-7. | ||||
| 430 | Pharmacokinetics and metabolism of intravenous pirfenidone in sheep Biopharm Drug Dispos. 2008 Mar;29(2):119-26. doi: 10.1002/bdd.595. | ||||
| 431 | Absorption, metabolism and excretion of [14C]pomalidomide in humans following oral administration Cancer Chemother Pharmacol. 2013 Feb;71(2):489-501. doi: 10.1007/s00280-012-2040-6. | ||||
| 432 | Pomalidomide: evaluation of cytochrome P450 and transporter-mediated drug-drug interaction potential in vitro and in healthy subjects. J Clin Pharmacol. 2015 Feb;55(2):168-78. | ||||
| 433 | Metabolic profiles of pomalidomide in human plasma simulated with pharmacokinetic data in control and humanized-liver mice Xenobiotica. 2017 Oct;47(10):844-848. doi: 10.1080/00498254.2016.1247218. | ||||
| 434 | In vitro and in vivo human metabolism and pharmacokinetics of S- and R-praziquantel Pharmacol Res Perspect. 2020 Aug;8(4):e00618. doi: 10.1002/prp2.618. | ||||
| 435 | Biotransformation of praziquantel by human cytochrome p450 3A4 (CYP 3A4). Acta Pol Pharm. 2006 Sep-Oct;63(5):381-5. | ||||
| 436 | Tumour cytochrome P450 and drug activation. Curr Pharm Des. 2002;8(15):1335-47. | ||||
| 437 | Plasma kinetics of procarbazine and azo-procarbazine in humans Anticancer Drugs. 2006 Jan;17(1):75-80. doi: 10.1097/01.cad.0000181591.85476.aa. | ||||
| 438 | Progesterone and testosterone hydroxylation by cytochromes P450 2C19, 2C9, and 3A4 in human liver microsomes. Arch Biochem Biophys. 1997 Oct 1;346(1):161-9. | ||||
| 439 | Effect of selective serotonin reuptake inhibitors on the oxidative metabolism of propafenone: in vitro studies using human liver microsomes. J Clin Psychopharmacol. 2000 Aug;20(4):428-34. | ||||
| 440 | Rapid and simultaneous extraction of propranolol, its neutral and basic metabolites from plasma and assay by high-performance liquid chromatography J Chromatogr. 1985 Oct 11;343(2):349-58. doi: 10.1016/s0378-4347(00)84603-4. | ||||
| 441 | CYP450 phenotyping and metabolite identification of quinine by accurate mass UPLC-MS analysis: a possible metabolic link to blackwater fever | ||||
| 442 | Management of postoperative nausea and vomiting: focus on palonosetron | ||||
| 443 | Oxidation of ranitidine by isozymes of flavin-containing monooxygenase and cytochrome P450. Jpn J Pharmacol. 2000 Oct;84(2):213-20. | ||||
| 444 | Pharmacokinetic interaction study between flavanones (hesperetin, naringenin) and rasagiline mesylate in wistar rats | ||||
| 445 | A Single-center, Open-label, Parallel Control Study Comparing the Pharmacokinetics and Safety of a Single Oral Dose of Roflumilast and Its Active Metabolite Roflumilast N-oxide in Healthy Chinese and Caucasian Volunteers | ||||
| 446 | Disposition of ropinirole in animals and man | ||||
| 447 | Isolation and identification of major urinary metabolites of rifabutin in rats and humans | ||||
| 448 | Lack of metabolic racemisation of ropivacaine, determined by liquid chromatography using a chiral AGP column | ||||
| 449 | Metabolism and excretion of ropivacaine in humans | ||||
| 450 | Regional transport and metabolism of ropivacaine and its CYP3A4 metabolite PPX in human intestine. J Pharm Pharmacol. 2003 Jul;55(7):963-72. | ||||
| 451 | Effect of propofol on ropivacaine metabolism in human liver microsomes | ||||
| 452 | Evaluation of absorption, distribution, metabolism, and excretion of [(14)C]-rucaparib, a poly(ADP-ribose) polymerase inhibitor, in patients with advanced solid tumors Invest New Drugs. 2020 Jun;38(3):765-775. doi: 10.1007/s10637-019-00815-2. | ||||
| 453 | Pharmacokinetics and safety of rucaparib in patients with advanced solid tumors and hepatic impairment. Cancer Chemother Pharmacol. 2021 Aug;88(2):259-270. doi: 10.1007/s00280-021-04278-2. | ||||
| 454 | A Phase 1 Study to Evaluate Absolute Bioavailability and Absorption, Distribution, Metabolism, and Excretion of Savolitinib in Healthy Male Volunteers | ||||
| 455 | Interaction of sorafenib and cytochrome P450 isoenzymes in patients with advanced melanoma: a phase I/II pharmacokinetic interaction study. Cancer Chemother Pharmacol. 2011 Nov;68(5):1111-8. | ||||
| 456 | Pharmacokinetics of stiripentol in normal man: evidence of nonlinearity | ||||
| 457 | Pharmacokinetics, distribution, and metabolism of [14C]sunitinib in rats, monkeys, and humans | ||||
| 458 | Cytochromes P450 1A2 and 3A4 Catalyze the Metabolic Activation of Sunitinib | ||||
| 459 | Metabolism of tamoxifen by recombinant human cytochrome P450 enzymes: formation of the 4-hydroxy, 4'-hydroxy and N-desmethyl metabolites and isomerization of trans-4-hydroxytamoxifen. Drug Metab Dispos. 2002 Aug;30(8):869-74. | ||||
| 460 | Metabolism and transport of tamoxifen in relation to its effectiveness: new perspectives on an ongoing controversy. Future Oncol. 2014 Jan;10(1):107-22. | ||||
| 461 | Identification and biological activity of tamoxifen metabolites in human serum Biochem Pharmacol. 1983 Jul 1;32(13):2045-52. doi: 10.1016/0006-2952(83)90425-2. | ||||
| 462 | PharmGKB summary: tamoxifen pathway, pharmacokinetics Pharmacogenet Genomics. 2013 Nov;23(11):643-7. doi: 10.1097/FPC.0b013e3283656bc1. | ||||
| 463 | A multi-residue chiral liquid chromatography coupled with tandem mass spectrometry method for analysis of antifungal agents and their metabolites in aqueous environmental matrices. Anal Methods. 2021 Jun 14;13(22):2466-2477. doi: 10.1039/d1ay00556a. | ||||
| 464 | Theophylline metabolism in human liver microsomes: inhibition studies. J Pharmacol Exp Ther. 1996 Mar;276(3):912-7. | ||||
| 465 | Bifunctional cytosolic UDP-glucose 4-epimerases catalyse the interconversion between UDP-D-xylose and UDP-L-arabinose in plants | ||||
| 466 | New metabolites of thiabendazole and the metabolism of thiabendazole by mouse embryo in vivo and in vitro | ||||
| 467 | Metabolism of ophthalmic timolol: new aspects of an old drug. Basic Clin Pharmacol Toxicol. 2011 May;108(5):297-303. | ||||
| 468 | DrugBank(Pharmacology-Metabolism):Tizanidine hydrochloride | ||||
| 469 | Total determination of triclabendazole and its metabolites in bovine tissues using liquid chromatography-tandem mass spectrometry J Chromatogr B Analyt Technol Biomed Life Sci. 2019 Mar 1;1109:54-59. doi: 10.1016/j.jchromb.2019.01.021. | ||||
| 470 | Egaten FDA label | ||||
| 471 | Pharmacokinetics, toxicological and clinical aspects of ulipristal acetate: insights into the mechanisms implicated in the hepatic toxicity Drug Metab Rev. 2021 Aug;53(3):375-383. doi: 10.1080/03602532.2021.1917599. | ||||
| 472 | Comparative pharmacokinetics of vitamin K antagonists: warfarin, phenprocoumon and acenocoumarol. Clin Pharmacokinet. 2005;44(12):1227-46. | ||||
| 473 | Indolealkylamines: biotransformations and potential drug-drug interactions | ||||
| 474 | Determination of the human cytochrome P450 isoforms involved in the metabolism of zolmitriptan. Xenobiotica. 1999 Aug;29(8):847-57. | ||||
| 475 | Zolpidem urine excretion profiles and cross-reactivity with ELISA(?) kits in subjects using Zolpidem or Ambien(?) CR as a prescription sleep aid | ||||
| 476 | Norzotepine, a major metabolite of zotepine, exerts atypical antipsychotic-like and antidepressant-like actions through its potent inhibition of norepinephrine reuptake | ||||
If you find any error in data or bug in web service, please kindly report it to Dr. Yin and Dr. Li.

