

Details of Drug-Metabolizing Enzyme (DME)
| Full List of Drug(s) Metabolized by This DME | |||||
|---|---|---|---|---|---|
| Drugs Approved by FDA | Click to Show/Hide the Full List of Drugs: 228 Drugs | ||||
Thalidomide |
Drug Info | Approved | Breast cancer | ICD11: 2C60 | [1] |
Cobicistat |
Drug Info | Approved | Human immunodeficiency virus infection | ICD11: 1C60 | [2] |
Tamoxifen citrate |
Drug Info | Approved | Breast cancer | ICD11: 2C60 | [3] |
Yn-968D1 |
Drug Info | Approved | Breast cancer | ICD11: 2C60-2C6Y | [4] |
Erlotinib hydrochloride |
Drug Info | Approved | Lung cancer | ICD11: 2C25 | [5] |
Estradiol acetate |
Drug Info | Approved | Acquired prion disease | ICD11: 8E01 | [6] |
Estradiol cypionate |
Drug Info | Approved | Acquired prion disease | ICD11: 8E01 | [7] |
Estradiol valerate |
Drug Info | Approved | Acquired prion disease | ICD11: 8E01 | [8] |
Estrone |
Drug Info | Approved | Menopausal disorder | ICD11: GA30 | [9] |
Atazanavir |
Drug Info | Approved | Human immunodeficiency virus infection | ICD11: 1C60 | [10] |
Cocaine |
Drug Info | Approved | Anaesthesia | ICD11: 8E22 | [11] |
Pimavanserin |
Drug Info | Approved | Parkinsonism | ICD11: 8A00 | [12] |
Ozanimod |
Drug Info | Approved | Multiple sclerosis | ICD11: 8A40 | [13] |
Daclatasvir dihydrochloride |
Drug Info | Approved | Viral hepatitis | ICD11: 1E51 | [14] |
Delavirdine mesylate |
Drug Info | Approved | Human immunodeficiency virus infection | ICD11: 1C60 | [8] |
Prednisolone |
Drug Info | Approved | Multiple myeloma | ICD11: 2A83 | [15] |
Amlodipine besylate |
Drug Info | Approved | Essential hypertension | ICD11: BA00 | [16] |
Ibrutinib |
Drug Info | Approved | Mantle cell lymphoma | ICD11: 2A85 | [17] |
Loxoprofen gel |
Drug Info | Approved | Inflammation | ICD11: 1A00-CA43 | [18] |
Montelukast sodium |
Drug Info | Approved | Asthma | ICD11: CA23 | [19], [20] |
Montelukast sodium |
Drug Info | Approved | Asthma | ICD11: CA23 | [20] |
Progesterone |
Drug Info | Approved | Premature labour | ICD11: JB00 | [21] |
Acalabrutinib |
Drug Info | Approved | Mantle cell lymphoma | ICD11: 2A85 | [22] |
Crizotinib |
Drug Info | Approved | Lung cancer | ICD11: 2C25 | [23] |
Imatinib mesylate |
Drug Info | Approved | Chronic myelogenous leukaemia | ICD11: 2A20 | [24] |
Lidocaine |
Drug Info | Approved | Anaesthesia | ICD11: 8E22 | [8] |
Metronidazole |
Drug Info | Approved | Amebiasis | ICD11: 1A36 | [25] |
Temsirolimus |
Drug Info | Approved | Renal cell carcinoma | ICD11: 2C90 | [8] |
Cannabidiol |
Drug Info | Approved | Lennox-Gastaut syndrome | ICD11: 8A62 | [26] |
Ciclosporin |
Drug Info | Approved | Viral hepatitis | ICD11: 1E51 | [27] |
Ciclosporin |
Drug Info | Approved | Viral hepatitis | ICD11: 1E51 | [28] |
Doravirine |
Drug Info | Approved | Human immunodeficiency virus infection | ICD11: 1C60 | [29] |
Ethinyl estradiol |
Drug Info | Approved | Menopausal disorder | ICD11: GA30 | [30] |
Ifosfamide |
Drug Info | Approved | Lung cancer | ICD11: 2C25 | [31] |
Lapatinib ditosylate |
Drug Info | Approved | Breast cancer | ICD11: 2C60 | [5] |
Mycophenolate mofetil |
Drug Info | Approved | Crohn disease | ICD11: DD70 | [32] |
Sunitinib malate |
Drug Info | Approved | Renal cell carcinoma | ICD11: 2C90 | [8] |
Sunitinib malate |
Drug Info | Approved | Renal cell carcinoma | ICD11: 2C90 | [33] |
Tacrolimus |
Drug Info | Approved | Ulcerative colitis | ICD11: DD71 | [34] |
Tretinoin |
Drug Info | Approved | Acne vulgaris | ICD11: ED80 | [35] |
Valproic acid |
Drug Info | Approved | Epilepsy | ICD11: 8A60 | [19] |
Cabazitaxel |
Drug Info | Approved | Breast cancer | ICD11: 2C60 | [36] |
Disulfiram |
Drug Info | Approved | Alcohol dependence | ICD11: 6C40 | [37] |
Enzalutamide |
Drug Info | Approved | Prostate cancer | ICD11: 2C82 | [38] |
Oxycodone hydrochloride |
Drug Info | Approved | Anaesthesia | ICD11: 8E22 | [39] |
Pravastatin |
Drug Info | Approved | Dyslipidaemia | ICD11: 5C81 | [40] |
Rivaroxaban |
Drug Info | Approved | Deep vein thrombosis | ICD11: BD71 | [41] |
Sirolimus |
Drug Info | Approved | Lymphangioleiomyomatosis | ICD11: CB07 | [8] |
Apomorphine |
Drug Info | Approved | Parkinsonism | ICD11: 8A00 | [42] |
Beclomethasone dipropionate |
Drug Info | Approved | Allergic rhinitis | ICD11: CA08 | [43], [44] |
Beclomethasone dipropionate |
Drug Info | Approved | Allergic rhinitis | ICD11: CA08 | [45] |
Clomiphene citrate |
Drug Info | Approved | Female infertility | ICD11: GA31 | [46] |
Deoxycholic acid |
Drug Info | Approved | Obesity | ICD11: 5B81 | [47] |
Hydrocortisone |
Drug Info | Approved | Uncontrolled gout | ICD11: FA25 | [48] |
Indinavir sulfate |
Drug Info | Approved | Human immunodeficiency virus infection | ICD11: 1C60 | [49] |
Osimertinib |
Drug Info | Approved | Lung cancer | ICD11: 2C25 | [50] |
Perampanel |
Drug Info | Approved | Focal seizure | ICD11: 8A68 | [51] |
Ponesimod |
Drug Info | Approved | Multiple sclerosis | ICD11: 8A40 | [52] |
Ponesimod |
Drug Info | Approved | Multiple sclerosis | ICD11: 8A40 | [53] |
Quinine sulfate |
Drug Info | Approved | Malaria | ICD11: 1F40 | [8] |
Telithromycin |
Drug Info | Approved | Bronchitis | ICD11: CA20 | [54] |
Teniposide |
Drug Info | Approved | Acute lymphoblastic leukemia | ICD11: 2B33 | [55] |
Ticagrelor |
Drug Info | Approved | Cerebral stroke | ICD11: 8B11 | [56], [57] |
Tucatinib |
Drug Info | Approved | HER2-positive breast cancer | ICD11: 2C60-2C6Y | [58] |
Alfentanil |
Drug Info | Approved | Anaesthesia | ICD11: 8E22 | [59] |
Arteether |
Drug Info | Approved | Malaria | ICD11: 1F40-1F45 | [60] |
Axitinib |
Drug Info | Approved | Renal cell carcinoma | ICD11: 2C90 | [61] |
Cisapride |
Drug Info | Approved | Gastro-oesophageal reflux disease | ICD11: DA22 | [62] |
Dextromethorphan hydrobromide |
Drug Info | Approved | Atherosclerosis | ICD11: BA80 | [63] |
Diazepam |
Drug Info | Approved | Epilepsy | ICD11: 8A60 | [64] |
Diphenylpyraline |
Drug Info | Approved | Allergy | ICD11: 4A80 | [65] |
Finasteride |
Drug Info | Approved | Prostatic hyperplasia | ICD11: GA90 | [8] |
Flutamide |
Drug Info | Approved | Prostate cancer | ICD11: 2C82 | [66] |
Haloperidol decanoate |
Drug Info | Approved | Agitation/aggression | ICD11: 6D86 | [67] |
Lansoprazole |
Drug Info | Approved | Duodenal ulcer | ICD11: DA63 | [68] |
Lasofoxifene |
Drug Info | Approved | Osteoporosis | ICD11: FB83 | [69] |
Lasofoxifene |
Drug Info | Approved | Osteoporosis | ICD11: FB83 | [70] |
Levonorgestrel |
Drug Info | Approved | Menorrhagia | ICD11: GA20 | [71] |
Nateglinide |
Drug Info | Approved | Diabetes mellitus | ICD11: 5A10 | [8] |
Nevirapine |
Drug Info | Approved | Human immunodeficiency virus infection | ICD11: 1C60 | [19] |
Norethindrone acetate |
Drug Info | Approved | Menorrhagia | ICD11: GA20 | [72] |
Ondansetron |
Drug Info | Approved | Gastritis | ICD11: DA42 | [73] |
Propranolol hydrochloride |
Drug Info | Approved | Migraine | ICD11: 8A80 | [74] |
Trazodone hydrochloride |
Drug Info | Approved | Depression | ICD11: 6A71 | [8] |
Verapamil hydrochloride |
Drug Info | Approved | Essential hypertension | ICD11: BA00 | [75] |
Amitriptyline hydrochloride |
Drug Info | Approved | Depression | ICD11: 6A71 | [76] |
Amprenavir |
Drug Info | Approved | Human immunodeficiency virus infection | ICD11: 1C60 | [77] |
Artemether |
Drug Info | Approved | Malaria | ICD11: 1F40 | [78] |
Bromfenac |
Drug Info | Approved | Cataract | ICD11: 9B10 | [79] |
Buspirone |
Drug Info | Approved | Anxiety disorder | ICD11: 6B00 | [80] |
Carbamazepine |
Drug Info | Approved | Epilepsy | ICD11: 8A60 | [81] |
Cenobamate |
Drug Info | Approved | Focal seizure | ICD11: 8A68 | [82] |
Cortisone acetate |
Drug Info | Approved | Prostate cancer | ICD11: 2C82 | [83] |
Dasatinib |
Drug Info | Approved | Chronic myelogenous leukaemia | ICD11: 2A20 | [5] |
Diltiazem hydrochloride |
Drug Info | Approved | Essential hypertension | ICD11: BA00 | [84] |
Doxorubicin |
Drug Info | Approved | Breast cancer | ICD11: 2C60 | [85] |
Dronedarone hydrochloride |
Drug Info | Approved | Atrial fibrillation | ICD11: BC81 | [86] |
Fluoxetine hydrochloride |
Drug Info | Approved | Depression | ICD11: 6A71 | [87] |
Fluvastatin sodium |
Drug Info | Approved | Hypertriglyceridaemia | ICD11: 5C80 | [88] |
Istradefylline |
Drug Info | Approved | Parkinsonism | ICD11: 8A00 | [89] |
Ivermectin |
Drug Info | Approved | Onchocerciasis | ICD11: 1F6A | [90] |
Letermovir |
Drug Info | Approved | Cytomegalovirus infection | ICD11: 1D82 | [91] |
Midazolam hydrochloride |
Drug Info | Approved | Anxiety disorder | ICD11: 6B00 | [92] |
Phenytoin |
Drug Info | Approved | Epilepsy | ICD11: 8A60 | [93] |
Rilpivirine hydrochloride |
Drug Info | Approved | Human immunodeficiency virus infection | ICD11: 1C60 | [94] |
Simvastatin |
Drug Info | Approved | Dyslipidaemia | ICD11: 5C81 | [95] |
Simvastatin |
Drug Info | Approved | Dyslipidaemia | ICD11: 5C81 | [96] |
Vismodegib |
Drug Info | Approved | Melanoma | ICD11: 2C30 | [97], [98], [99] |
Zolpidem tartrate |
Drug Info | Approved | Insomnia | ICD11: 7A00 | [100] |
Anastrozole |
Drug Info | Approved | Breast cancer | ICD11: 2C60 | [101] |
Argatroban |
Drug Info | Approved | Thrombosis | ICD11: DB61 | [102] |
Atorvastatin calcium |
Drug Info | Approved | Dyslipidaemia | ICD11: 5C81 | [103] |
Azelastine |
Drug Info | Approved | Allergic rhinitis | ICD11: CA08 | [104] |
Buprenorphine hydrochloride |
Drug Info | Approved | Anaesthesia | ICD11: 8E22 | [105] |
Clarithromycin |
Drug Info | Approved | Pneumocystis pneumonia | ICD11: CA40 | [8] |
Clofazimine |
Drug Info | Approved | Crohn disease | ICD11: DD70 | [106] |
Clonidine |
Drug Info | Approved | Essential hypertension | ICD11: BA00 | [107] |
Doxapram hydrochloride |
Drug Info | Approved | Chronic obstructive pulmonary disease | ICD11: CA22 | [108] |
Fentanyl citrate |
Drug Info | Approved | Anaesthesia | ICD11: 8E22 | [109] |
Loxapine succinate |
Drug Info | Approved | Schizophrenia | ICD11: 6A20 | [110] |
Lurbinectedin |
Drug Info | Approved | Lung cancer | ICD11: 2C25 | [111] |
Mifepristone |
Drug Info | Approved | Cushing syndrome | ICD11: 5A70 | [112] |
Nalmefene |
Drug Info | Approved | Opiate dependence | ICD11: 6C43 | [113] |
Nisoldipine |
Drug Info | Approved | Essential hypertension | ICD11: BA00 | [8] |
Omeprazole |
Drug Info | Approved | Gastro-oesophageal reflux disease | ICD11: DA22 | [114] |
Oxycodone |
Drug Info | Approved | Pain | ICD11: MG30-MG3Z | [115] |
Paroxetine hydrochloride |
Drug Info | Approved | Depression | ICD11: 6A71 | [116] |
Pimozide |
Drug Info | Approved | Schizophrenia | ICD11: 6A20 | [8] |
Ponatinib hydrochloride |
Drug Info | Approved | Acute lymphoblastic leukemia | ICD11: 2B33 | [117] |
Prochlorperazine |
Drug Info | Approved | Functional nausea/vomiting | ICD11: DD90 | [118] |
Quetiapine fumarate |
Drug Info | Approved | Schizophrenia | ICD11: 6A20 | [119] |
Ritonavir |
Drug Info | Approved | Human immunodeficiency virus infection | ICD11: 1C60 | [8] |
Saquinavir mesylate |
Drug Info | Approved | Human immunodeficiency virus infection | ICD11: 1C60 | [120] |
Sulfasalazine |
Drug Info | Approved | Rheumatoid arthritis | ICD11: FA20 | [121] |
Testosterone undecanoate |
Drug Info | Approved | Hypogonadism | ICD11: 5A61 | [92] |
Triazolam |
Drug Info | Approved | Insomnia | ICD11: 7A00 | [92] |
Vortioxetine hydrobromide |
Drug Info | Approved | Depression | ICD11: 6A71 | [122] |
Acetaminophen |
Drug Info | Approved | Anaesthesia | ICD11: 8E22 | [123] |
Alprazolam |
Drug Info | Approved | Anxiety disorder | ICD11: 6B00 | [124] |
Apixaban |
Drug Info | Approved | Deep vein thrombosis | ICD11: BD71 | [125] |
Aripiprazole lauroxil |
Drug Info | Approved | Schizophrenia | ICD11: 6A20 | [8] |
Avapritinib |
Drug Info | Approved | Gastrointestinal stromal tumour | ICD11: 2B5B | [126] |
Chlorpheniramine |
Drug Info | Approved | Allergic rhinitis | ICD11: CA08 | [8] |
Clonazepam |
Drug Info | Approved | Epilepsy | ICD11: 8A60 | [127] |
Docetaxel |
Drug Info | Approved | Breast cancer | ICD11: 2C60 | [8] |
Dutasteride |
Drug Info | Approved | Prostatic hyperplasia | ICD11: GA90 | [128] |
Dutasteride |
Drug Info | Approved | Prostatic hyperplasia | ICD11: GA90 | [129] |
Etoposide |
Drug Info | Approved | Lung cancer | ICD11: 2C25 | [130] |
Gefitinib |
Drug Info | Approved | Lung cancer | ICD11: 2C25 | [131] |
Iloperidone |
Drug Info | Approved | Schizophrenia | ICD11: 6A20 | [132] |
Irinotecan hydrochloride |
Drug Info | Approved | Colon cancer | ICD11: 2B90 | [133] |
Lenvatinib |
Drug Info | Approved | Thyroid cancer | ICD11: 2D10 | [134] |
Levomethadyl acetate hydrochloride |
Drug Info | Approved | Opiate dependence | ICD11: 6C43 | [8] |
Losartan potassium |
Drug Info | Approved | Essential hypertension | ICD11: BA00 | [63] |
Lovastatin |
Drug Info | Approved | Hypertriglyceridaemia | ICD11: 5C80 | [135] |
Methadone |
Drug Info | Approved | Anaesthesia | ICD11: 8E22 | [136] |
Mycophenolic acid |
Drug Info | Approved | Crohn disease | ICD11: DD70 | [137], [138] |
Mycophenolic acid |
Drug Info | Approved | Crohn disease | ICD11: DD70 | [139] |
Nelfinavir mesylate |
Drug Info | Approved | Human immunodeficiency virus infection | ICD11: 1C60 | [120] |
Nimodipine |
Drug Info | Approved | Cerebral vasospasm | ICD11: BA85 | [140] |
Paclitaxel |
Drug Info | Approved | Ovarian cancer | ICD11: 2C73 | [8] |
Palonosetron hydrochloride |
Drug Info | Approved | Functional nausea/vomiting | ICD11: DD90 | [141] |
Phenelzine |
Drug Info | Approved | Depression | ICD11: 6A71 | [142] |
Phenobarbital |
Drug Info | Approved | Epilepsy | ICD11: 8A60 | [143] |
Riociguat |
Drug Info | Approved | Pulmonary hypertension | ICD11: BB01 | [144] |
Sorafenib |
Drug Info | Approved | Renal cell carcinoma | ICD11: 2C90 | [8] |
Voriconazole |
Drug Info | Approved | Candidiasis | ICD11: 1F23 | [145], [146] |
Zaleplon |
Drug Info | Approved | Insomnia | ICD11: 7A00 | [8] |
Ambrisentan |
Drug Info | Approved | Pulmonary hypertension | ICD11: BB01 | [147] |
Armodafinil |
Drug Info | Approved | Obstructive sleep apnea | ICD11: 7A41 | [148] |
Boceprevir |
Drug Info | Approved | Viral hepatitis | ICD11: 1E51 | [149] |
Cerivastatin sodium |
Drug Info | Approved | Hypertriglyceridaemia | ICD11: 5C80 | [8] |
Cilostazol |
Drug Info | Approved | Arteriosclerosis obliterans | ICD11: BD40 | [150] |
Clindamycin |
Drug Info | Approved | Acne vulgaris | ICD11: ED80 | [151] |
Clopidogrel bisulfate |
Drug Info | Approved | Acute coronary syndrome | ICD11: BA4Z | [152] |
Dapsone |
Drug Info | Approved | Pneumocystis pneumonia | ICD11: CA40 | [8] |
Eplerenone |
Drug Info | Approved | Ventricular dysfunction | ICD11: BD13 | [153] |
Granisetron hydrochloride |
Drug Info | Approved | Functional nausea/vomiting | ICD11: DD90 | [154] |
Isavuconazole |
Drug Info | Approved | Allergic bronchopulmonary aspergillosis | ICD11: CA82 | [155] |
Ivacaftor |
Drug Info | Approved | Cystic fibrosis | ICD11: CA25 | [156] |
Loratadine |
Drug Info | Approved | Allergic rhinitis | ICD11: CA08 | [157] |
Megestrol acetate |
Drug Info | Approved | Breast cancer | ICD11: 2C60 | [158] |
Mephenytoin |
Drug Info | Approved | Epilepsy | ICD11: 8A60 | [159] |
Nifedipine |
Drug Info | Approved | Angina pectoris | ICD11: BA40 | [92] |
Oxazepam |
Drug Info | Approved | Anxiety disorder | ICD11: 6B00 | [160] |
Paliperidone |
Drug Info | Approved | Bipolar disorder | ICD11: 6A60 | [161] |
Pentamidine isethionate |
Drug Info | Approved | Pneumocystis pneumonia | ICD11: CA40 | [162] |
Salmeterol xinafoate |
Drug Info | Approved | Asthma | ICD11: CA23 | [8] |
Secnidazole |
Drug Info | Approved | Amebiasis | ICD11: 1A36 | [163] |
Sildenafil citrate |
Drug Info | Approved | Erectile dysfunction | ICD11: HA01 | [164] |
Temazepam |
Drug Info | Approved | Insomnia | ICD11: 7A00 | [165] |
Voxelotor |
Drug Info | Approved | Sickle-cell anaemia | ICD11: 3A51 | [166] |
Zonisamide |
Drug Info | Approved | Epilepsy | ICD11: 8A60 | [167] |
Aztreonam |
Drug Info | Approved | Cystic fibrosis | ICD11: CA25 | [168] |
Bimatoprost |
Drug Info | Approved | Glaucoma | ICD11: 9C61 | [169] |
Chloroquine |
Drug Info | Approved | Malaria | ICD11: 1F40 | [170] |
Chloroquine |
Drug Info | Approved | Malaria | ICD11: 1F40 | [171] |
Erythromycin stearate |
Drug Info | Approved | Acute upper respiratory infection | ICD11: CA07 | [172] |
Felodipine |
Drug Info | Approved | Essential hypertension | ICD11: BA00 | [8] |
Fluticasone furoate |
Drug Info | Approved | Allergic rhinitis | ICD11: CA08 | [173] |
Fluticasone propionate |
Drug Info | Approved | Asthma | ICD11: CA23 | [174] |
Fluticasone propionate |
Drug Info | Approved | Asthma | ICD11: CA23 | [175] |
Halofantrine |
Drug Info | Approved | Malaria | ICD11: 1F40 | [176] |
Hydroxyprogesterone caproate |
Drug Info | Approved | Uterine cancer | ICD11: 2C76 | [177] |
Hydroxyzine |
Drug Info | Approved | Anxiety disorder | ICD11: 6B00 | [178] |
Isavuconazonium |
Drug Info | Approved | Allergic bronchopulmonary aspergillosis | ICD11: CA82 | [155] |
Lonafarnib |
Drug Info | Approved | Progeria | ICD11: LD2B | [179] |
Lorlatinib |
Drug Info | Approved | Lung cancer | ICD11: 2C25 | [180] |
Nortriptyline hydrochloride |
Drug Info | Approved | Depression | ICD11: 6A71 | [181] |
Oxybutynin chloride |
Drug Info | Approved | Overactive bladder | ICD11: GC50 | [182] |
Pimecrolimus |
Drug Info | Approved | Atopic dermatitis | ICD11: EA80 | [183] |
Praziquantel |
Drug Info | Approved | Schistosomiasis | ICD11: 1F86 | [184] |
Ripretinib |
Drug Info | Approved | Gastrointestinal stromal tumour | ICD11: 2B5B | [185] |
Risperidone |
Drug Info | Approved | Schizophrenia | ICD11: 6A20 | [161] |
Romidepsin |
Drug Info | Approved | Cutaneous T-cell lymphoma | ICD11: 2B01 | [186] |
Saxagliptin hydrochloride |
Drug Info | Approved | Diabetes mellitus | ICD11: 5A10 | [187] |
Tadalafil |
Drug Info | Approved | Erectile dysfunction | ICD11: HA01 | [188] |
Tenapanor |
Drug Info | Approved | Hyperphosphatemia | ICD11: 5C64 | [189] |
Testosterone cypionate |
Drug Info | Approved | Testosterone deficiency | ICD11: 5A81 | [92] |
Testosterone enanthate |
Drug Info | Approved | Testosterone deficiency | ICD11: 5A81 | [92] |
Triamcinolone diacetate |
Drug Info | Approved | Allergy | ICD11: 4A80 | [190] |
Vardenafil hydrochloride |
Drug Info | Approved | Erectile dysfunction | ICD11: HA01 | [164] |
Vinblastine sulfate |
Drug Info | Approved | Breast cancer | ICD11: 2C60 | [85] |
Vincristine sulfate |
Drug Info | Approved | Acute lymphoblastic leukemia | ICD11: 2B33 | [191] |
Zalcitabine |
Drug Info | Approved | Human immunodeficiency virus infection | ICD11: 1C60 | [192] |
Dexamethasone acetate |
Drug Info | Approved | Rheumatoid arthritis | ICD11: FA20 | [193] |
Guanfacine |
Drug Info | Phase 4 | Hepatocellular carcinoma | ICD11: 2C12 | [197] |
Ingrezza |
Drug Info | Phase 4 | Dyskinesia | ICD11: 8A02 | [201] |
| Drugs in Phase 4 Clinical Trial | Click to Show/Hide the Full List of Drugs: 11 Drugs | ||||
Ethinylestradiol propanesulfonate |
Drug Info | Phase 4 | Prostate cancer | ICD11: 2C82 | [194], [195] |
Glibenclamide |
Drug Info | Phase 4 | Diabetes mellitus | ICD11: 5A10 | [196] |
Vonoprazan |
Drug Info | Phase 4 | Gastro-oesophageal reflux disease | ICD11: DA22 | [198] |
Zotepine |
Drug Info | Phase 4 | Schizophrenia | ICD11: 6A20 | [199] |
Astemizole |
Drug Info | Phase 4 | Allergic rhinitis | ICD11: CA08 | [8] |
Terfenadine |
Drug Info | Phase 4 | Allergy | ICD11: 4A80 | [8] |
Chlorphenamine |
Drug Info | Phase 4 | Allergy | ICD11: 4A80 | [8] |
Benidipine |
Drug Info | Phase 4 | Diabetic nephropathy | ICD11: GB61 | [200] |
Rupatadine |
Drug Info | Phase 4 | Allergy | ICD11: 4A80 | [202] |
Beclabuvir |
Drug Info | Phase 4 | Viral hepatitis | ICD11: 1E51 | [203] |
Tegafur |
Drug Info | Phase 4 | Colon cancer | ICD11: 2B90 | [204] |
| Drugs in Phase 3 Clinical Trial | Click to Show/Hide the Full List of Drugs: 30 Drugs | ||||
E-3A |
Drug Info | Phase 3 | Turner syndrome | ICD11: LD50 | [8] |
Selumetinib |
Drug Info | Phase 3 | Neurofibromatosis | ICD11: LD2D | [205] |
EPIANDROSTERONE |
Drug Info | Phase 3 | Discovery agent | ICD: N.A. | [206] |
BMS-650032 |
Drug Info | Phase 3 | Viral hepatitis | ICD11: 1E51 | [207] |
Tivantinib |
Drug Info | Phase 3 | Solid tumour/cancer | ICD11: 2A00-2F9Z | [208] |
BPI-2009 |
Drug Info | Phase 3 | Lung cancer | ICD11: 2C25 | [209] |
KW-5338 |
Drug Info | Phase 3 | Gastroparesis | ICD11: DA41 | [8] |
NE-10064 |
Drug Info | Phase 3 | Cardiac arrhythmia | ICD11: BC65 | [210] |
NSC-122758 |
Drug Info | Phase 3 | Vitamin deficiency | ICD11: 5B55 | [35] |
NSC-122758 |
Drug Info | Phase 3 | Vitamin deficiency | ICD11: 5B55 | [35], [211] |
SCH-417690 |
Drug Info | Phase 3 | Human immunodeficiency virus infection | ICD11: 1C60 | [19] |
GW-1000 |
Drug Info | Phase 3 | Cerebral vasospasm | ICD11: BA85 | [26] |
MLN4924 |
Drug Info | Phase 3 | Myelodysplastic syndrome | ICD11: 2A37 | [212] |
AK-602 |
Drug Info | Phase 3 | Human immunodeficiency virus infection | ICD11: 1C60 | [213] |
TAK-875 |
Drug Info | Phase 3 | Diabetes mellitus | ICD11: 5A10 | [214] |
VX-661 |
Drug Info | Phase 3 | Cystic fibrosis | ICD11: CA25 | [215] |
ABT-773 |
Drug Info | Phase 3 | Pneumocystis pneumonia | ICD11: CA40 | [216] |
BRN-0077922 |
Drug Info | Phase 3 | Influenza virus infection | ICD11: 1E30 | [217] |
Hydroxychloroquine |
Drug Info | Phase 3 | Malaria | ICD11: 1F40-1F45 | [171] |
LY-450139 |
Drug Info | Phase 3 | Alzheimer disease | ICD11: 8A20 | [218] |
CR-2017 |
Drug Info | Phase 3 | Irritable bowel syndrome | ICD11: DD91 | [219] |
Fenfluramine |
Drug Info | Phase 3 | Dravet syndrome | ICD11: 8A61-8A6Z | [220] |
Imatinib |
Drug Info | Phase 3 | Mantle cell lymphoma | ICD11: 2A85 | [24] |
CQA 206-291 |
Drug Info | Phase 3 | Parkinsonism | ICD11: 8A00 | [221] |
DUP-996 |
Drug Info | Phase 3 | Cognitive impairment | ICD11: 6D71 | [222] |
Ganaxolone |
Drug Info | Phase 3 | Complex partial seizure | ICD11: 8A61-8A6Z | [223] |
RO-7-0207 |
Drug Info | Phase 3 | Colon cancer | ICD11: 2B90 | [224] |
Sildenafil |
Drug Info | Phase 3 | Erectile dysfunction | ICD11: HA00-HA01 | [188] |
Al3-818 |
Drug Info | Phase 3 | Leiomyosarcoma | ICD11: 2B58 | [225] |
Atorvastatin |
Drug Info | Phase 3 | Hypertriglyceridaemia | ICD11: 5C80 | [226] |
| Drugs in Phase 2 Clinical Trial | Click to Show/Hide the Full List of Drugs: 27 Drugs | ||||
Verapamil |
Drug Info | Phase 2/3 | Hypertension | ICD11: BA00-BA04 | [75] |
Pexacerfont |
Drug Info | Phase 2/3 | Anxiety disorder | ICD11: 6B00-6B0Z | [227] |
DA-8159 |
Drug Info | Phase 2/3 | Pulmonary hypertension | ICD11: BB01 | [228] |
Fexinidazole |
Drug Info | Phase 2/3 | Trypanosomiasis | ICD11: 1D51-1F53 | [229], [230] |
Fexinidazole |
Drug Info | Phase 2/3 | Trypanosomiasis | ICD11: 1D51-1F53 | [230] |
HOE-239 |
Drug Info | Phase 2/3 | Trypanosomiasis | ICD11: 1F51 | [230] |
Lilly-112531 |
Drug Info | Phase 2/3 | Diffuse large B-cell lymphoma | ICD11: 2A81 | [231] |
Leniolisib |
Drug Info | Phase 2 | Sjogren syndrome | ICD11: 4A43 | [232] |
ABT-450 |
Drug Info | Phase 2 | Hepatitis C virus infection | ICD11: 1E50-1E51 | [233], [234] |
Paritaprevir |
Drug Info | Phase 2 | Hepatitis C virus infection | ICD11: 1E50-1E51 | [234] |
PF-06463922 |
Drug Info | Phase 2 | Lung cancer | ICD11: 2C25 | [235] |
AZD-2014 |
Drug Info | Phase 2 | Brain cancer | ICD11: 2A00 | [236] |
CBL-0102 |
Drug Info | Phase 2 | Creutzfeldt-Jakob disease | ICD11: 8E02 | [237] |
AR-67 |
Drug Info | Phase 2 | Brain cancer | ICD11: 2A00 | [238] |
AZD2624 |
Drug Info | Phase 2 | Multiple sclerosis | ICD11: 8A40 | [239] |
EBP-994 |
Drug Info | Phase 2 | Progeria | ICD11: LD2B | [179] |
Telapristone |
Drug Info | Phase 2 | Endometriosis | ICD11: GA10 | [240] |
AZD-2327 |
Drug Info | Phase 2 | Anxiety disorder | ICD11: 6B00-6B0Z | [241] |
GS-5806 |
Drug Info | Phase 2 | Respiratory syncytial virus infection | ICD11: 1C80 | [242] |
MKC-442 |
Drug Info | Phase 2 | Human immunodeficiency virus infection | ICD11: 1C60 | [243] |
Nuplazid |
Drug Info | Phase 2 | Alzheimer disease | ICD11: 8A20 | [244] |
PF-04937319 |
Drug Info | Phase 2 | Type-2 diabetes | ICD11: 5A11 | [245] |
TAK-063 |
Drug Info | Phase 2 | Schizophrenia | ICD11: 6A20 | [246] |
TAK-272 |
Drug Info | Phase 2 | Type-2 diabetes | ICD11: 5A11 | [247] |
CC-220 |
Drug Info | Phase 2 | Sarcoidosis | ICD11: 4B20 | [248] |
Encequidar |
Drug Info | Phase 2 | Metastatic breast cancer | ICD11: 2C60-2C6Y | [249] |
SHR-1020 |
Drug Info | Phase 2 | Breast cancer | ICD11: 2C60 | [250] |
| Drugs in Phase 1 Clinical Trial | Click to Show/Hide the Full List of Drugs: 17 Drugs | ||||
CB-3304 |
Drug Info | Phase 1/2 | Chronic lymphocytic leukaemia | ICD11: 2A82 | [251] |
CC-223 |
Drug Info | Phase 1/2 | Lung cancer | ICD11: 2C25 | [252] |
TMC-120 |
Drug Info | Phase 1/2 | Human immunodeficiency virus infection | ICD11: 1C60 | [253] |
TJN-324 |
Drug Info | Phase 1/2 | Essential hypertension | ICD11: BA00 | [8] |
STX 64 |
Drug Info | Phase 1 | Prostate cancer | ICD11: 2C82 | [254] |
AST-1306 |
Drug Info | Phase 1 | Solid tumour/cancer | ICD11: 2A00-2F9Z | [255] |
BE-14348A |
Drug Info | Phase 1 | Viral hepatitis | ICD11: 1E51 | [256] |
H3B-6545 |
Drug Info | Phase 1 | Breast cancer | ICD11: 2C60 | [257] |
PPI-2458 |
Drug Info | Phase 1 | Diabetes mellitus | ICD11: 5A10 | [258] |
Alvespimycin hydrochloride |
Drug Info | Phase 1 | Ovarian cancer | ICD11: 2C73 | [259] |
Benzoylphenylurea |
Drug Info | Phase 1 | Solid tumour/cancer | ICD11: 2A00-2F9Z | [260], [261] |
DA-1229 |
Drug Info | Phase 1 | Type-2 diabetes | ICD11: 5A11 | [262] |
BRN-3224996 |
Drug Info | Phase 1 | Allergy | ICD11: 4A80 | [48] |
CBT-1 |
Drug Info | Phase 1 | Histiocytic sarcoma | ICD11: 2B31 | [263] |
H3B-6527 |
Drug Info | Phase 1 | Hepatocellular carcinoma | ICD11: 2C12 | [264] |
BRN-0498823 |
Drug Info | Phase 1 | Essential hypertension | ICD11: BA00 | [8] |
ITX-5061 |
Drug Info | Phase 1 | Human immunodeficiency virus infection | ICD11: 1C60 | [265] |
| Discontinued/withdrawn Drugs | Click to Show/Hide the Full List of Drugs: 5 Drugs | ||||
AZD0328 |
Drug Info | Discontinued in Phase 2 | Alzheimer disease | ICD11: 8A20 | [266] |
Perillyl alcohol |
Drug Info | Discontinued in Phase 2 | Solid tumour/cancer | ICD11: 2A00-2F9Z | [267] |
ABT-107 |
Drug Info | Discontinued in Phase 1 | Attention deficit hyperactivity disorder | ICD11: 6A05 | [268] |
CJ-11974 |
Drug Info | Discontinued | Irritable bowel syndrome | ICD11: DD91 | [269] |
Octopamine |
Drug Info | Discontinued | Thrombosis | ICD11: DB61 | [109] |
| Preclinical/investigative Agents | Click to Show/Hide the Full List of Drugs: 3 Drugs | ||||
Cis-4-hydroxytamoxifen |
Drug Info | Investigative | Discovery agent | ICD: N.A. | [270] |
Paraoxon |
Drug Info | Investigative | Discovery agent | ICD: N.A. | [271] |
Erythromycin salnacedin |
Drug Info | Investigative | Discovery agent | ICD: N.A. | [172] |
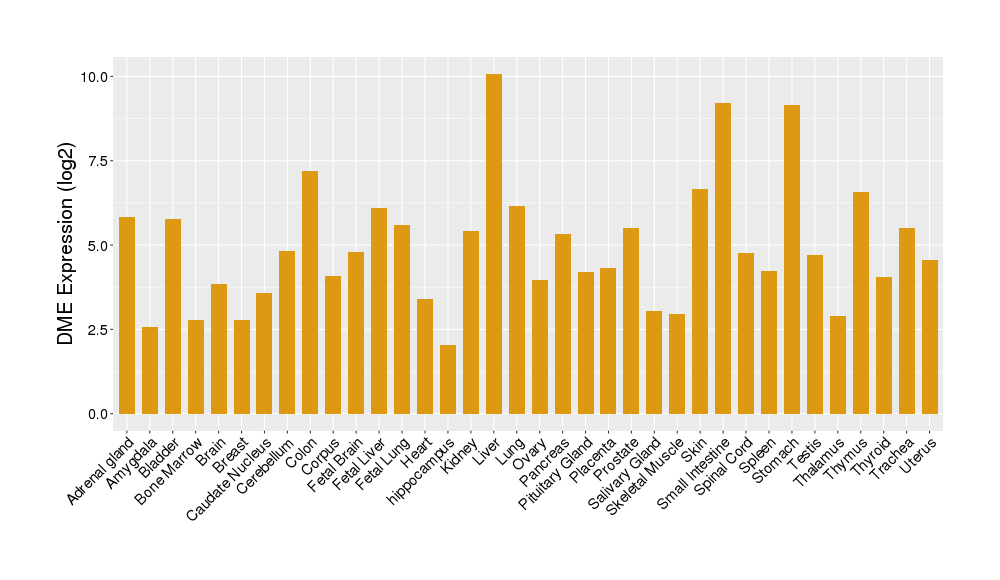
| Tissue/Disease-Specific Protein Abundances of This DME | |||||
|---|---|---|---|---|---|
| Tissue-specific Protein Abundances in Healthy Individuals | Click to Show/Hide | ||||
|
|||||
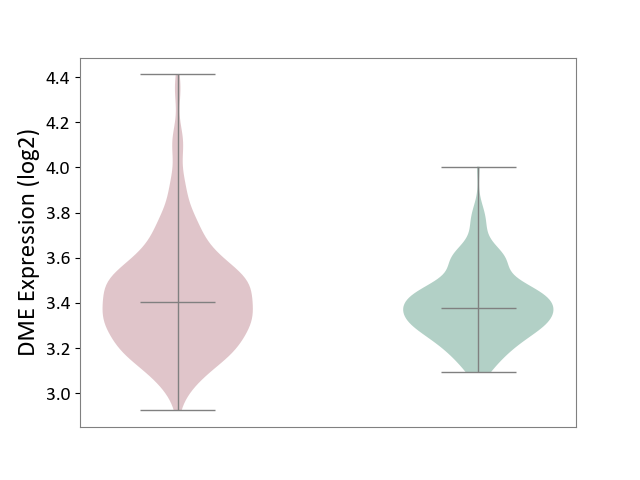
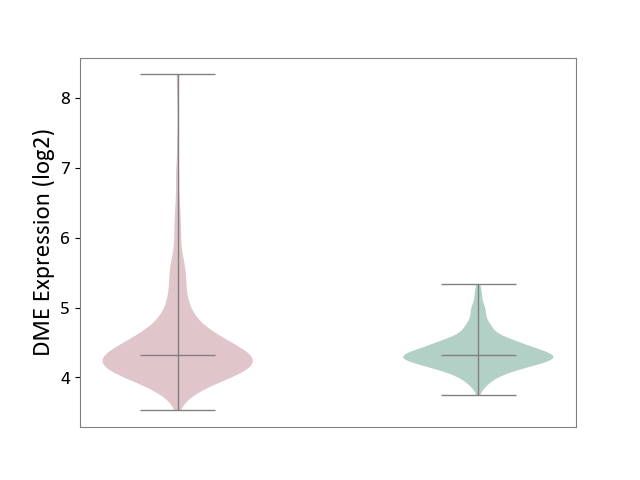
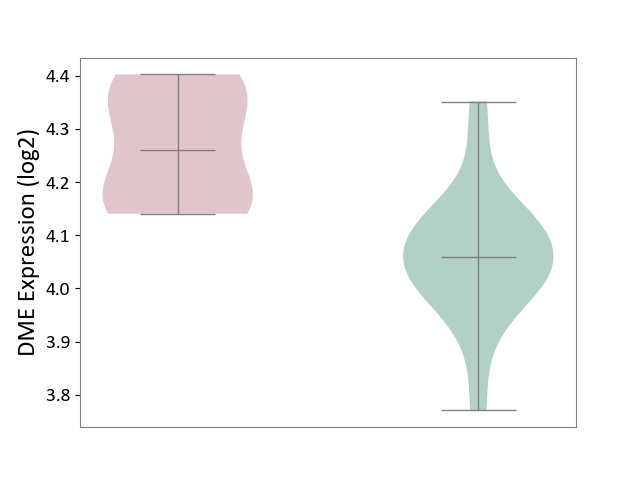
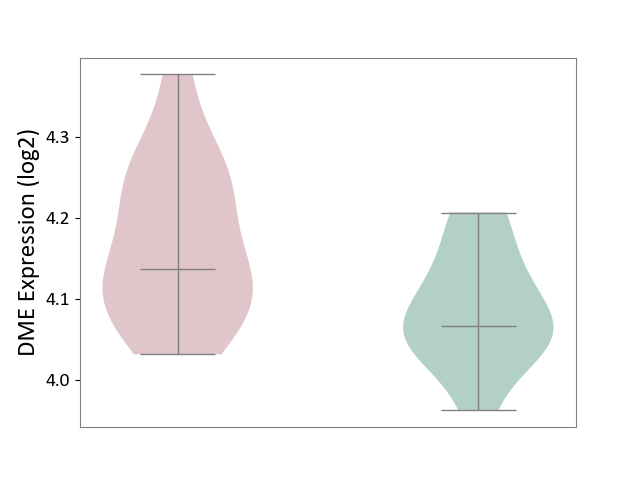
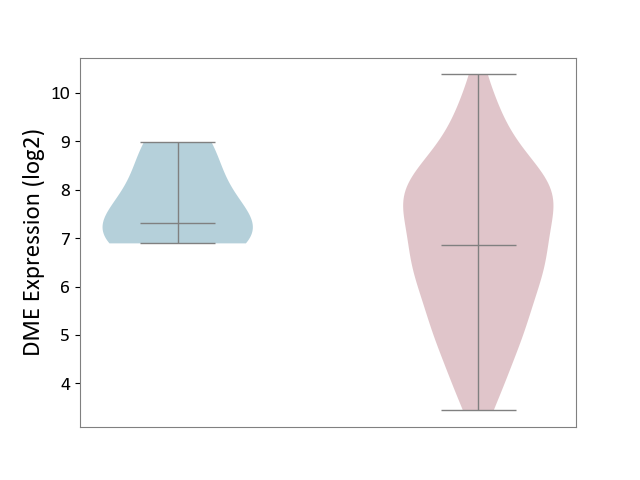
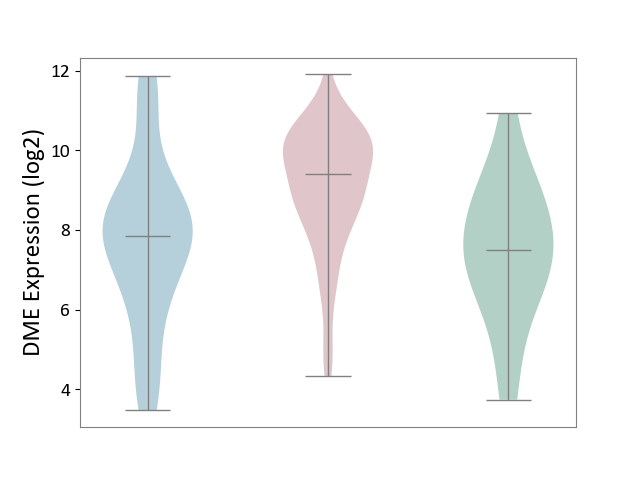
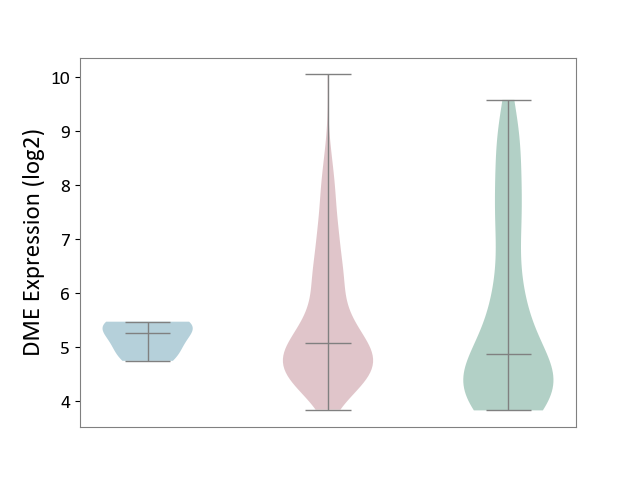
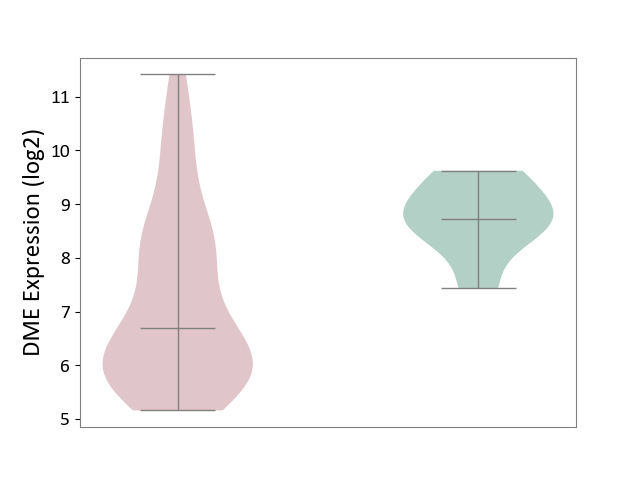
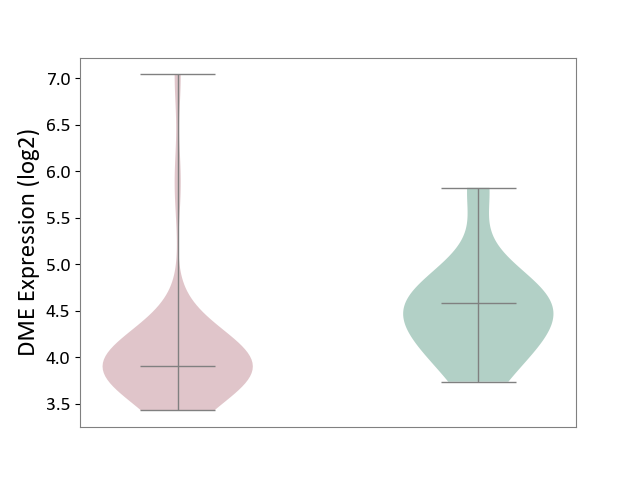
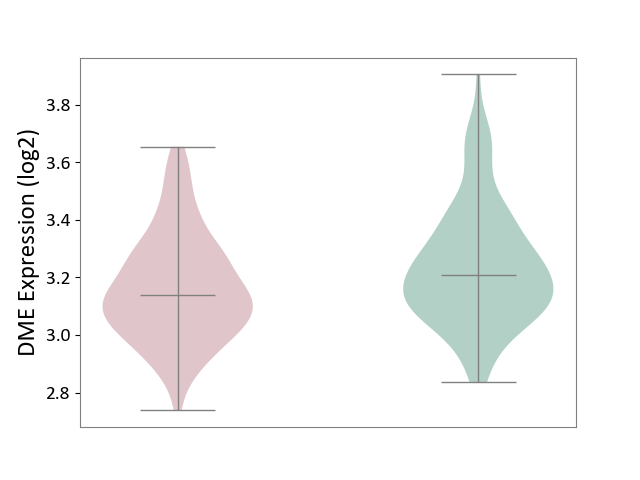
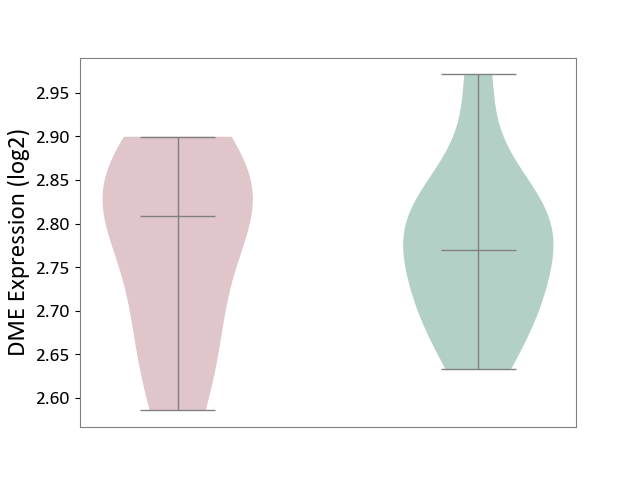
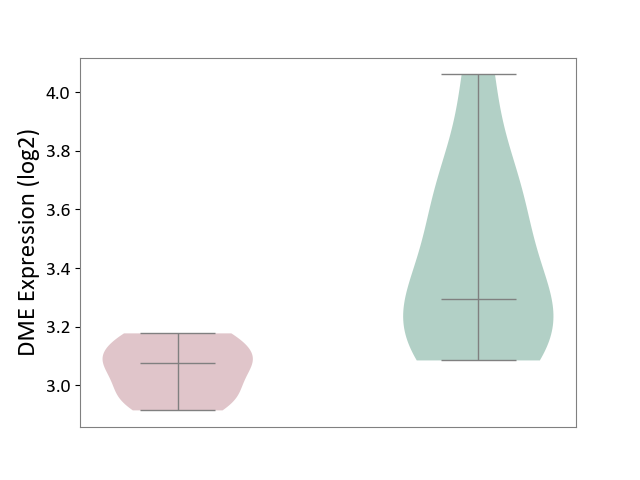
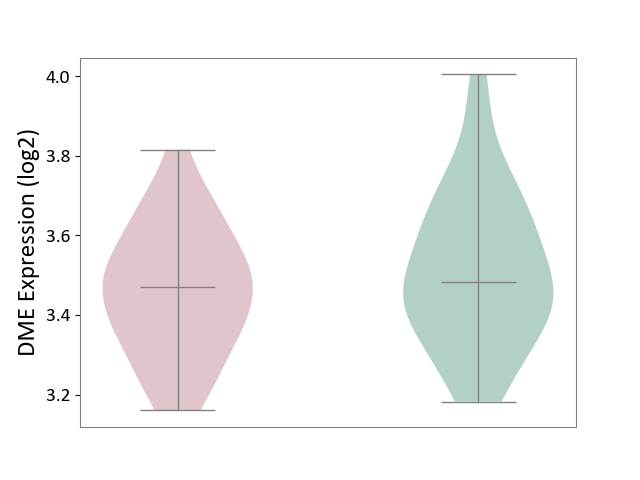
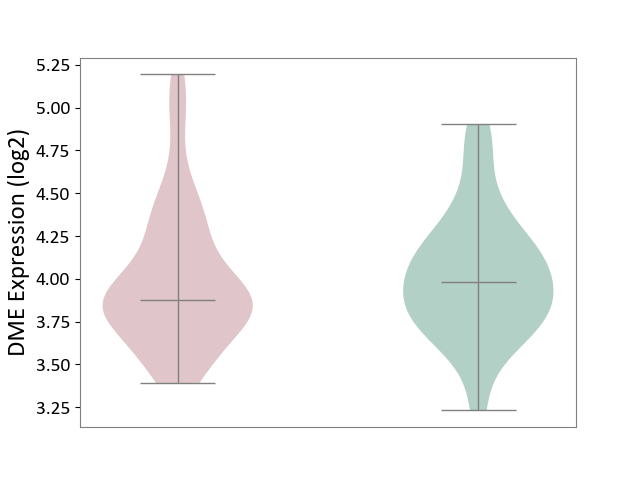
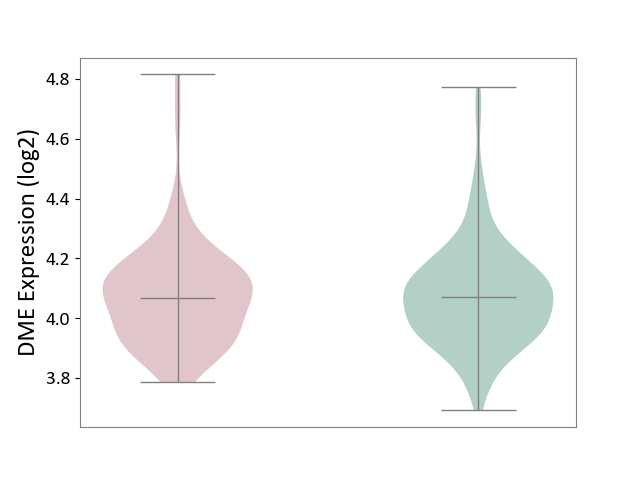
| ICD Disease Classification 01 | Infectious/parasitic disease | Click to Show/Hide | |||
| ICD-11: 1C1H | Necrotising ulcerative gingivitis | Click to Show/Hide | |||
| The Studied Tissue | Gingival tissue | ||||
| The Specified Disease | Bacterial infection of gingival [ICD-11:1C1H] | ||||
| The Expression Level of Disease Section Compare with the Healthy Individual Tissue | p-value: 1.41E-16; Fold-change: -1.05E+00; Z-score: -1.39E+00 | ||||
|
DME expression in the diseased tissue of patients
DME expression in the normal tissue of healthy individuals
|
|||||
| Violin Diagram of DME Disease-specific Protein Abundances |
|
Click to View the Clearer Original Diagram | |||
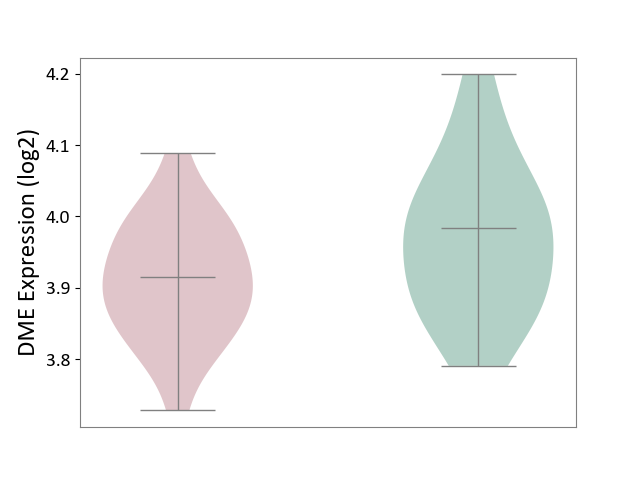
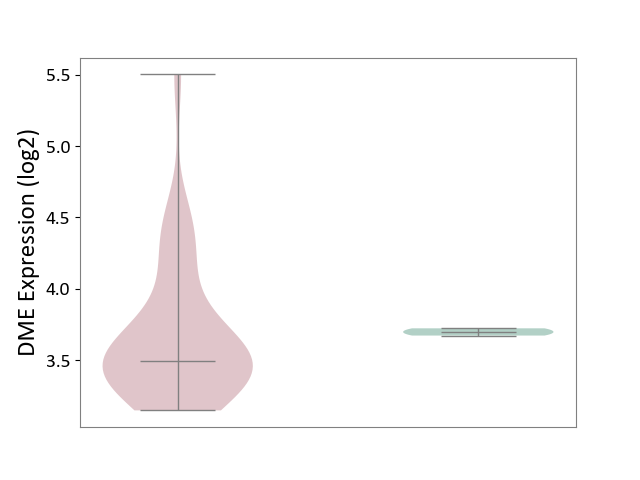
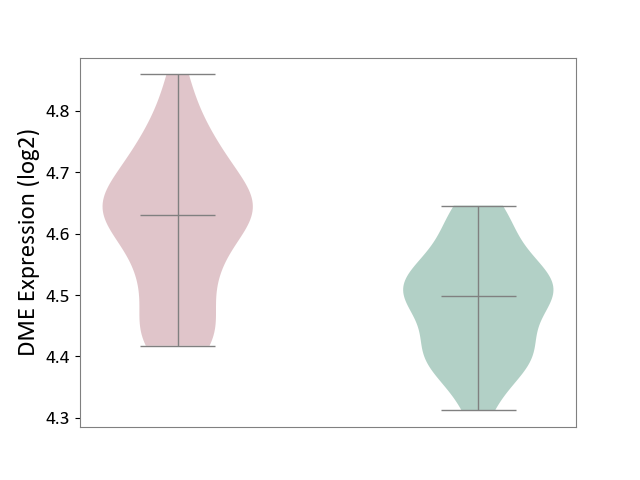
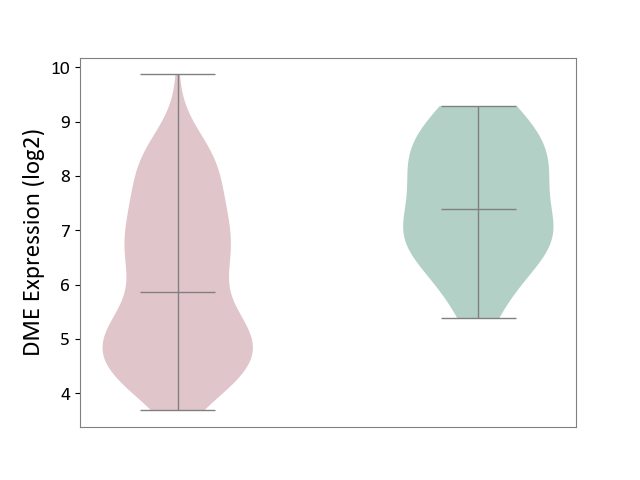
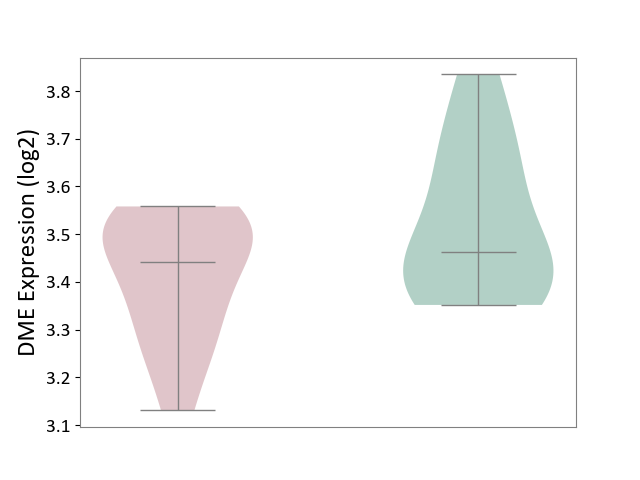
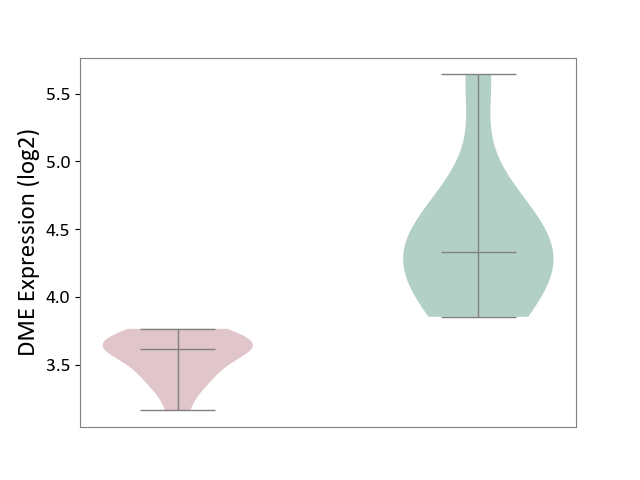
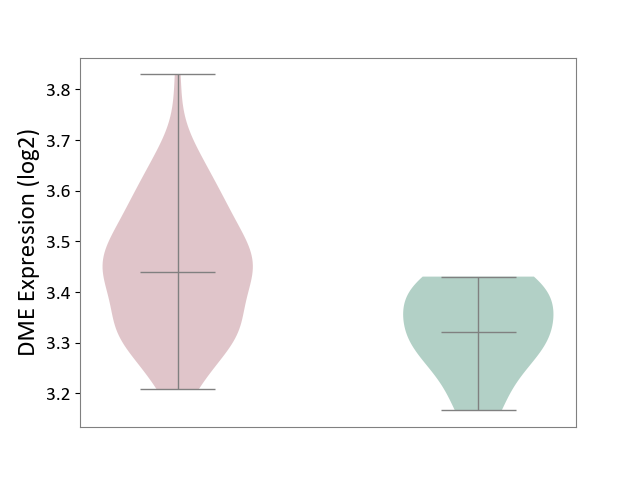
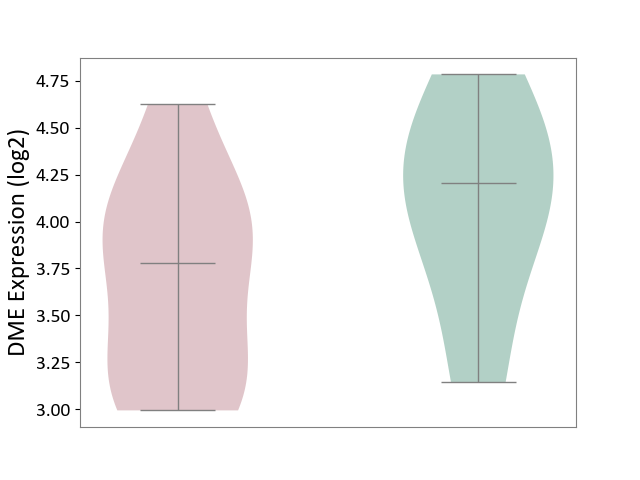
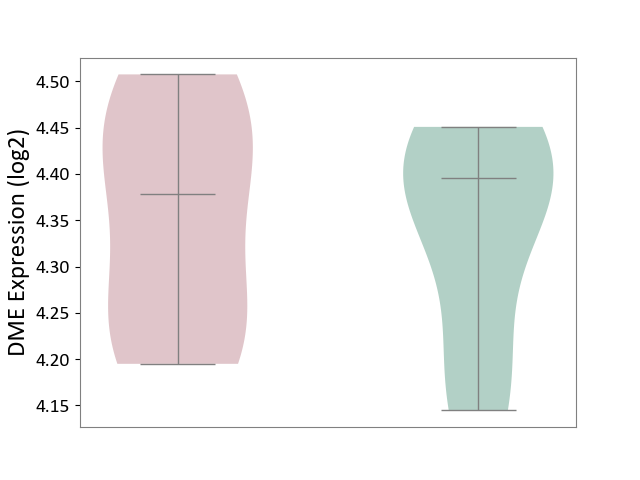
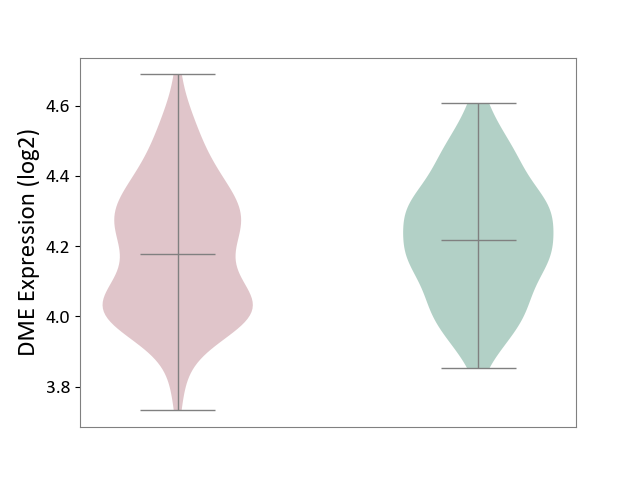
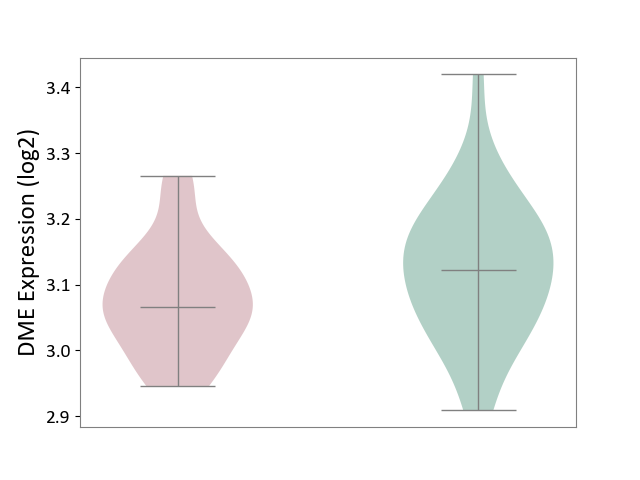
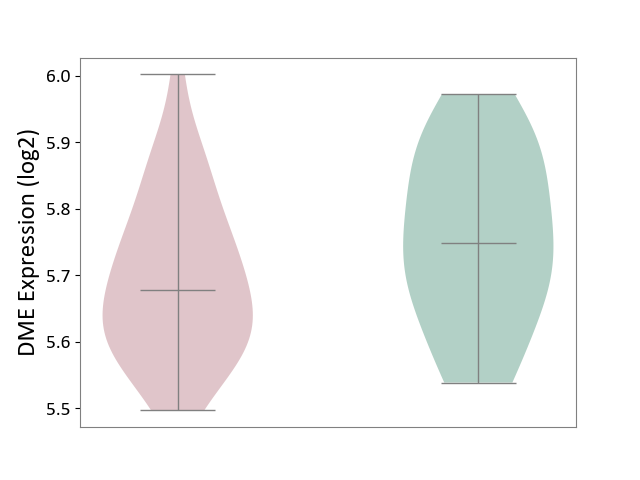
| ICD-11: 1E30 | Influenza | Click to Show/Hide | |||
| The Studied Tissue | Whole blood | ||||
| The Specified Disease | Influenza [ICD-11:1E30] | ||||
| The Expression Level of Disease Section Compare with the Healthy Individual Tissue | p-value: 3.55E-02; Fold-change: -8.41E-01; Z-score: -2.76E+00 | ||||
|
DME expression in the diseased tissue of patients
DME expression in the normal tissue of healthy individuals
|
|||||
| Violin Diagram of DME Disease-specific Protein Abundances |
|
Click to View the Clearer Original Diagram | |||
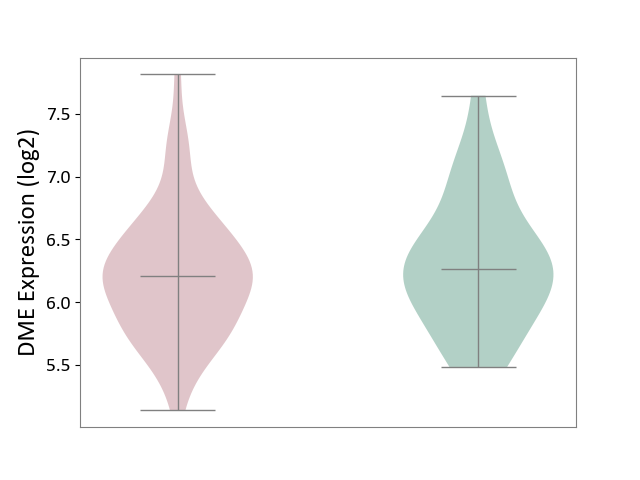
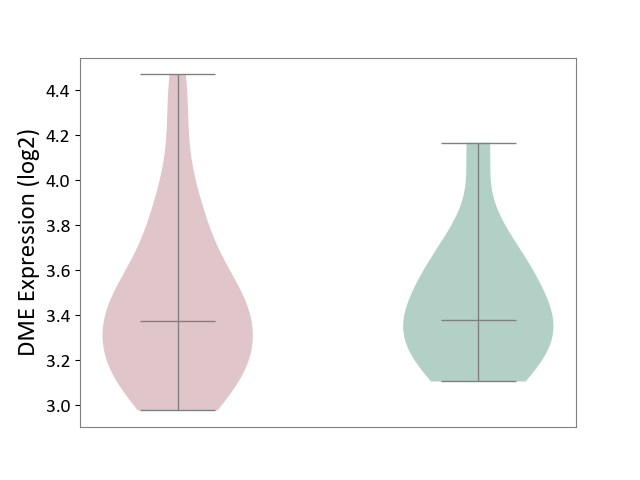
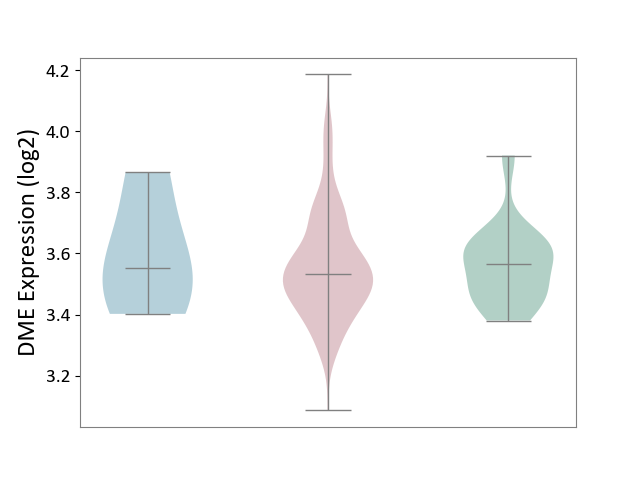
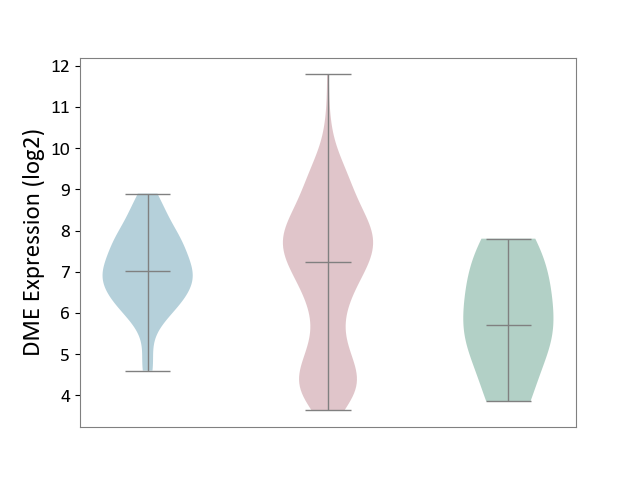
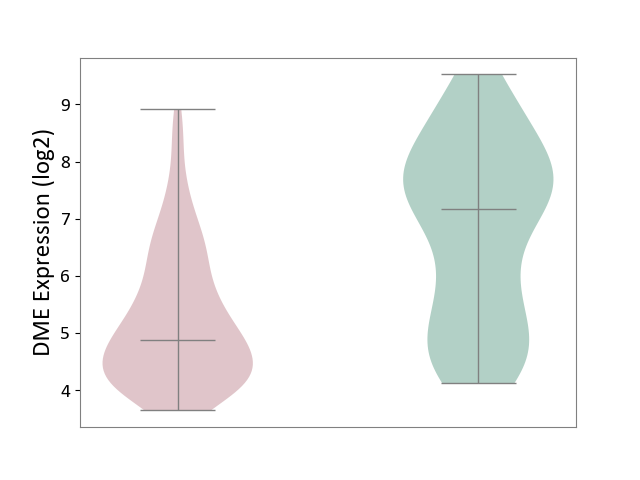
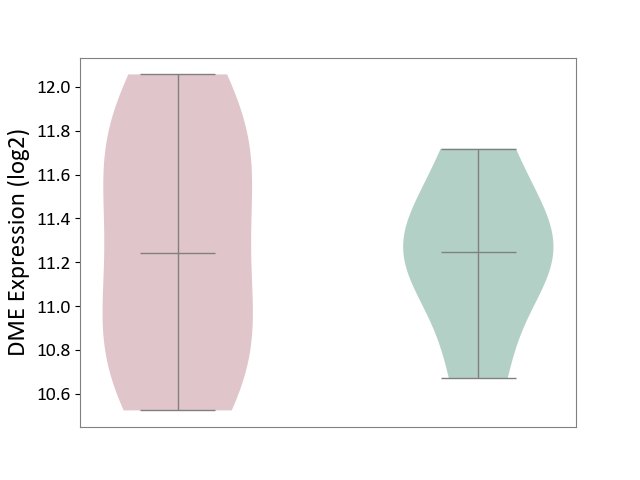
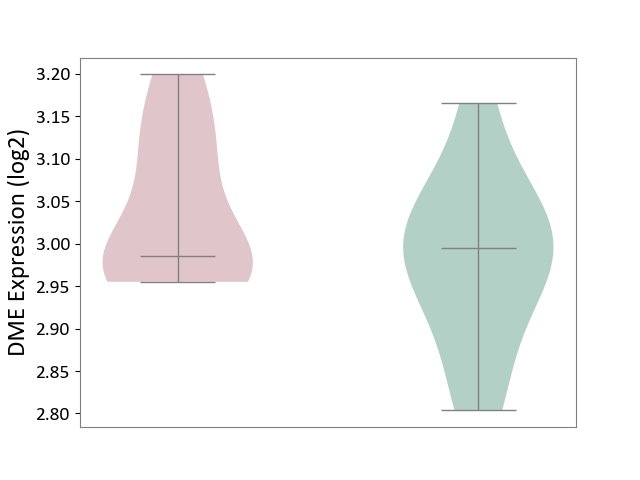
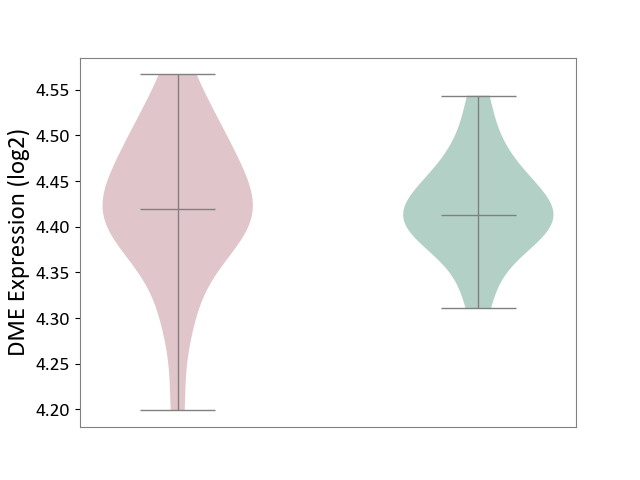
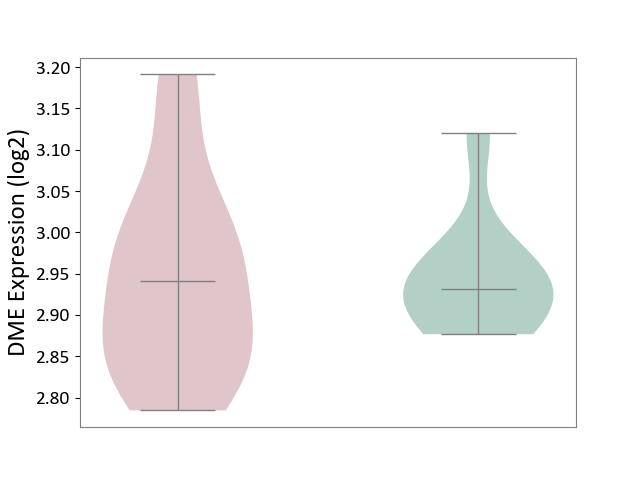
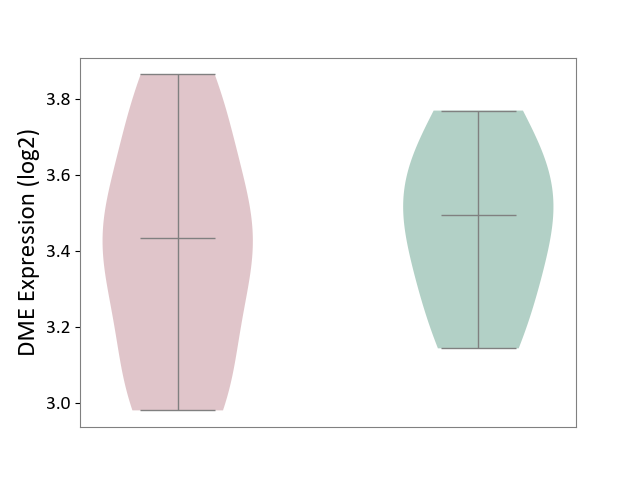
| ICD-11: 1E51 | Chronic viral hepatitis | Click to Show/Hide | |||
| The Studied Tissue | Whole blood | ||||
| The Specified Disease | Chronic hepatitis C [ICD-11:1E51.1] | ||||
| The Expression Level of Disease Section Compare with the Healthy Individual Tissue | p-value: 9.32E-01; Fold-change: 5.45E-02; Z-score: 3.88E-01 | ||||
|
DME expression in the diseased tissue of patients
DME expression in the normal tissue of healthy individuals
|
|||||
| Violin Diagram of DME Disease-specific Protein Abundances |
|
Click to View the Clearer Original Diagram | |||
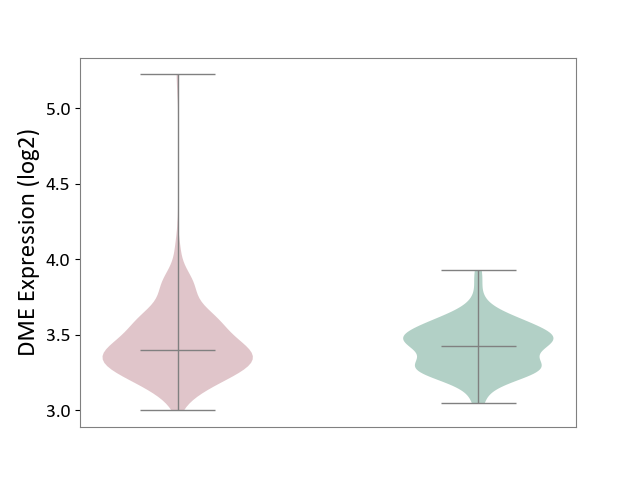
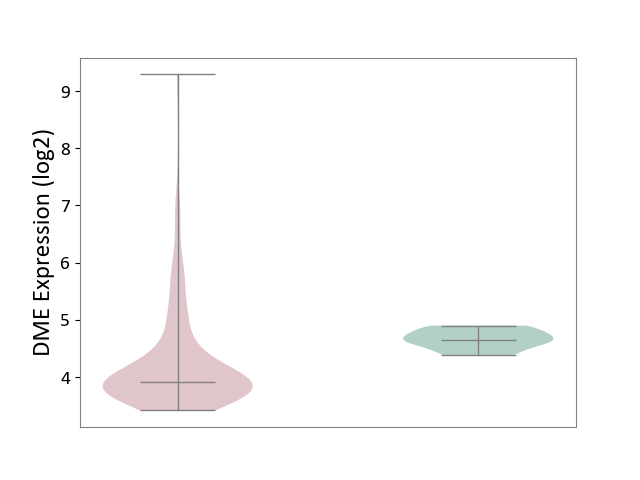
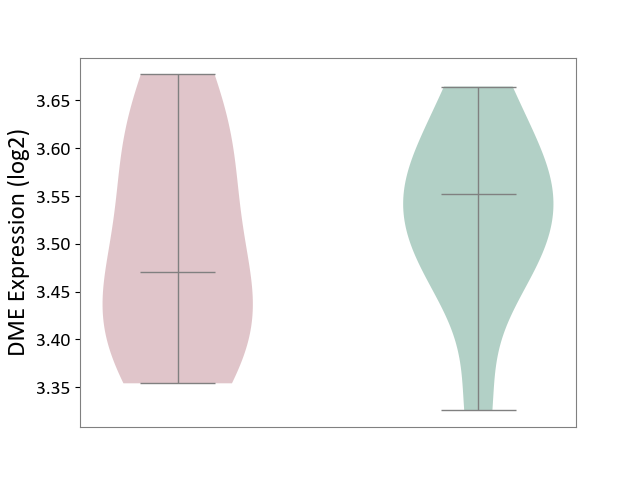
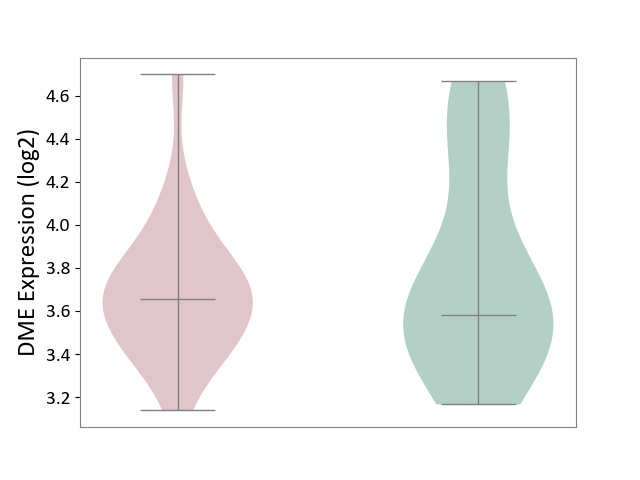
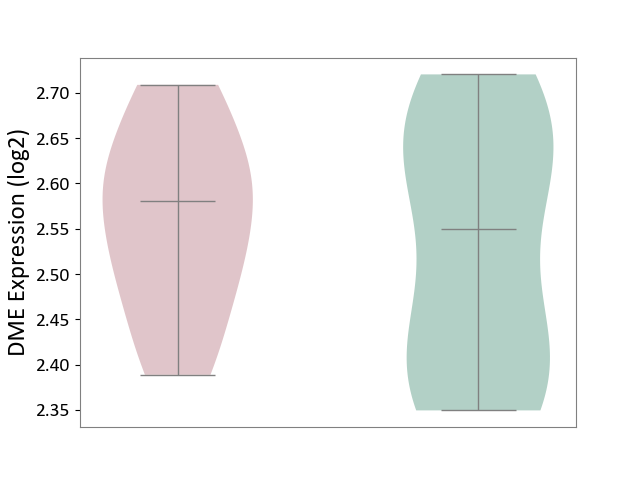
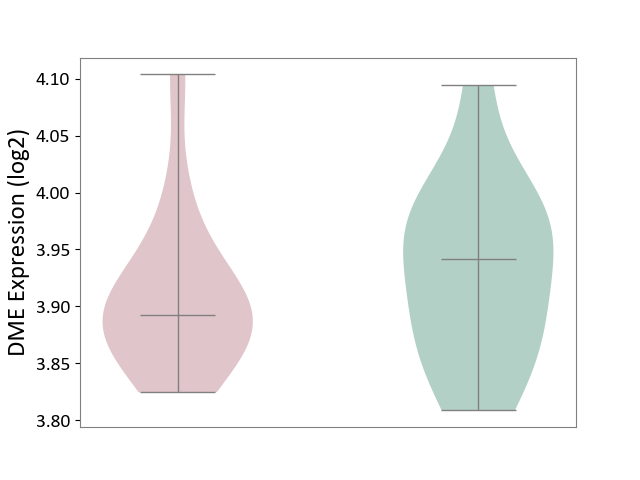
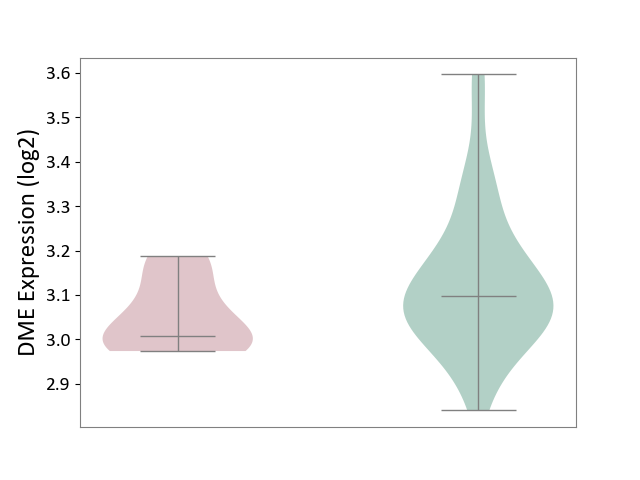
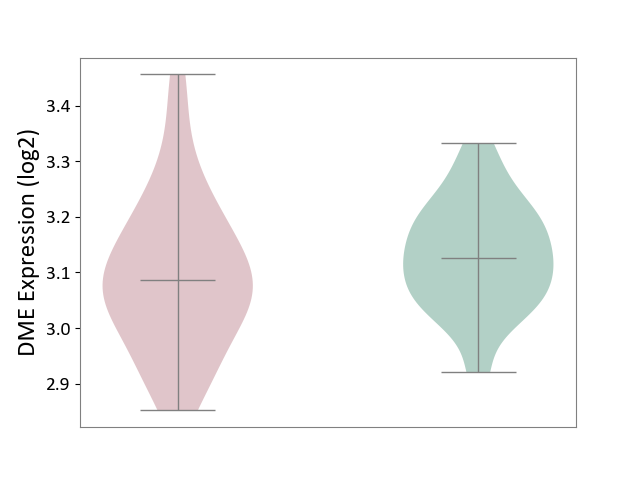
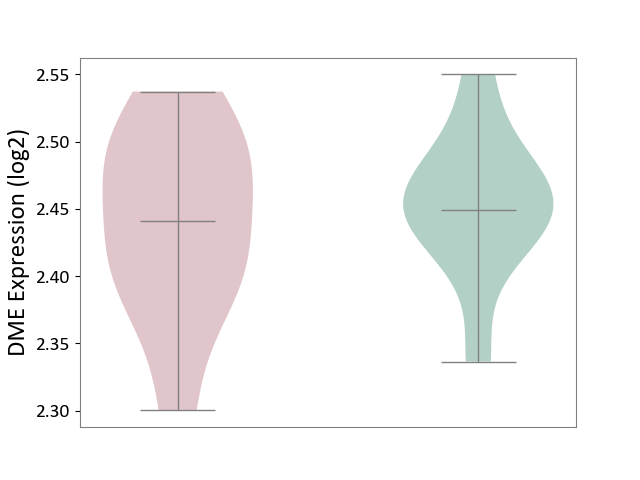
| ICD-11: 1G41 | Sepsis with septic shock | Click to Show/Hide | |||
| The Studied Tissue | Whole blood | ||||
| The Specified Disease | Sepsis with septic shock [ICD-11:1G41] | ||||
| The Expression Level of Disease Section Compare with the Healthy Individual Tissue | p-value: 2.43E-02; Fold-change: 2.35E-02; Z-score: 1.49E-01 | ||||
|
DME expression in the diseased tissue of patients
DME expression in the normal tissue of healthy individuals
|
|||||
| Violin Diagram of DME Disease-specific Protein Abundances |
|
Click to View the Clearer Original Diagram | |||
| ICD-11: CA40 | Respiratory syncytial virus infection | Click to Show/Hide | |||
| The Studied Tissue | Peripheral blood | ||||
| The Specified Disease | Pediatric respiratory syncytial virus infection [ICD-11:CA40.11] | ||||
| The Expression Level of Disease Section Compare with the Healthy Individual Tissue | p-value: 6.84E-02; Fold-change: -6.78E-02; Z-score: -6.30E-01 | ||||
|
DME expression in the diseased tissue of patients
DME expression in the normal tissue of healthy individuals
|
|||||
| Violin Diagram of DME Disease-specific Protein Abundances |
|
Click to View the Clearer Original Diagram | |||
| ICD-11: CA42 | Rhinovirus infection | Click to Show/Hide | |||
| The Studied Tissue | Nasal epithelium tissue | ||||
| The Specified Disease | Rhinovirus infection [ICD-11:CA42.1] | ||||
| The Expression Level of Disease Section Compare with the Healthy Individual Tissue | p-value: 4.31E-01; Fold-change: -5.34E-02; Z-score: -1.02E-01 | ||||
|
DME expression in the diseased tissue of patients
DME expression in the normal tissue of healthy individuals
|
|||||
| Violin Diagram of DME Disease-specific Protein Abundances |
|
Click to View the Clearer Original Diagram | |||
| ICD-11: KA60 | Neonatal sepsis | Click to Show/Hide | |||
| The Studied Tissue | Whole blood | ||||
| The Specified Disease | Neonatal sepsis [ICD-11:KA60] | ||||
| The Expression Level of Disease Section Compare with the Healthy Individual Tissue | p-value: 2.71E-01; Fold-change: -2.86E-02; Z-score: -1.76E-01 | ||||
|
DME expression in the diseased tissue of patients
DME expression in the normal tissue of healthy individuals
|
|||||
| Violin Diagram of DME Disease-specific Protein Abundances |
|
Click to View the Clearer Original Diagram | |||
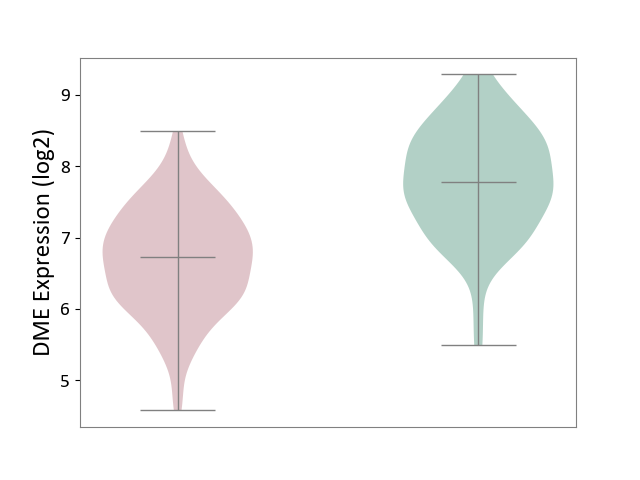
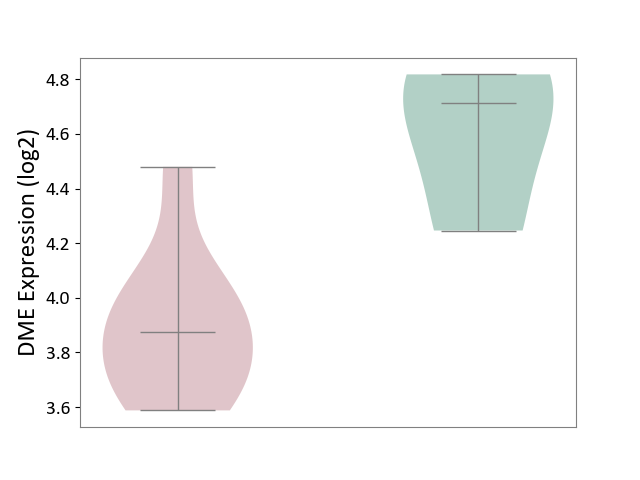
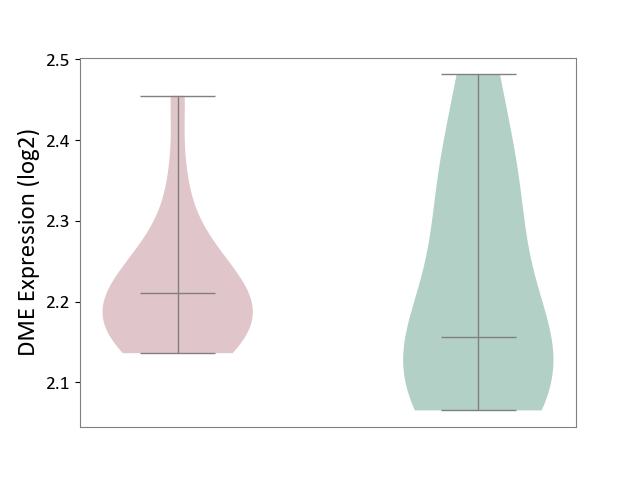
| ICD Disease Classification 02 | Neoplasm | Click to Show/Hide | |||
| ICD-11: 2A00 | Brain cancer | Click to Show/Hide | |||
| The Studied Tissue | Nervous tissue | ||||
| The Specified Disease | Glioblastopma [ICD-11:2A00.00] | ||||
| The Expression Level of Disease Section Compare with the Healthy Individual Tissue | p-value: 2.80E-10; Fold-change: 1.27E-04; Z-score: 4.77E-04 | ||||
|
DME expression in the diseased tissue of patients
DME expression in the normal tissue of healthy individuals
|
|||||
| Violin Diagram of DME Disease-specific Protein Abundances |
|
Click to View the Clearer Original Diagram | |||
| The Studied Tissue | Brain stem tissue | ||||
| The Specified Disease | Glioma [ICD-11:2A00.0Y-2A00.0Z] | ||||
| The Expression Level of Disease Section Compare with the Healthy Individual Tissue | p-value: 7.76E-01; Fold-change: -2.05E-01; Z-score: -5.72E+00 | ||||
|
DME expression in the diseased tissue of patients
DME expression in the normal tissue of healthy individuals
|
|||||
| Violin Diagram of DME Disease-specific Protein Abundances |
|
Click to View the Clearer Original Diagram | |||
| The Studied Tissue | White matter tissue | ||||
| The Specified Disease | Glioma [ICD-11:2A00.0Y-2A00.0Z] | ||||
| The Expression Level of Disease Section Compare with the Healthy Individual Tissue | p-value: 9.78E-01; Fold-change: -1.22E-03; Z-score: -4.10E-03 | ||||
|
DME expression in the diseased tissue of patients
DME expression in the normal tissue of healthy individuals
|
|||||
| Violin Diagram of DME Disease-specific Protein Abundances |
|
Click to View the Clearer Original Diagram | |||
| The Studied Tissue | Brain stem tissue | ||||
| The Specified Disease | Neuroectodermal tumour [ICD-11:2A00.11] | ||||
| The Expression Level of Disease Section Compare with the Healthy Individual Tissue | p-value: 5.16E-06; Fold-change: -7.41E-01; Z-score: -4.22E+00 | ||||
|
DME expression in the diseased tissue of patients
DME expression in the normal tissue of healthy individuals
|
|||||
| Violin Diagram of DME Disease-specific Protein Abundances |
|
Click to View the Clearer Original Diagram | |||
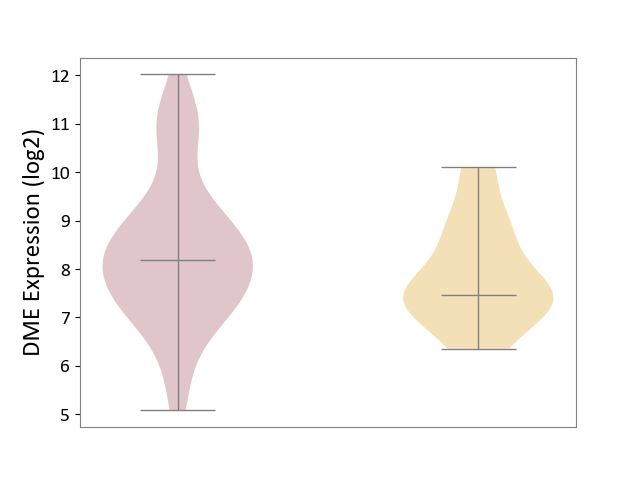
| ICD-11: 2A20 | Myeloproliferative neoplasm | Click to Show/Hide | |||
| The Studied Tissue | Whole blood | ||||
| The Specified Disease | Myelofibrosis [ICD-11:2A20.2] | ||||
| The Expression Level of Disease Section Compare with the Healthy Individual Tissue | p-value: 8.26E-04; Fold-change: 2.01E-01; Z-score: 1.65E+00 | ||||
|
DME expression in the diseased tissue of patients
DME expression in the normal tissue of healthy individuals
|
|||||
| Violin Diagram of DME Disease-specific Protein Abundances |
|
Click to View the Clearer Original Diagram | |||
| The Studied Tissue | Whole blood | ||||
| The Specified Disease | Polycythemia vera [ICD-11:2A20.4] | ||||
| The Expression Level of Disease Section Compare with the Healthy Individual Tissue | p-value: 1.11E-09; Fold-change: 1.32E-01; Z-score: 1.50E+00 | ||||
|
DME expression in the diseased tissue of patients
DME expression in the normal tissue of healthy individuals
|
|||||
| Violin Diagram of DME Disease-specific Protein Abundances |
|
Click to View the Clearer Original Diagram | |||
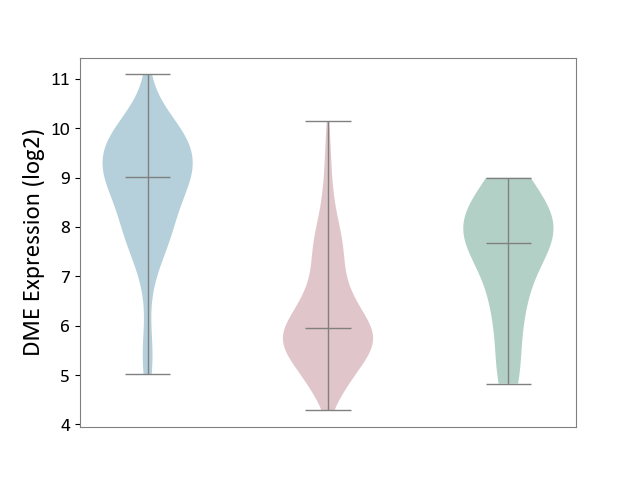
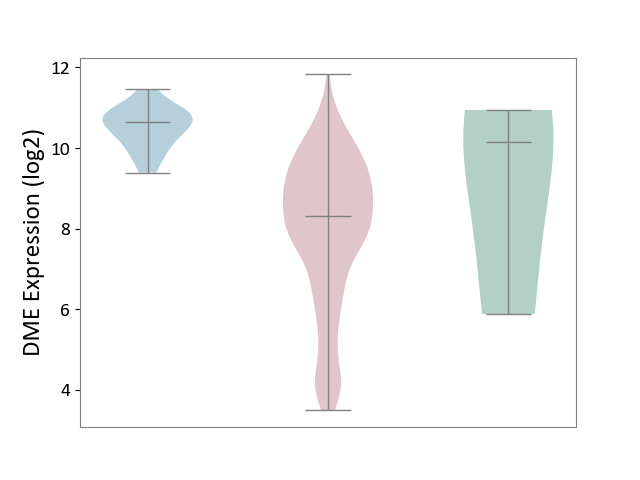
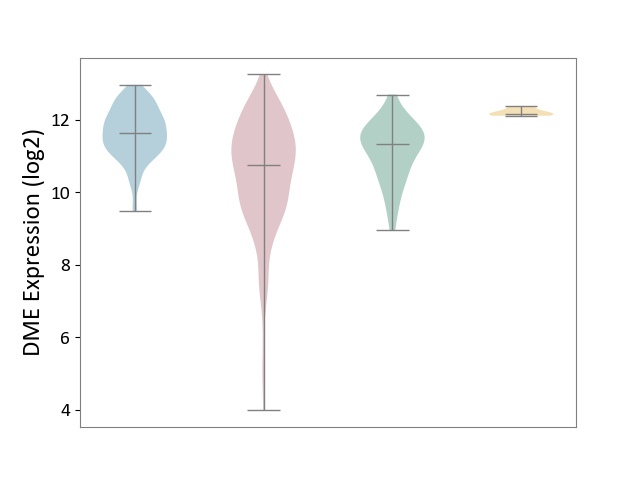
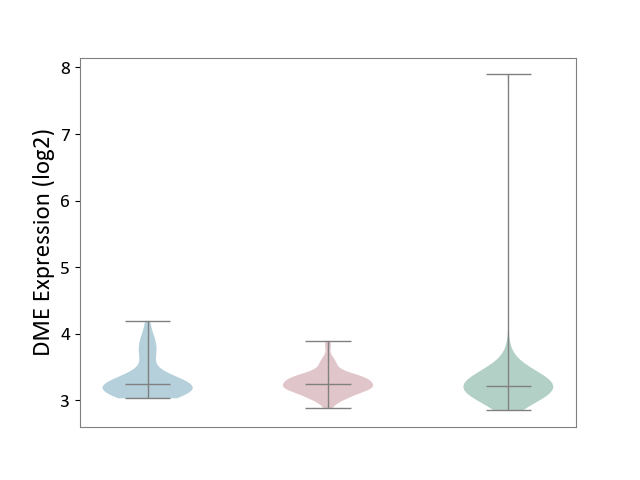
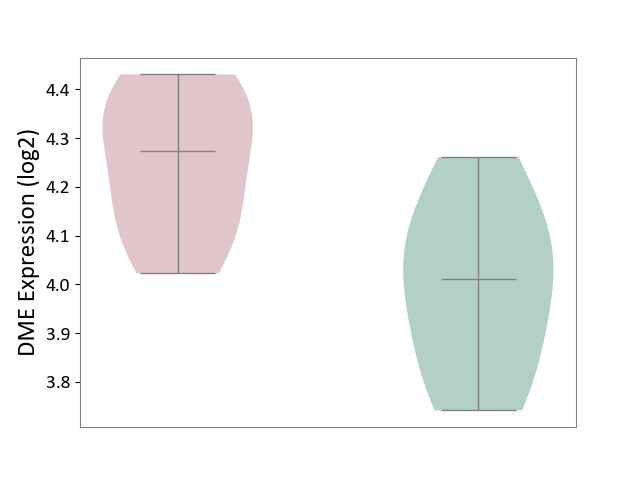
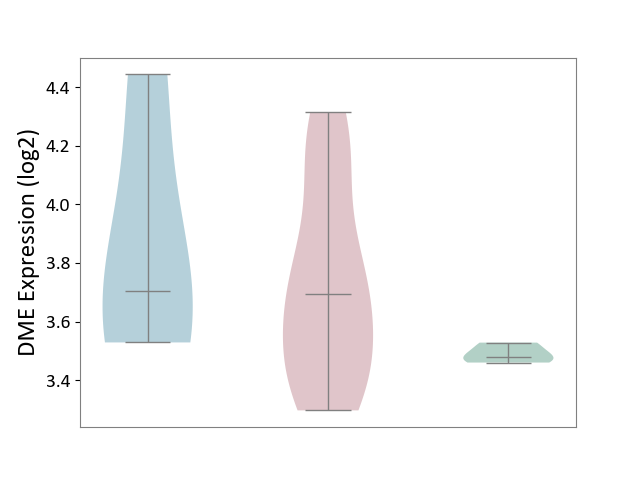
| ICD-11: 2A36 | Myelodysplastic syndrome | Click to Show/Hide | |||
| The Studied Tissue | Bone marrow | ||||
| The Specified Disease | Myelodysplastic syndrome [ICD-11:2A36-2A3Z] | ||||
| The Expression Level of Disease Section Compare with the Healthy Individual Tissue | p-value: 7.43E-01; Fold-change: -3.46E-02; Z-score: -2.62E-01 | ||||
| The Expression Level of Disease Section Compare with the Adjacent Tissue | p-value: 7.33E-01; Fold-change: -2.12E-02; Z-score: -1.06E-01 | ||||
|
DME expression in the diseased tissue of patients
DME expression in the normal tissue adjacent to the diseased tissue of patients
DME expression in the normal tissue of healthy individuals
|
|||||
| Violin Diagram of DME Disease-specific Protein Abundances |
|
Click to View the Clearer Original Diagram | |||
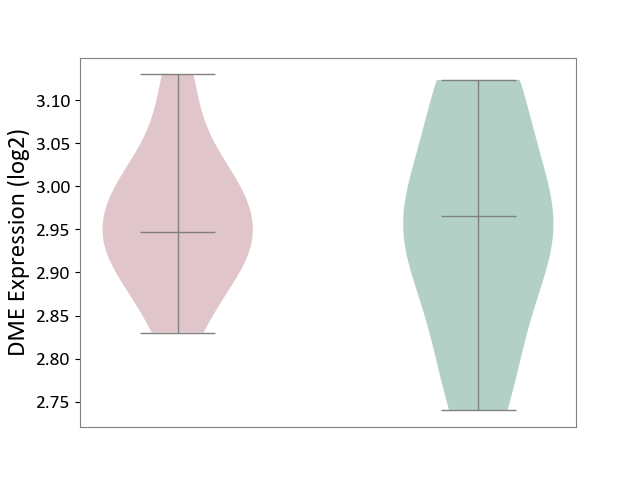
| ICD-11: 2A81 | Diffuse large B-cell lymphoma | Click to Show/Hide | |||
| The Studied Tissue | Tonsil tissue | ||||
| The Specified Disease | Diffuse large B-cell lymphoma [ICD-11:2A81] | ||||
| The Expression Level of Disease Section Compare with the Healthy Individual Tissue | p-value: 5.42E-01; Fold-change: -8.12E-02; Z-score: -8.53E-01 | ||||
|
DME expression in the diseased tissue of patients
DME expression in the normal tissue of healthy individuals
|
|||||
| Violin Diagram of DME Disease-specific Protein Abundances |
|
Click to View the Clearer Original Diagram | |||
| ICD-11: 2A83 | Plasma cell neoplasm | Click to Show/Hide | |||
| The Studied Tissue | Peripheral blood | ||||
| The Specified Disease | Multiple myeloma [ICD-11:2A83.1] | ||||
| The Expression Level of Disease Section Compare with the Healthy Individual Tissue | p-value: 2.26E-02; Fold-change: 7.10E-02; Z-score: 1.00E+00 | ||||
|
DME expression in the diseased tissue of patients
DME expression in the normal tissue of healthy individuals
|
|||||
| Violin Diagram of DME Disease-specific Protein Abundances |
|
Click to View the Clearer Original Diagram | |||
| The Studied Tissue | Bone marrow | ||||
| The Specified Disease | Multiple myeloma [ICD-11:2A83.1] | ||||
| The Expression Level of Disease Section Compare with the Healthy Individual Tissue | p-value: 7.23E-01; Fold-change: -2.28E-02; Z-score: -3.11E-01 | ||||
|
DME expression in the diseased tissue of patients
DME expression in the normal tissue of healthy individuals
|
|||||
| Violin Diagram of DME Disease-specific Protein Abundances |
|
Click to View the Clearer Original Diagram | |||
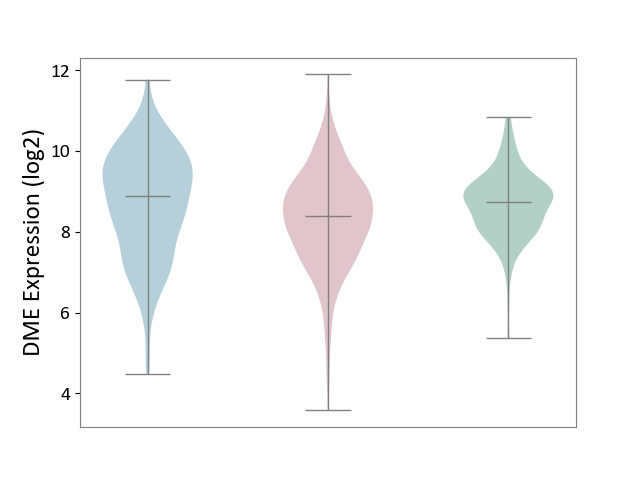
| ICD-11: 2B33 | Leukaemia | Click to Show/Hide | |||
| The Studied Tissue | Bone marrow | ||||
| The Specified Disease | Acute myelocytic leukaemia [ICD-11:2B33.1] | ||||
| The Expression Level of Disease Section Compare with the Healthy Individual Tissue | p-value: 1.69E-01; Fold-change: 2.37E-02; Z-score: 2.14E-01 | ||||
|
DME expression in the diseased tissue of patients
DME expression in the normal tissue of healthy individuals
|
|||||
| Violin Diagram of DME Disease-specific Protein Abundances |
|
Click to View the Clearer Original Diagram | |||
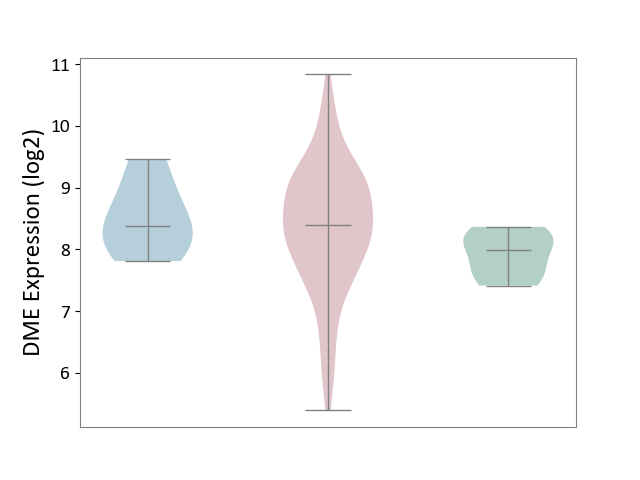
| ICD-11: 2B6E | Oral cancer | Click to Show/Hide | |||
| The Studied Tissue | Oral tissue | ||||
| The Specified Disease | Oral cancer [ICD-11:2B6E] | ||||
| The Expression Level of Disease Section Compare with the Healthy Individual Tissue | p-value: 4.58E-05; Fold-change: -1.72E+00; Z-score: -1.46E+00 | ||||
| The Expression Level of Disease Section Compare with the Adjacent Tissue | p-value: 1.15E-33; Fold-change: -3.05E+00; Z-score: -2.48E+00 | ||||
|
DME expression in the diseased tissue of patients
DME expression in the normal tissue adjacent to the diseased tissue of patients
DME expression in the normal tissue of healthy individuals
|
|||||
| Violin Diagram of DME Disease-specific Protein Abundances |
|
Click to View the Clearer Original Diagram | |||
| ICD-11: 2B70 | Esophageal cancer | Click to Show/Hide | |||
| The Studied Tissue | Esophagus | ||||
| The Specified Disease | Esophagal cancer [ICD-11:2B70] | ||||
| The Expression Level of Disease Section Compare with the Adjacent Tissue | p-value: 1.02E-01; Fold-change: -4.60E-01; Z-score: -5.29E-01 | ||||
|
DME expression in the diseased tissue of patients
DME expression in the normal tissue adjacent to the diseased tissue of patients
|
|||||
| Violin Diagram of DME Disease-specific Protein Abundances |
|
Click to View the Clearer Original Diagram | |||
| ICD-11: 2B72 | Stomach cancer | Click to Show/Hide | |||
| The Studied Tissue | Gastric tissue | ||||
| The Specified Disease | Gastric cancer [ICD-11:2B72] | ||||
| The Expression Level of Disease Section Compare with the Healthy Individual Tissue | p-value: 5.90E-01; Fold-change: -1.84E+00; Z-score: -6.76E-01 | ||||
| The Expression Level of Disease Section Compare with the Adjacent Tissue | p-value: 1.04E-15; Fold-change: -2.33E+00; Z-score: -4.49E+00 | ||||
|
DME expression in the diseased tissue of patients
DME expression in the normal tissue adjacent to the diseased tissue of patients
DME expression in the normal tissue of healthy individuals
|
|||||
| Violin Diagram of DME Disease-specific Protein Abundances |
|
Click to View the Clearer Original Diagram | |||
| ICD-11: 2B90 | Colon cancer | Click to Show/Hide | |||
| The Studied Tissue | Colon tissue | ||||
| The Specified Disease | Colon cancer [ICD-11:2B90] | ||||
| The Expression Level of Disease Section Compare with the Healthy Individual Tissue | p-value: 2.36E-06; Fold-change: -3.51E-01; Z-score: -4.31E-01 | ||||
| The Expression Level of Disease Section Compare with the Adjacent Tissue | p-value: 2.52E-03; Fold-change: -4.89E-01; Z-score: -3.72E-01 | ||||
|
DME expression in the diseased tissue of patients
DME expression in the normal tissue adjacent to the diseased tissue of patients
DME expression in the normal tissue of healthy individuals
|
|||||
| Violin Diagram of DME Disease-specific Protein Abundances |
|
Click to View the Clearer Original Diagram | |||
| ICD-11: 2B92 | Rectal cancer | Click to Show/Hide | |||
| The Studied Tissue | Rectal colon tissue | ||||
| The Specified Disease | Rectal cancer [ICD-11:2B92] | ||||
| The Expression Level of Disease Section Compare with the Healthy Individual Tissue | p-value: 3.78E-02; Fold-change: 4.07E-01; Z-score: 1.09E+00 | ||||
| The Expression Level of Disease Section Compare with the Adjacent Tissue | p-value: 5.93E-01; Fold-change: 1.71E-02; Z-score: 2.87E-02 | ||||
|
DME expression in the diseased tissue of patients
DME expression in the normal tissue adjacent to the diseased tissue of patients
DME expression in the normal tissue of healthy individuals
|
|||||
| Violin Diagram of DME Disease-specific Protein Abundances |
|
Click to View the Clearer Original Diagram | |||
| ICD-11: 2C10 | Pancreatic cancer | Click to Show/Hide | |||
| The Studied Tissue | Pancreas | ||||
| The Specified Disease | Pancreatic cancer [ICD-11:2C10] | ||||
| The Expression Level of Disease Section Compare with the Healthy Individual Tissue | p-value: 3.16E-03; Fold-change: 1.91E+00; Z-score: 1.07E+00 | ||||
| The Expression Level of Disease Section Compare with the Adjacent Tissue | p-value: 1.41E-05; Fold-change: 1.56E+00; Z-score: 7.61E-01 | ||||
|
DME expression in the diseased tissue of patients
DME expression in the normal tissue adjacent to the diseased tissue of patients
DME expression in the normal tissue of healthy individuals
|
|||||
| Violin Diagram of DME Disease-specific Protein Abundances |
|
Click to View the Clearer Original Diagram | |||
| ICD-11: 2C12 | Liver cancer | Click to Show/Hide | |||
| The Studied Tissue | Liver tissue | ||||
| The Specified Disease | Liver cancer [ICD-11:2C12.0] | ||||
| The Expression Level of Disease Section Compare with the Healthy Individual Tissue | p-value: 4.87E-05; Fold-change: -5.90E-01; Z-score: -7.24E-01 | ||||
| The Expression Level of Disease Section Compare with the Adjacent Tissue | p-value: 3.03E-31; Fold-change: -8.97E-01; Z-score: -1.27E+00 | ||||
| The Expression Level of Disease Section Compare with the Other Disease Section | p-value: 8.83E-15; Fold-change: -1.43E+00; Z-score: -1.25E+01 | ||||
|
DME expression in the diseased tissue of patients
DME expression in the normal tissue adjacent to the diseased tissue of patients
DME expression in the normal tissue of healthy individuals
DME expression in tissue other than the diseased tissue of patients
|
|||||
| Violin Diagram of DME Disease-specific Protein Abundances |
|
Click to View the Clearer Original Diagram | |||
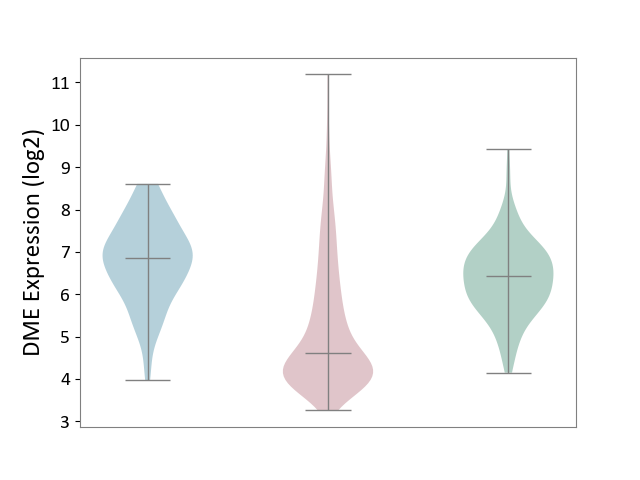
| ICD-11: 2C25 | Lung cancer | Click to Show/Hide | |||
| The Studied Tissue | Lung tissue | ||||
| The Specified Disease | Lung cancer [ICD-11:2C25] | ||||
| The Expression Level of Disease Section Compare with the Healthy Individual Tissue | p-value: 3.12E-38; Fold-change: -1.81E+00; Z-score: -2.01E+00 | ||||
| The Expression Level of Disease Section Compare with the Adjacent Tissue | p-value: 1.64E-34; Fold-change: -2.25E+00; Z-score: -2.29E+00 | ||||
|
DME expression in the diseased tissue of patients
DME expression in the normal tissue adjacent to the diseased tissue of patients
DME expression in the normal tissue of healthy individuals
|
|||||
| Violin Diagram of DME Disease-specific Protein Abundances |
|
Click to View the Clearer Original Diagram | |||
| ICD-11: 2C30 | Skin cancer | Click to Show/Hide | |||
| The Studied Tissue | Skin | ||||
| The Specified Disease | Melanoma [ICD-11:2C30] | ||||
| The Expression Level of Disease Section Compare with the Healthy Individual Tissue | p-value: 1.21E-03; Fold-change: -1.79E+00; Z-score: -1.23E+00 | ||||
|
DME expression in the diseased tissue of patients
DME expression in the normal tissue of healthy individuals
|
|||||
| Violin Diagram of DME Disease-specific Protein Abundances |
|
Click to View the Clearer Original Diagram | |||
| The Studied Tissue | Skin | ||||
| The Specified Disease | Skin cancer [ICD-11:2C30-2C3Z] | ||||
| The Expression Level of Disease Section Compare with the Healthy Individual Tissue | p-value: 1.44E-89; Fold-change: -2.17E+00; Z-score: -2.38E+00 | ||||
| The Expression Level of Disease Section Compare with the Adjacent Tissue | p-value: 1.35E-154; Fold-change: -3.13E+00; Z-score: -4.95E+00 | ||||
|
DME expression in the diseased tissue of patients
DME expression in the normal tissue adjacent to the diseased tissue of patients
DME expression in the normal tissue of healthy individuals
|
|||||
| Violin Diagram of DME Disease-specific Protein Abundances |
|
Click to View the Clearer Original Diagram | |||
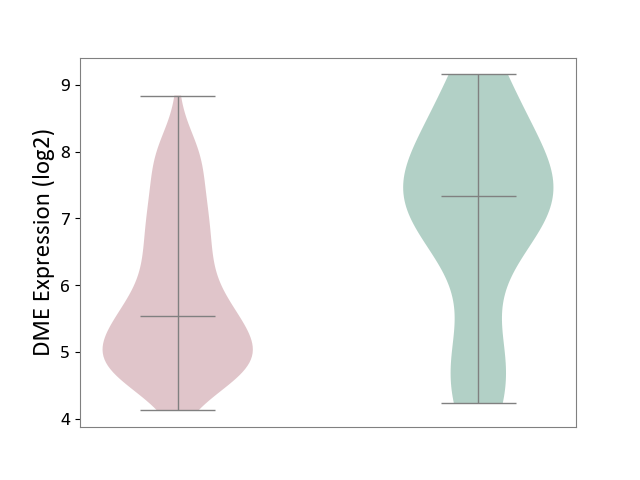
| ICD-11: 2C6Z | Breast cancer | Click to Show/Hide | |||
| The Studied Tissue | Breast tissue | ||||
| The Specified Disease | Breast cancer [ICD-11:2C60-2C6Z] | ||||
| The Expression Level of Disease Section Compare with the Healthy Individual Tissue | p-value: 2.56E-19; Fold-change: -3.06E-01; Z-score: -6.18E-01 | ||||
| The Expression Level of Disease Section Compare with the Adjacent Tissue | p-value: 1.60E-03; Fold-change: -2.05E-01; Z-score: -4.67E-01 | ||||
|
DME expression in the diseased tissue of patients
DME expression in the normal tissue adjacent to the diseased tissue of patients
DME expression in the normal tissue of healthy individuals
|
|||||
| Violin Diagram of DME Disease-specific Protein Abundances |
|
Click to View the Clearer Original Diagram | |||
| ICD-11: 2C73 | Ovarian cancer | Click to Show/Hide | |||
| The Studied Tissue | Ovarian tissue | ||||
| The Specified Disease | Ovarian cancer [ICD-11:2C73] | ||||
| The Expression Level of Disease Section Compare with the Healthy Individual Tissue | p-value: 6.08E-01; Fold-change: 2.08E-01; Z-score: 1.69E-01 | ||||
| The Expression Level of Disease Section Compare with the Adjacent Tissue | p-value: 2.65E-01; Fold-change: -1.36E+00; Z-score: -7.91E-01 | ||||
|
DME expression in the diseased tissue of patients
DME expression in the normal tissue adjacent to the diseased tissue of patients
DME expression in the normal tissue of healthy individuals
|
|||||
| Violin Diagram of DME Disease-specific Protein Abundances |
|
Click to View the Clearer Original Diagram | |||
| ICD-11: 2C77 | Cervical cancer | Click to Show/Hide | |||
| The Studied Tissue | Cervical tissue | ||||
| The Specified Disease | Cervical cancer [ICD-11:2C77] | ||||
| The Expression Level of Disease Section Compare with the Healthy Individual Tissue | p-value: 4.22E-09; Fold-change: -1.13E+00; Z-score: -1.72E+00 | ||||
|
DME expression in the diseased tissue of patients
DME expression in the normal tissue of healthy individuals
|
|||||
| Violin Diagram of DME Disease-specific Protein Abundances |
|
Click to View the Clearer Original Diagram | |||
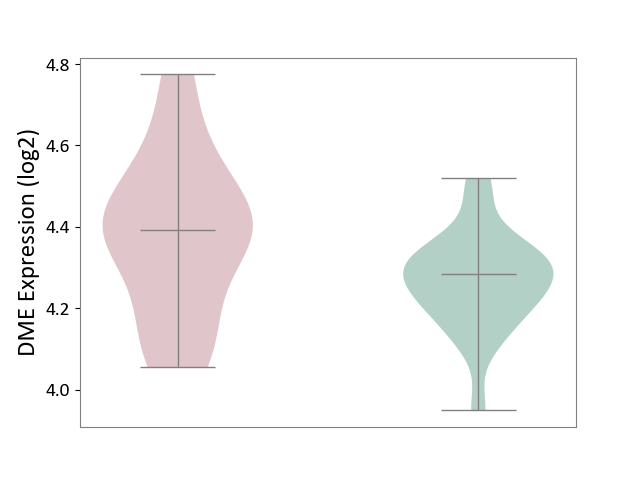
| ICD-11: 2C78 | Uterine cancer | Click to Show/Hide | |||
| The Studied Tissue | Endometrium tissue | ||||
| The Specified Disease | Uterine cancer [ICD-11:2C78] | ||||
| The Expression Level of Disease Section Compare with the Healthy Individual Tissue | p-value: 5.32E-01; Fold-change: 2.09E-01; Z-score: 1.24E-01 | ||||
| The Expression Level of Disease Section Compare with the Adjacent Tissue | p-value: 9.22E-02; Fold-change: -1.79E-01; Z-score: -5.71E-01 | ||||
|
DME expression in the diseased tissue of patients
DME expression in the normal tissue adjacent to the diseased tissue of patients
DME expression in the normal tissue of healthy individuals
|
|||||
| Violin Diagram of DME Disease-specific Protein Abundances |
|
Click to View the Clearer Original Diagram | |||
| ICD-11: 2C82 | Prostate cancer | Click to Show/Hide | |||
| The Studied Tissue | Prostate | ||||
| The Specified Disease | Prostate cancer [ICD-11:2C82] | ||||
| The Expression Level of Disease Section Compare with the Healthy Individual Tissue | p-value: 5.69E-06; Fold-change: -1.53E+00; Z-score: -1.39E+00 | ||||
|
DME expression in the diseased tissue of patients
DME expression in the normal tissue of healthy individuals
|
|||||
| Violin Diagram of DME Disease-specific Protein Abundances |
|
Click to View the Clearer Original Diagram | |||
| ICD-11: 2C90 | Renal cancer | Click to Show/Hide | |||
| The Studied Tissue | Kidney | ||||
| The Specified Disease | Renal cancer [ICD-11:2C90-2C91] | ||||
| The Expression Level of Disease Section Compare with the Healthy Individual Tissue | p-value: 3.51E-02; Fold-change: 1.53E+00; Z-score: 1.16E+00 | ||||
| The Expression Level of Disease Section Compare with the Adjacent Tissue | p-value: 3.09E-01; Fold-change: 2.09E-01; Z-score: 2.20E-01 | ||||
|
DME expression in the diseased tissue of patients
DME expression in the normal tissue adjacent to the diseased tissue of patients
DME expression in the normal tissue of healthy individuals
|
|||||
| Violin Diagram of DME Disease-specific Protein Abundances |
|
Click to View the Clearer Original Diagram | |||
| ICD-11: 2C92 | Ureter cancer | Click to Show/Hide | |||
| The Studied Tissue | Urothelium | ||||
| The Specified Disease | Ureter cancer [ICD-11:2C92] | ||||
| The Expression Level of Disease Section Compare with the Healthy Individual Tissue | p-value: 4.98E-01; Fold-change: 7.83E-02; Z-score: 1.63E-01 | ||||
|
DME expression in the diseased tissue of patients
DME expression in the normal tissue of healthy individuals
|
|||||
| Violin Diagram of DME Disease-specific Protein Abundances |
|
Click to View the Clearer Original Diagram | |||
| ICD-11: 2C94 | Bladder cancer | Click to Show/Hide | |||
| The Studied Tissue | Bladder tissue | ||||
| The Specified Disease | Bladder cancer [ICD-11:2C94] | ||||
| The Expression Level of Disease Section Compare with the Healthy Individual Tissue | p-value: 4.33E-04; Fold-change: -2.03E+00; Z-score: -2.85E+00 | ||||
|
DME expression in the diseased tissue of patients
DME expression in the normal tissue of healthy individuals
|
|||||
| Violin Diagram of DME Disease-specific Protein Abundances |
|
Click to View the Clearer Original Diagram | |||
| ICD-11: 2D02 | Retinal cancer | Click to Show/Hide | |||
| The Studied Tissue | Uvea | ||||
| The Specified Disease | Retinoblastoma [ICD-11:2D02.2] | ||||
| The Expression Level of Disease Section Compare with the Healthy Individual Tissue | p-value: 7.40E-02; Fold-change: -2.10E-02; Z-score: -1.31E-01 | ||||
|
DME expression in the diseased tissue of patients
DME expression in the normal tissue of healthy individuals
|
|||||
| Violin Diagram of DME Disease-specific Protein Abundances |
|
Click to View the Clearer Original Diagram | |||
| ICD-11: 2D10 | Thyroid cancer | Click to Show/Hide | |||
| The Studied Tissue | Thyroid | ||||
| The Specified Disease | Thyroid cancer [ICD-11:2D10] | ||||
| The Expression Level of Disease Section Compare with the Healthy Individual Tissue | p-value: 9.83E-01; Fold-change: 3.44E-02; Z-score: 7.14E-02 | ||||
| The Expression Level of Disease Section Compare with the Adjacent Tissue | p-value: 2.18E-01; Fold-change: 8.04E-03; Z-score: 2.79E-02 | ||||
|
DME expression in the diseased tissue of patients
DME expression in the normal tissue adjacent to the diseased tissue of patients
DME expression in the normal tissue of healthy individuals
|
|||||
| Violin Diagram of DME Disease-specific Protein Abundances |
|
Click to View the Clearer Original Diagram | |||
| ICD-11: 2D11 | Adrenal cancer | Click to Show/Hide | |||
| The Studied Tissue | Adrenal cortex | ||||
| The Specified Disease | Adrenocortical carcinoma [ICD-11:2D11.Z] | ||||
| The Expression Level of Disease Section Compare with the Other Disease Section | p-value: 1.32E-01; Fold-change: 7.27E-01; Z-score: 6.68E-01 | ||||
|
DME expression in the diseased tissue of patients
DME expression in tissue other than the diseased tissue of patients
|
|||||
| Violin Diagram of DME Disease-specific Protein Abundances |
|
Click to View the Clearer Original Diagram | |||
| ICD-11: 2D12 | Endocrine gland neoplasm | Click to Show/Hide | |||
| The Studied Tissue | Pituitary tissue | ||||
| The Specified Disease | Pituitary cancer [ICD-11:2D12] | ||||
| The Expression Level of Disease Section Compare with the Healthy Individual Tissue | p-value: 3.97E-02; Fold-change: -6.76E-01; Z-score: -1.24E+00 | ||||
|
DME expression in the diseased tissue of patients
DME expression in the normal tissue of healthy individuals
|
|||||
| Violin Diagram of DME Disease-specific Protein Abundances |
|
Click to View the Clearer Original Diagram | |||
| The Studied Tissue | Pituitary tissue | ||||
| The Specified Disease | Pituitary gonadotrope tumour [ICD-11:2D12] | ||||
| The Expression Level of Disease Section Compare with the Healthy Individual Tissue | p-value: 1.17E-03; Fold-change: -7.11E-01; Z-score: -1.33E+00 | ||||
|
DME expression in the diseased tissue of patients
DME expression in the normal tissue of healthy individuals
|
|||||
| Violin Diagram of DME Disease-specific Protein Abundances |
|
Click to View the Clearer Original Diagram | |||
| ICD-11: 2D42 | Head and neck cancer | Click to Show/Hide | |||
| The Studied Tissue | Head and neck tissue | ||||
| The Specified Disease | Head and neck cancer [ICD-11:2D42] | ||||
| The Expression Level of Disease Section Compare with the Healthy Individual Tissue | p-value: 2.45E-13; Fold-change: -2.29E+00; Z-score: -1.44E+00 | ||||
|
DME expression in the diseased tissue of patients
DME expression in the normal tissue of healthy individuals
|
|||||
| Violin Diagram of DME Disease-specific Protein Abundances |
|
Click to View the Clearer Original Diagram | |||
| ICD Disease Classification 03 | Blood/blood-forming organ disease | Click to Show/Hide | |||
| ICD-11: 3A51 | Sickle cell disorder | Click to Show/Hide | |||
| The Studied Tissue | Peripheral blood | ||||
| The Specified Disease | Sickle cell disease [ICD-11:3A51.0-3A51.3] | ||||
| The Expression Level of Disease Section Compare with the Healthy Individual Tissue | p-value: 5.63E-01; Fold-change: 3.13E-02; Z-score: 2.23E-01 | ||||
|
DME expression in the diseased tissue of patients
DME expression in the normal tissue of healthy individuals
|
|||||
| Violin Diagram of DME Disease-specific Protein Abundances |
|
Click to View the Clearer Original Diagram | |||
| ICD-11: 3A70 | Aplastic anaemia | Click to Show/Hide | |||
| The Studied Tissue | Bone marrow | ||||
| The Specified Disease | Shwachman-Diamond syndrome [ICD-11:3A70.0] | ||||
| The Expression Level of Disease Section Compare with the Healthy Individual Tissue | p-value: 1.55E-02; Fold-change: 2.64E-01; Z-score: 1.47E+00 | ||||
|
DME expression in the diseased tissue of patients
DME expression in the normal tissue of healthy individuals
|
|||||
| Violin Diagram of DME Disease-specific Protein Abundances |
|
Click to View the Clearer Original Diagram | |||
| ICD-11: 3B63 | Thrombocytosis | Click to Show/Hide | |||
| The Studied Tissue | Whole blood | ||||
| The Specified Disease | Thrombocythemia [ICD-11:3B63] | ||||
| The Expression Level of Disease Section Compare with the Healthy Individual Tissue | p-value: 1.38E-02; Fold-change: 1.07E-01; Z-score: 8.83E-01 | ||||
|
DME expression in the diseased tissue of patients
DME expression in the normal tissue of healthy individuals
|
|||||
| Violin Diagram of DME Disease-specific Protein Abundances |
|
Click to View the Clearer Original Diagram | |||
| ICD-11: 3B64 | Thrombocytopenia | Click to Show/Hide | |||
| The Studied Tissue | Whole blood | ||||
| The Specified Disease | Thrombocytopenia [ICD-11:3B64] | ||||
| The Expression Level of Disease Section Compare with the Healthy Individual Tissue | p-value: 6.38E-01; Fold-change: 1.87E-01; Z-score: 4.94E-01 | ||||
|
DME expression in the diseased tissue of patients
DME expression in the normal tissue of healthy individuals
|
|||||
| Violin Diagram of DME Disease-specific Protein Abundances |
|
Click to View the Clearer Original Diagram | |||
| ICD Disease Classification 04 | Immune system disease | Click to Show/Hide | |||
| ICD-11: 4A00 | Immunodeficiency | Click to Show/Hide | |||
| The Studied Tissue | Peripheral blood | ||||
| The Specified Disease | Immunodeficiency [ICD-11:4A00-4A20] | ||||
| The Expression Level of Disease Section Compare with the Healthy Individual Tissue | p-value: 1.27E-02; Fold-change: -1.53E-01; Z-score: -1.32E+00 | ||||
|
DME expression in the diseased tissue of patients
DME expression in the normal tissue of healthy individuals
|
|||||
| Violin Diagram of DME Disease-specific Protein Abundances |
|
Click to View the Clearer Original Diagram | |||
| ICD-11: 4A40 | Lupus erythematosus | Click to Show/Hide | |||
| The Studied Tissue | Whole blood | ||||
| The Specified Disease | Lupus erythematosus [ICD-11:4A40] | ||||
| The Expression Level of Disease Section Compare with the Healthy Individual Tissue | p-value: 7.48E-04; Fold-change: -7.04E-02; Z-score: -3.44E-01 | ||||
|
DME expression in the diseased tissue of patients
DME expression in the normal tissue of healthy individuals
|
|||||
| Violin Diagram of DME Disease-specific Protein Abundances |
|
Click to View the Clearer Original Diagram | |||
| ICD-11: 4A42 | Systemic sclerosis | Click to Show/Hide | |||
| The Studied Tissue | Whole blood | ||||
| The Specified Disease | Scleroderma [ICD-11:4A42.Z] | ||||
| The Expression Level of Disease Section Compare with the Healthy Individual Tissue | p-value: 2.82E-03; Fold-change: 1.20E-01; Z-score: 1.40E+00 | ||||
|
DME expression in the diseased tissue of patients
DME expression in the normal tissue of healthy individuals
|
|||||
| Violin Diagram of DME Disease-specific Protein Abundances |
|
Click to View the Clearer Original Diagram | |||
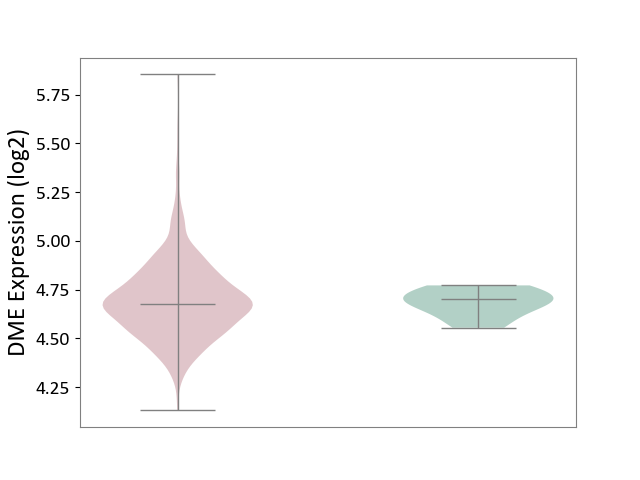
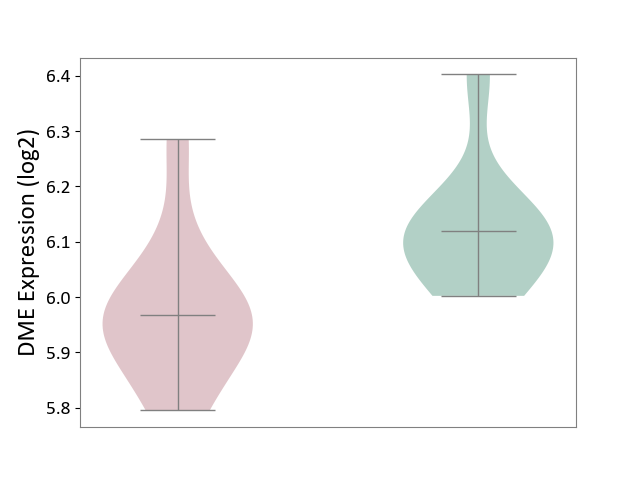
| ICD-11: 4A43 | Systemic autoimmune disease | Click to Show/Hide | |||
| The Studied Tissue | Salivary gland tissue | ||||
| The Specified Disease | Sjogren's syndrome [ICD-11:4A43.2] | ||||
| The Expression Level of Disease Section Compare with the Healthy Individual Tissue | p-value: 7.08E-03; Fold-change: 2.15E-01; Z-score: 6.16E+00 | ||||
| The Expression Level of Disease Section Compare with the Adjacent Tissue | p-value: 6.14E-01; Fold-change: -8.38E-03; Z-score: -1.98E-02 | ||||
|
DME expression in the diseased tissue of patients
DME expression in the normal tissue adjacent to the diseased tissue of patients
DME expression in the normal tissue of healthy individuals
|
|||||
| Violin Diagram of DME Disease-specific Protein Abundances |
|
Click to View the Clearer Original Diagram | |||
| ICD-11: 4A62 | Behcet disease | Click to Show/Hide | |||
| The Studied Tissue | Peripheral blood | ||||
| The Specified Disease | Behcet's disease [ICD-11:4A62] | ||||
| The Expression Level of Disease Section Compare with the Healthy Individual Tissue | p-value: 7.83E-01; Fold-change: -1.88E-02; Z-score: -1.53E-01 | ||||
|
DME expression in the diseased tissue of patients
DME expression in the normal tissue of healthy individuals
|
|||||
| Violin Diagram of DME Disease-specific Protein Abundances |
|
Click to View the Clearer Original Diagram | |||
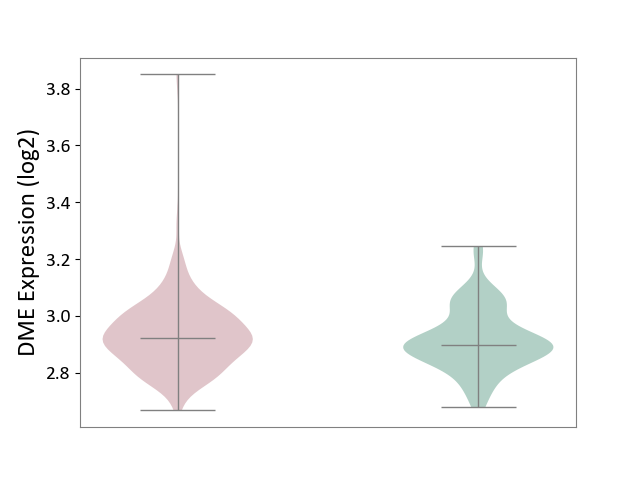
| ICD-11: 4B04 | Monocyte count disorder | Click to Show/Hide | |||
| The Studied Tissue | Whole blood | ||||
| The Specified Disease | Autosomal dominant monocytopenia [ICD-11:4B04] | ||||
| The Expression Level of Disease Section Compare with the Healthy Individual Tissue | p-value: 9.61E-01; Fold-change: 3.84E-02; Z-score: 4.15E-01 | ||||
|
DME expression in the diseased tissue of patients
DME expression in the normal tissue of healthy individuals
|
|||||
| Violin Diagram of DME Disease-specific Protein Abundances |
|
Click to View the Clearer Original Diagram | |||
| ICD Disease Classification 05 | Endocrine/nutritional/metabolic disease | Click to Show/Hide | |||
| ICD-11: 5A11 | Type 2 diabetes mellitus | Click to Show/Hide | |||
| The Studied Tissue | Omental adipose tissue | ||||
| The Specified Disease | Obesity related type 2 diabetes [ICD-11:5A11] | ||||
| The Expression Level of Disease Section Compare with the Healthy Individual Tissue | p-value: 1.96E-01; Fold-change: -4.28E-01; Z-score: -7.54E-01 | ||||
|
DME expression in the diseased tissue of patients
DME expression in the normal tissue of healthy individuals
|
|||||
| Violin Diagram of DME Disease-specific Protein Abundances |
|
Click to View the Clearer Original Diagram | |||
| The Studied Tissue | Liver tissue | ||||
| The Specified Disease | Type 2 diabetes [ICD-11:5A11] | ||||
| The Expression Level of Disease Section Compare with the Healthy Individual Tissue | p-value: 8.58E-01; Fold-change: -3.73E-03; Z-score: -1.00E-02 | ||||
|
DME expression in the diseased tissue of patients
DME expression in the normal tissue of healthy individuals
|
|||||
| Violin Diagram of DME Disease-specific Protein Abundances |
|
Click to View the Clearer Original Diagram | |||
| ICD-11: 5A80 | Ovarian dysfunction | Click to Show/Hide | |||
| The Studied Tissue | Vastus lateralis muscle | ||||
| The Specified Disease | Polycystic ovary syndrome [ICD-11:5A80.1] | ||||
| The Expression Level of Disease Section Compare with the Healthy Individual Tissue | p-value: 4.16E-01; Fold-change: -4.95E-02; Z-score: -6.25E-01 | ||||
|
DME expression in the diseased tissue of patients
DME expression in the normal tissue of healthy individuals
|
|||||
| Violin Diagram of DME Disease-specific Protein Abundances |
|
Click to View the Clearer Original Diagram | |||
| ICD-11: 5C51 | Inborn carbohydrate metabolism disorder | Click to Show/Hide | |||
| The Studied Tissue | Biceps muscle | ||||
| The Specified Disease | Pompe disease [ICD-11:5C51.3] | ||||
| The Expression Level of Disease Section Compare with the Healthy Individual Tissue | p-value: 5.17E-03; Fold-change: -2.19E-01; Z-score: -7.01E-01 | ||||
|
DME expression in the diseased tissue of patients
DME expression in the normal tissue of healthy individuals
|
|||||
| Violin Diagram of DME Disease-specific Protein Abundances |
|
Click to View the Clearer Original Diagram | |||
| ICD-11: 5C56 | Lysosomal disease | Click to Show/Hide | |||
| The Studied Tissue | Whole blood | ||||
| The Specified Disease | Batten disease [ICD-11:5C56.1] | ||||
| The Expression Level of Disease Section Compare with the Healthy Individual Tissue | p-value: 8.42E-01; Fold-change: -1.73E-02; Z-score: -1.48E-01 | ||||
|
DME expression in the diseased tissue of patients
DME expression in the normal tissue of healthy individuals
|
|||||
| Violin Diagram of DME Disease-specific Protein Abundances |
|
Click to View the Clearer Original Diagram | |||
| ICD-11: 5C80 | Hyperlipoproteinaemia | Click to Show/Hide | |||
| The Studied Tissue | Peripheral blood | ||||
| The Specified Disease | Familial hypercholesterolemia [ICD-11:5C80.00] | ||||
| The Expression Level of Disease Section Compare with the Healthy Individual Tissue | p-value: 1.84E-01; Fold-change: -8.92E-03; Z-score: -8.92E-02 | ||||
|
DME expression in the diseased tissue of patients
DME expression in the normal tissue of healthy individuals
|
|||||
| Violin Diagram of DME Disease-specific Protein Abundances |
|
Click to View the Clearer Original Diagram | |||
| The Studied Tissue | Whole blood | ||||
| The Specified Disease | Familial hypercholesterolemia [ICD-11:5C80.00] | ||||
| The Expression Level of Disease Section Compare with the Healthy Individual Tissue | p-value: 3.65E-02; Fold-change: -8.90E-02; Z-score: -5.58E-01 | ||||
|
DME expression in the diseased tissue of patients
DME expression in the normal tissue of healthy individuals
|
|||||
| Violin Diagram of DME Disease-specific Protein Abundances |
|
Click to View the Clearer Original Diagram | |||
| ICD Disease Classification 06 | Mental/behavioural/neurodevelopmental disorder | Click to Show/Hide | |||
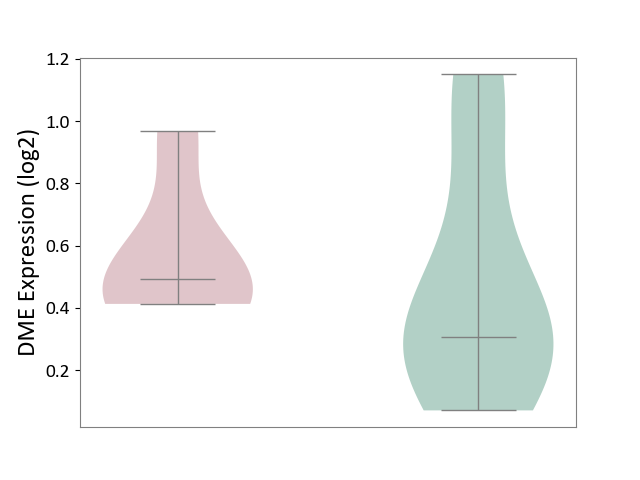
| ICD-11: 6A02 | Autism spectrum disorder | Click to Show/Hide | |||
| The Studied Tissue | Whole blood | ||||
| The Specified Disease | Autism [ICD-11:6A02] | ||||
| The Expression Level of Disease Section Compare with the Healthy Individual Tissue | p-value: 2.44E-01; Fold-change: -1.07E-02; Z-score: -5.56E-02 | ||||
|
DME expression in the diseased tissue of patients
DME expression in the normal tissue of healthy individuals
|
|||||
| Violin Diagram of DME Disease-specific Protein Abundances |
|
Click to View the Clearer Original Diagram | |||
| ICD-11: 6A20 | Schizophrenia | Click to Show/Hide | |||
| The Studied Tissue | Prefrontal cortex | ||||
| The Specified Disease | Schizophrenia [ICD-11:6A20] | ||||
| The Expression Level of Disease Section Compare with the Healthy Individual Tissue | p-value: 1.17E-01; Fold-change: -3.87E-02; Z-score: -2.23E-01 | ||||
|
DME expression in the diseased tissue of patients
DME expression in the normal tissue of healthy individuals
|
|||||
| Violin Diagram of DME Disease-specific Protein Abundances |
|
Click to View the Clearer Original Diagram | |||
| The Studied Tissue | Superior temporal cortex | ||||
| The Specified Disease | Schizophrenia [ICD-11:6A20] | ||||
| The Expression Level of Disease Section Compare with the Healthy Individual Tissue | p-value: 9.74E-01; Fold-change: 7.48E-03; Z-score: 1.37E-01 | ||||
|
DME expression in the diseased tissue of patients
DME expression in the normal tissue of healthy individuals
|
|||||
| Violin Diagram of DME Disease-specific Protein Abundances |
|
Click to View the Clearer Original Diagram | |||
| ICD-11: 6A60 | Bipolar disorder | Click to Show/Hide | |||
| The Studied Tissue | Prefrontal cortex | ||||
| The Specified Disease | Bipolar disorder [ICD-11:6A60-6A6Z] | ||||
| The Expression Level of Disease Section Compare with the Healthy Individual Tissue | p-value: 2.21E-01; Fold-change: -3.94E-02; Z-score: -4.05E-01 | ||||
|
DME expression in the diseased tissue of patients
DME expression in the normal tissue of healthy individuals
|
|||||
| Violin Diagram of DME Disease-specific Protein Abundances |
|
Click to View the Clearer Original Diagram | |||
| ICD-11: 6A70 | Depressive disorder | Click to Show/Hide | |||
| The Studied Tissue | Whole blood | ||||
| The Specified Disease | Major depressive disorder [ICD-11:6A70-6A7Z] | ||||
| The Expression Level of Disease Section Compare with the Healthy Individual Tissue | p-value: 7.63E-01; Fold-change: -1.01E-01; Z-score: -2.77E-01 | ||||
|
DME expression in the diseased tissue of patients
DME expression in the normal tissue of healthy individuals
|
|||||
| Violin Diagram of DME Disease-specific Protein Abundances |
|
Click to View the Clearer Original Diagram | |||
| The Studied Tissue | Hippocampus | ||||
| The Specified Disease | Major depressive disorder [ICD-11:6A70-6A7Z] | ||||
| The Expression Level of Disease Section Compare with the Healthy Individual Tissue | p-value: 5.09E-02; Fold-change: -5.62E-02; Z-score: -5.19E-01 | ||||
|
DME expression in the diseased tissue of patients
DME expression in the normal tissue of healthy individuals
|
|||||
| Violin Diagram of DME Disease-specific Protein Abundances |
|
Click to View the Clearer Original Diagram | |||
| ICD Disease Classification 08 | Nervous system disease | Click to Show/Hide | |||
| ICD-11: 8A00 | Parkinsonism | Click to Show/Hide | |||
| The Studied Tissue | Substantia nigra tissue | ||||
| The Specified Disease | Parkinson's disease [ICD-11:8A00.0] | ||||
| The Expression Level of Disease Section Compare with the Healthy Individual Tissue | p-value: 9.57E-01; Fold-change: 9.43E-03; Z-score: 1.29E-01 | ||||
|
DME expression in the diseased tissue of patients
DME expression in the normal tissue of healthy individuals
|
|||||
| Violin Diagram of DME Disease-specific Protein Abundances |
|
Click to View the Clearer Original Diagram | |||
| ICD-11: 8A01 | Choreiform disorder | Click to Show/Hide | |||
| The Studied Tissue | Whole blood | ||||
| The Specified Disease | Huntington's disease [ICD-11:8A01.10] | ||||
| The Expression Level of Disease Section Compare with the Healthy Individual Tissue | p-value: 6.47E-01; Fold-change: -7.91E-03; Z-score: -1.41E-01 | ||||
|
DME expression in the diseased tissue of patients
DME expression in the normal tissue of healthy individuals
|
|||||
| Violin Diagram of DME Disease-specific Protein Abundances |
|
Click to View the Clearer Original Diagram | |||
| ICD-11: 8A20 | Alzheimer disease | Click to Show/Hide | |||
| The Studied Tissue | Entorhinal cortex | ||||
| The Specified Disease | Alzheimer's disease [ICD-11:8A20] | ||||
| The Expression Level of Disease Section Compare with the Healthy Individual Tissue | p-value: 9.96E-01; Fold-change: -3.17E-03; Z-score: -1.84E-02 | ||||
|
DME expression in the diseased tissue of patients
DME expression in the normal tissue of healthy individuals
|
|||||
| Violin Diagram of DME Disease-specific Protein Abundances |
|
Click to View the Clearer Original Diagram | |||
| ICD-11: 8A2Y | Neurocognitive impairment | Click to Show/Hide | |||
| The Studied Tissue | White matter tissue | ||||
| The Specified Disease | HIV-associated neurocognitive impairment [ICD-11:8A2Y-8A2Z] | ||||
| The Expression Level of Disease Section Compare with the Healthy Individual Tissue | p-value: 1.05E-01; Fold-change: -7.09E-02; Z-score: -5.40E-01 | ||||
|
DME expression in the diseased tissue of patients
DME expression in the normal tissue of healthy individuals
|
|||||
| Violin Diagram of DME Disease-specific Protein Abundances |
|
Click to View the Clearer Original Diagram | |||
| ICD-11: 8A40 | Multiple sclerosis | Click to Show/Hide | |||
| The Studied Tissue | Plasmacytoid dendritic cells | ||||
| The Specified Disease | Multiple sclerosis [ICD-11:8A40] | ||||
| The Expression Level of Disease Section Compare with the Healthy Individual Tissue | p-value: 5.82E-01; Fold-change: -6.00E-02; Z-score: -2.69E-01 | ||||
|
DME expression in the diseased tissue of patients
DME expression in the normal tissue of healthy individuals
|
|||||
| Violin Diagram of DME Disease-specific Protein Abundances |
|
Click to View the Clearer Original Diagram | |||
| The Studied Tissue | Spinal cord | ||||
| The Specified Disease | Multiple sclerosis [ICD-11:8A40] | ||||
| The Expression Level of Disease Section Compare with the Adjacent Tissue | p-value: 9.06E-01; Fold-change: 4.78E-02; Z-score: 5.65E-01 | ||||
|
DME expression in the diseased tissue of patients
DME expression in the normal tissue adjacent to the diseased tissue of patients
|
|||||
| Violin Diagram of DME Disease-specific Protein Abundances |
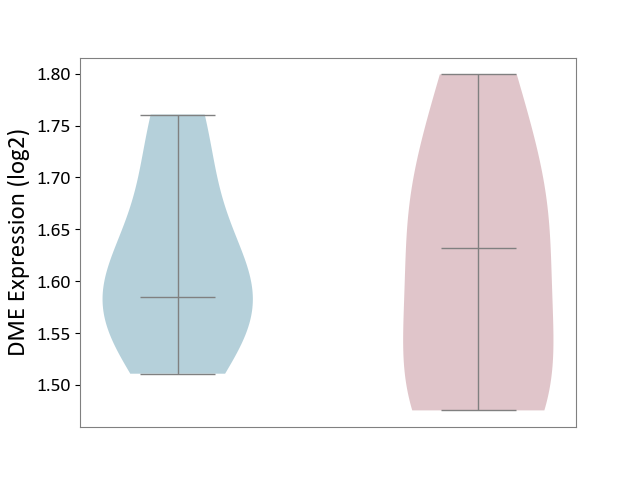
|
Click to View the Clearer Original Diagram | |||
| ICD-11: 8A60 | Epilepsy | Click to Show/Hide | |||
| The Studied Tissue | Peritumoral cortex tissue | ||||
| The Specified Disease | Epilepsy [ICD-11:8A60-8A6Z] | ||||
| The Expression Level of Disease Section Compare with the Other Disease Section | p-value: 9.63E-01; Fold-change: 2.58E-02; Z-score: 1.42E-01 | ||||
|
DME expression in the diseased tissue of patients
DME expression in tissue other than the diseased tissue of patients
|
|||||
| Violin Diagram of DME Disease-specific Protein Abundances |
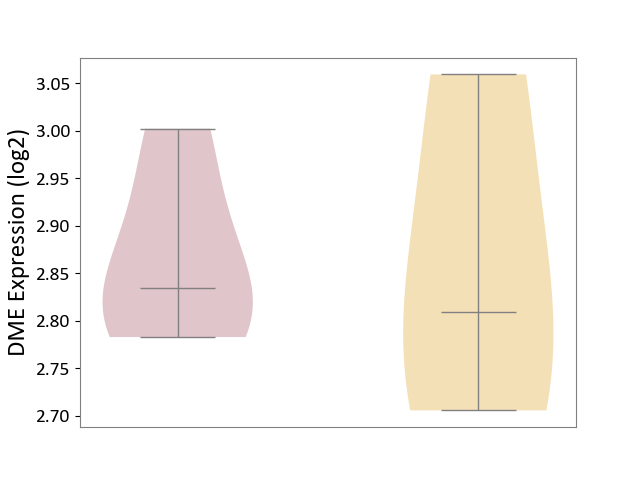
|
Click to View the Clearer Original Diagram | |||
| The Studied Tissue | Whole blood | ||||
| The Specified Disease | Seizure [ICD-11:8A60-8A6Z] | ||||
| The Expression Level of Disease Section Compare with the Healthy Individual Tissue | p-value: 1.67E-03; Fold-change: -1.70E-01; Z-score: -1.36E+00 | ||||
|
DME expression in the diseased tissue of patients
DME expression in the normal tissue of healthy individuals
|
|||||
| Violin Diagram of DME Disease-specific Protein Abundances |
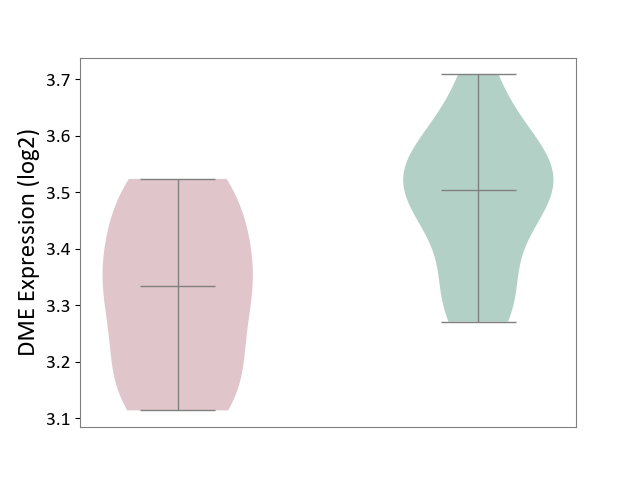
|
Click to View the Clearer Original Diagram | |||
| ICD-11: 8B01 | Subarachnoid haemorrhage | Click to Show/Hide | |||
| The Studied Tissue | Intracranial artery | ||||
| The Specified Disease | Intracranial aneurysm [ICD-11:8B01.0] | ||||
| The Expression Level of Disease Section Compare with the Healthy Individual Tissue | p-value: 3.13E-01; Fold-change: -1.95E-01; Z-score: -5.00E-01 | ||||
|
DME expression in the diseased tissue of patients
DME expression in the normal tissue of healthy individuals
|
|||||
| Violin Diagram of DME Disease-specific Protein Abundances |
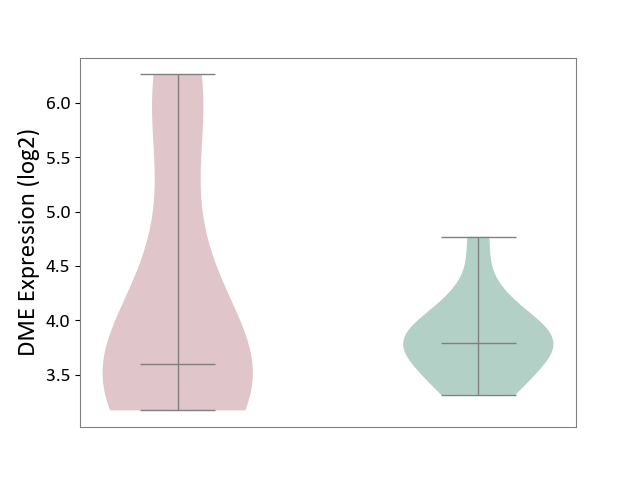
|
Click to View the Clearer Original Diagram | |||
| ICD-11: 8B11 | Cerebral ischaemic stroke | Click to Show/Hide | |||
| The Studied Tissue | Whole blood | ||||
| The Specified Disease | Cardioembolic stroke [ICD-11:8B11.20] | ||||
| The Expression Level of Disease Section Compare with the Healthy Individual Tissue | p-value: 5.22E-01; Fold-change: -6.64E-02; Z-score: -2.91E-01 | ||||
|
DME expression in the diseased tissue of patients
DME expression in the normal tissue of healthy individuals
|
|||||
| Violin Diagram of DME Disease-specific Protein Abundances |
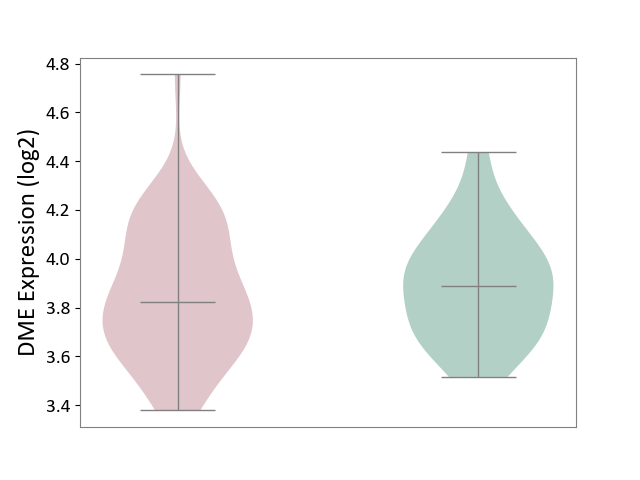
|
Click to View the Clearer Original Diagram | |||
| The Studied Tissue | Peripheral blood | ||||
| The Specified Disease | Ischemic stroke [ICD-11:8B11] | ||||
| The Expression Level of Disease Section Compare with the Healthy Individual Tissue | p-value: 2.55E-02; Fold-change: 8.53E-02; Z-score: 9.03E-01 | ||||
|
DME expression in the diseased tissue of patients
DME expression in the normal tissue of healthy individuals
|
|||||
| Violin Diagram of DME Disease-specific Protein Abundances |
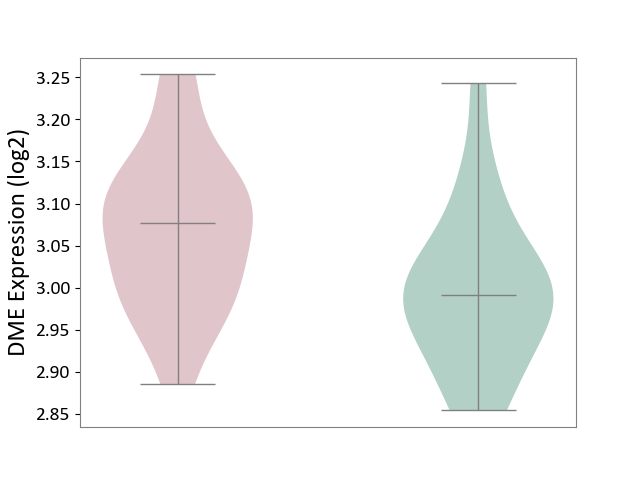
|
Click to View the Clearer Original Diagram | |||
| ICD-11: 8B60 | Motor neuron disease | Click to Show/Hide | |||
| The Studied Tissue | Skin | ||||
| The Specified Disease | Lateral sclerosis [ICD-11:8B60.4] | ||||
| The Expression Level of Disease Section Compare with the Healthy Individual Tissue | p-value: 5.16E-01; Fold-change: 4.53E-02; Z-score: 3.54E-01 | ||||
|
DME expression in the diseased tissue of patients
DME expression in the normal tissue of healthy individuals
|
|||||
| Violin Diagram of DME Disease-specific Protein Abundances |
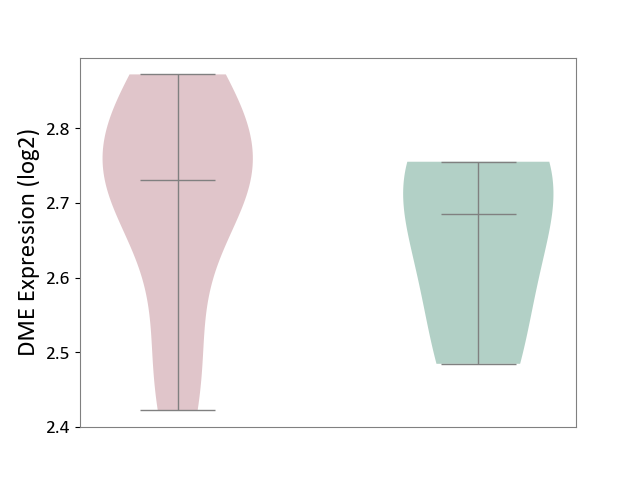
|
Click to View the Clearer Original Diagram | |||
| The Studied Tissue | Cervical spinal cord | ||||
| The Specified Disease | Lateral sclerosis [ICD-11:8B60.4] | ||||
| The Expression Level of Disease Section Compare with the Healthy Individual Tissue | p-value: 2.06E-01; Fold-change: -1.87E-01; Z-score: -6.20E-01 | ||||
|
DME expression in the diseased tissue of patients
DME expression in the normal tissue of healthy individuals
|
|||||
| Violin Diagram of DME Disease-specific Protein Abundances |
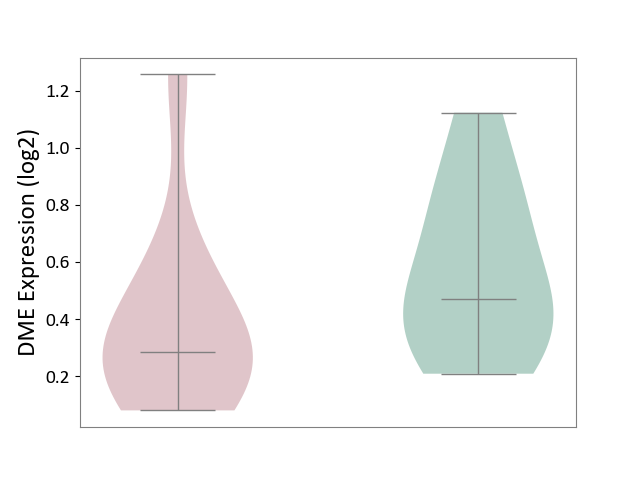
|
Click to View the Clearer Original Diagram | |||
| ICD-11: 8C70 | Muscular dystrophy | Click to Show/Hide | |||
| The Studied Tissue | Muscle tissue | ||||
| The Specified Disease | Myopathy [ICD-11:8C70.6] | ||||
| The Expression Level of Disease Section Compare with the Healthy Individual Tissue | p-value: 7.71E-01; Fold-change: -3.83E-02; Z-score: -2.64E-01 | ||||
|
DME expression in the diseased tissue of patients
DME expression in the normal tissue of healthy individuals
|
|||||
| Violin Diagram of DME Disease-specific Protein Abundances |
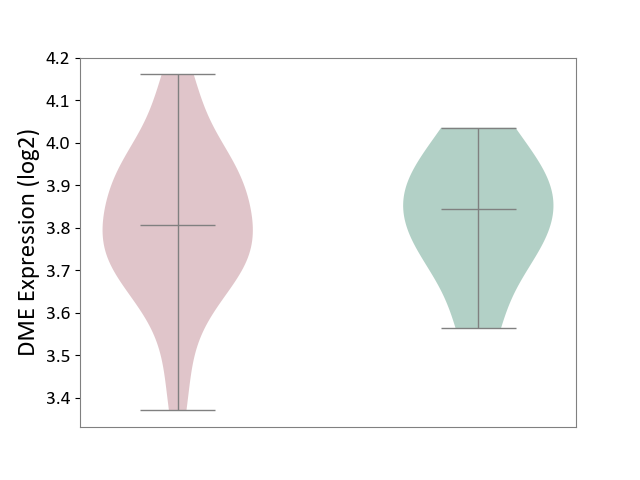
|
Click to View the Clearer Original Diagram | |||
| ICD-11: 8C75 | Distal myopathy | Click to Show/Hide | |||
| The Studied Tissue | Muscle tissue | ||||
| The Specified Disease | Tibial muscular dystrophy [ICD-11:8C75] | ||||
| The Expression Level of Disease Section Compare with the Healthy Individual Tissue | p-value: 1.88E-01; Fold-change: -2.98E-02; Z-score: -1.92E-01 | ||||
|
DME expression in the diseased tissue of patients
DME expression in the normal tissue of healthy individuals
|
|||||
| Violin Diagram of DME Disease-specific Protein Abundances |
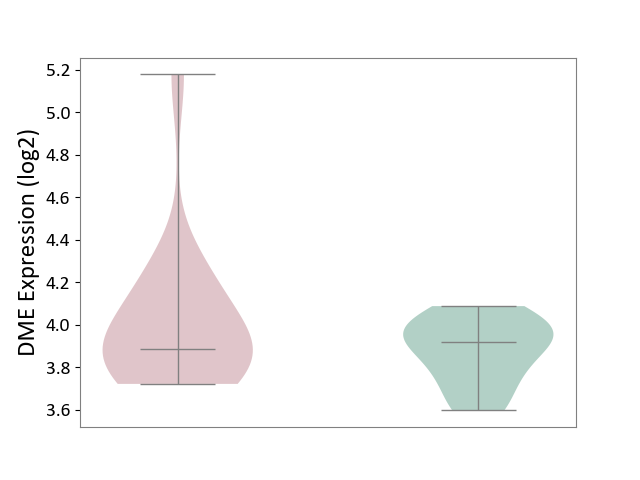
|
Click to View the Clearer Original Diagram | |||
| ICD Disease Classification 09 | Visual system disease | Click to Show/Hide | |||
| ICD-11: 9A96 | Anterior uveitis | Click to Show/Hide | |||
| The Studied Tissue | Peripheral monocyte | ||||
| The Specified Disease | Autoimmune uveitis [ICD-11:9A96] | ||||
| The Expression Level of Disease Section Compare with the Healthy Individual Tissue | p-value: 7.19E-01; Fold-change: 3.01E-03; Z-score: 2.72E-02 | ||||
|
DME expression in the diseased tissue of patients
DME expression in the normal tissue of healthy individuals
|
|||||
| Violin Diagram of DME Disease-specific Protein Abundances |
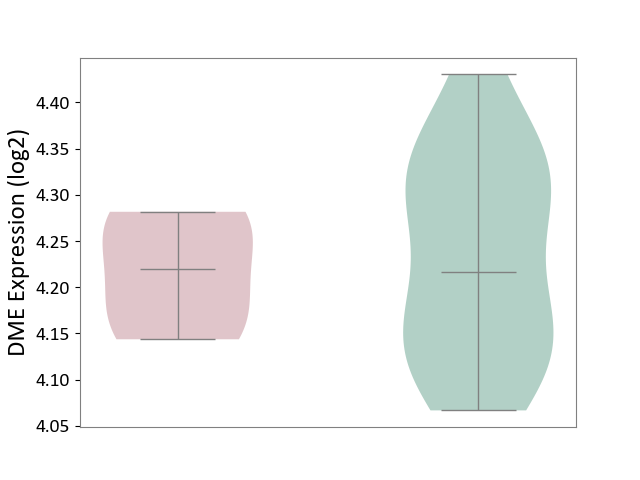
|
Click to View the Clearer Original Diagram | |||
| ICD Disease Classification 11 | Circulatory system disease | Click to Show/Hide | |||
| ICD-11: BA41 | Myocardial infarction | Click to Show/Hide | |||
| The Studied Tissue | Peripheral blood | ||||
| The Specified Disease | Myocardial infarction [ICD-11:BA41-BA50] | ||||
| The Expression Level of Disease Section Compare with the Healthy Individual Tissue | p-value: 4.64E-01; Fold-change: -1.08E-01; Z-score: -1.96E-01 | ||||
|
DME expression in the diseased tissue of patients
DME expression in the normal tissue of healthy individuals
|
|||||
| Violin Diagram of DME Disease-specific Protein Abundances |
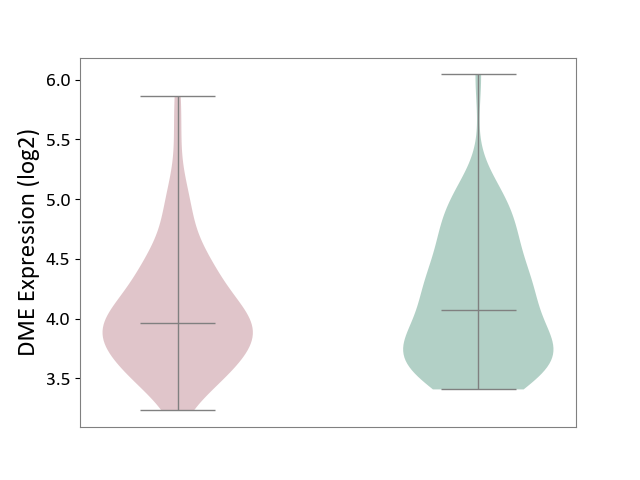
|
Click to View the Clearer Original Diagram | |||
| ICD-11: BA80 | Coronary artery disease | Click to Show/Hide | |||
| The Studied Tissue | Peripheral blood | ||||
| The Specified Disease | Coronary artery disease [ICD-11:BA80-BA8Z] | ||||
| The Expression Level of Disease Section Compare with the Healthy Individual Tissue | p-value: 2.19E-01; Fold-change: -1.51E-01; Z-score: -8.04E-01 | ||||
|
DME expression in the diseased tissue of patients
DME expression in the normal tissue of healthy individuals
|
|||||
| Violin Diagram of DME Disease-specific Protein Abundances |
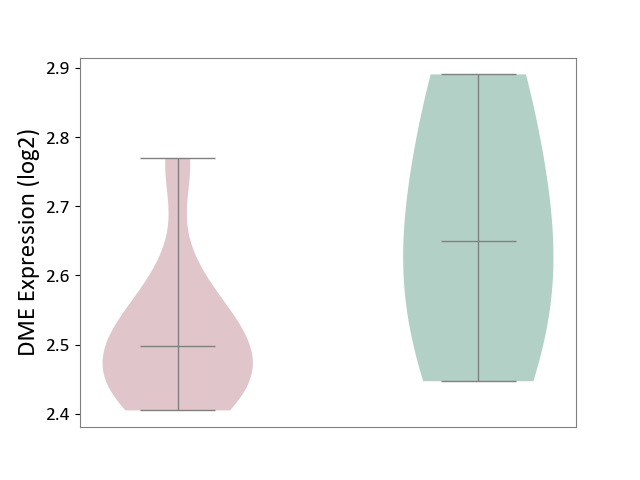
|
Click to View the Clearer Original Diagram | |||
| ICD-11: BB70 | Aortic valve stenosis | Click to Show/Hide | |||
| The Studied Tissue | Calcified aortic valve | ||||
| The Specified Disease | Aortic stenosis [ICD-11:BB70] | ||||
| The Expression Level of Disease Section Compare with the Healthy Individual Tissue | p-value: 6.25E-01; Fold-change: -1.30E-01; Z-score: -2.70E-01 | ||||
|
DME expression in the diseased tissue of patients
DME expression in the normal tissue of healthy individuals
|
|||||
| Violin Diagram of DME Disease-specific Protein Abundances |
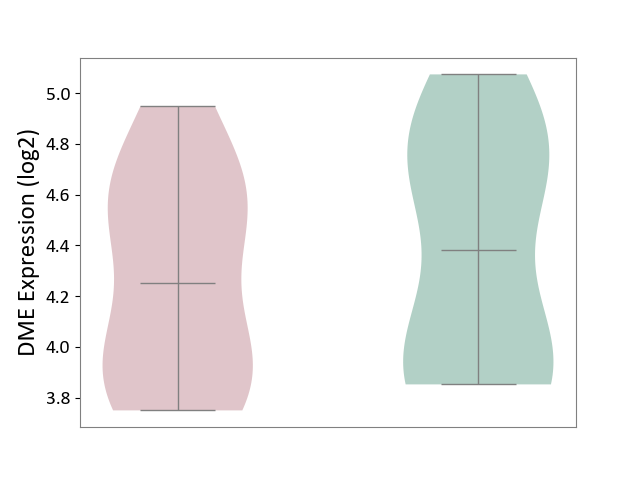
|
Click to View the Clearer Original Diagram | |||
| ICD Disease Classification 12 | Respiratory system disease | Click to Show/Hide | |||
| ICD-11: 7A40 | Central sleep apnoea | Click to Show/Hide | |||
| The Studied Tissue | Hyperplastic tonsil | ||||
| The Specified Disease | Apnea [ICD-11:7A40] | ||||
| The Expression Level of Disease Section Compare with the Healthy Individual Tissue | p-value: 6.74E-01; Fold-change: 1.02E+00; Z-score: 9.58E-01 | ||||
|
DME expression in the diseased tissue of patients
DME expression in the normal tissue of healthy individuals
|
|||||
| Violin Diagram of DME Disease-specific Protein Abundances |
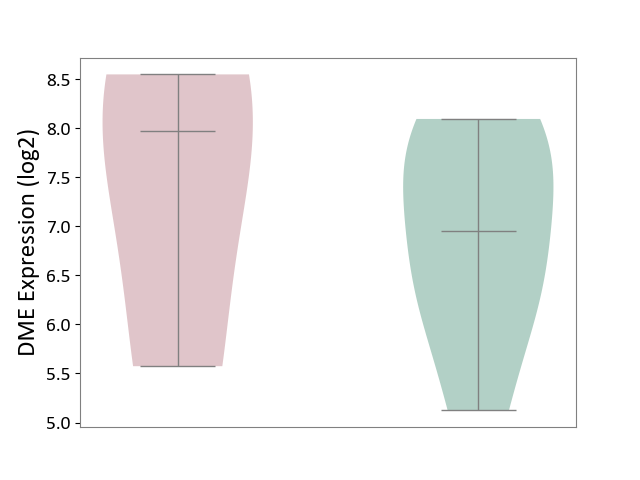
|
Click to View the Clearer Original Diagram | |||
| ICD-11: CA08 | Vasomotor or allergic rhinitis | Click to Show/Hide | |||
| The Studied Tissue | Peripheral blood | ||||
| The Specified Disease | Olive pollen allergy [ICD-11:CA08.00] | ||||
| The Expression Level of Disease Section Compare with the Healthy Individual Tissue | p-value: 5.04E-01; Fold-change: -2.01E-01; Z-score: -2.41E-01 | ||||
|
DME expression in the diseased tissue of patients
DME expression in the normal tissue of healthy individuals
|
|||||
| Violin Diagram of DME Disease-specific Protein Abundances |
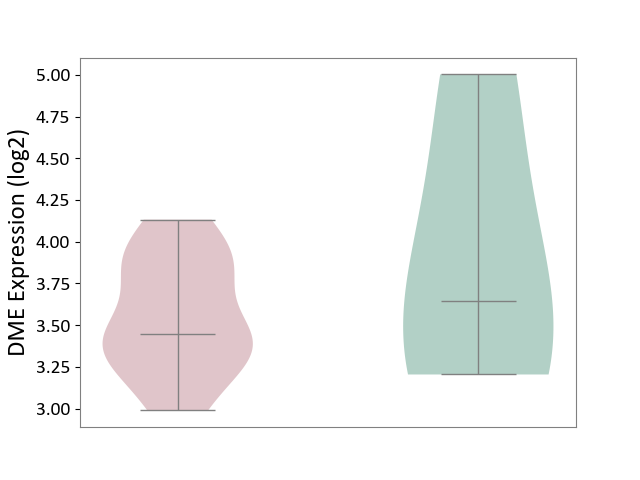
|
Click to View the Clearer Original Diagram | |||
| ICD-11: CA0A | Chronic rhinosinusitis | Click to Show/Hide | |||
| The Studied Tissue | Sinus mucosa tissue | ||||
| The Specified Disease | Chronic rhinosinusitis [ICD-11:CA0A] | ||||
| The Expression Level of Disease Section Compare with the Healthy Individual Tissue | p-value: 5.82E-01; Fold-change: 9.87E-02; Z-score: 2.50E-01 | ||||
|
DME expression in the diseased tissue of patients
DME expression in the normal tissue of healthy individuals
|
|||||
| Violin Diagram of DME Disease-specific Protein Abundances |
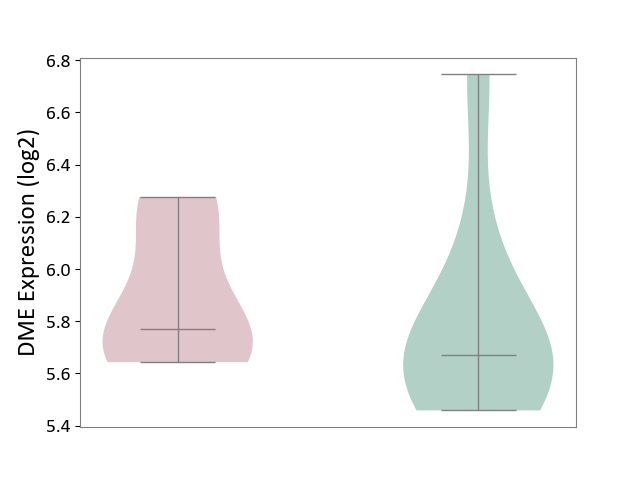
|
Click to View the Clearer Original Diagram | |||
| ICD-11: CA22 | Chronic obstructive pulmonary disease | Click to Show/Hide | |||
| The Studied Tissue | Lung tissue | ||||
| The Specified Disease | Chronic obstructive pulmonary disease [ICD-11:CA22] | ||||
| The Expression Level of Disease Section Compare with the Healthy Individual Tissue | p-value: 6.74E-01; Fold-change: 5.99E-02; Z-score: 7.30E-02 | ||||
|
DME expression in the diseased tissue of patients
DME expression in the normal tissue of healthy individuals
|
|||||
| Violin Diagram of DME Disease-specific Protein Abundances |
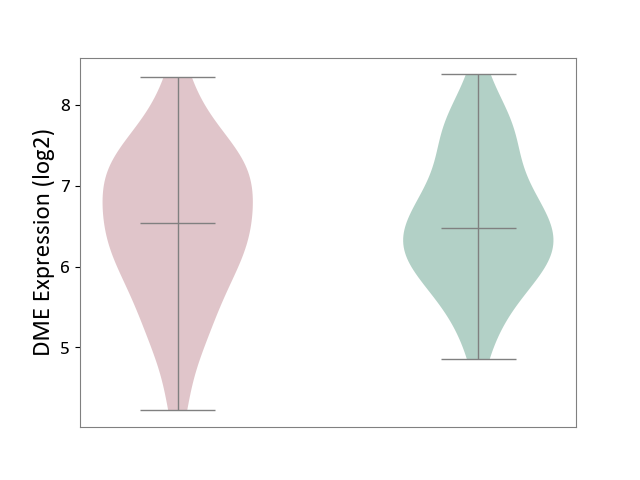
|
Click to View the Clearer Original Diagram | |||
| The Studied Tissue | Small airway epithelium | ||||
| The Specified Disease | Chronic obstructive pulmonary disease [ICD-11:CA22] | ||||
| The Expression Level of Disease Section Compare with the Healthy Individual Tissue | p-value: 3.51E-01; Fold-change: 1.59E-01; Z-score: 2.09E-01 | ||||
|
DME expression in the diseased tissue of patients
DME expression in the normal tissue of healthy individuals
|
|||||
| Violin Diagram of DME Disease-specific Protein Abundances |
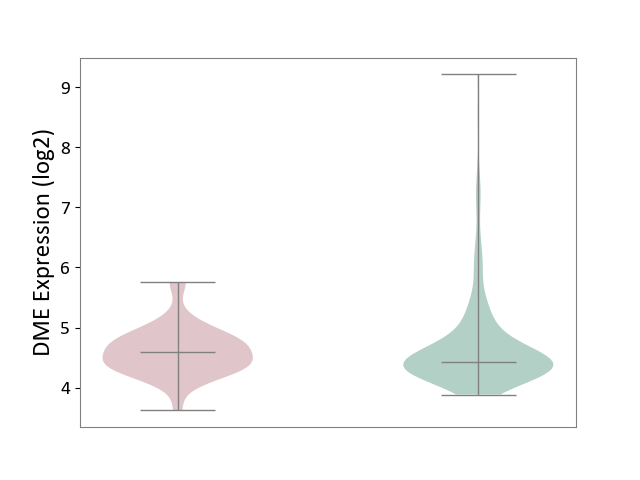
|
Click to View the Clearer Original Diagram | |||
| ICD-11: CA23 | Asthma | Click to Show/Hide | |||
| The Studied Tissue | Nasal and bronchial airway | ||||
| The Specified Disease | Asthma [ICD-11:CA23] | ||||
| The Expression Level of Disease Section Compare with the Healthy Individual Tissue | p-value: 3.85E-05; Fold-change: 8.08E-01; Z-score: 6.07E-01 | ||||
|
DME expression in the diseased tissue of patients
DME expression in the normal tissue of healthy individuals
|
|||||
| Violin Diagram of DME Disease-specific Protein Abundances |
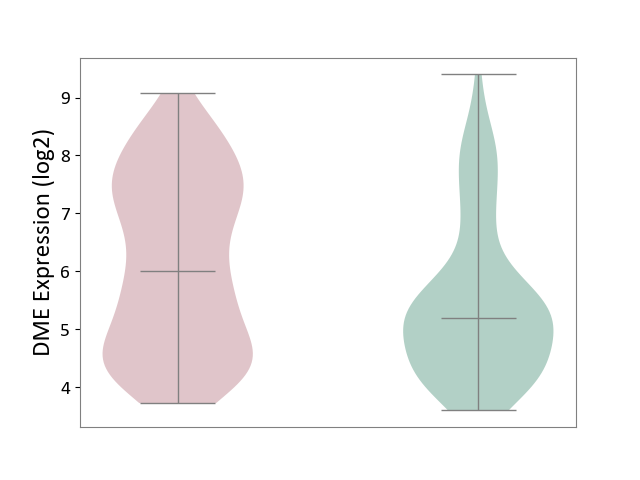
|
Click to View the Clearer Original Diagram | |||
| ICD-11: CB03 | Idiopathic interstitial pneumonitis | Click to Show/Hide | |||
| The Studied Tissue | Lung tissue | ||||
| The Specified Disease | Idiopathic pulmonary fibrosis [ICD-11:CB03.4] | ||||
| The Expression Level of Disease Section Compare with the Healthy Individual Tissue | p-value: 5.47E-02; Fold-change: -1.30E+00; Z-score: -1.39E+00 | ||||
|
DME expression in the diseased tissue of patients
DME expression in the normal tissue of healthy individuals
|
|||||
| Violin Diagram of DME Disease-specific Protein Abundances |
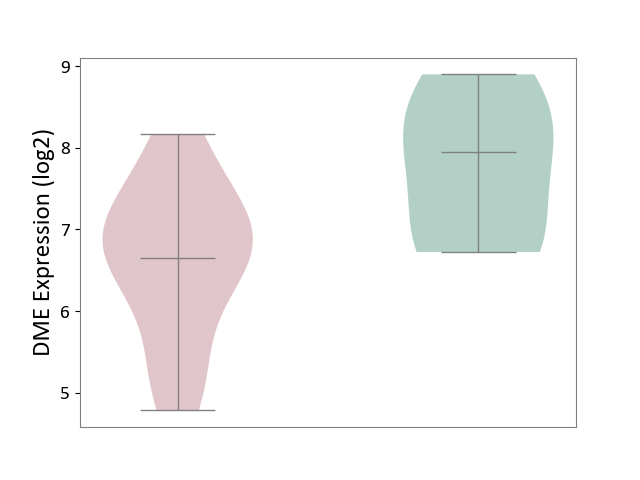
|
Click to View the Clearer Original Diagram | |||
| ICD Disease Classification 13 | Digestive system disease | Click to Show/Hide | |||
| ICD-11: DA0C | Periodontal disease | Click to Show/Hide | |||
| The Studied Tissue | Gingival tissue | ||||
| The Specified Disease | Periodontal disease [ICD-11:DA0C] | ||||
| The Expression Level of Disease Section Compare with the Adjacent Tissue | p-value: 1.89E-14; Fold-change: -1.11E+00; Z-score: -1.43E+00 | ||||
|
DME expression in the diseased tissue of patients
DME expression in the normal tissue adjacent to the diseased tissue of patients
|
|||||
| Violin Diagram of DME Disease-specific Protein Abundances |
|
Click to View the Clearer Original Diagram | |||
| ICD-11: DA42 | Gastritis | Click to Show/Hide | |||
| The Studied Tissue | Gastric antrum tissue | ||||
| The Specified Disease | Eosinophilic gastritis [ICD-11:DA42.2] | ||||
| The Expression Level of Disease Section Compare with the Adjacent Tissue | p-value: 9.63E-02; Fold-change: -6.65E-01; Z-score: -1.05E+00 | ||||
|
DME expression in the diseased tissue of patients
DME expression in the normal tissue adjacent to the diseased tissue of patients
|
|||||
| Violin Diagram of DME Disease-specific Protein Abundances |
|
Click to View the Clearer Original Diagram | |||
| ICD-11: DB92 | Non-alcoholic fatty liver disease | Click to Show/Hide | |||
| The Studied Tissue | Liver tissue | ||||
| The Specified Disease | Non-alcoholic fatty liver disease [ICD-11:DB92] | ||||
| The Expression Level of Disease Section Compare with the Healthy Individual Tissue | p-value: 2.92E-01; Fold-change: 2.42E-01; Z-score: 5.16E-01 | ||||
|
DME expression in the diseased tissue of patients
DME expression in the normal tissue of healthy individuals
|
|||||
| Violin Diagram of DME Disease-specific Protein Abundances |
|
Click to View the Clearer Original Diagram | |||
| ICD-11: DB99 | Hepatic failure | Click to Show/Hide | |||
| The Studied Tissue | Liver tissue | ||||
| The Specified Disease | Liver failure [ICD-11:DB99.7-DB99.8] | ||||
| The Expression Level of Disease Section Compare with the Healthy Individual Tissue | p-value: 1.21E-02; Fold-change: -2.25E+00; Z-score: -2.30E+00 | ||||
|
DME expression in the diseased tissue of patients
DME expression in the normal tissue of healthy individuals
|
|||||
| Violin Diagram of DME Disease-specific Protein Abundances |
|
Click to View the Clearer Original Diagram | |||
| ICD-11: DD71 | Ulcerative colitis | Click to Show/Hide | |||
| The Studied Tissue | Colon mucosal tissue | ||||
| The Specified Disease | Ulcerative colitis [ICD-11:DD71] | ||||
| The Expression Level of Disease Section Compare with the Adjacent Tissue | p-value: 1.88E-01; Fold-change: -4.00E-01; Z-score: -5.56E-01 | ||||
|
DME expression in the diseased tissue of patients
DME expression in tissue other than the diseased tissue of patients
|
|||||
| Violin Diagram of DME Disease-specific Protein Abundances |
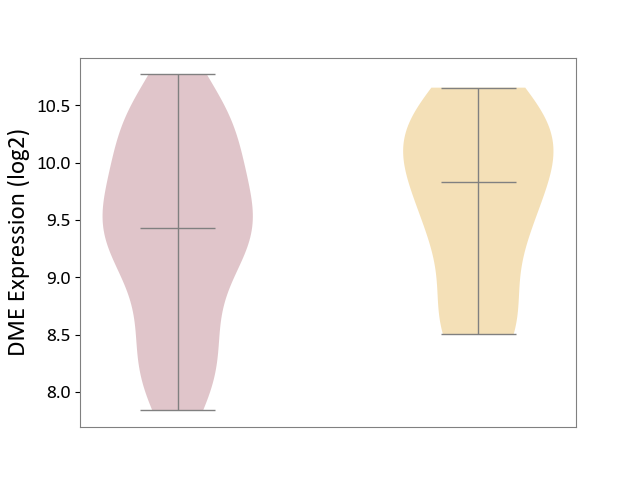
|
Click to View the Clearer Original Diagram | |||
| ICD-11: DD91 | Irritable bowel syndrome | Click to Show/Hide | |||
| The Studied Tissue | Rectal colon tissue | ||||
| The Specified Disease | Irritable bowel syndrome [ICD-11:DD91.0] | ||||
| The Expression Level of Disease Section Compare with the Healthy Individual Tissue | p-value: 8.83E-03; Fold-change: 1.59E-01; Z-score: 4.32E-01 | ||||
|
DME expression in the diseased tissue of patients
DME expression in the normal tissue of healthy individuals
|
|||||
| Violin Diagram of DME Disease-specific Protein Abundances |
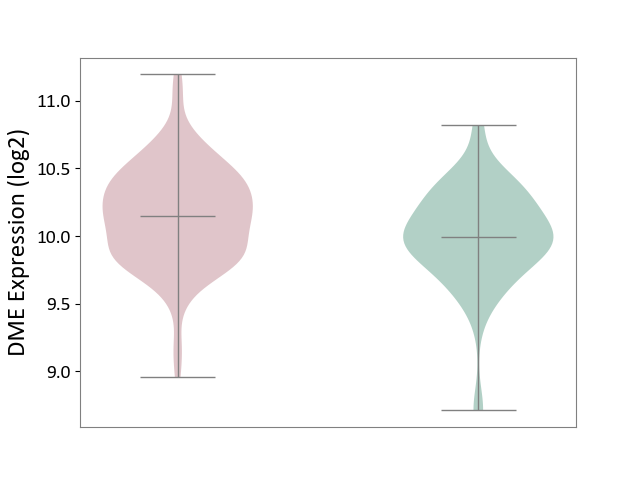
|
Click to View the Clearer Original Diagram | |||
| ICD Disease Classification 14 | Skin disease | Click to Show/Hide | |||
| ICD-11: EA80 | Atopic eczema | Click to Show/Hide | |||
| The Studied Tissue | Skin | ||||
| The Specified Disease | Atopic dermatitis [ICD-11:EA80] | ||||
| The Expression Level of Disease Section Compare with the Healthy Individual Tissue | p-value: 4.44E-01; Fold-change: 1.24E-01; Z-score: 2.44E-01 | ||||
|
DME expression in the diseased tissue of patients
DME expression in the normal tissue of healthy individuals
|
|||||
| Violin Diagram of DME Disease-specific Protein Abundances |
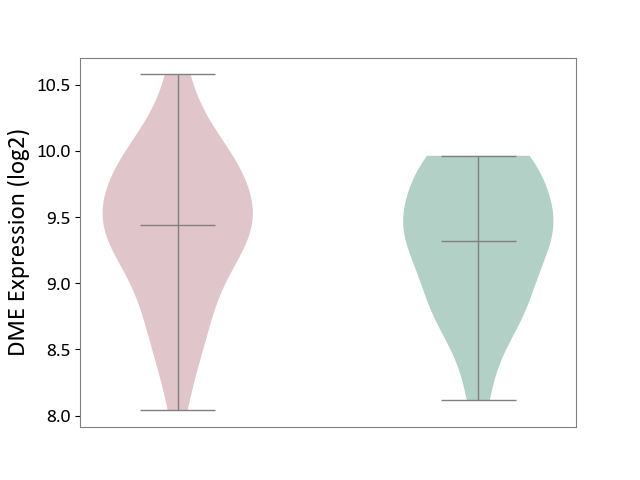
|
Click to View the Clearer Original Diagram | |||
| ICD-11: EA90 | Psoriasis | Click to Show/Hide | |||
| The Studied Tissue | Skin | ||||
| The Specified Disease | Psoriasis [ICD-11:EA90] | ||||
| The Expression Level of Disease Section Compare with the Healthy Individual Tissue | p-value: 5.05E-02; Fold-change: 4.52E-01; Z-score: 5.39E-01 | ||||
| The Expression Level of Disease Section Compare with the Adjacent Tissue | p-value: 6.56E-29; Fold-change: -7.92E-01; Z-score: -2.06E+00 | ||||
|
DME expression in the diseased tissue of patients
DME expression in the normal tissue adjacent to the diseased tissue of patients
DME expression in the normal tissue of healthy individuals
|
|||||
| Violin Diagram of DME Disease-specific Protein Abundances |
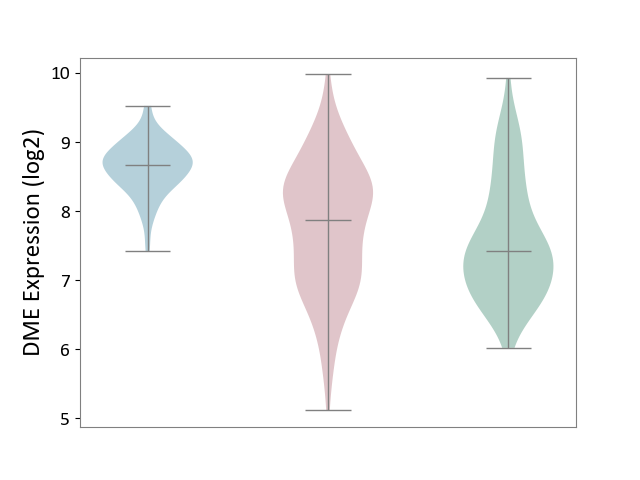
|
Click to View the Clearer Original Diagram | |||
| ICD-11: ED63 | Acquired hypomelanotic disorder | Click to Show/Hide | |||
| The Studied Tissue | Skin | ||||
| The Specified Disease | Vitiligo [ICD-11:ED63.0] | ||||
| The Expression Level of Disease Section Compare with the Healthy Individual Tissue | p-value: 7.99E-01; Fold-change: -2.86E-01; Z-score: -6.73E-01 | ||||
|
DME expression in the diseased tissue of patients
DME expression in the normal tissue of healthy individuals
|
|||||
| Violin Diagram of DME Disease-specific Protein Abundances |
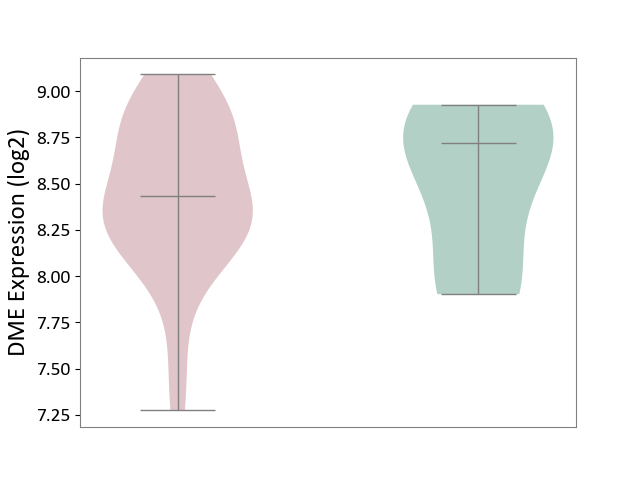
|
Click to View the Clearer Original Diagram | |||
| ICD-11: ED70 | Alopecia or hair loss | Click to Show/Hide | |||
| The Studied Tissue | Skin from scalp | ||||
| The Specified Disease | Alopecia [ICD-11:ED70] | ||||
| The Expression Level of Disease Section Compare with the Healthy Individual Tissue | p-value: 3.45E-01; Fold-change: -7.02E-02; Z-score: -1.65E-01 | ||||
|
DME expression in the diseased tissue of patients
DME expression in the normal tissue of healthy individuals
|
|||||
| Violin Diagram of DME Disease-specific Protein Abundances |
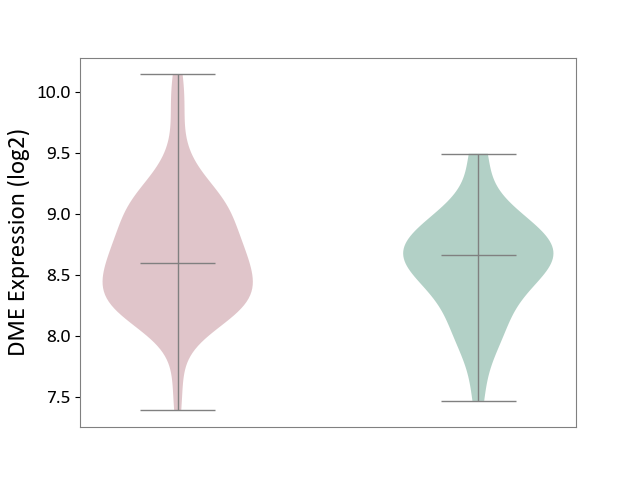
|
Click to View the Clearer Original Diagram | |||
| ICD-11: EK0Z | Contact dermatitis | Click to Show/Hide | |||
| The Studied Tissue | Skin | ||||
| The Specified Disease | Sensitive skin [ICD-11:EK0Z] | ||||
| The Expression Level of Disease Section Compare with the Healthy Individual Tissue | p-value: 1.50E-01; Fold-change: -1.84E-01; Z-score: -5.95E-01 | ||||
|
DME expression in the diseased tissue of patients
DME expression in the normal tissue of healthy individuals
|
|||||
| Violin Diagram of DME Disease-specific Protein Abundances |
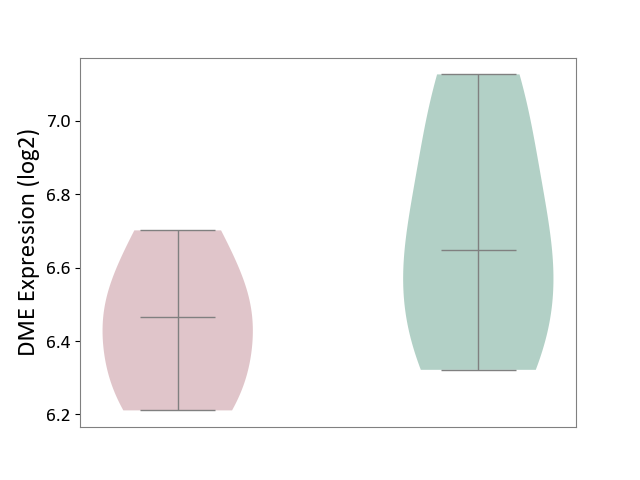
|
Click to View the Clearer Original Diagram | |||
| ICD Disease Classification 15 | Musculoskeletal system/connective tissue disease | Click to Show/Hide | |||
| ICD-11: FA00 | Osteoarthritis | Click to Show/Hide | |||
| The Studied Tissue | Peripheral blood | ||||
| The Specified Disease | Arthropathy [ICD-11:FA00-FA5Z] | ||||
| The Expression Level of Disease Section Compare with the Healthy Individual Tissue | p-value: 1.39E-01; Fold-change: 1.04E-01; Z-score: 7.07E-01 | ||||
|
DME expression in the diseased tissue of patients
DME expression in the normal tissue of healthy individuals
|
|||||
| Violin Diagram of DME Disease-specific Protein Abundances |
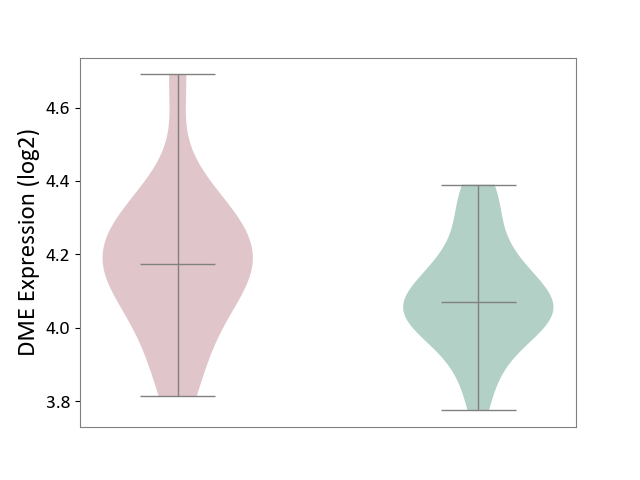
|
Click to View the Clearer Original Diagram | |||
| The Studied Tissue | Synovial tissue | ||||
| The Specified Disease | Osteoarthritis [ICD-11:FA00-FA0Z] | ||||
| The Expression Level of Disease Section Compare with the Healthy Individual Tissue | p-value: 5.31E-01; Fold-change: 7.01E-02; Z-score: 1.11E-01 | ||||
|
DME expression in the diseased tissue of patients
DME expression in the normal tissue of healthy individuals
|
|||||
| Violin Diagram of DME Disease-specific Protein Abundances |
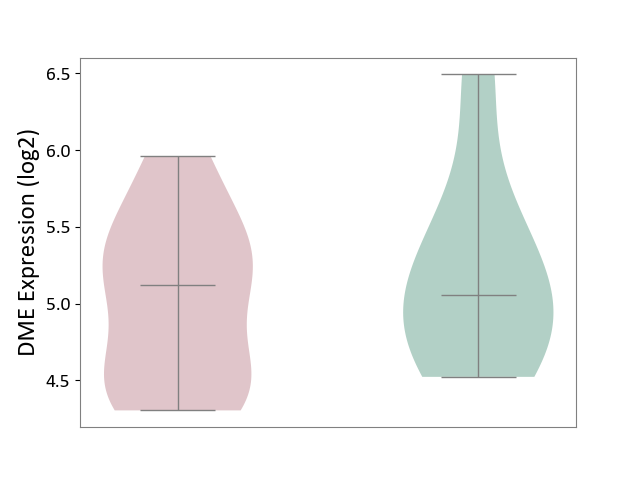
|
Click to View the Clearer Original Diagram | |||
| ICD-11: FA20 | Rheumatoid arthritis | Click to Show/Hide | |||
| The Studied Tissue | Peripheral blood | ||||
| The Specified Disease | Childhood onset rheumatic disease [ICD-11:FA20.Z] | ||||
| The Expression Level of Disease Section Compare with the Healthy Individual Tissue | p-value: 2.36E-01; Fold-change: -1.71E-03; Z-score: -1.84E-02 | ||||
|
DME expression in the diseased tissue of patients
DME expression in the normal tissue of healthy individuals
|
|||||
| Violin Diagram of DME Disease-specific Protein Abundances |
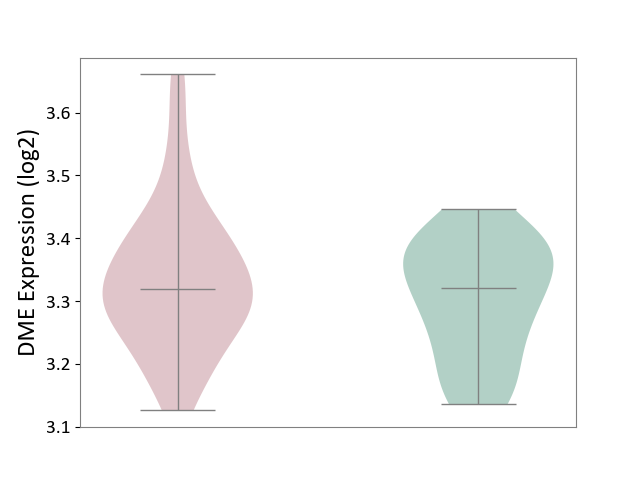
|
Click to View the Clearer Original Diagram | |||
| The Studied Tissue | Synovial tissue | ||||
| The Specified Disease | Rheumatoid arthritis [ICD-11:FA20] | ||||
| The Expression Level of Disease Section Compare with the Healthy Individual Tissue | p-value: 1.34E-01; Fold-change: -2.79E-01; Z-score: -7.05E-01 | ||||
|
DME expression in the diseased tissue of patients
DME expression in the normal tissue of healthy individuals
|
|||||
| Violin Diagram of DME Disease-specific Protein Abundances |
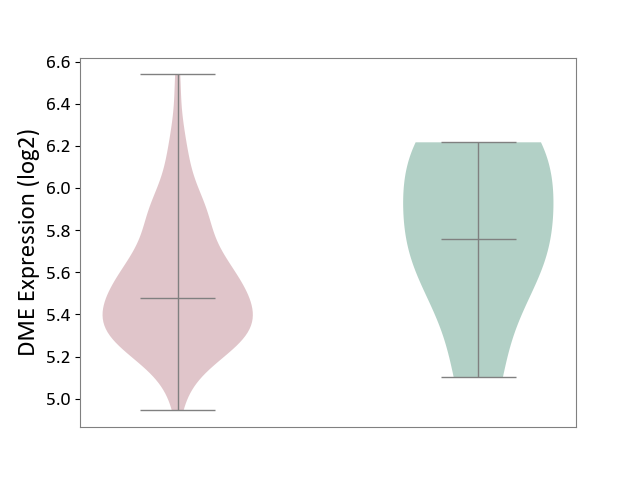
|
Click to View the Clearer Original Diagram | |||
| ICD-11: FA24 | Juvenile idiopathic arthritis | Click to Show/Hide | |||
| The Studied Tissue | Peripheral blood | ||||
| The Specified Disease | Juvenile idiopathic arthritis [ICD-11:FA24] | ||||
| The Expression Level of Disease Section Compare with the Healthy Individual Tissue | p-value: 2.02E-01; Fold-change: -1.29E-02; Z-score: -4.99E-02 | ||||
|
DME expression in the diseased tissue of patients
DME expression in the normal tissue of healthy individuals
|
|||||
| Violin Diagram of DME Disease-specific Protein Abundances |
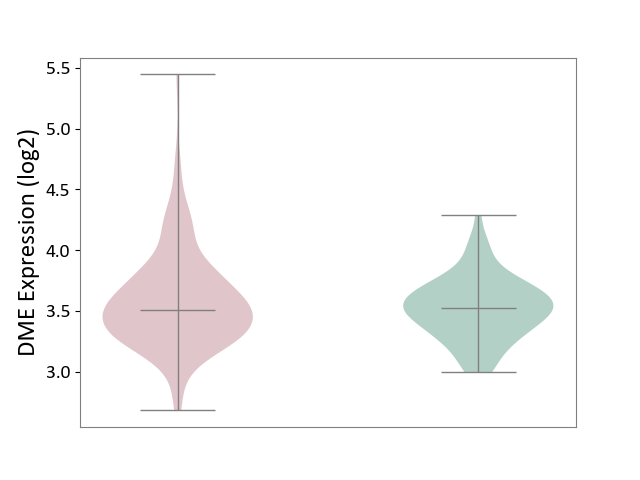
|
Click to View the Clearer Original Diagram | |||
| ICD-11: FA92 | Inflammatory spondyloarthritis | Click to Show/Hide | |||
| The Studied Tissue | Pheripheral blood | ||||
| The Specified Disease | Ankylosing spondylitis [ICD-11:FA92.0Z] | ||||
| The Expression Level of Disease Section Compare with the Healthy Individual Tissue | p-value: 1.81E-01; Fold-change: -4.28E-02; Z-score: -4.55E-01 | ||||
|
DME expression in the diseased tissue of patients
DME expression in the normal tissue of healthy individuals
|
|||||
| Violin Diagram of DME Disease-specific Protein Abundances |
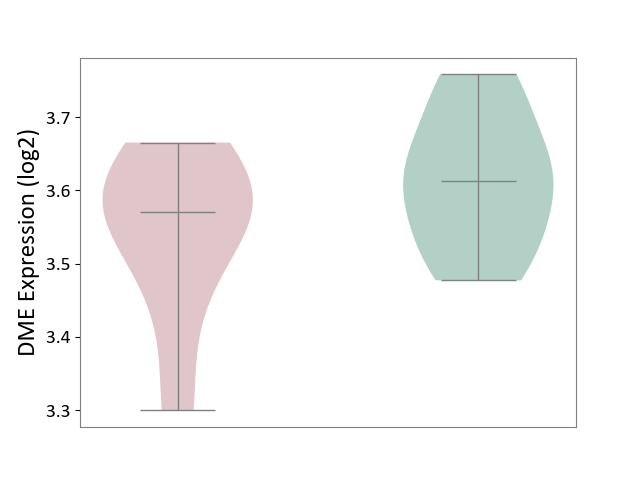
|
Click to View the Clearer Original Diagram | |||
| ICD-11: FB83 | Low bone mass disorder | Click to Show/Hide | |||
| The Studied Tissue | Bone marrow | ||||
| The Specified Disease | Osteoporosis [ICD-11:FB83.1] | ||||
| The Expression Level of Disease Section Compare with the Healthy Individual Tissue | p-value: 1.49E-01; Fold-change: 1.04E-01; Z-score: 1.68E+00 | ||||
|
DME expression in the diseased tissue of patients
DME expression in the normal tissue of healthy individuals
|
|||||
| Violin Diagram of DME Disease-specific Protein Abundances |
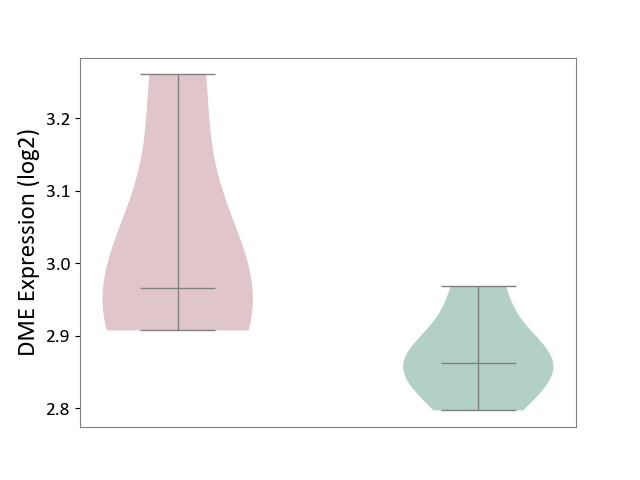
|
Click to View the Clearer Original Diagram | |||
| ICD Disease Classification 16 | Genitourinary system disease | Click to Show/Hide | |||
| ICD-11: GA10 | Endometriosis | Click to Show/Hide | |||
| The Studied Tissue | Endometrium tissue | ||||
| The Specified Disease | Endometriosis [ICD-11:GA10] | ||||
| The Expression Level of Disease Section Compare with the Healthy Individual Tissue | p-value: 3.74E-03; Fold-change: -6.47E-02; Z-score: -1.18E-01 | ||||
|
DME expression in the diseased tissue of patients
DME expression in the normal tissue of healthy individuals
|
|||||
| Violin Diagram of DME Disease-specific Protein Abundances |
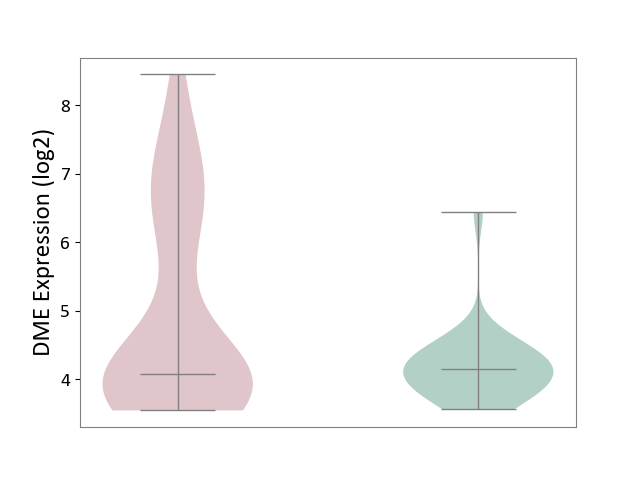
|
Click to View the Clearer Original Diagram | |||
| ICD-11: GC00 | Cystitis | Click to Show/Hide | |||
| The Studied Tissue | Bladder tissue | ||||
| The Specified Disease | Interstitial cystitis [ICD-11:GC00.3] | ||||
| The Expression Level of Disease Section Compare with the Healthy Individual Tissue | p-value: 8.33E-04; Fold-change: -2.94E+00; Z-score: -5.55E+00 | ||||
|
DME expression in the diseased tissue of patients
DME expression in the normal tissue of healthy individuals
|
|||||
| Violin Diagram of DME Disease-specific Protein Abundances |
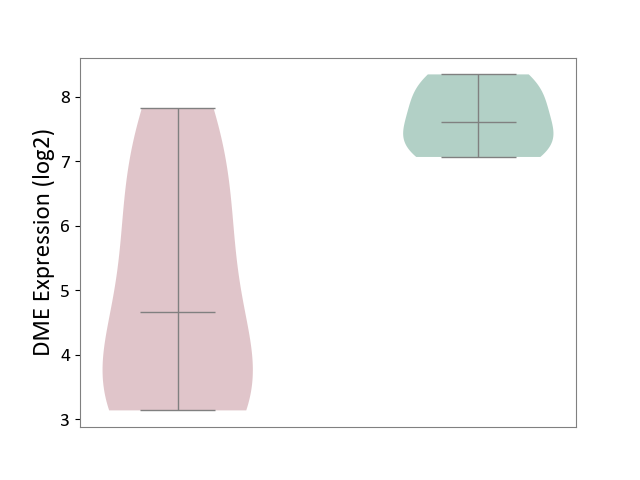
|
Click to View the Clearer Original Diagram | |||
| ICD Disease Classification 19 | Condition originating in perinatal period | Click to Show/Hide | |||
| ICD-11: KA21 | Short gestation disorder | Click to Show/Hide | |||
| The Studied Tissue | Myometrium | ||||
| The Specified Disease | Preterm birth [ICD-11:KA21.4Z] | ||||
| The Expression Level of Disease Section Compare with the Healthy Individual Tissue | p-value: 6.54E-01; Fold-change: -1.92E-01; Z-score: -5.38E-01 | ||||
|
DME expression in the diseased tissue of patients
DME expression in the normal tissue of healthy individuals
|
|||||
| Violin Diagram of DME Disease-specific Protein Abundances |
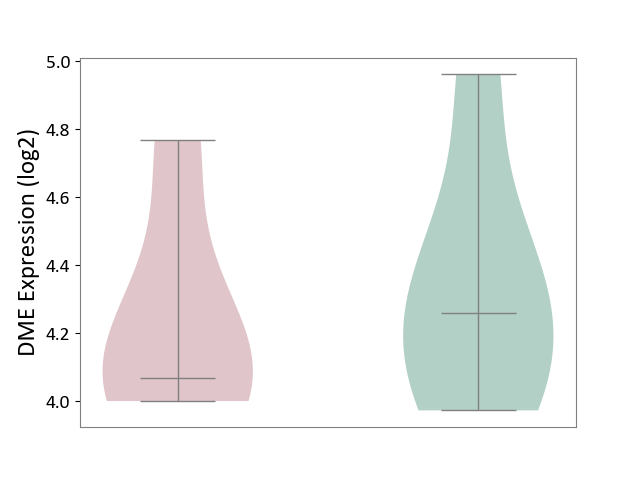
|
Click to View the Clearer Original Diagram | |||
| ICD Disease Classification 20 | Developmental anomaly | Click to Show/Hide | |||
| ICD-11: LD2C | Overgrowth syndrome | Click to Show/Hide | |||
| The Studied Tissue | Adipose tissue | ||||
| The Specified Disease | Simpson golabi behmel syndrome [ICD-11:LD2C] | ||||
| The Expression Level of Disease Section Compare with the Healthy Individual Tissue | p-value: 5.57E-01; Fold-change: 5.26E-02; Z-score: 5.21E-01 | ||||
|
DME expression in the diseased tissue of patients
DME expression in the normal tissue of healthy individuals
|
|||||
| Violin Diagram of DME Disease-specific Protein Abundances |
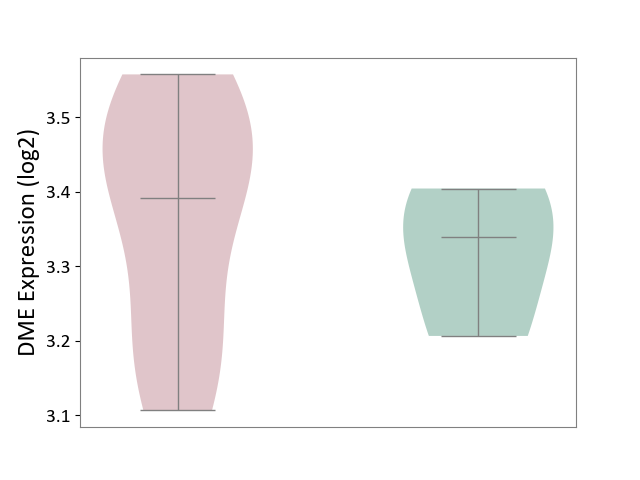
|
Click to View the Clearer Original Diagram | |||
| ICD-11: LD2D | Phakomatoses/hamartoneoplastic syndrome | Click to Show/Hide | |||
| The Studied Tissue | Perituberal tissue | ||||
| The Specified Disease | Tuberous sclerosis complex [ICD-11:LD2D.2] | ||||
| The Expression Level of Disease Section Compare with the Healthy Individual Tissue | p-value: 2.85E-02; Fold-change: 1.19E-01; Z-score: 3.43E+00 | ||||
|
DME expression in the diseased tissue of patients
DME expression in the normal tissue of healthy individuals
|
|||||
| Violin Diagram of DME Disease-specific Protein Abundances |
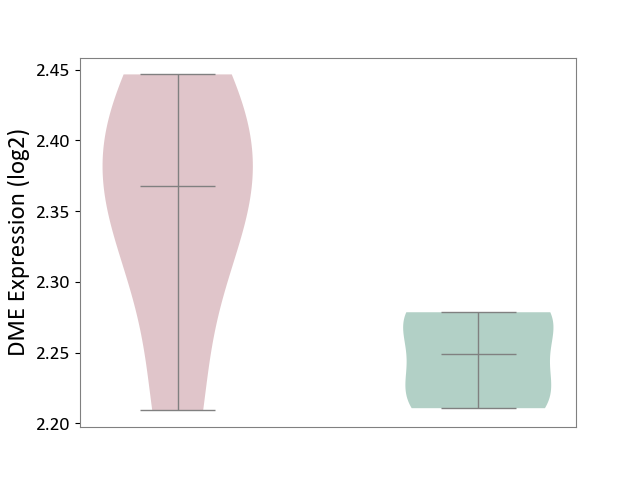
|
Click to View the Clearer Original Diagram | |||
| References | |||||
|---|---|---|---|---|---|
| 1 | Human liver microsomal cytochrome P450 3A enzymes involved in thalidomide 5-hydroxylation and formation of a glutathione conjugate. Chem Res Toxicol. 2010 Jun 21;23(6):1018-24. | ||||
| 2 | Pharmacokinetics and pharmacodynamics of GS-9350: a novel pharmacokinetic enhancer without anti-HIV activity. Clin Pharmacol Ther. 2010 Mar;87(3):322-9. | ||||
| 3 | Polymorphisms in cytochrome P4503A5 (CYP3A5) may be associated with race and tumor characteristics, but not metabolism and side effects of tamoxifen in breast cancer patients. Cancer Lett. 2005 Jan 10;217(1):61-72. | ||||
| 4 | Metabolism and pharmacokinetics of novel selective vascular endothelial growth factor receptor-2 inhibitor apatinib in humans | ||||
| 5 | Clinical pharmacokinetics of tyrosine kinase inhibitors. Cancer Treat Rev. 2009 Dec;35(8):692-706. | ||||
| 6 | Cytochrome P450-mediated metabolism of estrogens and its regulation in human Cancer Lett. 2005 Sep 28;227(2):115-24. doi: 10.1016/j.canlet.2004.10.007. | ||||
| 7 | A potential role for the estrogen-metabolizing cytochrome P450 enzymes in human breast carcinogenesis. Breast Cancer Res Treat. 2003 Dec;82(3):191-7. | ||||
| 8 | Drug Interactions Flockhart Table | ||||
| 9 | 16Alpha-hydroxylation of estrone by human cytochrome P4503A4/5. Carcinogenesis. 1998 May;19(5):867-72. | ||||
| 10 | Atazanavir: effects on P-glycoprotein transport and CYP3A metabolism in vitro. Drug Metab Dispos. 2005 Jun;33(6):764-70. | ||||
| 11 | Regenerative changes in hepatic morphology and enhanced expression of CYP2B10 and CYP3A during daily administration of cocaine. Hepatology. 1996 Mar;23(3):515-23. | ||||
| 12 | PubChem:Pimavanserin | ||||
| 13 | Absorption, Metabolism, and Excretion, In Vitro Pharmacology, and Clinical Pharmacokinetics of Ozanimod, a Novel Sphingosine 1-Phosphate Receptor Modulator | ||||
| 14 | Daclatasvir: a NS5A replication complex inhibitor for hepatitis C infection. Ann Pharmacother. 2016 Jan;50(1):39-46. | ||||
| 15 | Pharmacokinetic and pharmacoimmunodynamic interactions between prednisolone and sirolimus in adrenalectomized rats. J Pharmacokinet Biopharm. 1999 Feb;27(1):1-21. | ||||
| 16 | Construction and verification of CYP3A5 gene polymorphisms using a Saccharomyces cerevisiae expression system to predict drug metabolism. Mol Med Rep. 2017 Apr;15(4):1593-1600. | ||||
| 17 | Absorption, metabolism, and excretion of oral 14C radiolabeled ibrutinib: an open-label, phase I, single-dose study in healthy men. Drug Metab Dispos. 2015 Feb;43(2):289-97. | ||||
| 18 | Exploring the metabolism of loxoprofen in liver microsomes: the role of cytochrome P450 and UDP-glucuronosyltransferase in its biotransformation. Pharmaceutics. 2018 Aug 2;10(3). pii: E112. | ||||
| 19 | Substrates, inducers, inhibitors and structure-activity relationships of human Cytochrome P450 2C9 and implications in drug development. Curr Med Chem. 2009;16(27):3480-675. | ||||
| 20 | In vitro metabolism of montelukast by cytochrome P450s and UDP-glucuronosyltransferases. Drug Metab Dispos. 2015 Dec;43(12):1905-16. | ||||
| 21 | Human prostate CYP3A5: identification of a unique 5'-untranslated sequence and characterization of purified recombinant protein. Biochem Biophys Res Commun. 1999 Jul 14;260(3):676-81. | ||||
| 22 | FDA label of Acalabrutinib. The 2020 official website of the U.S. Food and Drug Administration. | ||||
| 23 | Crizotinib for the treatment of non-small-cell lung cancer. Am J Health Syst Pharm. 2013 Jun 1;70(11):943-7. | ||||
| 24 | Clinical pharmacokinetics of imatinib. Clin Pharmacokinet. 2005;44(9):879-94. | ||||
| 25 | The role of human cytochrome P450 enzymes in the formation of 2-hydroxymetronidazole: CYP2A6 is the high affinity (low Km) catalyst. Drug Metab Dispos. 2013 Sep;41(9):1686-94. | ||||
| 26 | Exogenous cannabinoids as substrates, inhibitors, and inducers of human drug metabolizing enzymes: a systematic review. Drug Metab Rev. 2014 Feb;46(1):86-95. | ||||
| 27 | CYP3A4*18B and CYP3A5*3 polymorphisms contribute to pharmacokinetic variability of cyclosporine among healthy Chinese subjects. Eur J Pharm Sci. 2015 Aug 30;76:238-44. | ||||
| 28 | Metabolic Pathway of Cyclosporine A and Its Correlation with Nephrotoxicity | ||||
| 29 | Characterisation of the absorption, distribution, metabolism, excretion and mass balance of doravirine, a non-nucleoside reverse transcriptase inhibitor in humans. Xenobiotica. 2019 Apr;49(4):422-432. | ||||
| 30 | Sulfotransferase 1E1 is a low km isoform mediating the 3-O-sulfation of ethinyl estradiol Drug Metab Dispos. 2004 Nov;32(11):1299-303. doi: 10.1124/dmd.32.11.. | ||||
| 31 | Enhanced cyclophosphamide and ifosfamide activation in primary human hepatocyte cultures: response to cytochrome P-450 inducers and autoinduction by oxazaphosphorines. Cancer Res. 1997 May 15;57(10):1946-54. | ||||
| 32 | PharmGKB summary: mycophenolic acid pathway. Pharmacogenet Genomics. 2014 Jan;24(1):73-9. | ||||
| 33 | Cytochromes P450 1A2 and 3A4 Catalyze the Metabolic Activation of Sunitinib | ||||
| 34 | Tacrolimus pharmacokinetics and pharmacogenetics: influence of adenosine triphosphate-binding cassette B1 (ABCB1) and cytochrome (CYP) 3A polymorphisms. Fundam Clin Pharmacol. 2007 Aug;21(4):427-35. | ||||
| 35 | Identification of human cytochrome P450s involved in the formation of all-trans-retinoic acid principal metabolites. Mol Pharmacol. 2000 Dec;58(6):1341-8. | ||||
| 36 | DAILYMED.nlm.nih.gov: JEVTANA- cabazitaxel kit. | ||||
| 37 | Identification of the human P-450 enzymes responsible for the sulfoxidation and thiono-oxidation of diethyldithiocarbamate methyl ester: role of P-450 enzymes in disulfiram bioactivation. Alcohol Clin Exp Res. 1998 Sep;22(6):1212-9. | ||||
| 38 | Product Monograph of Xtandi. | ||||
| 39 | Quantitative contribution of CYP2D6 and CYP3A to oxycodone metabolism in human liver and intestinal microsomes. Drug Metab Dispos. 2004 Apr;32(4):447-54. | ||||
| 40 | Comparison of cytochrome P-450-dependent metabolism and drug interactions of the 3-hydroxy-3-methylglutaryl-CoA reductase inhibitors lovastatin and pravastatin in the liver. Drug Metab Dispos. 1999 Feb;27(2):173-9. | ||||
| 41 | Pharmacology of the new target-specific oral anticoagulants. J Thromb Thrombolysis. 2013 Aug;36(2):133-40. | ||||
| 42 | The pharmacology and clinical pharmacokinetics of apomorphine SL BJU Int. 2001 Oct;88 Suppl 3:18-21. doi: 10.1046/j.1464-4096.2001.00124.x. | ||||
| 43 | Activation of beclomethasone dipropionate by hydrolysis to beclomethasone-17-monopropionate | ||||
| 44 | Degradation products of beclomethasone dipropionate in human plasma | ||||
| 45 | Comparative kinetics of metabolism of beclomethasone propionate esters in human lung homogenates and plasma | ||||
| 46 | Genetic polymorphism of cytochrome P450 2D6 determines oestrogen receptor activity of the major infertility drug clomiphene via its active metabolites | ||||
| 47 | CYP3A Specifically Catalyzes 1-Hydroxylation of Deoxycholic Acid: Characterization and Enzymatic Synthesis of a Potential Novel Urinary Biomarker for CYP3A Activity | ||||
| 48 | CYP3A5 genotype is associated with elevated blood pressure. Pharmacogenet Genomics. 2005 Oct;15(10):737-41. | ||||
| 49 | Enzymes in addition to CYP3A4 and 3A5 mediate N-demethylation of dextromethorphan in human liver microsomes. Biopharm Drug Dispos. 1999 Oct;20(7):341-6. | ||||
| 50 | Metabolic Disposition of Osimertinib in Rats, Dogs, and Humans: Insights into a Drug Designed to Bind Covalently to a Cysteine Residue of Epidermal Growth Factor Receptor Drug Metab Dispos. 2016 Aug;44(8):1201-12. doi: 10.1124/dmd.115.069203. | ||||
| 51 | FDA label of Perampanel. The 2020 official website of the U.S. Food and Drug Administration. | ||||
| 52 | Mass balance, pharmacokinetics and metabolism of the selective S1P1 receptor modulator ponesimod in humans | ||||
| 53 | DrugBank(Pharmacology-Metabolism):Ponesimod | ||||
| 54 | Verapamil toxicity resulting from a probable interaction with telithromycin. Ann Pharmacother. 2005 Feb;39(2):357-60. | ||||
| 55 | O-demethylation of epipodophyllotoxins is catalyzed by human cytochrome P450 3A4. Mol Pharmacol. 1994 Feb;45(2):352-8. | ||||
| 56 | Absorption, distribution, metabolism, and excretion of ticagrelor in healthy subjects. Drug Metab Dispos. 2010 Sep;38(9):1514-21. | ||||
| 57 | Metabolism of ticagrelor in patients with acute coronary syndromes | ||||
| 58 | Elimination of tucatinib, a small molecule kinase inhibitor of HER2, is primarily governed by CYP2C8 enantioselective oxidation of gem-dimethyl | ||||
| 59 | Influence of CYP3A5 genotype on the pharmacokinetics and pharmacodynamics of the cytochrome P4503A probes alfentanil and midazolam. Clin Pharmacol Ther. 2007 Oct;82(4):410-26. | ||||
| 60 | Metabolism of beta-arteether to dihydroqinghaosu by human liver microsomes and recombinant cytochrome P450 | ||||
| 61 | Clinical pharmacology of axitinib. Clin Pharmacokinet. 2013 Sep;52(9):713-25. | ||||
| 62 | Interaction of cisapride with the human cytochrome P450 system: metabolism and inhibition studies. Drug Metab Dispos. 2000 Jul;28(7):789-800. | ||||
| 63 | Summary of information on human CYP enzymes: human P450 metabolism data. Drug Metab Rev. 2002 Feb-May;34(1-2):83-448. | ||||
| 64 | Eight inhibitory monoclonal antibodies define the role of individual P-450s in human liver microsomal diazepam, 7-ethoxycoumarin, and imipramine metabolism. Drug Metab Dispos. 1999 Jan;27(1):102-9. | ||||
| 65 | Pharmacogenomics as molecular autopsy for forensic toxicology: genotyping cytochrome P450 3A4*1B and 3A5*3 for 25 fentanyl cases J Anal Toxicol. 2005 Oct;29(7):590-8. doi: 10.1093/jat/29.7.590. | ||||
| 66 | Identification of a novel glutathione conjugate of flutamide in incubations with human liver microsomes. Drug Metab Dispos. 2007 Jul;35(7):1081-8. | ||||
| 67 | Assessment of the contributions of CYP3A4 and CYP3A5 in the metabolism of the antipsychotic agent haloperidol to its potentially neurotoxic pyridinium metabolite and effect of antidepressants on the bioactivation pathway. Drug Metab Dispos. 2003 Mar;31(3):243-9. | ||||
| 68 | Identification of the human P450 enzymes involved in lansoprazole metabolism J Pharmacol Exp Ther. 1996 May;277(2):805-16. | ||||
| 69 | Disposition of lasofoxifene, a next-generation selective estrogen receptor modulator, in healthy male subjects | ||||
| 70 | DrugBank(Pharmacology-Metabolism):Lasofoxifene | ||||
| 71 | [Influence of CYP3A4/5 polymorphisms in the pharmacokinetics of levonorgestrel: a pilot study] Biomedica. 2012 Oct-Dec;32(4):570-7. doi: 10.1590/S0120-41572012000400012. | ||||
| 72 | The interaction between St John's wort and an oral contraceptive. Clin Pharmacol Ther. 2003 Dec;74(6):525-35. | ||||
| 73 | Multiple forms of cytochrome P450 are involved in the metabolism of ondansetron in humans. Drug Metab Dispos. 1995 Nov;23(11):1225-30. | ||||
| 74 | The influence of diltiazem versus cimetidine on propranolol metabolism. J Clin Pharmacol. 1992 Dec;32(12):1099-104. | ||||
| 75 | Differential mechanism-based inhibition of CYP3A4 and CYP3A5 by verapamil. Drug Metab Dispos. 2005 May;33(5):664-71. | ||||
| 76 | Effects of cytochrome b(5) on drug oxidation activities of human cytochrome P450 (CYP) 3As: similarity of CYP3A5 with CYP3A4 but not CYP3A7. Biochem Pharmacol. 2003 Dec 15;66(12):2333-40. | ||||
| 77 | Oxidative metabolism of amprenavir in the human liver. Effect of the CYP3A maturation. Drug Metab Dispos. 2003 Mar;31(3):275-81. | ||||
| 78 | Effect of pharmacogenetics on plasma lumefantrine pharmacokinetics and malaria treatment outcome in pregnant women. Malar J. 2017 Jul 3;16(1):267. | ||||
| 79 | Metabolite Profiling and Reaction Phenotyping for the in Vitro Assessment of the Bioactivation of Bromfenac ? Chem Res Toxicol. 2020 Jan 21;33(1):249-257. doi: 10.1021/acs.chemrestox.9b00268. | ||||
| 80 | Cytochrome P450 3A-mediated metabolism of buspirone in human liver microsomes. Drug Metab Dispos. 2005 Apr;33(4):500-7. | ||||
| 81 | Induction of CYP3As in HepG2 cells by several drugs. Association between induction of CYP3A4 and expression of glucocorticoid receptor. Biol Pharm Bull. 2003 Apr;26(4):510-7. | ||||
| 82 | FDA label of Cenobamate. The 2020 official website of the U.S. Food and Drug Administration. | ||||
| 83 | Comparative pharmacokinetics and metabolism studies in lean and diet- induced obese mice: an animal efficacy model for 11beta-hydroxysteroid dehydrogenase type 1 (11beta-HSD1) inhibitors. Drug Metab Lett. 2011 Jan;5(1):55-63. | ||||
| 84 | Significant impacts of CYP3A4*1G and CYP3A5*3 genetic polymorphisms on the pharmacokinetics of diltiazem and its main metabolites in Chinese adult kidney transplant patients. J Clin Pharm Ther. 2016 Jun;41(3):341-7. | ||||
| 85 | Drug related genetic polymorphisms affecting adverse reactions to methotrexate, vinblastine, doxorubicin and cisplatin in patients with urothelial cancer. J Urol. 2008 Dec;180(6):2389-95. | ||||
| 86 | Inactivation of human cytochrome P450 3A4 and 3A5 by dronedarone and N-desbutyl dronedarone. Mol Pharmacol. 2016 Jan;89(1):1-13. | ||||
| 87 | (R)-, (S)-, and racemic fluoxetine N-demethylation by human cytochrome P450 enzymes. Drug Metab Dispos. 2000 Oct;28(10):1187-91. | ||||
| 88 | Lipid-lowering response to statins is affected by CYP3A5 polymorphism. Pharmacogenetics. 2004 Aug;14(8):523-5. | ||||
| 89 | Effects of rifampin on the pharmacokinetics of a single dose of istradefylline in healthy subjects. J Clin Pharmacol. 2018 Feb;58(2):193-201. | ||||
| 90 | Identification of the metabolites of ivermectin in humans Pharmacol Res Perspect. 2021 Feb;9(1):e00712. doi: 10.1002/prp2.712. | ||||
| 91 | Absorption, Metabolism, Distribution, and Excretion of Letermovir Curr Drug Metab. 2021;22(10):784-794. doi: 10.2174/1389200222666210223112826. | ||||
| 92 | In vitro metabolism of midazolam, triazolam, nifedipine, and testosterone by human liver microsomes and recombinant cytochromes p450: role of cyp3a4 and cyp3a5. Drug Metab Dispos. 2003 Jul;31(7):938-44. | ||||
| 93 | PharmGKB summary: phenytoin pathway. Pharmacogenet Genomics. 2012 Jun;22(6):466-70. | ||||
| 94 | Human biotransformation of the nonnucleoside reverse transcriptase inhibitor rilpivirine and a cross-species metabolism comparison. Antimicrob Agents Chemother. 2013 Oct;57(10):5067-79. | ||||
| 95 | In vitro metabolism of simvastatin in humans [SBT]identification of metabolizing enzymes and effect of the drug on hepatic P450s. Drug Metab Dispos. 1997 Oct;25(10):1191-9. | ||||
| 96 | DrugBank(Pharmacology-Metabolism):Simvastatin | ||||
| 97 | A single dose mass balance study of the Hedgehog pathway inhibitor vismodegib (GDC-0449) in humans using accelerator mass spectrometry | ||||
| 98 | Absorption, distribution, metabolism, and excretion of [1?C]GDC-0449 (vismodegib), an orally active hedgehog pathway inhibitor, in rats and dogs: a unique metabolic pathway via pyridine ring opening | ||||
| 99 | Preclinical assessment of the absorption, distribution, metabolism and excretion of GDC-0449 (2-chloro-N-(4-chloro-3-(pyridin-2-yl)phenyl)-4-(methylsulfonyl)benzamide), an orally bioavailable systemic Hedgehog signalling pathway inhibitor | ||||
| 100 | PharmGKB: A worldwide resource for pharmacogenomic information. Wiley Interdiscip Rev Syst Biol Med. 2018 Jul;10(4):e1417. (ID: PA166170041) | ||||
| 101 | In vitro and in vivo oxidative metabolism and glucuronidation of anastrozole. Br J Clin Pharmacol. 2010 Dec;70(6):854-69. | ||||
| 102 | Assessment of the potential pharmacokinetic and pharmacodynamic interactions between erythromycin and argatroban. J Clin Pharmacol. 1999 May;39(5):513-9. | ||||
| 103 | Effects of acid and lactone forms of eight HMG-CoA reductase inhibitors on CYP-mediated metabolism and MDR1-mediated transport. Pharm Res. 2006 Mar;23(3):506-12. | ||||
| 104 | Azelastine N-demethylation by cytochrome P-450 (CYP)3A4, CYP2D6, and CYP1A2 in human liver microsomes: evaluation of approach to predict the contribution of multiple CYPs. Drug Metab Dispos. 1999 Dec;27(12):1381-91. | ||||
| 105 | Buprenorphine pharmacology review: update on transmucosal and long-acting formulations. J Addict Med. 2019 Mar/Apr;13(2):93-103. | ||||
| 106 | Characterization of Clofazimine Metabolism in Human Liver Microsomal Incubation In Vitro | ||||
| 107 | CYP2D6 mediates 4-hydroxylation of clonidine in vitro: implication for pregnancy-induced changes in clonidine clearance. Drug Metab Dispos. 2010 Sep;38(9):1393-6. | ||||
| 108 | Population pharmacokinetics of doxapram in low-birth-weight Japanese infants with apnea. Eur J Pediatr. 2015 Apr;174(4):509-18. | ||||
| 109 | Pharmacogenomics as molecular autopsy for forensic toxicology: genotyping cytochrome P450 3A4*1B and 3A5*3 for 25 fentanyl cases. J Anal Toxicol. 2005 Oct;29(7):590-8. | ||||
| 110 | In vitro identification of the human cytochrome p450 enzymes involved in the oxidative metabolism of loxapine. Biopharm Drug Dispos. 2011 Oct;32(7):398-407. | ||||
| 111 | Metabolic Disposition of Lurbinectedin, a Potent Selective Inhibitor of Active Transcription of Protein-Coding Genes, in Nonclinical Species and Patients | ||||
| 112 | Comparative analysis of substrate and inhibitor interactions with CYP3A4 and CYP3A5. Xenobiotica. 2006 Apr;36(4):287-99. | ||||
| 113 | Ema.europa:Nalmefene | ||||
| 114 | Impact of intestinal CYP2C19 genotypes on the interaction between tacrolimus and omeprazole, but not lansoprazole, in adult living-donor liver transplant patients. Drug Metab Dispos. 2009 Apr;37(4):821-6. | ||||
| 115 | CYP3A5*3 affects plasma disposition of noroxycodone and dose escalation in cancer patients receiving oxycodone | ||||
| 116 | Substrates, inducers, inhibitors and structure-activity relationships of human Cytochrome P450 2C9 and implications in drug development Curr Med Chem. 2009;16(27):3480-675. doi: 10.2174/092986709789057635. | ||||
| 117 | Potential of ponatinib to treat chronic myeloid leukemia and acute lymphoblastic leukemia. Onco Targets Ther. 2013 Aug 20;6:1111-8. | ||||
| 118 | Influence of cytochrome P450 genotype on the plasma disposition of prochlorperazine metabolites and their relationships with clinical responses in cancer patients Ann Clin Biochem. 2018 May;55(3):385-393. doi: 10.1177/0004563217731432. | ||||
| 119 | Influence of ABCB1 and CYP3A5 genetic polymorphisms on the pharmacokinetics of quetiapine in healthy volunteers. Pharmacogenet Genomics. 2014 Jan;24(1):35-42. | ||||
| 120 | Differential inhibition of cytochrome P450 3A4, 3A5 and 3A7 by five human immunodeficiency virus (HIV) protease inhibitors in vitro. Basic Clin Pharmacol Toxicol. 2006 Jan;98(1):79-85. | ||||
| 121 | Urinary 6 beta-hydroxycortisol excretion in rheumatoid arthritis. Br J Rheumatol. 1997 Jan;36(1):54-8. | ||||
| 122 | Identification of the cytochrome P450 and other enzymes involved in the in vitro oxidative metabolism of a novel antidepressant, Lu AA21004. Drug Metab Dispos. 2012 Jul;40(7):1357-65. | ||||
| 123 | Induction of hepatic CYP2E1 by a subtoxic dose of acetaminophen in rats: increase in dichloromethane metabolism and carboxyhemoglobin elevation. Drug Metab Dispos. 2007 Oct;35(10):1754-8. | ||||
| 124 | Identification and phenotype characterization of two CYP3A haplotypes causing different enzymatic capacity in fetal livers. Clin Pharmacol Ther. 2005 Apr;77(4):259-70. | ||||
| 125 | Apixaban. After hip or knee replacement: LMWH remains the standard treatment. Prescrire Int. 2012 Sep;21(130):201-2, 204. | ||||
| 126 | FDA label:Avapritinib | ||||
| 127 | Optimization of Clonazepam Therapy Adjusted to Patient's CYP3A Status and NAT2 Genotype | ||||
| 128 | Product monograph: Avodart (dutasteride capsules). | ||||
| 129 | DrugBank(Pharmacology-Metabolism):Dutasteride | ||||
| 130 | Kinetics and regulation of cytochrome P450-mediated etoposide metabolism. Drug Metab Dispos. 2004 Sep;32(9):993-1000. | ||||
| 131 | Differential metabolism of gefitinib and erlotinib by human cytochrome P450 enzymes. Clin Cancer Res. 2007 Jun 15;13(12):3731-7. | ||||
| 132 | Application of liquid chromatography/mass spectrometry in accelerating the identification of human liver cytochrome P450 isoforms involved in the metabolism of iloperidone. J Pharmacol Exp Ther. 1998 Sep;286(3):1285-93. | ||||
| 133 | Pharmacogenetics of irinotecan metabolism and transport: an update. Toxicol In Vitro. 2006 Mar;20(2):163-75. | ||||
| 134 | The impact of individual human cytochrome P450 enzymes on oxidative metabolism of anticancer drug lenvatinib | ||||
| 135 | Pharmacogenomics of statins: understanding susceptibility to adverse effects. Pharmgenomics Pers Med. 2016 Oct 3;9:97-106. | ||||
| 136 | Methadone metabolism and drug-drug interactions: in vitro and in vivo literature review. J Pharm Sci. 2018 Dec;107(12):2983-2991. | ||||
| 137 | Pharmacogenomics knowledge for personalized medicine Clin Pharmacol Ther. 2012 Oct;92(4):414-7. doi: 10.1038/clpt.2012.96. | ||||
| 138 | Characterization of a phase 1 metabolite of mycophenolic acid produced by CYP3A4/5. Ther Drug Monit. 2004 Dec;26(6):600-8. | ||||
| 139 | DrugBank(Pharmacology-Metabolism):Mycophenolic acid | ||||
| 140 | Enzyme kinetics and inhibition of nimodipine metabolism in human liver microsomes. Acta Pharmacol Sin. 2000 Aug;21(8):690-4. | ||||
| 141 | Pharmacokinetics, metabolism and excretion of intravenous [l4C]-palonosetron in healthy human volunteers Biopharm Drug Dispos. 2004 Nov;25(8):329-37. doi: 10.1002/bdd.410. | ||||
| 142 | An evaluation of potential mechanism-based inactivation of human drug metabolizing cytochromes P450 by monoamine oxidase inhibitors, including isoniazid. Br J Clin Pharmacol. 2006 May;61(5):570-84. | ||||
| 143 | Induction and regulation of xenobiotic-metabolizing cytochrome P450s in the human A549 lung adenocarcinoma cell line. Am J Respir Cell Mol Biol. 2000 Mar;22(3):360-6. | ||||
| 144 | Clinical Pharmacokinetic and Pharmacodynamic Profile of Riociguat | ||||
| 145 | The disposition of voriconazole in mouse, rat, rabbit, guinea pig, dog, and human | ||||
| 146 | Roles of CYP3A4 and CYP2C19 in methyl hydroxylated and N-oxidized metabolite formation from voriconazole, a new anti-fungal agent, in human liver microsomes. Biochem Pharmacol. 2007 Jun 15;73(12):2020-6. | ||||
| 147 | Effect of ketoconazole on the pharmacokinetic profile of ambrisentan. J Clin Pharmacol. 2009 Jun;49(6):719-24. | ||||
| 148 | Clinical pharmacokinetic profile of modafinil. Clin Pharmacokinet. 2003;42(2):123-37. | ||||
| 149 | Direct-acting antiviral agents for hepatitis C virus infection. Annu Rev Pharmacol Toxicol. 2013;53:427-49. | ||||
| 150 | Effects of CYP3A inhibition on the metabolism of cilostazol. Clin Pharmacokinet. 1999;37 Suppl 2:61-8. | ||||
| 151 | In vitro metabolism of clindamycin in human liver and intestinal microsomes. Drug Metab Dispos. 2003 Jul;31(7):878-87. | ||||
| 152 | Cytochrome P450 3A inhibition by ketoconazole affects prasugrel and clopidogrel pharmacokinetics and pharmacodynamics differently. Clin Pharmacol Ther. 2007 May;81(5):735-41. | ||||
| 153 | The relative role of CYP3A4 and CYP3A5 in eplerenone metabolism. Toxicol Lett. 2019 Oct 15;315:9-13. | ||||
| 154 | Characterisation of the cytochrome P450 enzymes involved in the in vitro metabolism of granisetron. Br J Clin Pharmacol. 1994 Dec;38(6):557-66. | ||||
| 155 | Pharmacokinetic Evaluation of CYP3A4-Mediated Drug-Drug Interactions of Isavuconazole With Rifampin, Ketoconazole, Midazolam, and Ethinyl Estradiol/Norethindrone in Healthy Adults Clin Pharmacol Drug Dev. 2017 Jan;6(1):44-53. doi: 10.1002/cpdd.285. | ||||
| 156 | Sensitivity of ivacaftor to drug-drug interactions with rifampin, a cytochrome P450 3A4 inducer. Pediatr Pulmonol. 2018 May;53(5):E6-E8. | ||||
| 157 | Metabolism of loratadine and further characterization of its in vitro metabolites. Drug Metab Lett. 2009 Aug;3(3):162-70. | ||||
| 158 | Metabolism of megestrol acetate in vitro and the role of oxidative metabolites Xenobiotica. 2018 Oct;48(10):973-983. doi: 10.1080/00498254.2017.1386335. | ||||
| 159 | Species differences in stereoselective metabolism of mephenytoin by cytochrome P450 (CYP2C and CYP3A). J Pharmacol Exp Ther. 1993 Jan;264(1):89-94. | ||||
| 160 | Cytochrome P450 enzyme activity and protein expression in primary porcine enterocyte and hepatocyte cultures. Xenobiotica. 2000 Jan;30(1):27-46. | ||||
| 161 | Different enantioselective 9-hydroxylation of risperidone by the two human CYP2D6 and CYP3A4 enzymes. Drug Metab Dispos. 2001 Oct;29(10):1263-8. | ||||
| 162 | Identification of human cytochrome P(450)s that metabolise anti-parasitic drugs and predictions of in vivo drug hepatic clearance from in vitro data. Eur J Clin Pharmacol. 2003 Sep;59(5-6):429-42. | ||||
| 163 | In vitro metabolic profile and drug-drug interaction assessment of secnidazole, a high-dose 5-nitroimidazole antibiotic for the treatment of bacterial vaginosis Pharmacol Res Perspect. 2020 Aug;8(4):e00634. doi: 10.1002/prp2.634. | ||||
| 164 | The contributions of cytochromes P450 3A4 and 3A5 to the metabolism of the phosphodiesterase type 5 inhibitors sildenafil, udenafil, and vardenafil. Drug Metab Dispos. 2008 Jun;36(6):986-90. | ||||
| 165 | Human liver microsomal diazepam metabolism using cDNA-expressed cytochrome P450s: role of CYP2B6, 2C19 and the 3A subfamily Xenobiotica. 1996 Nov;26(11):1155-66. doi: 10.3109/00498259609050260. | ||||
| 166 | FDA Approved Drug Products:Oxbryta (voxelotor) tablets | ||||
| 167 | Prediction of drug-drug interactions of zonisamide metabolism in humans from in vitro data. Eur J Clin Pharmacol. 1998 Apr;54(2):177-83. | ||||
| 168 | Aztreonam decreases hepatic microsomal cytochrome P450 in cynomolgus monkeys. Pharmacology. 1994 Mar;48(3):137-42. | ||||
| 169 | Product monograph: LUMIGAN RC (Bimatoprost). | ||||
| 170 | Cytochrome P450 2C8 and CYP3A4/5 are involved in chloroquine metabolism in human liver microsomes. Arch Pharm Res. 2003 Aug;26(8):631-7. | ||||
| 171 | Metabolism and Interactions of Chloroquine and Hydroxychloroquine with Human Cytochrome P450 Enzymes and Drug Transporters Curr Drug Metab. 2020;21(14):1127-1135. doi: 10.2174/1389200221999201208211537. | ||||
| 172 | Differential regulation of CYP3A4 and CYP3A5 and its implication in drug discovery. Curr Drug Metab. 2017;18(12):1095-1105. | ||||
| 173 | Regulation of drug-metabolizing cytochrome P450 enzymes by glucocorticoids. Drug Metab Rev. 2010 Nov;42(4):621-35. | ||||
| 174 | The inhaled glucocorticoid fluticasone propionate efficiently inactivates cytochrome P450 3A5, a predominant lung P450 enzyme. Chem Res Toxicol. 2010 Aug 16;23(8):1356-64. | ||||
| 175 | Fluticasone propionate pharmacogenetics: CYP3A4*22 polymorphism and pediatric asthma control | ||||
| 176 | Halofantrine metabolism in microsomes in man: major role of CYP 3A4 and CYP 3A5. J Pharm Pharmacol. 1999 Apr;51(4):419-26. | ||||
| 177 | Prevention of preterm delivery with 17-hydroxyprogesterone caproate: pharmacologic considerations. Semin Perinatol. 2014 Dec;38(8):516-22. | ||||
| 178 | Product characteristics of HYDROXYZINE (Hydroxyzine Hydrochloride Capsules). | ||||
| 179 | Identification of human liver cytochrome P450 enzymes responsible for the metabolism of lonafarnib (Sarasar). Drug Metab Dispos. 2006 Apr;34(4):628-35. | ||||
| 180 | FDA label of Lorlatinib. The 2020 official website of the U.S. Food and Drug Administration. | ||||
| 181 | Bioactivation of the tricyclic antidepressant amitriptyline and its metabolite nortriptyline to arene oxide intermediates in human liver microsomes and recombinant P450s. Chem Biol Interact. 2008 May 9;173(1):59-67. | ||||
| 182 | Stereoselective pharmacokinetics of oxybutynin and N-desethyloxybutynin in vitro and in vivo. Xenobiotica. 2007 Jan;37(1):59-73. | ||||
| 183 | Pimecrolimus: absorption, distribution, metabolism, and excretion in healthy volunteers after a single oral dose and supplementary investigations in vitro. Drug Metab Dispos. 2006 May;34(5):765-74. | ||||
| 184 | Rifampin markedly decreases plasma concentrations of praziquantel in healthy volunteers. Clin Pharmacol Ther. 2002 Nov;72(5):505-13. | ||||
| 185 | Effects of CYP3A Inhibition, CYP3A Induction, and Gastric Acid Reduction on the Pharmacokinetics of Ripretinib, a Switch Control KIT Tyrosine Kinase Inhibitor | ||||
| 186 | Population pharmacokinetics of romidepsin in patients with cutaneous T-cell lymphoma and relapsed peripheral T-cell lymphoma. Clin Cancer Res. 2009 Feb 15;15(4):1496-503. | ||||
| 187 | Effect of rifampicin on the pharmacokinetics and pharmacodynamics of saxagliptin, a dipeptidyl peptidase-4 inhibitor, in healthy subjects. Br J Clin Pharmacol. 2011 Jul;72(1):92-102. | ||||
| 188 | Contribution of CYP3A isoforms to dealkylation of PDE5 inhibitors: a comparison between sildenafil N-demethylation and tadalafil demethylenation. Biol Pharm Bull. 2015;38(1):58-65. | ||||
| 189 | FDA label of Tenapanor. The 2020 official website of the U.S. Food and Drug Administration. | ||||
| 190 | Metabolic pathways of inhaled glucocorticoids by the CYP3A enzymes. Drug Metab Dispos. 2013 Feb;41(2):379-89. | ||||
| 191 | Association of CYP3A5 expression and vincristine neurotoxicity in pediatric malignancies in Turkish population. J Pediatr Hematol Oncol. 2017 Aug;39(6):458-462. | ||||
| 192 | Protease inhibitors in patients with HIV disease. Clinically important pharmacokinetic considerations. Clin Pharmacokinet. 1997 Mar;32(3):194-209. | ||||
| 193 | Regulation of CYP3A5 by glucocorticoids and cigarette smoke in human lung-derived cells. J Pharmacol Exp Ther. 2003 Feb;304(2):745-52. | ||||
| 194 | Genetic variation in the first-pass metabolism of ethinylestradiol, sex hormone binding globulin levels and venous thrombosis risk Eur J Intern Med. 2017 Jul;42:54-60. doi: 10.1016/j.ejim.2017.05.019. | ||||
| 195 | Metabolism of 17 alpha-ethinylestradiol by human liver microsomes in vitro: aromatic hydroxylation and irreversible protein binding of metabolites J Clin Endocrinol Metab. 1974 Dec;39(6):1072-80. doi: 10.1210/jcem-39-6-1072. | ||||
| 196 | Identification of CYP3A7 for glyburide metabolism in human fetal livers. Biochem Pharmacol. 2014 Dec 15;92(4):690-700. | ||||
| 197 | Characterisation of seven medications approved for attention-deficit/hyperactivity disorder using in?vitro models of hepatic metabolism | ||||
| 198 | Inhibitory Effect of Vonoprazan on the Metabolism of [(14)C]Prasugrel in Human Liver Microsomes | ||||
| 199 | Synthetic and natural compounds that interact with human cytochrome P450 1A2 and implications in drug development. Curr Med Chem. 2009;16(31):4066-218. | ||||
| 200 | Characterization of benidipine and its enantiomers' metabolism by human liver cytochrome P450 enzymes. Drug Metab Dispos. 2007 Sep;35(9):1518-24. | ||||
| 201 | Pharmacologic Characterization of Valbenazine (NBI-98854) and Its Metabolites J Pharmacol Exp Ther. 2017 Jun;361(3):454-461. doi: 10.1124/jpet.116.239160. | ||||
| 202 | CYP3A5*3 and MDR1 C3435T are influencing factors of inter-subject variability in rupatadine pharmacokinetics in healthy Chinese volunteers. Eur J Drug Metab Pharmacokinet. 2016 Apr;41(2):117-24. | ||||
| 203 | Effect of CYP3A5*3 genetic variant on the metabolism of direct-acting antivirals in vitro: a different effect on asunaprevir versus daclatasvir and beclabuvir J Hum Genet. 2020 Jan;65(2):143-153. doi: 10.1038/s10038-019-0685-2. | ||||
| 204 | Roles of cytochromes P450 1A2, 2A6, and 2C8 in 5-fluorouracil formation from tegafur, an anticancer prodrug, in human liver microsomes. Drug Metab Dispos. 2000 Dec;28(12):1457-63. | ||||
| 205 | Physiologically Based Pharmacokinetic Modeling for Selumetinib to Evaluate Drug-Drug Interactions and Pediatric Dose Regimens | ||||
| 206 | Human liver S9 fractions: metabolism of dehydroepiandrosterone, epiandrosterone, and related 7-hydroxylated derivatives | ||||
| 207 | Characterization of ADME properties of [(14)C]asunaprevir (BMS-650032) in humans. Xenobiotica. 2016;46(1):52-64. | ||||
| 208 | Stereoselective hydroxylation by CYP2C19 and oxidation by ADH4 in the in vitro metabolism of tivantinib | ||||
| 209 | Metabolic pathway of icotinib in vitro: the differential roles of CYP3A4, CYP3A5, and CYP1A2 on potential pharmacokinetic drug-drug interaction. J Pharm Sci. 2018 Apr;107(4):979-983. | ||||
| 210 | The metabolic profile of azimilide in man: in vivo and in vitro evaluations. J Pharm Sci. 2005 Sep;94(9):2084-95. | ||||
| 211 | CYP26C1 is a hydroxylase of multiple active retinoids and interacts with cellular retinoic acid binding proteins. Mol Pharmacol. 2018 May;93(5):489-503. | ||||
| 212 | Metabolism and Disposition of [(14)C]Pevonedistat, a First-in-Class NEDD8-Activating Enzyme Inhibitor, after Intravenous Infusion to Patients with Advanced Solid Tumors | ||||
| 213 | Trastuzumab emtansine. An inadequately assessed combination of two cytotoxic drugs. Prescrire Int. 2014 Dec;23(155):289. | ||||
| 214 | Disposition and metabolism of the G protein-coupled receptor 40 agonist TAK-875 (fasiglifam) in rats, dogs, and humans. Xenobiotica. 2019 Apr;49(4):433-445. | ||||
| 215 | Pharmacokinetic and drug-drug interaction profiles of the combination of Tezacaftor/Ivacaftor. Clin Transl Sci. 2019 May;12(3):267-275. | ||||
| 216 | CYP3A5 genotype has a dose-dependent effect on ABT-773 plasma levels. Clin Pharmacol Ther. 2004 Jun;75(6):516-28. | ||||
| 217 | Effect of glycyrrhizin on the activity of CYP3A enzyme in humans. Eur J Clin Pharmacol. 2010 Aug;66(8):805-810. | ||||
| 218 | Disposition and metabolism of semagacestat, a {gamma}-secretase inhibitor, in humans. Drug Metab Dispos. 2010 Apr;38(4):554-65. | ||||
| 219 | Pharmacokinetic profile of dexloxiglumide. Clin Pharmacokinet. 2006;45(12):1177-88. | ||||
| 220 | In vitro evaluation of fenfluramine and norfenfluramine as victims of drug interactions | ||||
| 221 | Characterization of the cytochrome P-450 gene family responsible for the N-dealkylation of the ergot alkaloid CQA 206-291 in humans | ||||
| 222 | Induction of cytochromes P-450 2B and 3A in mice following the dietary administration of the novel cognitive enhancer linopirdine. Drug Metab Dispos. 1994 Jan-Feb;22(1):65-73. | ||||
| 223 | DrugBank(Pharmacology-Metabolism):Ganaxolone | ||||
| 224 | Effect of ketoconazole on the pharmacokinetics of ornidazole--a possible role of p-glycoprotein and CYP3A. Drug Metabol Drug Interact. 2006;22(1):67-77. | ||||
| 225 | Anlotinib: a novel multi-targeting tyrosine kinase inhibitor in clinical development. J Hematol Oncol. 2018 Sep 19;11(1):120. | ||||
| 226 | Lactonization is the critical first step in the disposition of the 3-hydroxy-3-methylglutaryl-CoA reductase inhibitor atorvastatin. Drug Metab Dispos. 2000 Nov;28(11):1369-78. | ||||
| 227 | In vitro and in vivo metabolism and pharmacokinetics of BMS-562086, a potent and orally bioavailable corticotropin-releasing factor-1 receptor antagonist | ||||
| 228 | The disposition of three phosphodiesterase type 5 inhibitors, vardenafil, sildenafil, and udenafil, is differently influenced by the CYP3A5 genotype. Pharmacogenet Genomics. 2011 Dec;21(12):820-8. | ||||
| 229 | Determination of an optimal dosing regimen for fexinidazole, a novel oral drug for the treatment of human African trypanosomiasis: first-in-human studies | ||||
| 230 | Fexinidazole--a new oral nitroimidazole drug candidate entering clinical development for the treatment of sleeping sickness. PLoS Negl Trop Dis. 2010 Dec 21;4(12):e923. | ||||
| 231 | Structural perspectives of the CYP3A family and their small molecule modulators in drug metabolism. 2019, 3(3), 132-142. | ||||
| 232 | CYP3A but not P-gp plays a relevant role in the in vivo intestinal and hepatic clearance of the delta-specific phosphoinositide-3 kinase inhibitor leniolisib | ||||
| 233 | Minor contribution of CYP3A5 to the metabolism of hepatitis C protease inhibitor paritaprevir in vitro | ||||
| 234 | Main protease inhibitors and drug surface hotspots for the treatment of COVID-19: A drug repurposing and molecular docking approach | ||||
| 235 | The Effect of Modafinil on the Safety and Pharmacokinetics of Lorlatinib: A Phase I Study in Healthy Participants | ||||
| 236 | First-in-human pharmacokinetic and pharmacodynamic study of the dual m-TORC 1/2 inhibitor AZD2014. Clin Cancer Res. 2015 Aug 1;21(15):3412-9. | ||||
| 237 | Quinacrine is mainly metabolized to mono-desethyl quinacrine by CYP3A4/5 and its brain accumulation is limited by P-glycoprotein. Drug Metab Dispos. 2006 Jul;34(7):1136-44. | ||||
| 238 | Metabolic pathways of the camptothecin analog AR-67 | ||||
| 239 | In vitro assessment of metabolic drugCdrug interaction potential of AZD2624, neurokinin-3 receptor antagonist, through cytochrome P(450) enzyme identification, inhibition, and induction studies | ||||
| 240 | Population pharmacokinetics of telapristone (CDB-4124) and its active monodemethylated metabolite CDB-4453, with a mixture model for total clearance | ||||
| 241 | Physiologically based pharmacokinetic modeling to predict complex drug-drug interactions: a case study of AZD2327 and its metabolite, competitive and time-dependent CYP3A inhibitors | ||||
| 242 | The Drug-Drug Interaction Profile of Presatovir | ||||
| 243 | Safety assessment, in vitro and in vivo, and pharmacokinetics of emivirine, a potent and selective nonnucleoside reverse transcriptase inhibitor of human immunodeficiency virus type 1. Antimicrob Agents Chemother. 2000 Jan;44(1):123-30. | ||||
| 244 | The pharmacogenetics of the new-generation antipsychotics - A scoping review focused on patients with severe psychiatric disorders | ||||
| 245 | Simulation of human plasma concentration-time profiles of the partial glucokinase activator PF-04937319 and its disproportionate N-demethylated metabolite using humanized chimeric mice and semi-physiological pharmacokinetic modeling | ||||
| 246 | Pre-clinical Characterization of Absorption, Distribution, Metabolism and Excretion Properties of TAK-063 | ||||
| 247 | Pharmacokinetics and Safety After a Single Dose of Imarikiren in Subjects with Renal or Hepatic Impairment | ||||
| 248 | Evaluation of iberdomide and cytochrome p450 drug-drug interaction potential in vitro and in a phase 1 study in healthy subjects | ||||
| 249 | Discovery of Encequidar, First-in-Class Intestine Specific P-glycoprotein Inhibitor | ||||
| 250 | Metabolism and bioactivation of famitinib, a novel inhibitor of receptor tyrosine kinase, in cancer patients. Br J Pharmacol. 2013 Apr;168(7):1687-706. | ||||
| 251 | Metabolic map and bioactivation of the anti-tumour drug noscapine | ||||
| 252 | Assessment of drug-drug interaction potential and PBPK modeling of CC-223, a potent inhibitor of the mammalian target of rapamycin kinase. Xenobiotica. 2019 Jan;49(1):54-70. | ||||
| 253 | Metabolism Of Antiretroviral Drugs Used In Hiv Preexposure Prophylaxis | ||||
| 254 | In vitro metabolism of irosustat, a novel steroid sulfatase inhibitor: interspecies comparison, metabolite identification, and metabolic enzyme identification | ||||
| 255 | Metabolism and pharmacokinetics of allitinib in cancer patients: the roles of cytochrome P450s and epoxide hydrolase in its biotransformation | ||||
| 256 | Pharmacokinetics and Metabolism of Naringin and Active Metabolite Naringenin in Rats, Dogs, Humans, and the Differences Between Species | ||||
| 257 | Nonclinical pharmacokinetics and in vitro metabolism of H3B-6545, a novel selective ERalpha covalent antagonist (SERCA). Cancer Chemother Pharmacol. 2019 Jan;83(1):151-160. | ||||
| 258 | Metabolites of PPI-2458, a selective, irreversible inhibitor of methionine aminopeptidase-2: structure determination and in vivo activity. Drug Metab Dispos. 2013 Apr;41(4):814-26. | ||||
| 259 | In vitro metabolism of 17-(dimethylaminoethylamino)-17-demethoxygeldanamycin in human liver microsomes | ||||
| 260 | In vitro and in vivo clinical pharmacology of dimethyl benzoylphenylurea, a novel oral tubulin-interactive agent | ||||
| 261 | Phase I study of continuous weekly dosing of dimethylamino benzoylphenylurea (BPU) in patients with solid tumours | ||||
| 262 | In Vitro Metabolic Pathways of the New Anti-Diabetic Drug Evogliptin in Human Liver Preparations | ||||
| 263 | CYP3A5 mediates bioactivation and cytotoxicity of tetrandrine. Arch Toxicol. 2016 Jul;90(7):1737-48. | ||||
| 264 | Correlation of the in vitro biotransformation of H3B-6527 in dog and human hepatocytes with the in vivo metabolic profile of 14C-H3B-6527 in a dog mass balance study. Xenobiotica. 2020 Apr;50(4):458-467. | ||||
| 265 | ITX 5061 quantitation in human plasma with reverse phase liquid chromatography and mass spectrometry detection. Antivir Ther. 2013;18(3):329-36. | ||||
| 266 | In vitro metabolism of 7 neuronal nicotinic receptor agonist AZD0328 and enzyme identification for its N-oxide metabolite | ||||
| 267 | In vivo production of novel vitamin D2 hydroxy-derivatives by human placentas, epidermal keratinocytes, Caco-2 colon cells and the adrenal gland. Mol Cell Endocrinol. 2014 Mar 5;383(1-2):181-92. doi: 10.1016/j.mce.2013.12.012. | ||||
| 268 | Species-dependent metabolism of a novel selective 7 neuronal acetylcholine receptor agonist ABT-107 | ||||
| 269 | Metabolism of ezlopitant, a nonpeptidic substance P receptor antagonist, in liver microsomes: enzyme kinetics, cytochrome P450 isoform identity, and in vitro-in vivo correlation. Drug Metab Dispos. 2000 Sep;28(9):1069-76. | ||||
| 270 | Tamoxifen dose and serum concentrations of tamoxifen and six of its metabolites in routine clinical outpatient care | ||||
| 271 | Diazinon, chlorpyrifos and parathion are metabolised by multiple cytochromes P450 in human liver. Toxicology. 2006 Jul 5;224(1-2):22-32. | ||||
| 272 | Metabolism of alfentanil by cytochrome p4503a (cyp3a) enzymes. Drug Metab Dispos. 2005 Mar;33(3):303-11. | ||||
| 273 | Potential for pharmacokinetic interactions between ambrisentan and cyclosporine. Clin Pharmacol Ther. 2010 Oct;88(4):513-20. | ||||
| 274 | Apixaban. Hosp Pharm. 2013 Jun;48(6):494-509. | ||||
| 275 | LABEL:RMODAFINIL tablet | ||||
| 276 | Synthesis, characterization, and antimalarial activity of the glucuronides of the hydroxylated metabolites of arteether | ||||
| 277 | Use of a physiologically-based pharmacokinetic model to simulate artemether dose adjustment for overcoming the drug-drug interaction with efavirenz In Silico Pharmacol. 2013 Mar 1;1:4. doi: 10.1186/2193-9616-1-4. | ||||
| 278 | In Vitro Kinetic Characterization of Axitinib Metabolism | ||||
| 279 | Phase I study of orally administered (14)Carbon-isotope labelled-vistusertib (AZD2014), a dual TORC1/2 kinase inhibitor, to assess the absorption, metabolism, excretion, and pharmacokinetics in patients with advanced solid malignancies | ||||
| 280 | Examination of metabolic pathways and identification of human liver cytochrome P450 isozymes responsible for the metabolism of barnidipine, a calcium channel blocker. Xenobiotica. 1997 Sep;27(9):885-900. | ||||
| 281 | DrugBank(Pharmacology-Metabolism):Beclomethasone dipropionate | ||||
| 282 | Metabolism of beclomethasone dipropionate by cytochrome P450 3A enzymes. J Pharmacol Exp Ther. 2013 May;345(2):308-16. | ||||
| 283 | DrugBank(Pharmacology-Metabolism)Asunaprevir | ||||
| 284 | Characterization of human liver enzymes involved in the biotransformation of boceprevir, a hepatitis C virus protease inhibitor | ||||
| 285 | Metabolism of carfentanil, an ultra-potent opioid, in human liver microsomes and human hepatocytes by high-resolution mass spectrometry. AAPS J. 2016 Nov;18(6):1489-1499. | ||||
| 286 | Metabolite profiling and reaction phenotyping for the in vitro assessment of the bioactivation of bromfenac. Chem Res Toxicol. 2020 Jan 21;33(1):249-257. | ||||
| 287 | Metabolic disposition of 14C-bromfenac in healthy male volunteers J Clin Pharmacol. 1998 Aug;38(8):744-52. doi: 10.1002/j.1552-4604.1998.tb04815.x. | ||||
| 288 | In vitro metabolism study of buprenorphine: evidence for new metabolic pathways. Drug Metab Dispos. 2005 May;33(5):689-95. | ||||
| 289 | DrugBank(Pharmacology-Metabolism)Buspirone | ||||
| 290 | A phase I open-label study investigating the disposition of [14C]-cabazitaxel in patients with advanced solid tumors Anticancer Drugs. 2015 Mar;26(3):350-8. doi: 10.1097/CAD.0000000000000185. | ||||
| 291 | Carbamazepine and its metabolites in human perfused placenta and in maternal and cord blood Epilepsia. 1995 Mar;36(3):241-8. doi: 10.1111/j.1528-1157.1995.tb00991.x. | ||||
| 292 | Identification of human hepatic cytochrome p450 enzymes involved in the biotransformation of cholic and chenodeoxycholic acid. Drug Metab Dispos. 2008 Oct;36(10):1983-91. | ||||
| 293 | Clinical pharmacokinetics and metabolism of chloroquine. Focus on recent advancements Clin Pharmacokinet. 1996 Oct;31(4):257-74. doi: 10.2165/00003088-199631040-00003. | ||||
| 294 | Cyclosporin metabolism in transplant patients | ||||
| 295 | Determination of cilostazol and its metabolites in human urine by high performance liquid chromatography J Pharm Biomed Anal. 2001 Jan;24(3):381-9. doi: 10.1016/s0731-7085(00)00426-x. | ||||
| 296 | Characterization of human cytochrome p450 enzymes involved in the metabolism of cilostazol Drug Metab Dispos. 2007 Oct;35(10):1730-2. doi: 10.1124/dmd.107.016758. | ||||
| 297 | Metabolism, pharmacokinetics, and excretion of a nonpeptidic substance P receptor antagonist, ezlopitant, in normal healthy male volunteers: characterization of polar metabolites by chemical derivatization with dansyl chloride | ||||
| 298 | Study on the Pharmacokinetics of Diazepam and Its Metabolites in Blood of Chinese People Eur J Drug Metab Pharmacokinet. 2020 Aug;45(4):477-485. doi: 10.1007/s13318-020-00614-8. | ||||
| 299 | Pharmacokinetics of Diazepam and Its Metabolites in Urine of Chinese Participants. Drugs R D. 2022 Mar;22(1):43-50. doi: 10.1007/s40268-021-00375-y. | ||||
| 300 | Kinetic disposition of diazepam and its metabolites after intravenous administration of diazepam in the horse: Relevance for doping control. J Vet Pharmacol Ther. 2021 Sep;44(5):733-744. doi: 10.1111/jvp.12991. | ||||
| 301 | DrugBank(Pharmacology-Metabolism)Diazepam | ||||
| 302 | Drug Interactions Flockhart Table:Docetaxel | ||||
| 303 | DrugBank(Pharmacology-Metabolism): Doravirine | ||||
| 304 | Doxapram metabolism in human fetal hepatic organ culture | ||||
| 305 | Identification of doxapram metabolites using high pressure ion exchange chromatography and mass spectroscopy | ||||
| 306 | Identification of metabolic pathways and enzyme systems involved in the in vitro human hepatic metabolism of dronedarone, a potent new oral antiarrhythmic drug. Pharmacol Res Perspect. 2014 Jun;2(3):e00044. | ||||
| 307 | LC-MS/MS determination of dutasteride and its major metabolites in human plasma | ||||
| 308 | Cytochrome P450-mediated metabolism of estrogens and its regulation in human. Cancer Lett. 2005 Sep 28;227(2):115-24. | ||||
| 309 | Pharmacokinetics, biotransformation, and mass balance of edoxaban, a selective, direct factor Xa inhibitor, in humans Drug Metab Dispos. 2012 Dec;40(12):2250-5. doi: 10.1124/dmd.112.046888. | ||||
| 310 | Oxidative metabolism of dehydroepiandrosterone (DHEA) and biologically active oxygenated metabolites of DHEA and epiandrosterone (EpiA)--recent reports | ||||
| 311 | In Vitro Characterization of Ertugliflozin Metabolism by UDP-Glucuronosyltransferase and Cytochrome P450 Enzymes Drug Metab Dispos. 2020 Dec;48(12):1350-1363. doi: 10.1124/dmd.120.000171. | ||||
| 312 | Pharmacokinetics, metabolism, and excretion of the antidiabetic agent ertugliflozin (PF-04971729) in healthy male subjects Drug Metab Dispos. 2013 Feb;41(2):445-56. doi: 10.1124/dmd.112.049551. | ||||
| 313 | The metabolism of estradiol; oral compared to intravenous administration J Steroid Biochem. 1985 Dec;23(6A):1065-70. doi: 10.1016/0022-4731(85)90068-8. | ||||
| 314 | Characterization of the oxidative metabolites of 17beta-estradiol and estrone formed by 15 selectively expressed human cytochrome p450 isoforms. Endocrinology. 2003 Aug;144(8):3382-98. | ||||
| 315 | Reactions of glutathione with the catechol, the ortho-quinone and the semi-quinone free radical of etoposide. Consequences for DNA inactivation. Biochem Pharmacol. 1992 Apr 15;43(8):1761-8. | ||||
| 316 | U. S. FDA Label -Fenfluramine | ||||
| 317 | Fentanyl Absorption, Distribution, Metabolism, and Excretion: Narrative Review and Clinical Significance Related to Illicitly Manufactured Fentanyl. J Addict Med. 2023 May 17. doi: 10.1097/ADM.0000000000001185. | ||||
| 318 | Predictors of the Rate of Illicit Fentanyl Metabolism in a Cohort of Pregnant Individuals. J Addict Med. 2023 Jan-Feb 01;17(1):85-88. doi: 10.1097/ADM.0000000000001043. | ||||
| 319 | Bupivacaine Metabolite Can Interfere with Norfentanyl Measurement by LC-MS/MS. J Appl Lab Med. 2022 Jun 30;7(4):854-862. doi: 10.1093/jalm/jfac009. | ||||
| 320 | Simultaneous identification and quantitation of fluoxetine and its metabolite, norfluoxetine, in biological samples by GC-MS | ||||
| 321 | DrugBank(Pharmacology-Metabolism):Fluticasone propionate | ||||
| 322 | Ganaxolone | ||||
| 323 | Reactive metabolite of gefitinib activates inflammasomes: implications for gefitinib-induced idiosyncratic reaction J Toxicol Sci. 2020;45(11):673-680. doi: 10.2131/jts.45.673. | ||||
| 324 | Kinetics of glyburide metabolism by hepatic and placental microsomes of human and baboon | ||||
| 325 | Identification of glyburide metabolites formed by hepatic and placental microsomes of humans and baboons | ||||
| 326 | The single dose kinetics of chloroquine and its major metabolite desethylchloroquine in healthy subjects | ||||
| 327 | Understanding the pharmacokinetics of anxiolytic drugs | ||||
| 328 | The Role of Alcohol Dehydrogenase in Drug Metabolism: Beyond Ethanol Oxidation | ||||
| 329 | The KEGG resource for deciphering the genome | ||||
| 330 | 2-Chloroacetaldehyde-induced cerebral glutathione depletion and neurotoxicity | ||||
| 331 | Role of cytochrome P450 activity in the fate of anticancer agents and in drug resistance: focus on tamoxifen, paclitaxel and imatinib metabolism | ||||
| 332 | Participation of CYP2C8 and CYP3A4 in the N-demethylation of imatinib in human hepatic microsomes | ||||
| 333 | In vitro biotransformation of imatinib by the tumor expressed CYP1A1 and CYP1B1 | ||||
| 334 | Imipramine metabolites in blood of patients during therapy and after overdose | ||||
| 335 | Deletion of the mouse Fmo1 gene results in enhanced pharmacological behavioural responses to imipramine | ||||
| 336 | In vitro metabolism of indiplon and an assessment of its drug interaction potential | ||||
| 337 | VMAT2 Inhibitors in Neuropsychiatric Disorders | ||||
| 338 | Pharmacokinetics, metabolism, and excretion of irinotecan (CPT-11) following I.V. infusion of [(14)C]CPT-11 in cancer patients Drug Metab Dispos. 2000 Apr;28(4):423-33. | ||||
| 339 | Effect of UGT1A1, CYP3A and CES Activities on the Pharmacokinetics of Irinotecan and its Metabolites in Patients with UGT1A1 Gene Polymorphisms. Eur J Drug Metab Pharmacokinet. 2021 Mar;46(2):317-324. doi: 10.1007/s13318-021-00675-3. | ||||
| 340 | Pharmacokinetic evaluation of CYP3A4-mediated drug-drug interactions of isavuconazole with rifampin, ketoconazole, midazolam, and ethinyl estradiol/norethindrone in healthy adults. Clin Pharmacol Drug Dev. 2017 Jan;6(1):44-53. | ||||
| 341 | Concomitant use of isavuconazole and CYP3A4/5 inducers: Where pharmacogenetics meets pharmacokinetics Mycoses. 2021 Sep;64(9):1111-1116. doi: 10.1111/myc.13300. | ||||
| 342 | PharmGKB summary: ivacaftor pathway, pharmacokinetics/pharmacodynamics Pharmacogenet Genomics. 2017 Jan;27(1):39-42. doi: 10.1097/FPC.0000000000000246. | ||||
| 343 | Identification of the cytochrome P450 enzymes involved in the metabolism of domperidone. Xenobiotica. 2004 Nov-Dec;34(11-12):1013-23. | ||||
| 344 | Characterization of CYP3A isozymes involved in the metabolism of domperidone: role of cytochrome b5 and inhibition by ketoconazole. Drug Metab Lett. 2010 Apr;4(2):95-103. | ||||
| 345 | Identification of the human P450 enzymes involved in lansoprazole metabolism. J Pharmacol Exp Ther. 1996 May;277(2):805-16. | ||||
| 346 | Oxidative metabolism of lansoprazole by human liver cytochromes P450. Mol Pharmacol. 1995 Feb;47(2):410-8. | ||||
| 347 | Metabolic intermediate complex formation of human cytochrome P450 3A4 by lapatinib Drug Metab Dispos. 2011 Jun;39(6):1022-30. doi: 10.1124/dmd.110.037531. | ||||
| 348 | Characterization of the metabolism of fenretinide by human liver microsomes, cytochrome P450 enzymes and UDP-glucuronosyltransferases. Br J Pharmacol. 2011 Feb;162(4):989-99. | ||||
| 349 | [Influence of CYP3A4/5 polymorphisms in the pharmacokinetics of levonorgestrel: a pilot study]. Biomedica. 2012 Oct-Dec;32(4):570-7. | ||||
| 350 | Human liver microsomal cytochrome P450 3A isozymes mediated vindesine biotransformation. Metabolic drug interactions. Biochem Pharmacol. 1993 Feb 24;45(4):853-61. | ||||
| 351 | Identification of unstable metabolites of Lonafarnib using liquid chromatography-quadrupole time-of-flight mass spectrometry, stable isotope incorporation and ion source temperature alteration | ||||
| 352 | #N/A | ||||
| 353 | Clinical pharmacokinetics of losartan. Clin Pharmacokinet. 2005;44(8):797-814. | ||||
| 354 | Identification of sulfonyl-loxoprofen as novel phase 2 conjugate in rat | ||||
| 355 | IgG and IgM Immunohistochemistry in Primary Biliary Cholangitis (PBC) and Autoimmune Hepatitis (AIH) Liver Explants | ||||
| 356 | In vitro and in vivo pharmacokinetic characterization of mavacamten, a first-in-class small molecule allosteric modulator of beta cardiac myosin | ||||
| 357 | Metabolism of megestrol acetate in vitro and the role of oxidative metabolites. Xenobiotica. 2018 Oct;48(10):973-983. | ||||
| 358 | Effects of cytochrome P450 single nucleotide polymorphisms on methadone metabolism and pharmacodynamics | ||||
| 359 | Disposition and metabolism of metronidazole in patients with liver failure | ||||
| 360 | Metronidazole Metabolism in Neonates and the Interplay Between Ontogeny and Genetic Variation | ||||
| 361 | Metronidazole: an update on metabolism, structure-cytotoxicity and resistance mechanisms | ||||
| 362 | DrugBank(Pharmacology-Metabolism):Mycophenolate mofetil | ||||
| 363 | Identification of human cytochrome P450 isozymes involved in the metabolism of naftopidil enantiomers in vitro. J Pharm Pharmacol. 2014 Nov;66(11):1534-51. | ||||
| 364 | Characterization of Ca(2+)-antagonistic effects of three metabolites of the new antihypertensive agent naftopidil, (naphthyl)hydroxy-naftopidil, (phenyl)hydroxy-naftopidil, and O-desmethyl-naftopidil J Cardiovasc Pharmacol. 1991 Dec;18(6):918-25. doi: 10.1097/00005344-199112000-00020. | ||||
| 365 | LABEL:Nalmefene | ||||
| 366 | Disposition and biotransformation of the antiretroviral drug nevirapine in humans Drug Metab Dispos. 1999 Aug;27(8):895-901. | ||||
| 367 | Differences in nevirapine biotransformation as a factor for its sex-dependent dimorphic profile of adverse drug reactions J Antimicrob Chemother. 2014 Feb;69(2):476-82. doi: 10.1093/jac/dkt359. | ||||
| 368 | Sulfation of 12-hydroxy-nevirapine by human SULTs and the effects of genetic polymorphisms of SULT1A1 and SULT2A1. Biochem Pharmacol. 2022 Oct;204:115243. doi: 10.1016/j.bcp.2022.115243. | ||||
| 369 | Cytochromes P450: a structure-based summary of biotransformations using representative substrates Drug Metab Rev. 2008;40(1):1-100. doi: 10.1080/03602530802309742. | ||||
| 370 | Inhibitory effects of nicardipine to cytochrome P450 (CYP) in human liver microsomes. Biol Pharm Bull. 2005 May;28(5):882-5. | ||||
| 371 | CYP3A5 genotype did not impact on nifedipine disposition in healthy volunteers Pharmacogenomics J. 2004;4(1):34-9. doi: 10.1038/sj.tpj.6500218. | ||||
| 372 | Pharmacokinetics and metabolism of nifedipine Hypertension. 1983 Jul-Aug;5(4 Pt 2):II18-24. doi: 10.1161/01.hyp.5.4_pt_2.ii18. | ||||
| 373 | Metabolic pro?ling of tyrosine kinase inhibitor nintedanib using metabolomics J Pharm Biomed Anal. 2020 Feb 20;180:113045. doi: 10.1016/j.jpba.2019.113045. | ||||
| 374 | Oxidative bioactivation of nitrofurantoin in rat liver microsomes Xenobiotica. 2017 Feb;47(2):103-111. doi: 10.3109/00498254.2016.1164913. | ||||
| 375 | In vitro metabolism of olaparib in liver microsomes by liquid chromatography/electrospray ionization high-resolution mass spectrometry Rapid Commun Mass Spectrom. 2020 Feb 15;34(3):e8575. doi: 10.1002/rcm.8575. | ||||
| 376 | Oxybutynin. A review of its pharmacodynamic and pharmacokinetic properties, and its therapeutic use in detrusor instability Drugs Aging. 1995 Mar;6(3):243-62. doi: 10.2165/00002512-199506030-00007. | ||||
| 377 | Enzalutamide Reduces Oxycodone Exposure in Men with Prostate Cancer. Clin Pharmacokinet. 2023 May 10. doi: 10.1007/s40262-023-01255-1. | ||||
| 378 | Impact of genetic variation in CYP2C19, CYP2D6, and CYP3A4 on oxycodone and its metabolites in a large database of clinical urine drug tests. Pharmacogenomics J. 2022 Feb;22(1):25-32. doi: 10.1038/s41397-021-00253-5. | ||||
| 379 | DrugBank(Pharmacology-Metabolism)Oxycodone hydrochloride | ||||
| 380 | S73 | METXBIODB | metabolite Reaction Database from BioTransformer | DOI:10.5281/zenodo.4056560 | ||||
| 381 | Identification of cytochrome P450 isoforms involved in the metabolism of paroxetine and estimation of their importance for human paroxetine metabolism using a population-based simulator. Drug Metab Dispos. 2010 Mar;38(3):376-85. | ||||
| 382 | Value of preemptive CYP2C19 genotyping in allogeneic stem cell transplant patients considered for pentamidine administration. Clin Transplant. 2011 May-Jun;25(3):E271-5. | ||||
| 383 | Insights into the mechanisms of action of the MAO inhibitors phenelzine and tranylcypromine: a review J Psychiatry Neurosci. 1992 Nov;17(5):206-14. | ||||
| 384 | DrugBank(Pharmacology-Metabolism)Phenobarbital | ||||
| 385 | Simultaneous determination of prochlorperazine and its metabolites in human plasma using isocratic liquid chromatography tandem mass spectrometry Biomed Chromatogr. 2012 Jun;26(6):754-60. doi: 10.1002/bmc.1725. | ||||
| 386 | Bioavailability and metabolism of prochlorperazine administered via the buccal and oral delivery route J Clin Pharmacol. 2005 Dec;45(12):1383-90. doi: 10.1177/0091270005281044. | ||||
| 387 | Metabolism of quetiapine by CYP3A4 and CYP3A5 in presence or absence of cytochrome B5. Drug Metab Dispos. 2009 Feb;37(2):254-8. | ||||
| 388 | Metabolism of the active metabolite of quetiapine, N-desalkylquetiapine in vitro. Drug Metab Dispos. 2012 Sep;40(9):1778-84. | ||||
| 389 | Identification of cytochrome P450 enzymes involved in the metabolism of FK228, a potent histone deacetylase inhibitor, in human liver microsomes. Biol Pharm Bull. 2005 Jan;28(1):124-9. | ||||
| 390 | Determination of salmeterol, -hydroxysalmeterol and fluticasone propionate in human urine and plasma for doping control using UHPLC-QTOF-MS. Biomed Chromatogr. 2021 Aug;35(8):e5114. doi: 10.1002/bmc.5114. | ||||
| 391 | Pharmacokinetics of salmeterol and its main metabolite -hydroxysalmeterol after acute and chronic dry powder inhalation in exercising endurance-trained men: Implications for doping control. Drug Test Anal. 2021 Apr;13(4):747-761. doi: 10.1002/dta.2978. | ||||
| 392 | The salmeterol anomaly and the need for a urine threshold. Drug Test Anal. 2022 Jun;14(6):997-1003. doi: 10.1002/dta.2810. | ||||
| 393 | Effect of saquinavir-ritonavir on cytochrome P450 3A4 activity in healthy volunteers using midazolam as a probe. Pharmacotherapy. 2009 Oct;29(10):1175-81. | ||||
| 394 | Inhibition of desipramine hydroxylation (Cytochrome P450-2D6) in vitro by quinidine and by viral protease inhibitors: relation to drug interactions in vivo. J Pharm Sci. 1998 Oct;87(10):1184-9. | ||||
| 395 | Secnidazole. A review of its antimicrobial activity, pharmacokinetic properties and therapeutic use in the management of protozoal infections and bacterial vaginosis Drugs. 1996 Apr;51(4):621-38. doi: 10.2165/00003495-199651040-00007. | ||||
| 396 | Functional Measurement of CYP2C9 and CYP3A4 Allelic Polymorphism on Sildenafil Metabolism | ||||
| 397 | In vitro biotransformation of sildenafil (Viagra): identification of human cytochromes and potential drug interactions. Drug Metab Dispos. 2000 Apr;28(4):392-7. | ||||
| 398 | Pharmacokinetics of sildenafil after single oral doses in healthy male subjects: absolute bioavailability, food effects and dose proportionality. Br J Clin Pharmacol. 2002;53 Suppl 1(Suppl 1):5S-12S. doi: 10.1046/j.0306-5251.2001.00027.x. | ||||
| 399 | Erectile dysfunction drugs changed the protein expressions and activities of drug-metabolising enzymes in the liver of male rats. Oxid Med Cell Longev. 2016;2016:4970906. | ||||
| 400 | Simvastatin Tablet, Film-Coated | ||||
| 401 | Interaction of sorafenib and cytochrome P450 isoenzymes in patients with advanced melanoma: a phase I/II pharmacokinetic interaction study. Cancer Chemother Pharmacol. 2011 Nov;68(5):1111-8. | ||||
| 402 | Metabolism of tacrolimus (FK506) and recent topics in clinical pharmacokinetics Drug Metab Pharmacokinet. 2007 Oct;22(5):328-35. doi: 10.2133/dmpk.22.328. | ||||
| 403 | Effect of Ticagrelor, a Cytochrome P450 3A4 Inhibitor, on the Pharmacokinetics of Tadalafil in Rats Pharmaceutics. 2019 Jul 20;11(7):354. doi: 10.3390/pharmaceutics11070354. | ||||
| 404 | PharmGKB:Tamoxifen citrate | ||||
| 405 | Metabolism of tamoxifen by recombinant human cytochrome P450 enzymes: formation of the 4-hydroxy, 4'-hydroxy and N-desmethyl metabolites and isomerization of trans-4-hydroxytamoxifen. Drug Metab Dispos. 2002 Aug;30(8):869-74. | ||||
| 406 | Endoxifen and other metabolites of tamoxifen inhibit human hydroxysteroid sulfotransferase 2A1 (hSULT2A1). Drug Metab Dispos. 2014 Nov;42(11):1843-50. | ||||
| 407 | Metabolism and transport of tamoxifen in relation to its effectiveness: new perspectives on an ongoing controversy. Future Oncol. 2014 Jan;10(1):107-22. | ||||
| 408 | Identification and biological activity of tamoxifen metabolites in human serum Biochem Pharmacol. 1983 Jul 1;32(13):2045-52. doi: 10.1016/0006-2952(83)90425-2. | ||||
| 409 | PharmGKB summary: tamoxifen pathway, pharmacokinetics Pharmacogenet Genomics. 2013 Nov;23(11):643-7. doi: 10.1097/FPC.0b013e3283656bc1. | ||||
| 410 | Pharmacokinetics and metabolism of temazepam in man and several animal species Br J Clin Pharmacol. 1979;8(1):23S-29S. doi: 10.1111/j.1365-2125.1979.tb00451.x. | ||||
| 411 | Sigmoidal kinetic model for two co-operative substrate-binding sites in a cytochrome P450 3A4 active site: an example of the metabolism of diazepam and its derivatives. Biochem J. 1999 Jun 15;340 ( Pt 3):845-53. | ||||
| 412 | Human liver microsomal diazepam metabolism using cDNA-expressed cytochrome P450s: role of CYP2B6, 2C19 and the 3A subfamily. Xenobiotica. 1996 Nov;26(11):1155-66. | ||||
| 413 | Temsirolimus metabolic pathways revisited Xenobiotica. 2020 Jun;50(6):640-653. doi: 10.1080/00498254.2019.1678793. | ||||
| 414 | LABEL:BSRELA- tenapanor hydrochloride tablet | ||||
| 415 | DrugBank(Pharmacology-Metabolism)Teniposide | ||||
| 416 | PubChem:Teniposide | ||||
| 417 | Investigating the Contribution of Drug-Metabolizing Enzymes in Drug-Drug Interactions of Dapivirine and Miconazole | ||||
| 418 | Retinoic acid metabolism and mechanism of action: a review | ||||
| 419 | Human cytochrome P450s involved in the metabolism of 9-cis- and 13-cis-retinoic acids | ||||
| 420 | A mass balance study to evaluate the biotransformation and excretion of [14C]-triamcinolone acetonide following oral administration J Clin Pharmacol. 2000 Jul;40(7):770-80. doi: 10.1177/00912700022009413. | ||||
| 421 | Metabolic fate of a synthetic corticosteroid (triamcinolone) in the dog J Biol Chem. 1961 Apr;236:1038-42. | ||||
| 422 | In Vitro Hepatic Oxidative Biotransformation of Trimethoprim Drug Metab Dispos. 2015 Sep;43(9):1372-80. doi: 10.1124/dmd.115.065193. | ||||
| 423 | Vardenafil preclinical trial data: potency, pharmacodynamics, pharmacokinetics, and adverse events Int J Impot Res. 2004 Jun;16 Suppl 1:S34-7. doi: 10.1038/sj.ijir.3901213. | ||||
| 424 | High-performance liquid chromatographic method with amperometric detection employing boron-doped diamond electrode for the determination of sildenafil, vardenafil and their main metabolites in plasma J Chromatogr A. 2011 Nov 4;1218(44):7996-8001. doi: 10.1016/j.chroma.2011.09.001. | ||||
| 425 | Selective metabolism of vincristine in vitro by CYP3A5. Drug Metab Dispos. 2006 Aug;34(8):1317-27. | ||||
| 426 | Vortioxetine: clinical pharmacokinetics and drug interactions. Clin Pharmacokinet. 2018 Jun;57(6):673-686. | ||||
| 427 | Bioactivity and metabolism of trans-resveratrol orally administered to Wistar rats | ||||
| 428 | Norzotepine, a major metabolite of zotepine, exerts atypical antipsychotic-like and antidepressant-like actions through its potent inhibition of norepinephrine reuptake | ||||
If you find any error in data or bug in web service, please kindly report it to Dr. Yin and Dr. Li.