Details of Drug-Metabolizing Enzyme (DME)
| Full List of Drug(s) Metabolized by This DME | |||||
|---|---|---|---|---|---|
| Drugs Approved by FDA | Click to Show/Hide the Full List of Drugs: 214 Drugs | ||||
Thalidomide |
Drug Info | Approved | Breast cancer | ICD11: 2C60 | [1] |
Bupropion |
Drug Info | Approved | Nicotine dependence | ICD11: 6C4A | [2] |
Tamoxifen citrate |
Drug Info | Approved | Breast cancer | ICD11: 2C60 | [3] |
Idelalisib |
Drug Info | Approved | Chronic lymphocytic leukaemia | ICD11: 2A82 | [4] |
Warfarin sodium |
Drug Info | Approved | Atrial fibrillation | ICD11: BC81 | [5] |
Estradiol acetate |
Drug Info | Approved | Acquired prion disease | ICD11: 8E01 | [6] |
Estradiol cypionate |
Drug Info | Approved | Acquired prion disease | ICD11: 8E01 | [6] |
Estradiol valerate |
Drug Info | Approved | Acquired prion disease | ICD11: 8E01 | [6] |
Estrone |
Drug Info | Approved | Menopausal disorder | ICD11: GA30 | [7] |
Methylphenidate |
Drug Info | Approved | Attention deficit hyperactivity disorder | ICD11: 6A05 | [8] |
Nicotine |
Drug Info | Approved | Nicotine dependence | ICD11: 6C4A | [9] |
Dronabinol |
Drug Info | Approved | Anorexia nervosa | ICD11: 6B80 | [10] |
Bortezomib |
Drug Info | Approved | Breast cancer | ICD11: 2C60 | [11] |
Diclofenac sodium |
Drug Info | Approved | Osteoarthritis | ICD11: FA00 | [12] |
Hydrocodone |
Drug Info | Approved | Pain | ICD11: MG30-MG3Z | [13] |
Antazoline |
Drug Info | Approved | Nasal congestion | ICD11: MD11 | [14] |
Fospropofol disodium |
Drug Info | Approved | Monitored anaesthesia care | ICD11: N.A. | [15] |
Montelukast sodium |
Drug Info | Approved | Asthma | ICD11: CA23 | [16] |
Progesterone |
Drug Info | Approved | Premature labour | ICD11: JB00 | [17] |
Almogran |
Drug Info | Approved | Migraine | ICD11: 8A80 | [18] |
Almogran |
Drug Info | Approved | Migraine | ICD11: 8A80 | [19] |
Brivaracetam |
Drug Info | Approved | Focal seizure | ICD11: 8A68 | [20] |
Cannabidiol |
Drug Info | Approved | Lennox-Gastaut syndrome | ICD11: 8A62 | [21] |
Capsaicin |
Drug Info | Approved | Herpes zoster | ICD11: 1E91 | [22] |
Clomipramine hydrochloride |
Drug Info | Approved | Obsessive-compulsive disorder | ICD11: 6B20 | [23] |
Doxazosin |
Drug Info | Approved | Essential hypertension | ICD11: BA00 | [24] |
Ethinyl estradiol |
Drug Info | Approved | Menopausal disorder | ICD11: GA30 | [25] |
Fedratinib |
Drug Info | Approved | Chronic myelogenous leukaemia | ICD11: 2A20 | [26] |
Ifosfamide |
Drug Info | Approved | Lung cancer | ICD11: 2C25 | [27] |
Lapatinib ditosylate |
Drug Info | Approved | Breast cancer | ICD11: 2C60 | [28] |
Terbinafine hydrochloride |
Drug Info | Approved | Pityriasis versicolor | ICD11: 1F2D | [29] |
Ticlopidine |
Drug Info | Approved | Cerebral stroke | ICD11: 8B11 | [11] |
Tipranavir |
Drug Info | Approved | Human immunodeficiency virus infection | ICD11: 1C60 | [30] |
Valproic acid |
Drug Info | Approved | Epilepsy | ICD11: 8A60 | [31] |
Almotriptan malate |
Drug Info | Approved | Migraine | ICD11: 8A80 | [32] |
Aprepitant |
Drug Info | Approved | Functional nausea/vomiting | ICD11: DD90 | [33] |
Bupivacaine hydrochloride |
Drug Info | Approved | Anaesthesia | ICD11: 8E22 | [34] |
Clomipramine |
Drug Info | Approved | Depression | ICD11: 6A70-6A7Z | [35] |
Clomipramine |
Drug Info | Approved | Depression | ICD11: 6A70-6A7Z | [23], [35] |
Labetalol |
Drug Info | Approved | Essential hypertension | ICD11: BA00 | [36] |
Norethindrone |
Drug Info | Approved | Solid tumour/cancer | ICD11: 2A00-2F9Z | [37] |
Oxycodone hydrochloride |
Drug Info | Approved | Anaesthesia | ICD11: 8E22 | [38] |
Trabectedin |
Drug Info | Approved | Leiomyosarcoma | ICD11: 2B58 | [39] |
Albendazole |
Drug Info | Approved | Giardiasis | ICD11: 1A31 | [40] |
Clomiphene citrate |
Drug Info | Approved | Female infertility | ICD11: GA31 | [41] |
Dopamine hydrochloride |
Drug Info | Approved | Parkinsonism | ICD11: 8A00 | [42] |
Hydrocodone bitartrate |
Drug Info | Approved | Neuropathic pain | ICD11: 8E43 | [43] |
Meperidine |
Drug Info | Approved | Anaesthesia | ICD11: 8E22 | [44] |
Quinine sulfate |
Drug Info | Approved | Malaria | ICD11: 1F40 | [45] |
Teniposide |
Drug Info | Approved | Acute lymphoblastic leukemia | ICD11: 2B33 | [36] |
Amoxicillin |
Drug Info | Approved | Acute otitis media | ICD11: AB00 | [46] |
Axitinib |
Drug Info | Approved | Renal cell carcinoma | ICD11: 2C90 | [47] |
Cisapride |
Drug Info | Approved | Gastro-oesophageal reflux disease | ICD11: DA22 | [48] |
Dextromethorphan hydrobromide |
Drug Info | Approved | Atherosclerosis | ICD11: BA80 | [49] |
Diazepam |
Drug Info | Approved | Epilepsy | ICD11: 8A60 | [50] |
Doxepin hydrochloride |
Drug Info | Approved | Depression | ICD11: 6A71 | [51] |
Flutamide |
Drug Info | Approved | Prostate cancer | ICD11: 2C82 | [52] |
Formoterol |
Drug Info | Approved | Asthma | ICD11: CA23 | [53] |
Haloperidol decanoate |
Drug Info | Approved | Agitation/aggression | ICD11: 6D86 | [54] |
Lansoprazole |
Drug Info | Approved | Duodenal ulcer | ICD11: DA63 | [55] |
Levonorgestrel |
Drug Info | Approved | Menorrhagia | ICD11: GA20 | [56] |
Lorcaserin |
Drug Info | Approved | Obesity | ICD11: 5B81 | [57] |
Macitentan |
Drug Info | Approved | Pulmonary hypertension | ICD11: BB01 | [58] |
Norethindrone acetate |
Drug Info | Approved | Menorrhagia | ICD11: GA20 | [36] |
Pomalidomide |
Drug Info | Approved | Breast cancer | ICD11: 2C60 | [59] |
Propranolol hydrochloride |
Drug Info | Approved | Migraine | ICD11: 8A80 | [60] |
Verapamil hydrochloride |
Drug Info | Approved | Essential hypertension | ICD11: BA00 | [61] |
Amitriptyline hydrochloride |
Drug Info | Approved | Depression | ICD11: 6A71 | [62] |
Artemether |
Drug Info | Approved | Malaria | ICD11: 1F40 | [63] |
Atomoxetine hydrochloride |
Drug Info | Approved | Attention deficit hyperactivity disorder | ICD11: 6A05 | [64] |
Benzatropine |
Drug Info | Approved | Agitation/aggression | ICD11: 6D86 | [65] |
Bromfenac |
Drug Info | Approved | Cataract | ICD11: 9B10 | [66] |
Carbamazepine |
Drug Info | Approved | Epilepsy | ICD11: 8A60 | [67] |
Cenobamate |
Drug Info | Approved | Focal seizure | ICD11: 8A68 | [68] |
Clobazam |
Drug Info | Approved | Lennox-Gastaut syndrome | ICD11: 8A62 | [69] |
Cyclophosphamide |
Drug Info | Approved | Multiple myeloma | ICD11: 2A83 | [3] |
Diltiazem hydrochloride |
Drug Info | Approved | Essential hypertension | ICD11: BA00 | [70] |
Felbamate |
Drug Info | Approved | Epilepsy | ICD11: 8A60 | [50] |
Fluoxetine hydrochloride |
Drug Info | Approved | Depression | ICD11: 6A71 | [71] |
Ibuprofen |
Drug Info | Approved | Anaesthesia | ICD11: 8E22 | [50] |
Imipramine hydrochloride |
Drug Info | Approved | Depression | ICD11: 6A71 | [72] |
Indomethacin |
Drug Info | Approved | Rheumatoid arthritis | ICD11: FA20 | [11] |
Leflunomide |
Drug Info | Approved | Rheumatoid arthritis | ICD11: FA20 | [73] |
Lesinurad |
Drug Info | Approved | Uncontrolled gout | ICD11: FA25 | [74] |
Metoprolol succinate |
Drug Info | Approved | Essential hypertension | ICD11: BA00 | [50] |
Metoprolol tartrate |
Drug Info | Approved | Angina pectoris | ICD11: BA40 | [75] |
Nilutamide |
Drug Info | Approved | Prostate cancer | ICD11: 2C82 | [76] |
Oxymetazoline |
Drug Info | Approved | Erythema multiforme | ICD11: EB12 | [77] |
Phenytoin |
Drug Info | Approved | Epilepsy | ICD11: 8A60 | [50] |
Prazepam |
Drug Info | Approved | Anxiety disorder | ICD11: 6B00 | [78] |
Promazine |
Drug Info | Approved | Schizophrenia | ICD11: 6A20 | [79] |
Rilpivirine hydrochloride |
Drug Info | Approved | Human immunodeficiency virus infection | ICD11: 1C60 | [80] |
Simvastatin |
Drug Info | Approved | Dyslipidaemia | ICD11: 5C81 | [81] |
Suvorexant |
Drug Info | Approved | Insomnia | ICD11: 7A00 | [82] |
Tapentadol |
Drug Info | Approved | Neuropathic pain | ICD11: 8E43 | [83] |
Tofacitinib citrate |
Drug Info | Approved | Rheumatoid arthritis | ICD11: FA20 | [84] |
Zanubrutinib |
Drug Info | Approved | Mantle cell lymphoma | ICD11: 2A85 | [85] |
Zolpidem tartrate |
Drug Info | Approved | Insomnia | ICD11: 7A00 | [86] |
Amiodarone hydrochloride |
Drug Info | Approved | Ventricular tachyarrhythmia | ICD11: BC71 | [87] |
Aspirin |
Drug Info | Approved | Myocardial infarction | ICD11: BA41 | [88] |
Azelastine |
Drug Info | Approved | Allergic rhinitis | ICD11: CA08 | [89] |
Bedaquiline fumarate |
Drug Info | Approved | Pulmonary tuberculosis | ICD11: 1B10 | [90], [91] |
Buprenorphine hydrochloride |
Drug Info | Approved | Anaesthesia | ICD11: 8E22 | [92] |
Chlorpropamide |
Drug Info | Approved | Diabetes mellitus | ICD11: 5A10 | [93] |
Citalopram hydrobromide |
Drug Info | Approved | Depression | ICD11: 6A71 | [94] |
Clarithromycin |
Drug Info | Approved | Pneumocystis pneumonia | ICD11: CA40 | [95] |
Clozapine |
Drug Info | Approved | Schizophrenia | ICD11: 6A20 | [96] |
Diphenhydramine |
Drug Info | Approved | Meniere disease | ICD11: AB31 | [11] |
Esomeprazole |
Drug Info | Approved | Duodenal ulcer | ICD11: DA63 | [97] |
Etravirine |
Drug Info | Approved | Human immunodeficiency virus infection | ICD11: 1C60 | [98] |
Fosphenytoin sodium |
Drug Info | Approved | Epilepsy | ICD11: 8A60 | [99] |
Glipizide |
Drug Info | Approved | Diabetes mellitus | ICD11: 5A10 | [100] |
Loxapine succinate |
Drug Info | Approved | Schizophrenia | ICD11: 6A20 | [101] |
Nalbuphine |
Drug Info | Approved | Pain | ICD11: MG30-MG3Z | [102] |
Omeprazole |
Drug Info | Approved | Gastro-oesophageal reflux disease | ICD11: DA22 | [11] |
Ospemifene |
Drug Info | Approved | Dyspareunia | ICD11: GA12 | [103] |
Paroxetine hydrochloride |
Drug Info | Approved | Depression | ICD11: 6A71 | [104] |
Pentobarbital |
Drug Info | Approved | Insomnia | ICD11: 7A00 | [105] |
Perphenazine |
Drug Info | Approved | Schizophrenia | ICD11: 6A20 | [106] |
Prochlorperazine |
Drug Info | Approved | Functional nausea/vomiting | ICD11: DD90 | [107] |
Propofol |
Drug Info | Approved | Anaesthesia | ICD11: 8E22 | [108] |
Quetiapine fumarate |
Drug Info | Approved | Schizophrenia | ICD11: 6A20 | [109] |
Rabeprazole sodium |
Drug Info | Approved | Gastro-oesophageal reflux disease | ICD11: DA22 | [110] |
Sumatriptan |
Drug Info | Approved | Migraine | ICD11: 8A80 | [111] |
Tasimelteon |
Drug Info | Approved | Insomnia | ICD11: 7A00 | [112] |
Testosterone undecanoate |
Drug Info | Approved | Hypogonadism | ICD11: 5A61 | [17] |
Thioridazine |
Drug Info | Approved | Schizophrenia | ICD11: 6A20 | [113] |
Triclosan |
Drug Info | Approved | Malaria | ICD11: 1F40-1F45 | [114] |
Venlafaxine hydrochloride |
Drug Info | Approved | Depression | ICD11: 6A71 | [115] |
Vilazodone hydrochloride |
Drug Info | Approved | Depression | ICD11: 6A71 | [116] |
Vortioxetine hydrobromide |
Drug Info | Approved | Depression | ICD11: 6A71 | [117] |
Apixaban |
Drug Info | Approved | Deep vein thrombosis | ICD11: BD71 | [118] |
Benzocaine |
Drug Info | Approved | Anaesthesia | ICD11: 9A76-9A78 | [119] |
Desloratadine |
Drug Info | Approved | Allergic rhinitis | ICD11: CA08 | [120] |
Dexlansoprazole |
Drug Info | Approved | Gastro-oesophageal reflux disease | ICD11: DA22 | [121] |
Fedratinib hydrochloride |
Drug Info | Approved | Myelofibrosis | ICD11: 2A22 | [122] |
Lenvatinib |
Drug Info | Approved | Thyroid cancer | ICD11: 2D10 | [123] |
Levomilnacipran |
Drug Info | Approved | Depression | ICD11: 6A71 | [124] |
Lovastatin |
Drug Info | Approved | Hypertriglyceridaemia | ICD11: 5C80 | [81] |
Methadone |
Drug Info | Approved | Anaesthesia | ICD11: 8E22 | [125] |
Midodrine |
Drug Info | Approved | Orthostatic hypotension | ICD11: BA21 | [126] |
Nelfinavir mesylate |
Drug Info | Approved | Human immunodeficiency virus infection | ICD11: 1C60 | [127] |
Pantoprazole sodium |
Drug Info | Approved | Gastro-oesophageal reflux disease | ICD11: DA22 | [128] |
Phenelzine |
Drug Info | Approved | Depression | ICD11: 6A71 | [129] |
Phenobarbital |
Drug Info | Approved | Epilepsy | ICD11: 8A60 | [130] |
Ranitidine |
Drug Info | Approved | Peptic ulcer | ICD11: DA61 | [131] |
Sulfadiazine |
Drug Info | Approved | Toxoplasmosis | ICD11: 1F57 | [132] |
Tapinarof |
Drug Info | Approved | Discovery agent | ICD: N.A. | [133] |
Thiopental |
Drug Info | Approved | Anaesthesia | ICD11: 8E22 | [134] |
Timolol maleate |
Drug Info | Approved | Essential hypertension | ICD11: BA00 | [135] |
Tolbutamide |
Drug Info | Approved | Diabetes mellitus | ICD11: 5A10 | [136] |
Tolterodine tartrate |
Drug Info | Approved | Overactive bladder | ICD11: GC50 | [137] |
Troglitazone |
Drug Info | Approved | Diabetes mellitus | ICD11: 5A10 | [138] |
Voriconazole |
Drug Info | Approved | Candidiasis | ICD11: 1F23 | [139] |
Zidovudine |
Drug Info | Approved | Human immunodeficiency virus infection | ICD11: 1C60 | [50] |
Acebutolol |
Drug Info | Approved | Essential hypertension | ICD11: BA00 | [140] |
Ambrisentan |
Drug Info | Approved | Pulmonary hypertension | ICD11: BB01 | [141] |
Arformoterol |
Drug Info | Approved | Chronic obstructive pulmonary disease | ICD11: CA22 | [142] |
Azilsartan |
Drug Info | Approved | Hypertension | ICD11: BA00-BA04 | [143], [144] |
Carisoprodol |
Drug Info | Approved | Depression | ICD11: 6A71 | [145] |
Chloramphenicol |
Drug Info | Approved | Conjunctivitis | ICD11: 9A60 | [146] |
Cilostazol |
Drug Info | Approved | Arteriosclerosis obliterans | ICD11: BD40 | [147] |
Clopidogrel bisulfate |
Drug Info | Approved | Acute coronary syndrome | ICD11: BA4Z | [148] |
Dapsone |
Drug Info | Approved | Pneumocystis pneumonia | ICD11: CA40 | [149] |
Dydrogesterone |
Drug Info | Approved | Menorrhagia | ICD11: GA20 | [150] |
Eletriptan hydrobromide |
Drug Info | Approved | Migraine | ICD11: 8A80 | [151] |
Escitalopram |
Drug Info | Approved | Depression | ICD11: 6A71 | [152] |
Flibanserin |
Drug Info | Approved | Inhibited sexual desire | ICD11: HA00 | [153] |
Iclaprim |
Drug Info | Approved | Methicillin-resistant staphylococcus infection | ICD11: 1D01 | [154] |
Lacosamide |
Drug Info | Approved | Epilepsy | ICD11: 8A60 | [155] |
Lomitapide mesylate |
Drug Info | Approved | Hypertriglyceridaemia | ICD11: 5C80 | [156] |
Loratadine |
Drug Info | Approved | Allergic rhinitis | ICD11: CA08 | [157] |
Mephenytoin |
Drug Info | Approved | Epilepsy | ICD11: 8A60 | [158] |
Pentamidine isethionate |
Drug Info | Approved | Pneumocystis pneumonia | ICD11: CA40 | [159] |
Prasugrel hydrochloride |
Drug Info | Approved | Acute coronary syndrome | ICD11: BA4Z | [160] |
Primidone |
Drug Info | Approved | Epilepsy | ICD11: 8A60 | [161] |
Quazepam |
Drug Info | Approved | Insomnia | ICD11: 7A00 | [162] |
Rosuvastatin |
Drug Info | Approved | Hypertriglyceridaemia | ICD11: 5C80 | [11] |
Selegiline |
Drug Info | Approved | Major depressive disorder | ICD11: 6A70-6A7Z | [163] |
Selegiline hydrochloride |
Drug Info | Approved | Parkinsonism | ICD11: 8A00 | [163] |
Sertraline hydrochloride |
Drug Info | Approved | Depression | ICD11: 6A71 | [164] |
Sildenafil citrate |
Drug Info | Approved | Erectile dysfunction | ICD11: HA01 | [165] |
Stiripentol |
Drug Info | Approved | Epilepsy | ICD11: 8A60 | [166] |
Temazepam |
Drug Info | Approved | Insomnia | ICD11: 7A00 | [167] |
Triclabendazole |
Drug Info | Approved | Fascioliasis | ICD11: 1F82 | [168] |
Trimipramine |
Drug Info | Approved | Depression | ICD11: 6A71 | [169] |
Voxelotor |
Drug Info | Approved | Sickle-cell anaemia | ICD11: 3A51 | [122] |
Zonisamide |
Drug Info | Approved | Epilepsy | ICD11: 8A60 | [170] |
Chloroquine |
Drug Info | Approved | Malaria | ICD11: 1F40 | [171] |
Chlorproguanil |
Drug Info | Approved | Malaria | ICD11: 1F40-1F45 | [172] |
Desipramine |
Drug Info | Approved | Attention deficit hyperactivity disorder | ICD11: 6A05 | [173] |
Enasidenib |
Drug Info | Approved | Acute myeloid leukaemia | ICD11: 2A60 | [174] |
Encorafenib |
Drug Info | Approved | Melanoma | ICD11: 2C30 | [175] |
Enfuvirtide |
Drug Info | Approved | Human immunodeficiency virus infection | ICD11: 1C60 | [176] |
Famotidine |
Drug Info | Approved | Peptic ulcer | ICD11: DA61 | [177] |
Ibudilast |
Drug Info | Approved | Castleman's disease | ICD11: 4B2Y | [178] |
Lorlatinib |
Drug Info | Approved | Lung cancer | ICD11: 2C25 | [179] |
Nebivolol hydrochloride |
Drug Info | Approved | Pulmonary hypertension | ICD11: BB01 | [180] |
Nortriptyline hydrochloride |
Drug Info | Approved | Depression | ICD11: 6A71 | [181] |
Praziquantel |
Drug Info | Approved | Schistosomiasis | ICD11: 1F86 | [182] |
Rifampicin |
Drug Info | Approved | Osteoporosis | ICD11: FB83 | [183] |
Romidepsin |
Drug Info | Approved | Cutaneous T-cell lymphoma | ICD11: 2B01 | [184] |
Testosterone cypionate |
Drug Info | Approved | Testosterone deficiency | ICD11: 5A81 | [17] |
Testosterone enanthate |
Drug Info | Approved | Testosterone deficiency | ICD11: 5A81 | [17] |
Tilidine |
Drug Info | Approved | Pain | ICD11: MG30-MG3Z | [185] |
Trimethadione |
Drug Info | Approved | Epilepsy | ICD11: 8A60 | [186] |
Meprobamate |
Drug Info | Approved | Anxiety disorder | ICD11: 6B00 | [145] |
Methsuximide |
Drug Info | Approved | Epilepsy | ICD11: 8A60 | [172] |
Oxiconazole |
Drug Info | Approved | Dermatophytosis | ICD11: 1F28 | [187] |
Podophyllotoxin |
Drug Info | Approved | Anogenital warts | ICD11: 1A95 | [188] |
Ramelteon |
Drug Info | Approved | Insomnia | ICD11: 7A00 | [189] |
Testosterone |
Drug Info | Approved | Osteoporosis | ICD11: FB83 | [190] |
Berberine |
Drug Info | Phase 4 | Discovery agent | ICD: N.A. | [192] |
Neupro |
Drug Info | Phase 4 | Restless legs syndrome | ICD11: 7A80 | [196] |
| Drugs in Phase 4 Clinical Trial | Click to Show/Hide the Full List of Drugs: 31 Drugs | ||||
Lumiracoxib |
Drug Info | Phase 4 | Anaesthesia | ICD11: 8E22 | [191] |
Desogestrel |
Drug Info | Phase 4 | Female pelvic pain | ICD11: GA34 | [193] |
Glibenclamide |
Drug Info | Phase 4 | Diabetes mellitus | ICD11: 5A10 | [11] |
Ketobemidone |
Drug Info | Phase 4 | Anaesthesia | ICD11: 8E22 | [194] |
Naftopidil |
Drug Info | Phase 4 | Prostatic hyperplasia | ICD11: GA90 | [195] |
Piperaquine |
Drug Info | Phase 4 | Malaria | ICD11: 1F40 | [197] |
Melatonin |
Drug Info | Phase 4 | Foetal growth restriction | ICD11: KA20 | [198] |
Mianserin |
Drug Info | Phase 4 | Depression | ICD11: 6A71 | [199] |
Vonoprazan |
Drug Info | Phase 4 | Gastro-oesophageal reflux disease | ICD11: DA22 | [200] |
Vonoprazan |
Drug Info | Phase 4 | Gastro-oesophageal reflux disease | ICD11: DA22 | [201] |
Zotepine |
Drug Info | Phase 4 | Schizophrenia | ICD11: 6A20 | [202] |
Barbital |
Drug Info | Phase 4 | Insomnia | ICD11: 7A00 | [203] |
Idebenone |
Drug Info | Phase 4 | Mitochondrial myopathy | ICD11: 8C73 | [204] |
Phenacetin |
Drug Info | Phase 4 | Anaesthesia | ICD11: 8E22 | [205] |
Tienilic acid |
Drug Info | Phase 4 | Congestive heart failure | ICD11: BD10 | [11] |
Aminophenazone |
Drug Info | Phase 4 | Anaesthesia | ICD11: 8E22 | [206] |
Clotiazepam |
Drug Info | Phase 4 | Anxiety disorder | ICD11: 6B00 | [207] |
Flunitrazepam |
Drug Info | Phase 4 | Insomnia | ICD11: 7A00 | [208] |
Gliclazide |
Drug Info | Phase 4 | Diabetes mellitus | ICD11: 5A10 | [209] |
Lynestrenol |
Drug Info | Phase 4 | Transsexualism | ICD11: HA60 | [37] |
Perazine |
Drug Info | Phase 4 | Cerebrovascular dementia | ICD11: 6D81 | [210] |
Buflomedil |
Drug Info | Phase 4 | Arterial occlusive disease | ICD11: BD4Z | [50] |
Dexibuprofen |
Drug Info | Phase 4 | Osteoarthritis | ICD11: FA00 | [211] |
Etizolam |
Drug Info | Phase 4 | Insomnia | ICD11: 7A00 | [212] |
Ketazolam |
Drug Info | Phase 4 | Anxiety disorder | ICD11: 6B00 | [213] |
Lofexidine |
Drug Info | Phase 4 | Opiate dependence | ICD11: 6C43 | [214] |
Milnacipran |
Drug Info | Phase 4 | Asperger syndrome | ICD11: 6A02 | [215] |
Milnacipran |
Drug Info | Phase 4 | Asperger syndrome | ICD11: 6A02 | [216] |
Proguanil |
Drug Info | Phase 4 | Malaria | ICD11: 1F40 | [217] |
Glucosamine |
Drug Info | Phase 4 | Osteoarthritis | ICD11: FA00 | [218] |
Benzethonium |
Drug Info | Phase 4 | Methicillin-resistant staphylococcus infection | ICD11: 1D01 | [65] |
| Drugs in Phase 3 Clinical Trial | Click to Show/Hide the Full List of Drugs: 22 Drugs | ||||
PF-04965842 |
Drug Info | Phase 3 | Atopic dermatitis | ICD11: EA80 | [219] |
E-3A |
Drug Info | Phase 3 | Turner syndrome | ICD11: LD50 | [220] |
Fruquintinib |
Drug Info | Phase 3 | Solid tumour/cancer | ICD11: 2A00-2F9Z | [221] |
Selumetinib |
Drug Info | Phase 3 | Neurofibromatosis | ICD11: LD2D | [222], [223] |
PG-490 |
Drug Info | Phase 3 | Diabetes mellitus | ICD11: 5A10 | [224] |
BMS-298585 |
Drug Info | Phase 3 | Diabetes mellitus | ICD11: 5A10 | [225] |
BMS-650032 |
Drug Info | Phase 3 | Viral hepatitis | ICD11: 1E51 | [226] |
Tivantinib |
Drug Info | Phase 3 | Solid tumour/cancer | ICD11: 2A00-2F9Z | [227] |
Mavacamten |
Drug Info | Phase 3 | Hypertrophic cardiomyopathy | ICD11: BC43 | [228] |
RO-111163 |
Drug Info | Phase 3 | Hypersalivation | ICD11: DA04 | [229] |
GW-1000 |
Drug Info | Phase 3 | Cerebral vasospasm | ICD11: BA85 | [230] |
LY-450139 |
Drug Info | Phase 3 | Alzheimer disease | ICD11: 8A20 | [231] |
Fenfluramine |
Drug Info | Phase 3 | Dravet syndrome | ICD11: 8A61-8A6Z | [232] |
INCB-024360 |
Drug Info | Phase 3 | Renal cell carcinoma | ICD11: 2C90 | [233] |
BAY-8697661 |
Drug Info | Phase 3 | Hepatocellular carcinoma | ICD11: 2C12 | [234] |
Ganaxolone |
Drug Info | Phase 3 | Complex partial seizure | ICD11: 8A61-8A6Z | [235] |
JNJ-54135419 |
Drug Info | Phase 3 | Depression | ICD11: 6A71 | [236] |
PT2977 |
Drug Info | Phase 3 | Renal cell carcinoma | ICD11: 2C90 | [237] |
WY-1485 |
Drug Info | Phase 3 | Haemorrhagic stroke | ICD11: 8B20 | [50] |
Ag-221 |
Drug Info | Phase 3 | Acute myelogenous leukaemia | ICD11: 2A41 | [238] |
CYT-387 |
Drug Info | Phase 3 | Myelofibrosis | ICD11: 2A22 | [239] |
Palovarotene |
Drug Info | Phase 3 | Fibrodysplasia ossificans progressiva | ICD11: FB31 | [240] |
| Drugs in Phase 2 Clinical Trial | Click to Show/Hide the Full List of Drugs: 24 Drugs | ||||
Fexinidazole |
Drug Info | Phase 2/3 | Trypanosomiasis | ICD11: 1D51-1F53 | [241], [242] |
Fexinidazole |
Drug Info | Phase 2/3 | Trypanosomiasis | ICD11: 1D51-1F53 | [242] |
HOE-239 |
Drug Info | Phase 2/3 | Trypanosomiasis | ICD11: 1F51 | [242] |
PF-06463922 |
Drug Info | Phase 2 | Lung cancer | ICD11: 2C25 | [243] |
LIK-066 |
Drug Info | Phase 2 | Heart failure | ICD11: BD10-BD1Z | [244] |
SQ-109 |
Drug Info | Phase 2 | Pulmonary tuberculosis | ICD11: 1B10 | [245] |
PT2385 |
Drug Info | Phase 2 | Von hippel-lindau disease | ICD11: 5A75 | [246] |
Remogliflozin etabonate |
Drug Info | Phase 2 | Type-1/2 diabetes | ICD11: 5A10-5A11 | [247] |
S-777469 |
Drug Info | Phase 2 | Atopic dermatitis | ICD11: EA80 | [248] |
SSR-97193 |
Drug Info | Phase 2 | Malaria | ICD11: 1F40 | [249] |
HE-3235 |
Drug Info | Phase 2 | Breast cancer | ICD11: 2C60 | [250] |
HP-184 |
Drug Info | Phase 2 | Multiple sclerosis | ICD11: 8A40 | [251] |
(Z)-endoxifen |
Drug Info | Phase 2 | Breast cancer | ICD11: 2C60-2C6Y | [252] |
AV-650 |
Drug Info | Phase 2 | Cerebral vasospasm | ICD11: BA85 | [253] |
Ladostigil |
Drug Info | Phase 2 | Alzheimer disease | ICD11: 8A20 | [254] |
AS-703026 |
Drug Info | Phase 2 | Mantle cell lymphoma | ICD11: 2A85 | [255] |
Dextofisopam |
Drug Info | Phase 2 | Irritable bowel syndrome | ICD11: DD91 | [256] |
HPPH |
Drug Info | Phase 2 | Lung cancer | ICD11: 2C25 | [257] |
JI-101 |
Drug Info | Phase 2 | Solid tumour/cancer | ICD11: 2A00-2F9Z | [258] |
Verubulin |
Drug Info | Phase 2 | Brain cancer | ICD11: 2A00 | [259] |
E-7070 |
Drug Info | Phase 2 | Breast cancer | ICD11: 2C60 | [260] |
PF-04937319 |
Drug Info | Phase 2 | Type-2 diabetes | ICD11: 5A11 | [261] |
PTC299 |
Drug Info | Phase 2 | Solid tumour/cancer | ICD11: 2A00-2F9Z | [262] |
TAK-906 |
Drug Info | Phase 2 | Gastroparesis | ICD11: DA41 | [263] |
| Drugs in Phase 1 Clinical Trial | Click to Show/Hide the Full List of Drugs: 10 Drugs | ||||
CB-3304 |
Drug Info | Phase 1/2 | Chronic lymphocytic leukaemia | ICD11: 2A82 | [264] |
TRV-130 |
Drug Info | Phase 1/2 | Hypothyroidism | ICD11: 5A00 | [265] |
GTPL7557 |
Drug Info | Phase 1/2 | Schizophrenia | ICD11: 6A20 | [266] |
AST-1306 |
Drug Info | Phase 1 | Solid tumour/cancer | ICD11: 2A00-2F9Z | [267] |
BE-14348A |
Drug Info | Phase 1 | Viral hepatitis | ICD11: 1E51 | [268] |
H3B-6545 |
Drug Info | Phase 1 | Breast cancer | ICD11: 2C60 | [269] |
Alvespimycin hydrochloride |
Drug Info | Phase 1 | Ovarian cancer | ICD11: 2C73 | [270] |
GDC-0623 |
Drug Info | Phase 1 | Solid tumour/cancer | ICD11: 2A00-2F9Z | [271] |
G-23350 |
Drug Info | Phase 1 | Venous thromboembolism | ICD11: BD72 | [11] |
ITX-5061 |
Drug Info | Phase 1 | Human immunodeficiency virus infection | ICD11: 1C60 | [272] |
| Discontinued/withdrawn Drugs | Click to Show/Hide the Full List of Drugs: 15 Drugs | ||||
Almokalant |
Drug Info | Discontinued in Phase 3 | Cardiac arrhythmias | ICD11: BC9Z | [273] |
KRP-297 |
Drug Info | Discontinued in Phase 2 | Hypertriglyceridaemia | ICD11: 5C80 | [274] |
AZD0328 |
Drug Info | Discontinued in Phase 2 | Alzheimer disease | ICD11: 8A20 | [275] |
YM-992 |
Drug Info | Discontinued in Phase 2 | Depression | ICD11: 6A70-6A7Z | [276] |
BMS-181168 |
Drug Info | Discontinued in Phase 2 | Cognitive impairment | ICD11: 6D71 | [277] |
SINOMENINE |
Drug Info | Discontinued in Phase 2 | Rheumatoid arthritis | ICD11: FA20 | [278] |
AZD0837 |
Drug Info | Discontinued in Phase 2 | Atrial fibrillation | ICD11: BC81 | [279] |
E2101 |
Drug Info | Discontinued in Phase 1 | Dyskinesia | ICD11: 8A02 | [280] |
CAM-2028 |
Drug Info | Discontinued | Acute nasopharyngitis | ICD11: CA00 | [218] |
Nomifensine |
Drug Info | Discontinued | Depression | ICD11: 6A71 | [281] |
ML-3000 |
Drug Info | Discontinued | Osteoarthritis | ICD11: FA00 | [11] |
ABT-001 |
Drug Info | Discontinued | Asthma | ICD11: CA23 | [282] |
DEA-2250 |
Drug Info | Discontinued | Epilepsy | ICD11: 8A60 | [283] |
GW-873140 |
Drug Info | Discontinued | Human immunodeficiency virus infection | ICD11: 1C60 | [284] |
INN-00835 |
Drug Info | Discontinued | Depression | ICD11: 6A71 | [285] |
| Preclinical/investigative Agents | Click to Show/Hide the Full List of Drugs: 10 Drugs | ||||
EPX-100 |
Drug Info | Preclinical | Dravet syndrome | ICD11: 8A61 | [286] |
VA-10872 |
Drug Info | Preclinical | Anaesthesia | ICD11: 8E22 | [287] |
Bufuralol |
Drug Info | Investigative | Cardiac arrhythmia | ICD11: BC65 | [288] |
Adinazolam |
Drug Info | Investigative | Anxiety disorder | ICD11: 6B00 | [289] |
Bromazepam |
Drug Info | Investigative | Anxiety disorder | ICD11: 6B00 | [290] |
Medazepam |
Drug Info | Investigative | Discovery agent | ICD: N.A. | [291] |
Antipyrine |
Drug Info | Investigative | Discovery agent | ICD: N.A. | [292] |
Linalool |
Drug Info | Investigative | Colon cancer | ICD11: 2B90 | [293], [294], [295] |
Cyamemazine |
Drug Info | Investigative | Discovery agent | ICD: N.A. | [296], [297] |
Nordazepam |
Drug Info | Investigative | Anxiety disorder | ICD11: 6B00 | [298] |
| Tissue/Disease-Specific Protein Abundances of This DME | |||||
|---|---|---|---|---|---|
| Tissue-specific Protein Abundances in Healthy Individuals | Click to Show/Hide | ||||
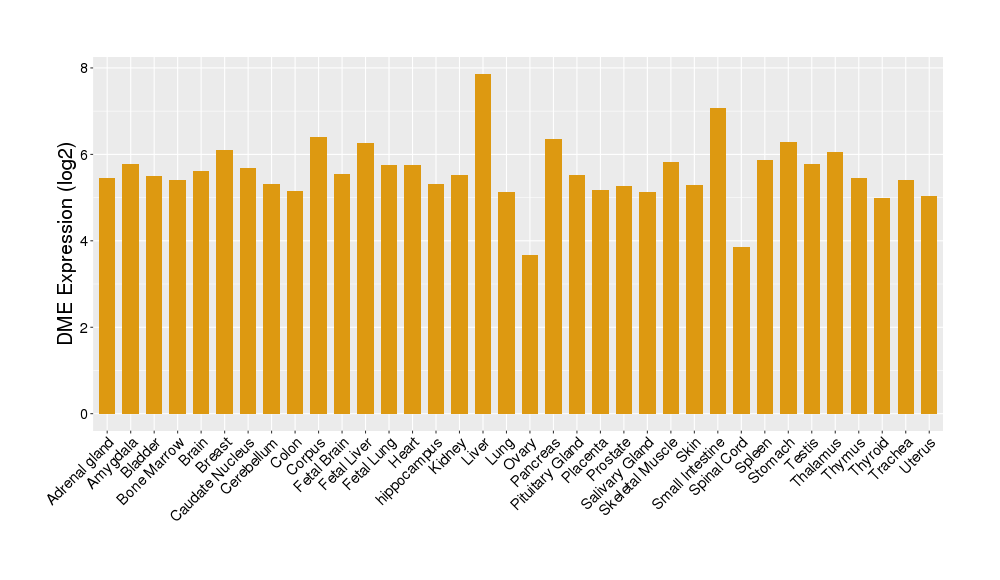
|
|||||
| ICD Disease Classification 01 | Infectious/parasitic disease | Click to Show/Hide | |||
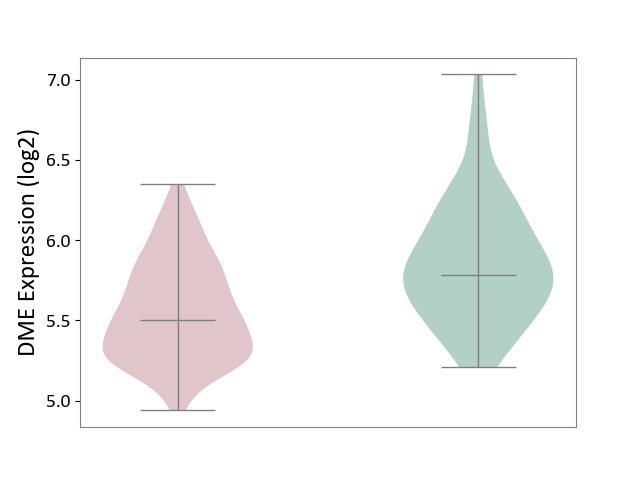
| ICD-11: 1C1H | Necrotising ulcerative gingivitis | Click to Show/Hide | |||
| The Studied Tissue | Gingival tissue | ||||
| The Specified Disease | Bacterial infection of gingival [ICD-11:1C1H] | ||||
| The Expression Level of Disease Section Compare with the Healthy Individual Tissue | p-value: 1.16E-07; Fold-change: -2.81E-01; Z-score: -7.41E-01 | ||||
|
DME expression in the diseased tissue of patients
DME expression in the normal tissue of healthy individuals
|
|||||
| Violin Diagram of DME Disease-specific Protein Abundances |
|
Click to View the Clearer Original Diagram | |||
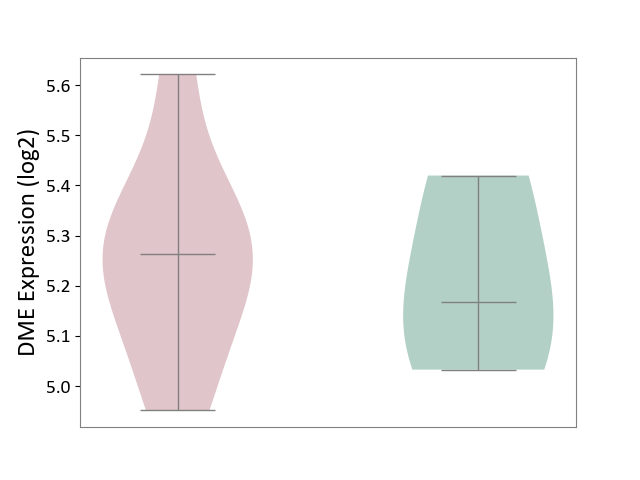
| ICD-11: 1E30 | Influenza | Click to Show/Hide | |||
| The Studied Tissue | Whole blood | ||||
| The Specified Disease | Influenza [ICD-11:1E30] | ||||
| The Expression Level of Disease Section Compare with the Healthy Individual Tissue | p-value: 7.61E-01; Fold-change: 9.45E-02; Z-score: 4.82E-01 | ||||
|
DME expression in the diseased tissue of patients
DME expression in the normal tissue of healthy individuals
|
|||||
| Violin Diagram of DME Disease-specific Protein Abundances |
|
Click to View the Clearer Original Diagram | |||
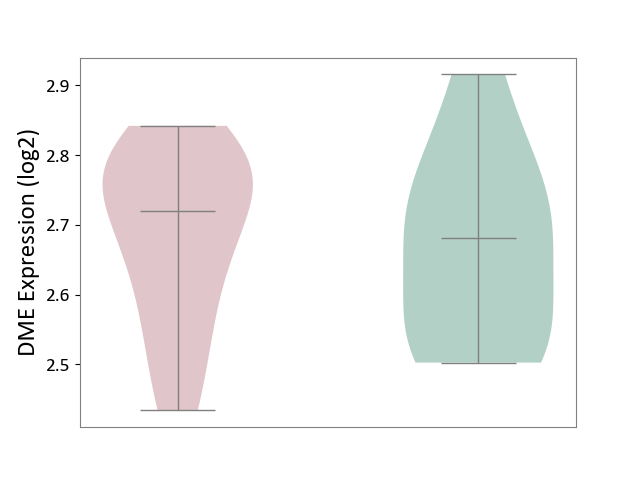
| ICD-11: 1E51 | Chronic viral hepatitis | Click to Show/Hide | |||
| The Studied Tissue | Whole blood | ||||
| The Specified Disease | Chronic hepatitis C [ICD-11:1E51.1] | ||||
| The Expression Level of Disease Section Compare with the Healthy Individual Tissue | p-value: 7.35E-01; Fold-change: 3.90E-02; Z-score: 2.84E-01 | ||||
|
DME expression in the diseased tissue of patients
DME expression in the normal tissue of healthy individuals
|
|||||
| Violin Diagram of DME Disease-specific Protein Abundances |
|
Click to View the Clearer Original Diagram | |||
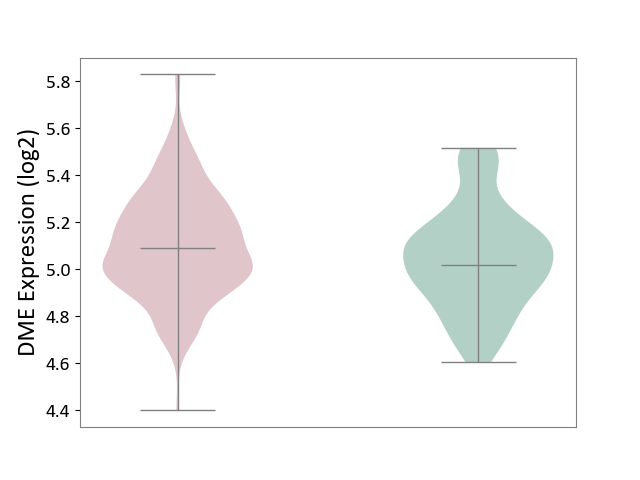
| ICD-11: 1G41 | Sepsis with septic shock | Click to Show/Hide | |||
| The Studied Tissue | Whole blood | ||||
| The Specified Disease | Sepsis with septic shock [ICD-11:1G41] | ||||
| The Expression Level of Disease Section Compare with the Healthy Individual Tissue | p-value: 3.26E-03; Fold-change: 7.59E-02; Z-score: 3.47E-01 | ||||
|
DME expression in the diseased tissue of patients
DME expression in the normal tissue of healthy individuals
|
|||||
| Violin Diagram of DME Disease-specific Protein Abundances |
|
Click to View the Clearer Original Diagram | |||
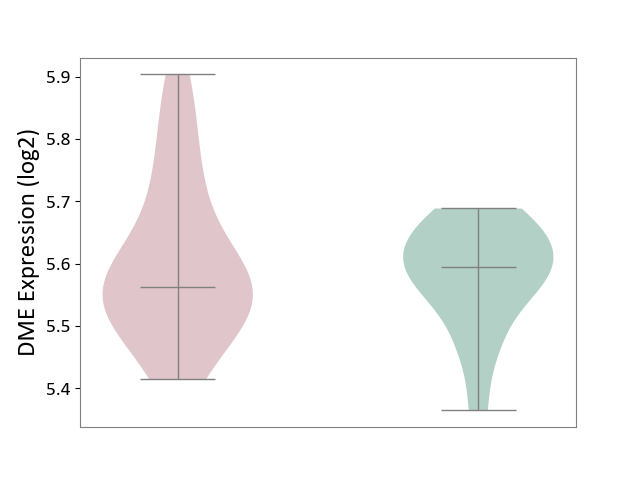
| ICD-11: CA40 | Respiratory syncytial virus infection | Click to Show/Hide | |||
| The Studied Tissue | Peripheral blood | ||||
| The Specified Disease | Pediatric respiratory syncytial virus infection [ICD-11:CA40.11] | ||||
| The Expression Level of Disease Section Compare with the Healthy Individual Tissue | p-value: 5.37E-01; Fold-change: -3.22E-02; Z-score: -3.78E-01 | ||||
|
DME expression in the diseased tissue of patients
DME expression in the normal tissue of healthy individuals
|
|||||
| Violin Diagram of DME Disease-specific Protein Abundances |
|
Click to View the Clearer Original Diagram | |||
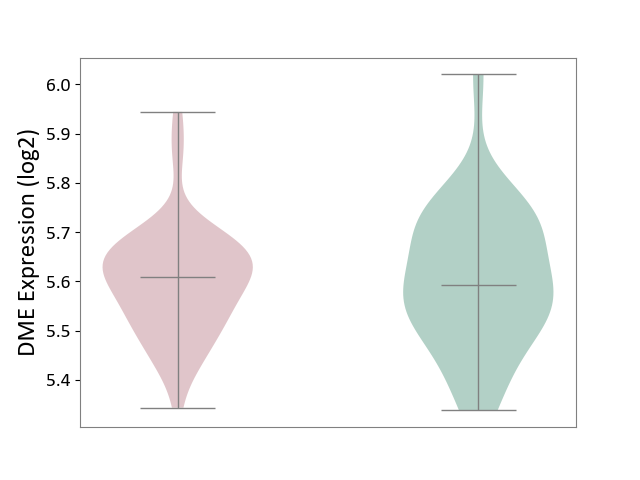
| ICD-11: CA42 | Rhinovirus infection | Click to Show/Hide | |||
| The Studied Tissue | Nasal epithelium tissue | ||||
| The Specified Disease | Rhinovirus infection [ICD-11:CA42.1] | ||||
| The Expression Level of Disease Section Compare with the Healthy Individual Tissue | p-value: 8.48E-01; Fold-change: 1.51E-02; Z-score: 1.06E-01 | ||||
|
DME expression in the diseased tissue of patients
DME expression in the normal tissue of healthy individuals
|
|||||
| Violin Diagram of DME Disease-specific Protein Abundances |
|
Click to View the Clearer Original Diagram | |||
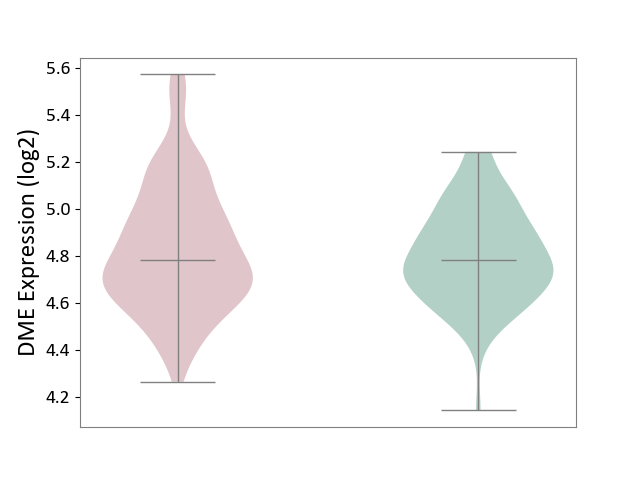
| ICD-11: KA60 | Neonatal sepsis | Click to Show/Hide | |||
| The Studied Tissue | Whole blood | ||||
| The Specified Disease | Neonatal sepsis [ICD-11:KA60] | ||||
| The Expression Level of Disease Section Compare with the Healthy Individual Tissue | p-value: 4.08E-01; Fold-change: 2.70E-03; Z-score: 1.32E-02 | ||||
|
DME expression in the diseased tissue of patients
DME expression in the normal tissue of healthy individuals
|
|||||
| Violin Diagram of DME Disease-specific Protein Abundances |
|
Click to View the Clearer Original Diagram | |||
| ICD Disease Classification 02 | Neoplasm | Click to Show/Hide | |||
| ICD-11: 2A00 | Brain cancer | Click to Show/Hide | |||
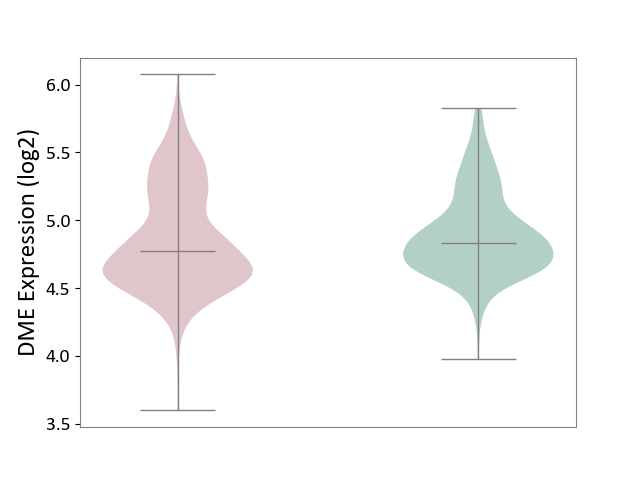
| The Studied Tissue | Nervous tissue | ||||
| The Specified Disease | Glioblastopma [ICD-11:2A00.00] | ||||
| The Expression Level of Disease Section Compare with the Healthy Individual Tissue | p-value: 9.91E-02; Fold-change: -6.39E-02; Z-score: -2.08E-01 | ||||
|
DME expression in the diseased tissue of patients
DME expression in the normal tissue of healthy individuals
|
|||||
| Violin Diagram of DME Disease-specific Protein Abundances |
|
Click to View the Clearer Original Diagram | |||
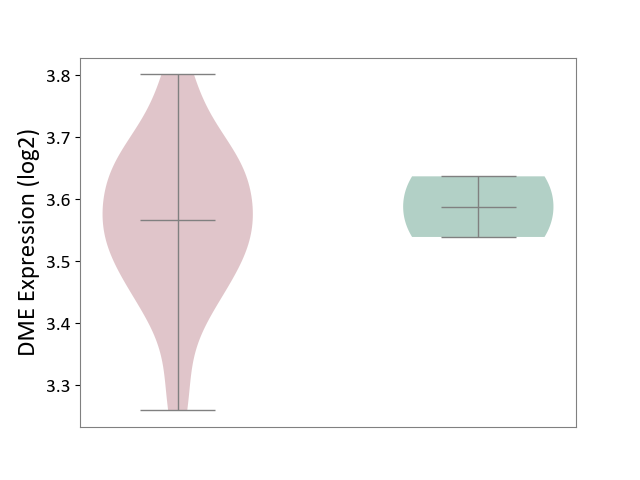
| The Studied Tissue | Brain stem tissue | ||||
| The Specified Disease | Glioma [ICD-11:2A00.0Y-2A00.0Z] | ||||
| The Expression Level of Disease Section Compare with the Healthy Individual Tissue | p-value: 7.14E-01; Fold-change: -2.20E-02; Z-score: -3.18E-01 | ||||
|
DME expression in the diseased tissue of patients
DME expression in the normal tissue of healthy individuals
|
|||||
| Violin Diagram of DME Disease-specific Protein Abundances |
|
Click to View the Clearer Original Diagram | |||
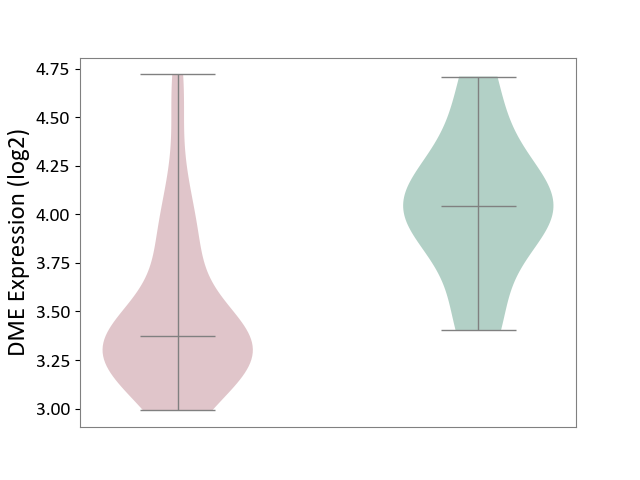
| The Studied Tissue | White matter tissue | ||||
| The Specified Disease | Glioma [ICD-11:2A00.0Y-2A00.0Z] | ||||
| The Expression Level of Disease Section Compare with the Healthy Individual Tissue | p-value: 4.16E-04; Fold-change: -6.72E-01; Z-score: -1.83E+00 | ||||
|
DME expression in the diseased tissue of patients
DME expression in the normal tissue of healthy individuals
|
|||||
| Violin Diagram of DME Disease-specific Protein Abundances |
|
Click to View the Clearer Original Diagram | |||
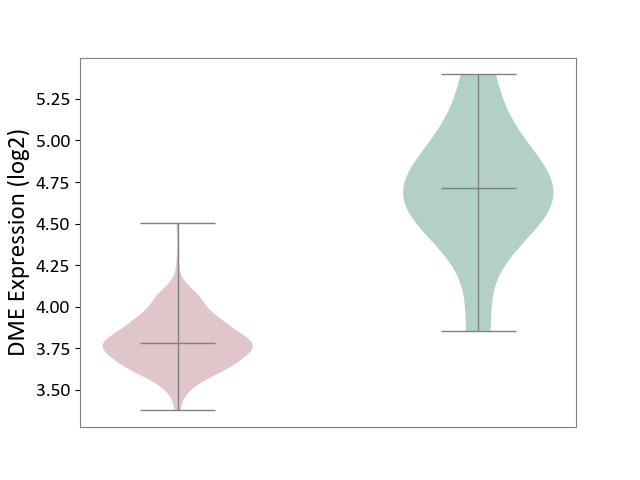
| The Studied Tissue | Brain stem tissue | ||||
| The Specified Disease | Neuroectodermal tumour [ICD-11:2A00.11] | ||||
| The Expression Level of Disease Section Compare with the Healthy Individual Tissue | p-value: 4.94E-05; Fold-change: -9.30E-01; Z-score: -2.34E+00 | ||||
|
DME expression in the diseased tissue of patients
DME expression in the normal tissue of healthy individuals
|
|||||
| Violin Diagram of DME Disease-specific Protein Abundances |
|
Click to View the Clearer Original Diagram | |||
| ICD-11: 2A20 | Myeloproliferative neoplasm | Click to Show/Hide | |||
| The Studied Tissue | Whole blood | ||||
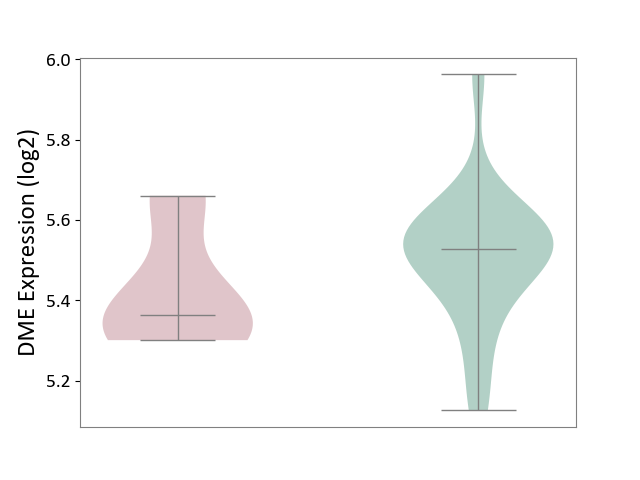
| The Specified Disease | Myelofibrosis [ICD-11:2A20.2] | ||||
| The Expression Level of Disease Section Compare with the Healthy Individual Tissue | p-value: 1.74E-01; Fold-change: -1.64E-01; Z-score: -9.73E-01 | ||||
|
DME expression in the diseased tissue of patients
DME expression in the normal tissue of healthy individuals
|
|||||
| Violin Diagram of DME Disease-specific Protein Abundances |
|
Click to View the Clearer Original Diagram | |||
| The Studied Tissue | Whole blood | ||||
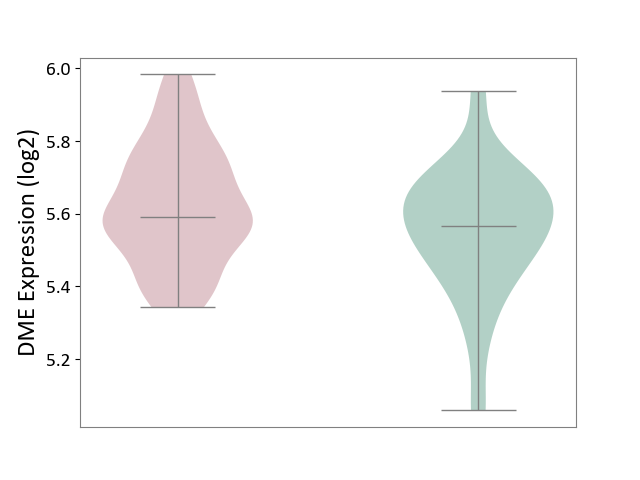
| The Specified Disease | Polycythemia vera [ICD-11:2A20.4] | ||||
| The Expression Level of Disease Section Compare with the Healthy Individual Tissue | p-value: 3.88E-02; Fold-change: 2.48E-02; Z-score: 1.36E-01 | ||||
|
DME expression in the diseased tissue of patients
DME expression in the normal tissue of healthy individuals
|
|||||
| Violin Diagram of DME Disease-specific Protein Abundances |
|
Click to View the Clearer Original Diagram | |||
| ICD-11: 2A36 | Myelodysplastic syndrome | Click to Show/Hide | |||
| The Studied Tissue | Bone marrow | ||||
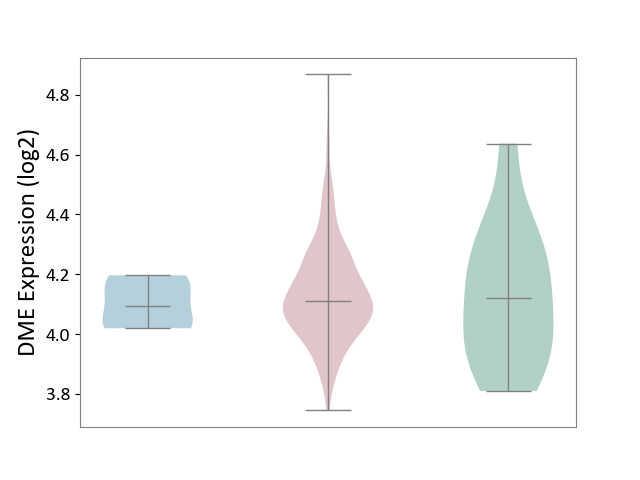
| The Specified Disease | Myelodysplastic syndrome [ICD-11:2A36-2A3Z] | ||||
| The Expression Level of Disease Section Compare with the Healthy Individual Tissue | p-value: 8.92E-01; Fold-change: -9.92E-03; Z-score: -4.27E-02 | ||||
| The Expression Level of Disease Section Compare with the Adjacent Tissue | p-value: 5.09E-01; Fold-change: 1.86E-02; Z-score: 2.09E-01 | ||||
|
DME expression in the diseased tissue of patients
DME expression in the normal tissue adjacent to the diseased tissue of patients
DME expression in the normal tissue of healthy individuals
|
|||||
| Violin Diagram of DME Disease-specific Protein Abundances |
|
Click to View the Clearer Original Diagram | |||
| ICD-11: 2A81 | Diffuse large B-cell lymphoma | Click to Show/Hide | |||
| The Studied Tissue | Tonsil tissue | ||||
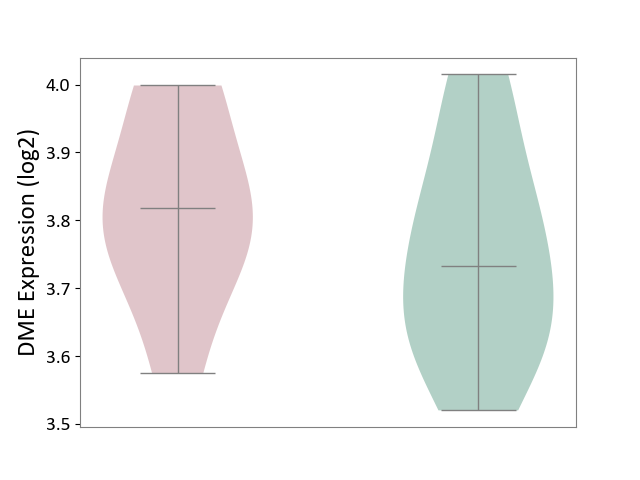
| The Specified Disease | Diffuse large B-cell lymphoma [ICD-11:2A81] | ||||
| The Expression Level of Disease Section Compare with the Healthy Individual Tissue | p-value: 3.46E-01; Fold-change: 8.52E-02; Z-score: 5.47E-01 | ||||
|
DME expression in the diseased tissue of patients
DME expression in the normal tissue of healthy individuals
|
|||||
| Violin Diagram of DME Disease-specific Protein Abundances |
|
Click to View the Clearer Original Diagram | |||
| ICD-11: 2A83 | Plasma cell neoplasm | Click to Show/Hide | |||
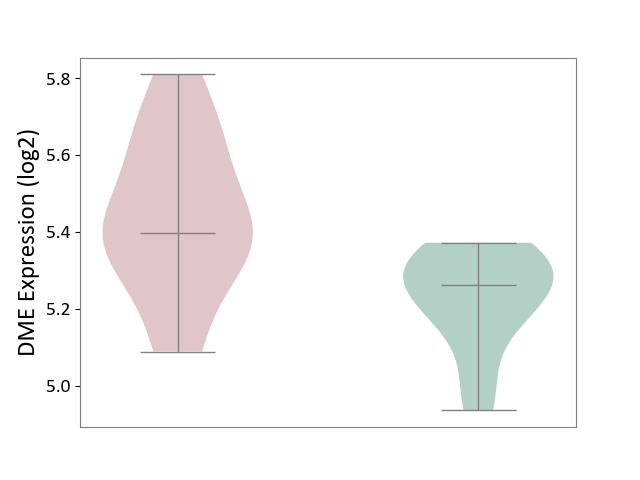
| The Studied Tissue | Peripheral blood | ||||
| The Specified Disease | Multiple myeloma [ICD-11:2A83.1] | ||||
| The Expression Level of Disease Section Compare with the Healthy Individual Tissue | p-value: 3.82E-03; Fold-change: 1.37E-01; Z-score: 1.05E+00 | ||||
|
DME expression in the diseased tissue of patients
DME expression in the normal tissue of healthy individuals
|
|||||
| Violin Diagram of DME Disease-specific Protein Abundances |
|
Click to View the Clearer Original Diagram | |||
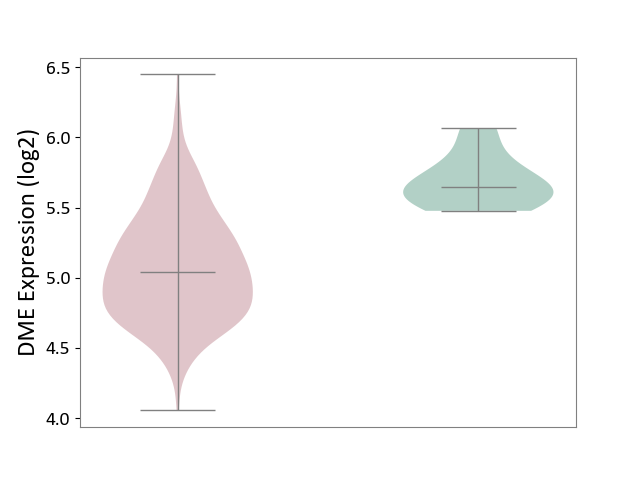
| The Studied Tissue | Bone marrow | ||||
| The Specified Disease | Multiple myeloma [ICD-11:2A83.1] | ||||
| The Expression Level of Disease Section Compare with the Healthy Individual Tissue | p-value: 3.09E-05; Fold-change: -6.05E-01; Z-score: -3.19E+00 | ||||
|
DME expression in the diseased tissue of patients
DME expression in the normal tissue of healthy individuals
|
|||||
| Violin Diagram of DME Disease-specific Protein Abundances |
|
Click to View the Clearer Original Diagram | |||
| ICD-11: 2B33 | Leukaemia | Click to Show/Hide | |||
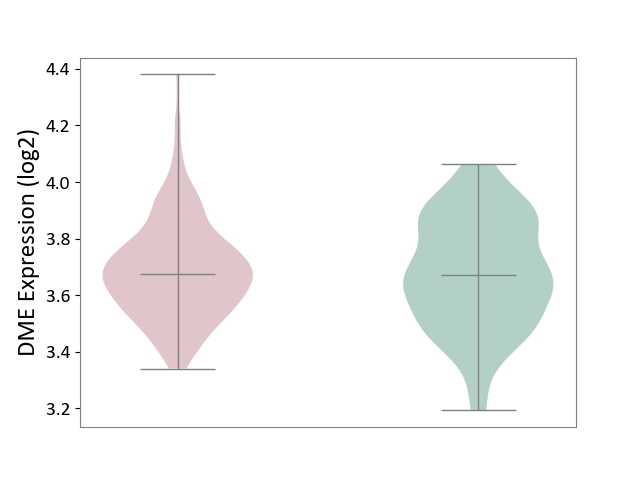
| The Studied Tissue | Bone marrow | ||||
| The Specified Disease | Acute myelocytic leukaemia [ICD-11:2B33.1] | ||||
| The Expression Level of Disease Section Compare with the Healthy Individual Tissue | p-value: 6.34E-01; Fold-change: 4.42E-03; Z-score: 2.22E-02 | ||||
|
DME expression in the diseased tissue of patients
DME expression in the normal tissue of healthy individuals
|
|||||
| Violin Diagram of DME Disease-specific Protein Abundances |
|
Click to View the Clearer Original Diagram | |||
| ICD-11: 2B6E | Oral cancer | Click to Show/Hide | |||
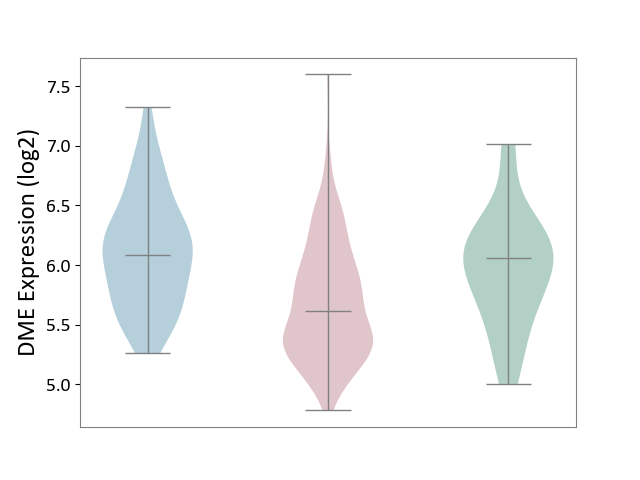
| The Studied Tissue | Oral tissue | ||||
| The Specified Disease | Oral cancer [ICD-11:2B6E] | ||||
| The Expression Level of Disease Section Compare with the Healthy Individual Tissue | p-value: 6.40E-03; Fold-change: -4.39E-01; Z-score: -9.19E-01 | ||||
| The Expression Level of Disease Section Compare with the Adjacent Tissue | p-value: 4.74E-11; Fold-change: -4.64E-01; Z-score: -9.83E-01 | ||||
|
DME expression in the diseased tissue of patients
DME expression in the normal tissue adjacent to the diseased tissue of patients
DME expression in the normal tissue of healthy individuals
|
|||||
| Violin Diagram of DME Disease-specific Protein Abundances |
|
Click to View the Clearer Original Diagram | |||
| ICD-11: 2B70 | Esophageal cancer | Click to Show/Hide | |||
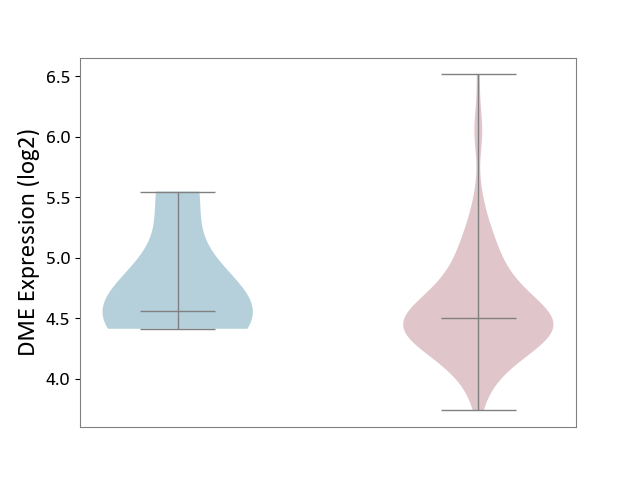
| The Studied Tissue | Esophagus | ||||
| The Specified Disease | Esophagal cancer [ICD-11:2B70] | ||||
| The Expression Level of Disease Section Compare with the Adjacent Tissue | p-value: 4.88E-01; Fold-change: -5.48E-02; Z-score: -1.19E-01 | ||||
|
DME expression in the diseased tissue of patients
DME expression in the normal tissue adjacent to the diseased tissue of patients
|
|||||
| Violin Diagram of DME Disease-specific Protein Abundances |
|
Click to View the Clearer Original Diagram | |||
| ICD-11: 2B72 | Stomach cancer | Click to Show/Hide | |||
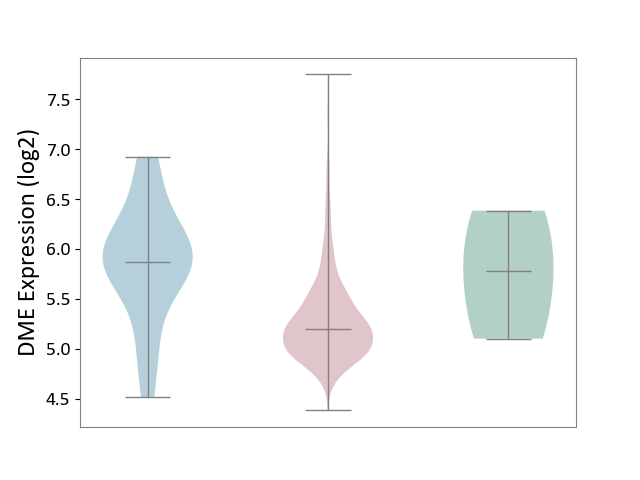
| The Studied Tissue | Gastric tissue | ||||
| The Specified Disease | Gastric cancer [ICD-11:2B72] | ||||
| The Expression Level of Disease Section Compare with the Healthy Individual Tissue | p-value: 3.38E-01; Fold-change: -5.76E-01; Z-score: -8.98E-01 | ||||
| The Expression Level of Disease Section Compare with the Adjacent Tissue | p-value: 1.02E-03; Fold-change: -6.68E-01; Z-score: -1.13E+00 | ||||
|
DME expression in the diseased tissue of patients
DME expression in the normal tissue adjacent to the diseased tissue of patients
DME expression in the normal tissue of healthy individuals
|
|||||
| Violin Diagram of DME Disease-specific Protein Abundances |
|
Click to View the Clearer Original Diagram | |||
| ICD-11: 2B90 | Colon cancer | Click to Show/Hide | |||
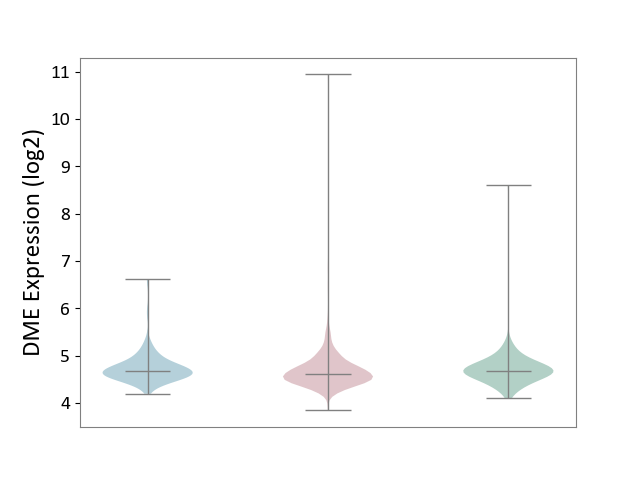
| The Studied Tissue | Colon tissue | ||||
| The Specified Disease | Colon cancer [ICD-11:2B90] | ||||
| The Expression Level of Disease Section Compare with the Healthy Individual Tissue | p-value: 1.98E-01; Fold-change: -6.06E-02; Z-score: -1.56E-01 | ||||
| The Expression Level of Disease Section Compare with the Adjacent Tissue | p-value: 6.24E-02; Fold-change: -5.65E-02; Z-score: -1.91E-01 | ||||
|
DME expression in the diseased tissue of patients
DME expression in the normal tissue adjacent to the diseased tissue of patients
DME expression in the normal tissue of healthy individuals
|
|||||
| Violin Diagram of DME Disease-specific Protein Abundances |
|
Click to View the Clearer Original Diagram | |||
| ICD-11: 2B92 | Rectal cancer | Click to Show/Hide | |||
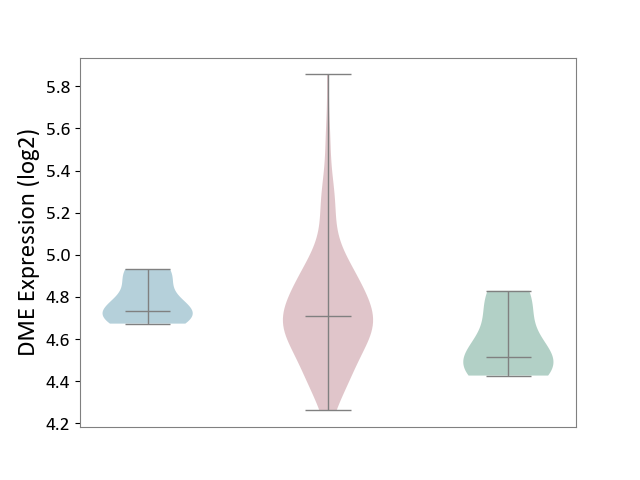
| The Studied Tissue | Rectal colon tissue | ||||
| The Specified Disease | Rectal cancer [ICD-11:2B92] | ||||
| The Expression Level of Disease Section Compare with the Healthy Individual Tissue | p-value: 5.51E-02; Fold-change: 1.95E-01; Z-score: 1.20E+00 | ||||
| The Expression Level of Disease Section Compare with the Adjacent Tissue | p-value: 5.25E-01; Fold-change: -2.30E-02; Z-score: -2.21E-01 | ||||
|
DME expression in the diseased tissue of patients
DME expression in the normal tissue adjacent to the diseased tissue of patients
DME expression in the normal tissue of healthy individuals
|
|||||
| Violin Diagram of DME Disease-specific Protein Abundances |
|
Click to View the Clearer Original Diagram | |||
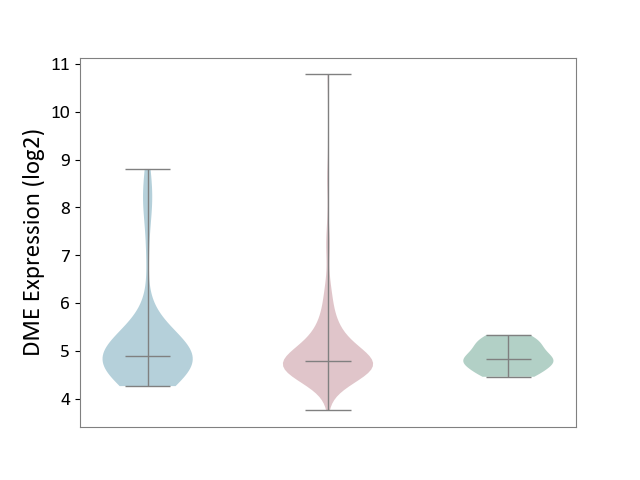
| ICD-11: 2C10 | Pancreatic cancer | Click to Show/Hide | |||
| The Studied Tissue | Pancreas | ||||
| The Specified Disease | Pancreatic cancer [ICD-11:2C10] | ||||
| The Expression Level of Disease Section Compare with the Healthy Individual Tissue | p-value: 7.82E-02; Fold-change: -4.38E-02; Z-score: -1.55E-01 | ||||
| The Expression Level of Disease Section Compare with the Adjacent Tissue | p-value: 3.22E-01; Fold-change: -1.19E-01; Z-score: -1.12E-01 | ||||
|
DME expression in the diseased tissue of patients
DME expression in the normal tissue adjacent to the diseased tissue of patients
DME expression in the normal tissue of healthy individuals
|
|||||
| Violin Diagram of DME Disease-specific Protein Abundances |
|
Click to View the Clearer Original Diagram | |||
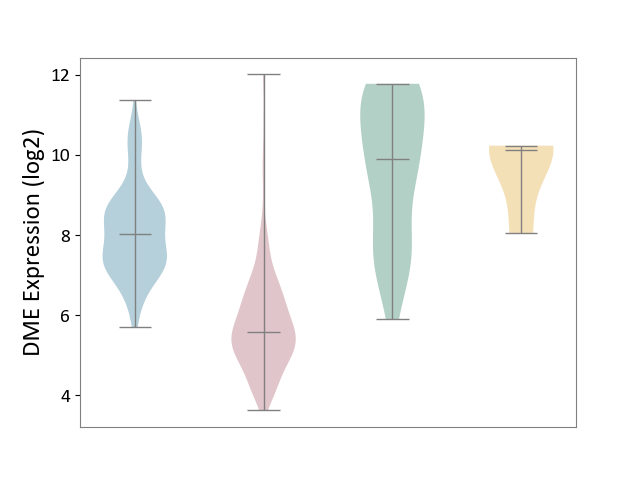
| ICD-11: 2C12 | Liver cancer | Click to Show/Hide | |||
| The Studied Tissue | Liver tissue | ||||
| The Specified Disease | Liver cancer [ICD-11:2C12.0] | ||||
| The Expression Level of Disease Section Compare with the Healthy Individual Tissue | p-value: 4.41E-18; Fold-change: -4.32E+00; Z-score: -2.45E+00 | ||||
| The Expression Level of Disease Section Compare with the Adjacent Tissue | p-value: 8.73E-75; Fold-change: -2.45E+00; Z-score: -2.20E+00 | ||||
| The Expression Level of Disease Section Compare with the Other Disease Section | p-value: 4.98E-03; Fold-change: -4.54E+00; Z-score: -4.27E+00 | ||||
|
DME expression in the diseased tissue of patients
DME expression in the normal tissue adjacent to the diseased tissue of patients
DME expression in the normal tissue of healthy individuals
DME expression in tissue other than the diseased tissue of patients
|
|||||
| Violin Diagram of DME Disease-specific Protein Abundances |
|
Click to View the Clearer Original Diagram | |||
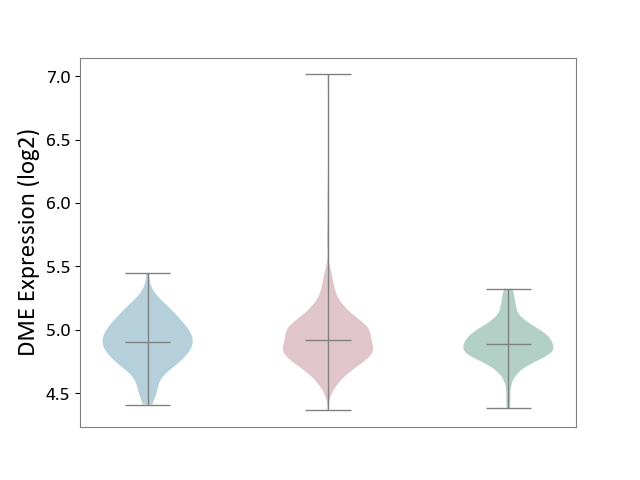
| ICD-11: 2C25 | Lung cancer | Click to Show/Hide | |||
| The Studied Tissue | Lung tissue | ||||
| The Specified Disease | Lung cancer [ICD-11:2C25] | ||||
| The Expression Level of Disease Section Compare with the Healthy Individual Tissue | p-value: 1.08E-02; Fold-change: 2.60E-02; Z-score: 1.59E-01 | ||||
| The Expression Level of Disease Section Compare with the Adjacent Tissue | p-value: 1.07E-01; Fold-change: 1.26E-02; Z-score: 6.37E-02 | ||||
|
DME expression in the diseased tissue of patients
DME expression in the normal tissue adjacent to the diseased tissue of patients
DME expression in the normal tissue of healthy individuals
|
|||||
| Violin Diagram of DME Disease-specific Protein Abundances |
|
Click to View the Clearer Original Diagram | |||
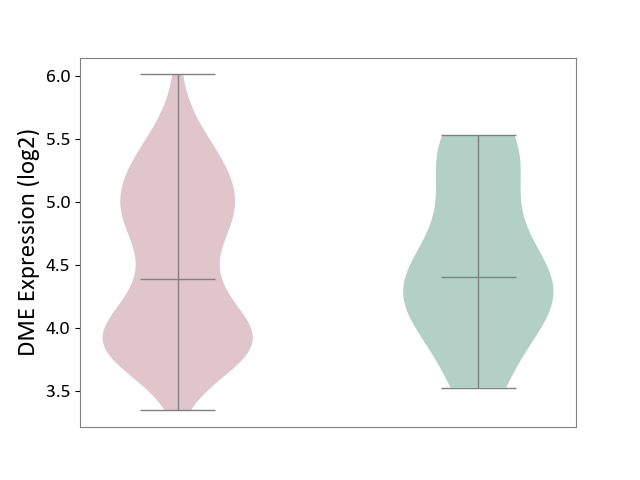
| ICD-11: 2C30 | Skin cancer | Click to Show/Hide | |||
| The Studied Tissue | Skin | ||||
| The Specified Disease | Melanoma [ICD-11:2C30] | ||||
| The Expression Level of Disease Section Compare with the Healthy Individual Tissue | p-value: 8.42E-01; Fold-change: -1.13E-02; Z-score: -1.81E-02 | ||||
|
DME expression in the diseased tissue of patients
DME expression in the normal tissue of healthy individuals
|
|||||
| Violin Diagram of DME Disease-specific Protein Abundances |
|
Click to View the Clearer Original Diagram | |||
| The Studied Tissue | Skin | ||||
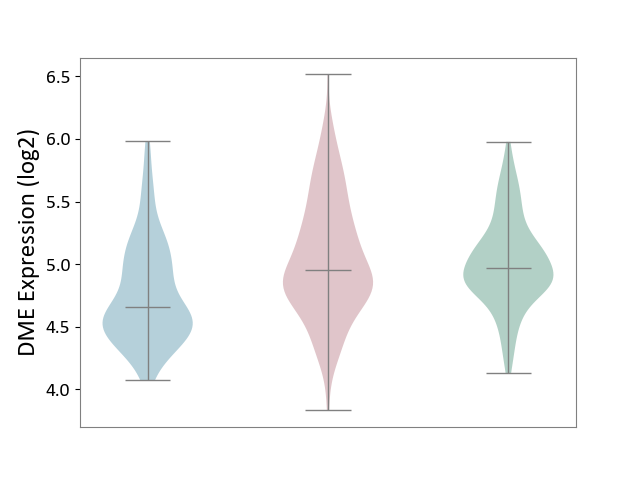
| The Specified Disease | Skin cancer [ICD-11:2C30-2C3Z] | ||||
| The Expression Level of Disease Section Compare with the Healthy Individual Tissue | p-value: 3.87E-01; Fold-change: -1.26E-02; Z-score: -3.57E-02 | ||||
| The Expression Level of Disease Section Compare with the Adjacent Tissue | p-value: 1.08E-12; Fold-change: 3.02E-01; Z-score: 7.54E-01 | ||||
|
DME expression in the diseased tissue of patients
DME expression in the normal tissue adjacent to the diseased tissue of patients
DME expression in the normal tissue of healthy individuals
|
|||||
| Violin Diagram of DME Disease-specific Protein Abundances |
|
Click to View the Clearer Original Diagram | |||
| ICD-11: 2C6Z | Breast cancer | Click to Show/Hide | |||
| The Studied Tissue | Breast tissue | ||||
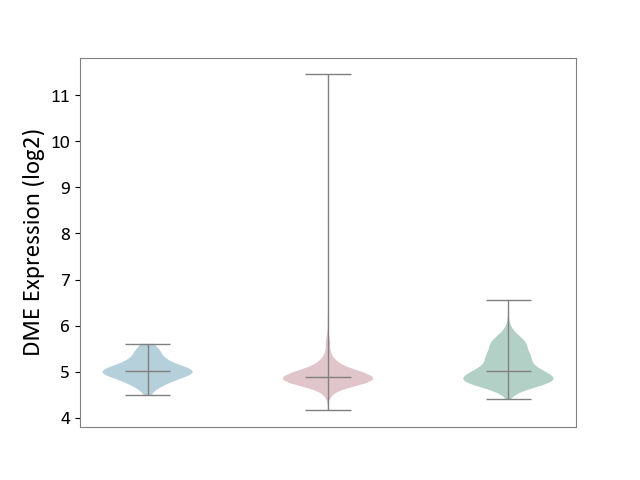
| The Specified Disease | Breast cancer [ICD-11:2C60-2C6Z] | ||||
| The Expression Level of Disease Section Compare with the Healthy Individual Tissue | p-value: 3.84E-13; Fold-change: -1.34E-01; Z-score: -3.71E-01 | ||||
| The Expression Level of Disease Section Compare with the Adjacent Tissue | p-value: 1.53E-03; Fold-change: -1.35E-01; Z-score: -5.64E-01 | ||||
|
DME expression in the diseased tissue of patients
DME expression in the normal tissue adjacent to the diseased tissue of patients
DME expression in the normal tissue of healthy individuals
|
|||||
| Violin Diagram of DME Disease-specific Protein Abundances |
|
Click to View the Clearer Original Diagram | |||
| ICD-11: 2C73 | Ovarian cancer | Click to Show/Hide | |||
| The Studied Tissue | Ovarian tissue | ||||
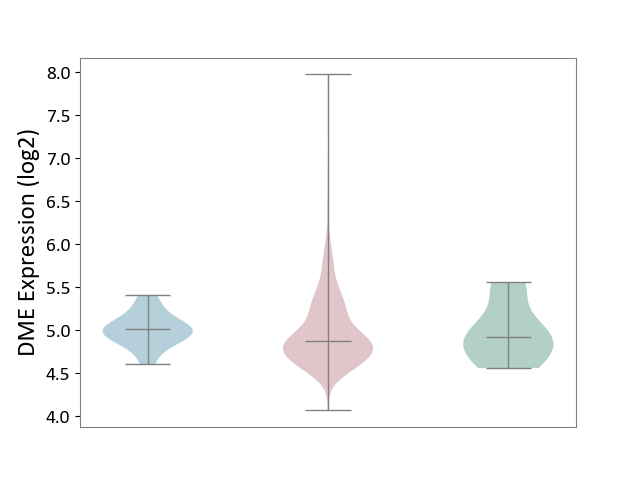
| The Specified Disease | Ovarian cancer [ICD-11:2C73] | ||||
| The Expression Level of Disease Section Compare with the Healthy Individual Tissue | p-value: 8.74E-01; Fold-change: -3.97E-02; Z-score: -1.15E-01 | ||||
| The Expression Level of Disease Section Compare with the Adjacent Tissue | p-value: 7.54E-01; Fold-change: -1.36E-01; Z-score: -6.78E-01 | ||||
|
DME expression in the diseased tissue of patients
DME expression in the normal tissue adjacent to the diseased tissue of patients
DME expression in the normal tissue of healthy individuals
|
|||||
| Violin Diagram of DME Disease-specific Protein Abundances |
|
Click to View the Clearer Original Diagram | |||
| ICD-11: 2C77 | Cervical cancer | Click to Show/Hide | |||
| The Studied Tissue | Cervical tissue | ||||
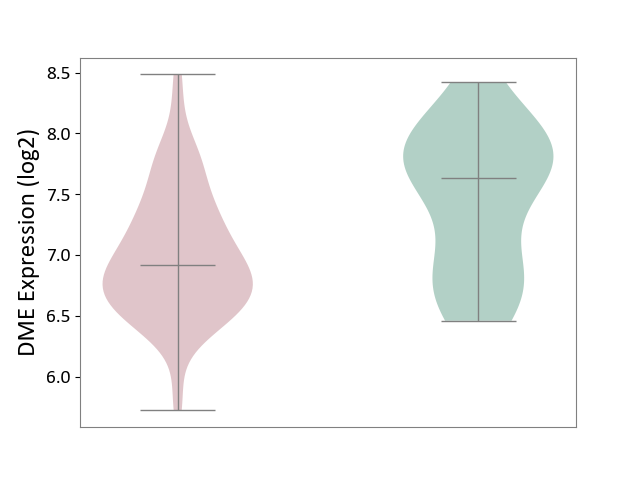
| The Specified Disease | Cervical cancer [ICD-11:2C77] | ||||
| The Expression Level of Disease Section Compare with the Healthy Individual Tissue | p-value: 4.73E-03; Fold-change: -7.15E-01; Z-score: -1.21E+00 | ||||
|
DME expression in the diseased tissue of patients
DME expression in the normal tissue of healthy individuals
|
|||||
| Violin Diagram of DME Disease-specific Protein Abundances |
|
Click to View the Clearer Original Diagram | |||
| ICD-11: 2C78 | Uterine cancer | Click to Show/Hide | |||
| The Studied Tissue | Endometrium tissue | ||||
| The Specified Disease | Uterine cancer [ICD-11:2C78] | ||||
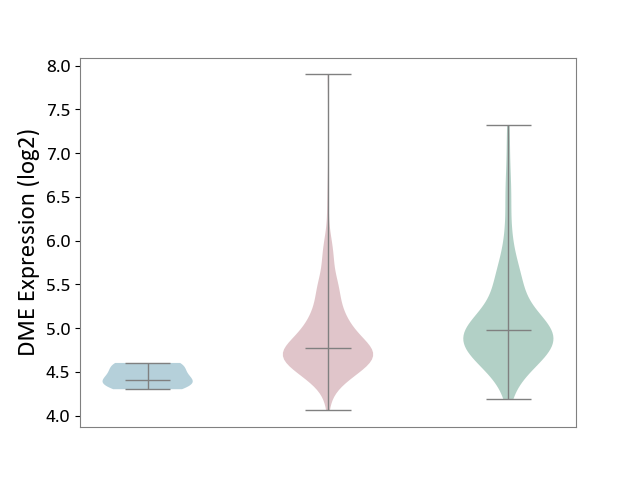
| The Expression Level of Disease Section Compare with the Healthy Individual Tissue | p-value: 1.07E-03; Fold-change: -2.00E-01; Z-score: -3.54E-01 | ||||
| The Expression Level of Disease Section Compare with the Adjacent Tissue | p-value: 3.35E-04; Fold-change: 3.68E-01; Z-score: 2.95E+00 | ||||
|
DME expression in the diseased tissue of patients
DME expression in the normal tissue adjacent to the diseased tissue of patients
DME expression in the normal tissue of healthy individuals
|
|||||
| Violin Diagram of DME Disease-specific Protein Abundances |
|
Click to View the Clearer Original Diagram | |||
| ICD-11: 2C82 | Prostate cancer | Click to Show/Hide | |||
| The Studied Tissue | Prostate | ||||
| The Specified Disease | Prostate cancer [ICD-11:2C82] | ||||
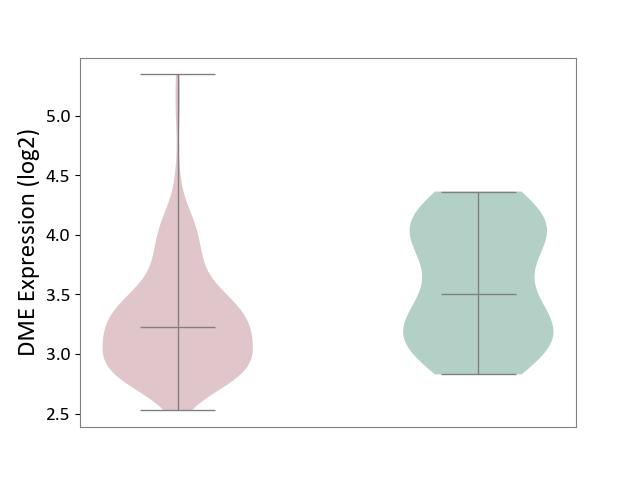
| The Expression Level of Disease Section Compare with the Healthy Individual Tissue | p-value: 1.39E-02; Fold-change: -2.78E-01; Z-score: -5.67E-01 | ||||
|
DME expression in the diseased tissue of patients
DME expression in the normal tissue of healthy individuals
|
|||||
| Violin Diagram of DME Disease-specific Protein Abundances |
|
Click to View the Clearer Original Diagram | |||
| ICD-11: 2C90 | Renal cancer | Click to Show/Hide | |||
| The Studied Tissue | Kidney | ||||
| The Specified Disease | Renal cancer [ICD-11:2C90-2C91] | ||||
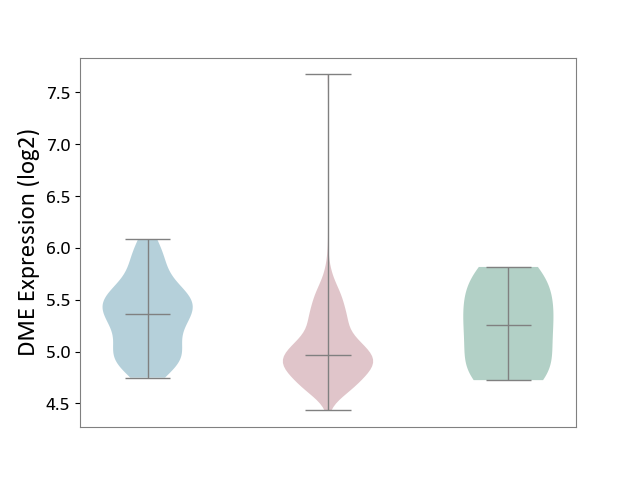
| The Expression Level of Disease Section Compare with the Healthy Individual Tissue | p-value: 1.02E-01; Fold-change: -2.84E-01; Z-score: -7.34E-01 | ||||
| The Expression Level of Disease Section Compare with the Adjacent Tissue | p-value: 3.37E-10; Fold-change: -3.97E-01; Z-score: -1.14E+00 | ||||
|
DME expression in the diseased tissue of patients
DME expression in the normal tissue adjacent to the diseased tissue of patients
DME expression in the normal tissue of healthy individuals
|
|||||
| Violin Diagram of DME Disease-specific Protein Abundances |
|
Click to View the Clearer Original Diagram | |||
| ICD-11: 2C92 | Ureter cancer | Click to Show/Hide | |||
| The Studied Tissue | Urothelium | ||||
| The Specified Disease | Ureter cancer [ICD-11:2C92] | ||||
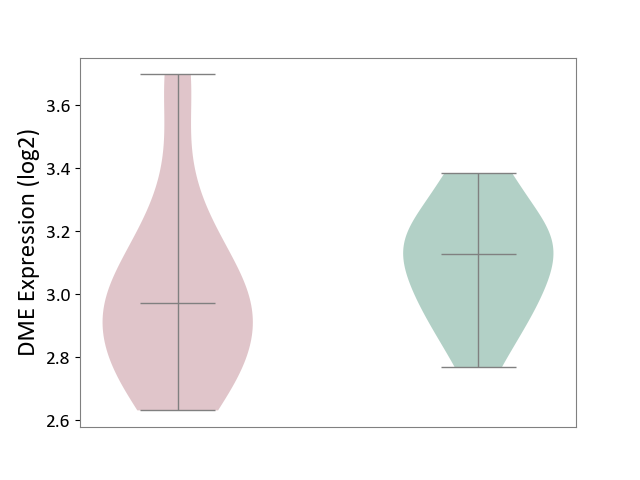
| The Expression Level of Disease Section Compare with the Healthy Individual Tissue | p-value: 2.13E-01; Fold-change: -1.54E-01; Z-score: -8.59E-01 | ||||
|
DME expression in the diseased tissue of patients
DME expression in the normal tissue of healthy individuals
|
|||||
| Violin Diagram of DME Disease-specific Protein Abundances |
|
Click to View the Clearer Original Diagram | |||
| ICD-11: 2C94 | Bladder cancer | Click to Show/Hide | |||
| The Studied Tissue | Bladder tissue | ||||
| The Specified Disease | Bladder cancer [ICD-11:2C94] | ||||
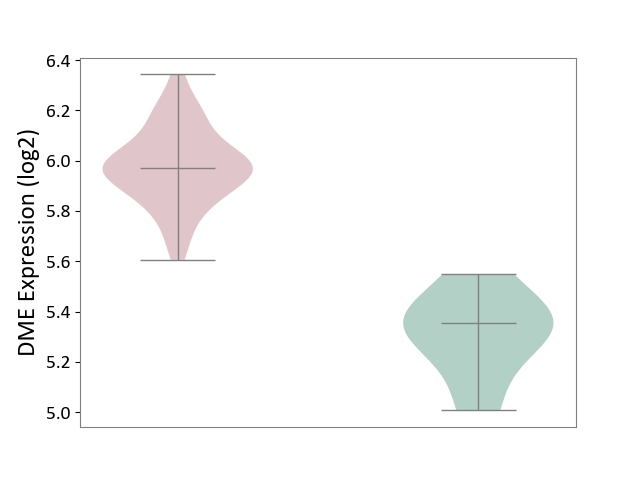
| The Expression Level of Disease Section Compare with the Healthy Individual Tissue | p-value: 2.77E-05; Fold-change: 6.14E-01; Z-score: 3.59E+00 | ||||
|
DME expression in the diseased tissue of patients
DME expression in the normal tissue of healthy individuals
|
|||||
| Violin Diagram of DME Disease-specific Protein Abundances |
|
Click to View the Clearer Original Diagram | |||
| ICD-11: 2D02 | Retinal cancer | Click to Show/Hide | |||
| The Studied Tissue | Uvea | ||||
| The Specified Disease | Retinoblastoma [ICD-11:2D02.2] | ||||
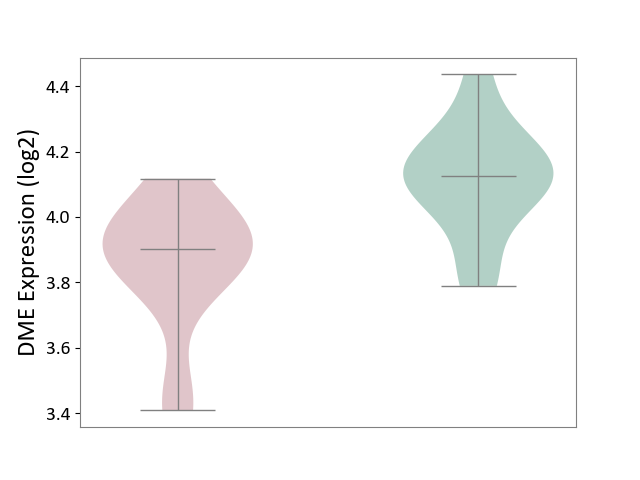
| The Expression Level of Disease Section Compare with the Healthy Individual Tissue | p-value: 1.72E-03; Fold-change: -2.24E-01; Z-score: -1.31E+00 | ||||
|
DME expression in the diseased tissue of patients
DME expression in the normal tissue of healthy individuals
|
|||||
| Violin Diagram of DME Disease-specific Protein Abundances |
|
Click to View the Clearer Original Diagram | |||
| ICD-11: 2D10 | Thyroid cancer | Click to Show/Hide | |||
| The Studied Tissue | Thyroid | ||||
| The Specified Disease | Thyroid cancer [ICD-11:2D10] | ||||
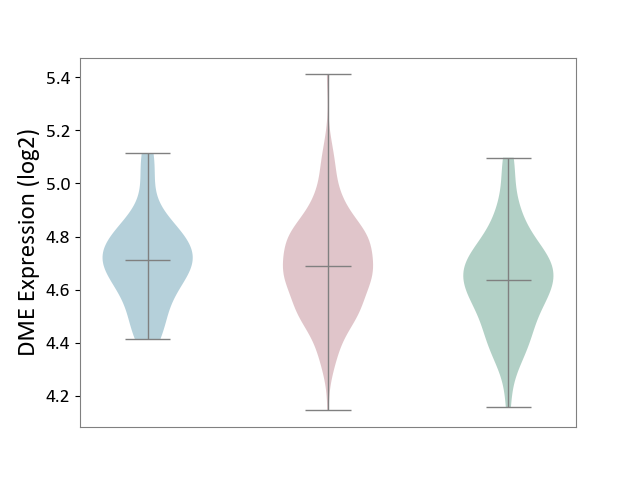
| The Expression Level of Disease Section Compare with the Healthy Individual Tissue | p-value: 9.10E-03; Fold-change: 5.38E-02; Z-score: 2.83E-01 | ||||
| The Expression Level of Disease Section Compare with the Adjacent Tissue | p-value: 6.07E-01; Fold-change: -2.32E-02; Z-score: -1.41E-01 | ||||
|
DME expression in the diseased tissue of patients
DME expression in the normal tissue adjacent to the diseased tissue of patients
DME expression in the normal tissue of healthy individuals
|
|||||
| Violin Diagram of DME Disease-specific Protein Abundances |
|
Click to View the Clearer Original Diagram | |||
| ICD-11: 2D11 | Adrenal cancer | Click to Show/Hide | |||
| The Studied Tissue | Adrenal cortex | ||||
| The Specified Disease | Adrenocortical carcinoma [ICD-11:2D11.Z] | ||||
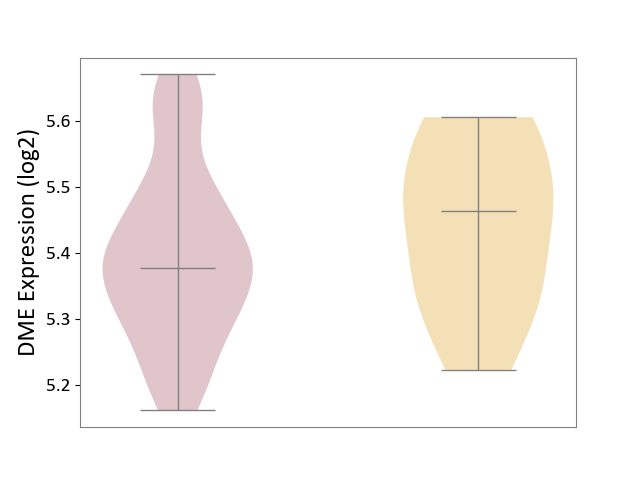
| The Expression Level of Disease Section Compare with the Other Disease Section | p-value: 1.91E-01; Fold-change: -8.69E-02; Z-score: -6.82E-01 | ||||
|
DME expression in the diseased tissue of patients
DME expression in tissue other than the diseased tissue of patients
|
|||||
| Violin Diagram of DME Disease-specific Protein Abundances |
|
Click to View the Clearer Original Diagram | |||
| ICD-11: 2D12 | Endocrine gland neoplasm | Click to Show/Hide | |||
| The Studied Tissue | Pituitary tissue | ||||
| The Specified Disease | Pituitary cancer [ICD-11:2D12] | ||||
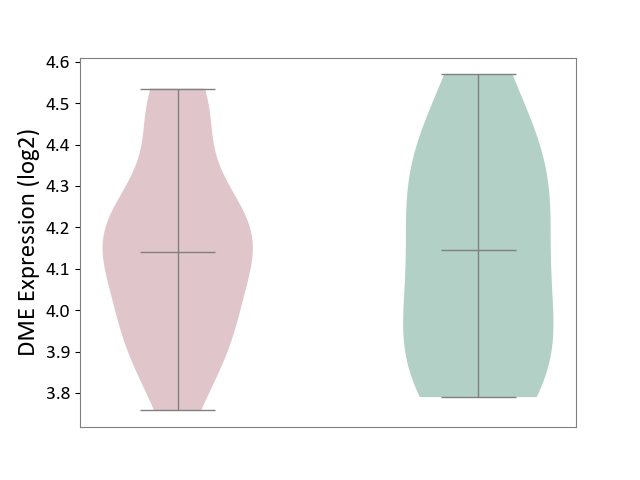
| The Expression Level of Disease Section Compare with the Healthy Individual Tissue | p-value: 8.64E-01; Fold-change: -4.67E-03; Z-score: -1.80E-02 | ||||
|
DME expression in the diseased tissue of patients
DME expression in the normal tissue of healthy individuals
|
|||||
| Violin Diagram of DME Disease-specific Protein Abundances |
|
Click to View the Clearer Original Diagram | |||
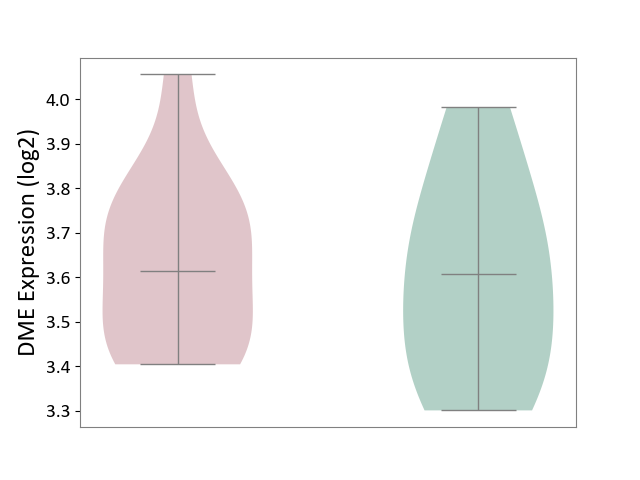
| The Studied Tissue | Pituitary tissue | ||||
| The Specified Disease | Pituitary gonadotrope tumour [ICD-11:2D12] | ||||
| The Expression Level of Disease Section Compare with the Healthy Individual Tissue | p-value: 7.12E-01; Fold-change: 6.83E-03; Z-score: 2.98E-02 | ||||
|
DME expression in the diseased tissue of patients
DME expression in the normal tissue of healthy individuals
|
|||||
| Violin Diagram of DME Disease-specific Protein Abundances |
|
Click to View the Clearer Original Diagram | |||
| ICD-11: 2D42 | Head and neck cancer | Click to Show/Hide | |||
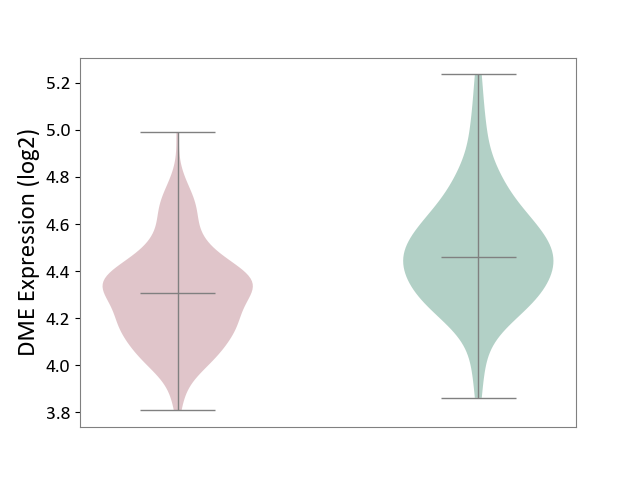
| The Studied Tissue | Head and neck tissue | ||||
| The Specified Disease | Head and neck cancer [ICD-11:2D42] | ||||
| The Expression Level of Disease Section Compare with the Healthy Individual Tissue | p-value: 1.49E-08; Fold-change: -1.53E-01; Z-score: -6.35E-01 | ||||
|
DME expression in the diseased tissue of patients
DME expression in the normal tissue of healthy individuals
|
|||||
| Violin Diagram of DME Disease-specific Protein Abundances |
|
Click to View the Clearer Original Diagram | |||
| ICD Disease Classification 03 | Blood/blood-forming organ disease | Click to Show/Hide | |||
| ICD-11: 3A51 | Sickle cell disorder | Click to Show/Hide | |||
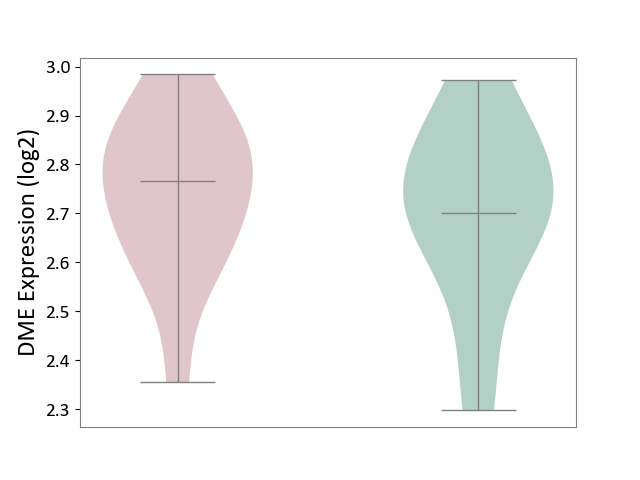
| The Studied Tissue | Peripheral blood | ||||
| The Specified Disease | Sickle cell disease [ICD-11:3A51.0-3A51.3] | ||||
| The Expression Level of Disease Section Compare with the Healthy Individual Tissue | p-value: 5.89E-01; Fold-change: 6.53E-02; Z-score: 3.44E-01 | ||||
|
DME expression in the diseased tissue of patients
DME expression in the normal tissue of healthy individuals
|
|||||
| Violin Diagram of DME Disease-specific Protein Abundances |
|
Click to View the Clearer Original Diagram | |||
| ICD-11: 3A70 | Aplastic anaemia | Click to Show/Hide | |||
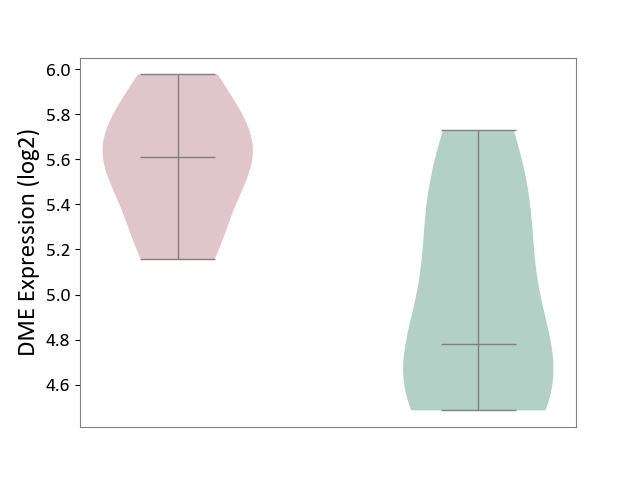
| The Studied Tissue | Bone marrow | ||||
| The Specified Disease | Shwachman-Diamond syndrome [ICD-11:3A70.0] | ||||
| The Expression Level of Disease Section Compare with the Healthy Individual Tissue | p-value: 1.67E-02; Fold-change: 8.33E-01; Z-score: 1.75E+00 | ||||
|
DME expression in the diseased tissue of patients
DME expression in the normal tissue of healthy individuals
|
|||||
| Violin Diagram of DME Disease-specific Protein Abundances |
|
Click to View the Clearer Original Diagram | |||
| ICD-11: 3B63 | Thrombocytosis | Click to Show/Hide | |||
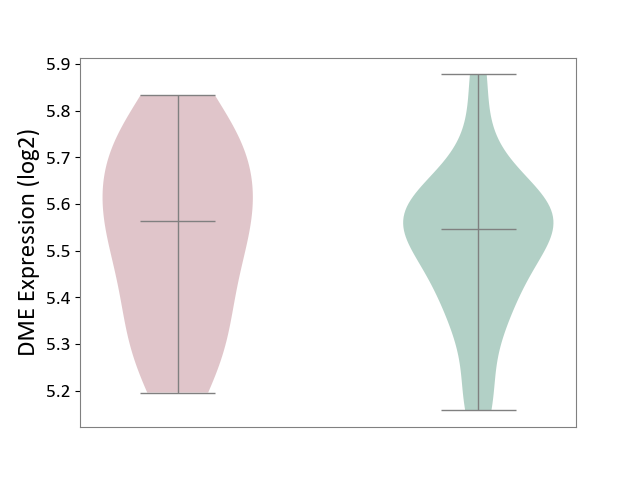
| The Studied Tissue | Whole blood | ||||
| The Specified Disease | Thrombocythemia [ICD-11:3B63] | ||||
| The Expression Level of Disease Section Compare with the Healthy Individual Tissue | p-value: 6.62E-01; Fold-change: 1.75E-02; Z-score: 1.07E-01 | ||||
|
DME expression in the diseased tissue of patients
DME expression in the normal tissue of healthy individuals
|
|||||
| Violin Diagram of DME Disease-specific Protein Abundances |
|
Click to View the Clearer Original Diagram | |||
| ICD-11: 3B64 | Thrombocytopenia | Click to Show/Hide | |||
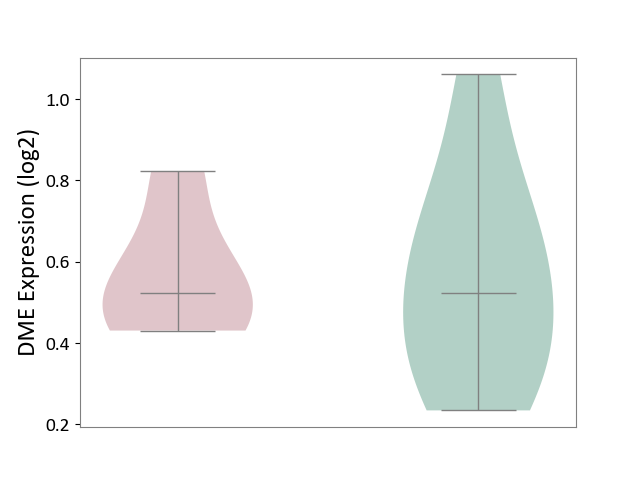
| The Studied Tissue | Whole blood | ||||
| The Specified Disease | Thrombocytopenia [ICD-11:3B64] | ||||
| The Expression Level of Disease Section Compare with the Healthy Individual Tissue | p-value: 9.71E-01; Fold-change: -2.25E-04; Z-score: -8.56E-04 | ||||
|
DME expression in the diseased tissue of patients
DME expression in the normal tissue of healthy individuals
|
|||||
| Violin Diagram of DME Disease-specific Protein Abundances |
|
Click to View the Clearer Original Diagram | |||
| ICD Disease Classification 04 | Immune system disease | Click to Show/Hide | |||
| ICD-11: 4A00 | Immunodeficiency | Click to Show/Hide | |||
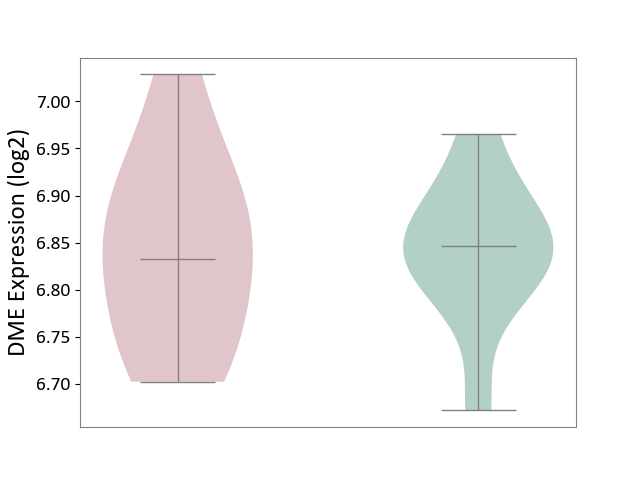
| The Studied Tissue | Peripheral blood | ||||
| The Specified Disease | Immunodeficiency [ICD-11:4A00-4A20] | ||||
| The Expression Level of Disease Section Compare with the Healthy Individual Tissue | p-value: 9.70E-01; Fold-change: -1.38E-02; Z-score: -1.75E-01 | ||||
|
DME expression in the diseased tissue of patients
DME expression in the normal tissue of healthy individuals
|
|||||
| Violin Diagram of DME Disease-specific Protein Abundances |
|
Click to View the Clearer Original Diagram | |||
| ICD-11: 4A40 | Lupus erythematosus | Click to Show/Hide | |||
| The Studied Tissue | Whole blood | ||||
| The Specified Disease | Lupus erythematosus [ICD-11:4A40] | ||||
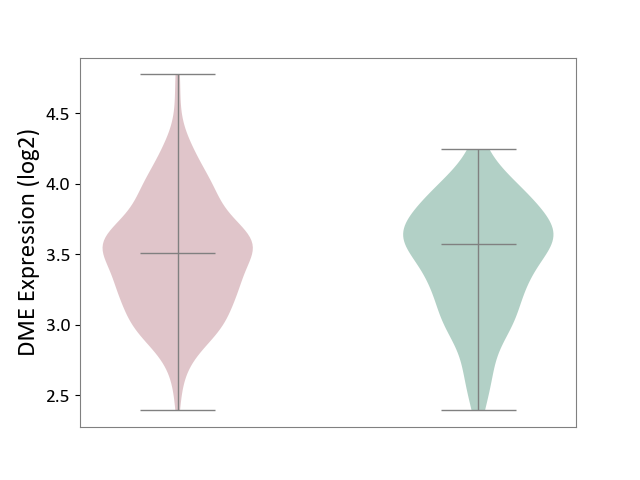
| The Expression Level of Disease Section Compare with the Healthy Individual Tissue | p-value: 6.94E-01; Fold-change: -6.72E-02; Z-score: -1.65E-01 | ||||
|
DME expression in the diseased tissue of patients
DME expression in the normal tissue of healthy individuals
|
|||||
| Violin Diagram of DME Disease-specific Protein Abundances |
|
Click to View the Clearer Original Diagram | |||
| ICD-11: 4A42 | Systemic sclerosis | Click to Show/Hide | |||
| The Studied Tissue | Whole blood | ||||
| The Specified Disease | Scleroderma [ICD-11:4A42.Z] | ||||
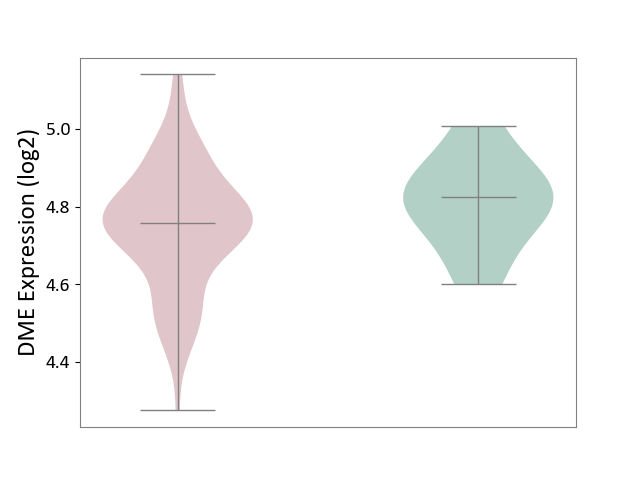
| The Expression Level of Disease Section Compare with the Healthy Individual Tissue | p-value: 1.73E-01; Fold-change: -6.49E-02; Z-score: -5.42E-01 | ||||
|
DME expression in the diseased tissue of patients
DME expression in the normal tissue of healthy individuals
|
|||||
| Violin Diagram of DME Disease-specific Protein Abundances |
|
Click to View the Clearer Original Diagram | |||
| ICD-11: 4A43 | Systemic autoimmune disease | Click to Show/Hide | |||
| The Studied Tissue | Salivary gland tissue | ||||
| The Specified Disease | Sjogren's syndrome [ICD-11:4A43.2] | ||||
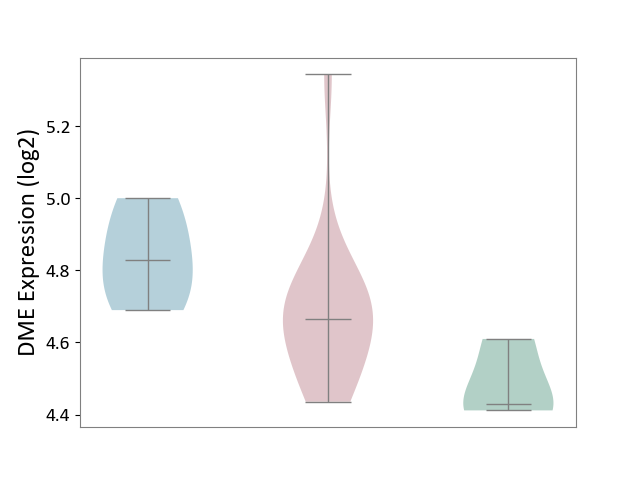
| The Expression Level of Disease Section Compare with the Healthy Individual Tissue | p-value: 6.05E-02; Fold-change: 2.38E-01; Z-score: 2.17E+00 | ||||
| The Expression Level of Disease Section Compare with the Adjacent Tissue | p-value: 9.91E-02; Fold-change: -1.61E-01; Z-score: -1.20E+00 | ||||
|
DME expression in the diseased tissue of patients
DME expression in the normal tissue adjacent to the diseased tissue of patients
DME expression in the normal tissue of healthy individuals
|
|||||
| Violin Diagram of DME Disease-specific Protein Abundances |
|
Click to View the Clearer Original Diagram | |||
| ICD-11: 4A62 | Behcet disease | Click to Show/Hide | |||
| The Studied Tissue | Peripheral blood | ||||
| The Specified Disease | Behcet's disease [ICD-11:4A62] | ||||
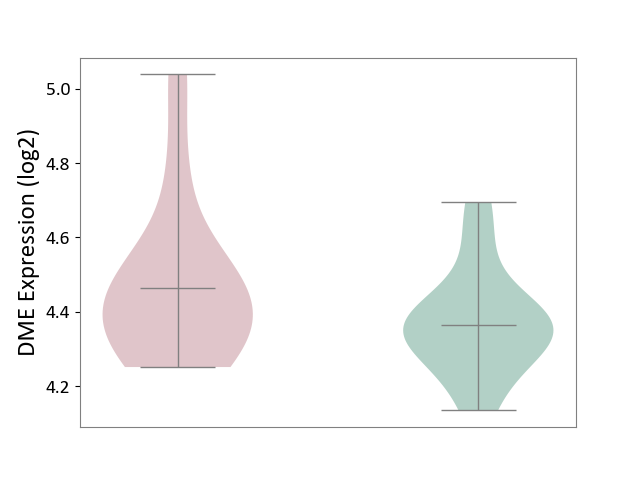
| The Expression Level of Disease Section Compare with the Healthy Individual Tissue | p-value: 2.03E-01; Fold-change: 1.00E-01; Z-score: 6.91E-01 | ||||
|
DME expression in the diseased tissue of patients
DME expression in the normal tissue of healthy individuals
|
|||||
| Violin Diagram of DME Disease-specific Protein Abundances |
|
Click to View the Clearer Original Diagram | |||
| ICD-11: 4B04 | Monocyte count disorder | Click to Show/Hide | |||
| The Studied Tissue | Whole blood | ||||
| The Specified Disease | Autosomal dominant monocytopenia [ICD-11:4B04] | ||||
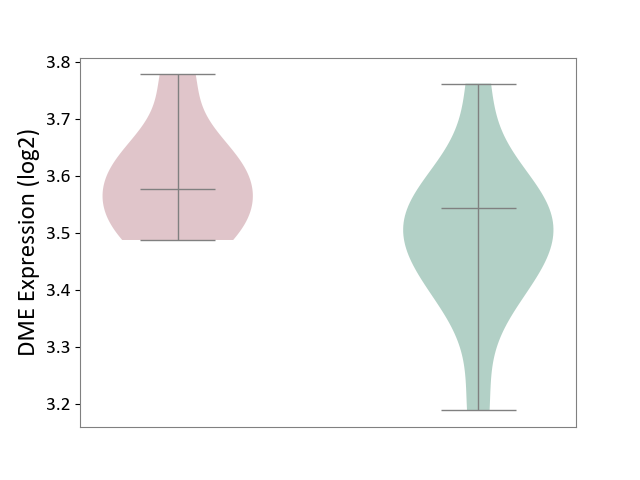
| The Expression Level of Disease Section Compare with the Healthy Individual Tissue | p-value: 8.72E-02; Fold-change: 3.38E-02; Z-score: 2.42E-01 | ||||
|
DME expression in the diseased tissue of patients
DME expression in the normal tissue of healthy individuals
|
|||||
| Violin Diagram of DME Disease-specific Protein Abundances |
|
Click to View the Clearer Original Diagram | |||
| ICD Disease Classification 05 | Endocrine/nutritional/metabolic disease | Click to Show/Hide | |||
| ICD-11: 5A11 | Type 2 diabetes mellitus | Click to Show/Hide | |||
| The Studied Tissue | Omental adipose tissue | ||||
| The Specified Disease | Obesity related type 2 diabetes [ICD-11:5A11] | ||||
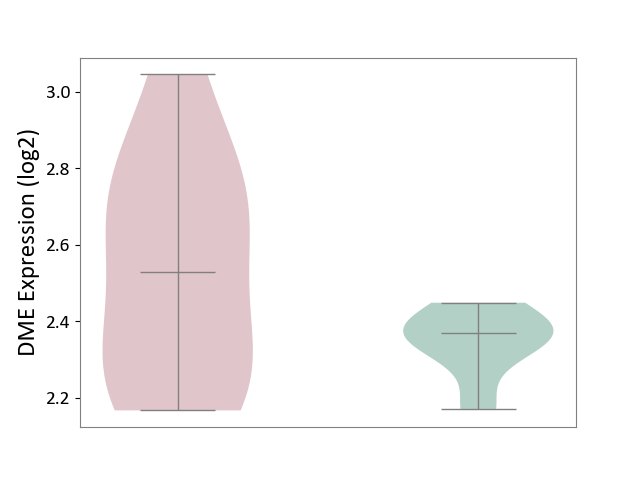
| The Expression Level of Disease Section Compare with the Healthy Individual Tissue | p-value: 9.55E-02; Fold-change: 1.59E-01; Z-score: 1.72E+00 | ||||
|
DME expression in the diseased tissue of patients
DME expression in the normal tissue of healthy individuals
|
|||||
| Violin Diagram of DME Disease-specific Protein Abundances |
|
Click to View the Clearer Original Diagram | |||
| The Studied Tissue | Liver tissue | ||||
| The Specified Disease | Type 2 diabetes [ICD-11:5A11] | ||||
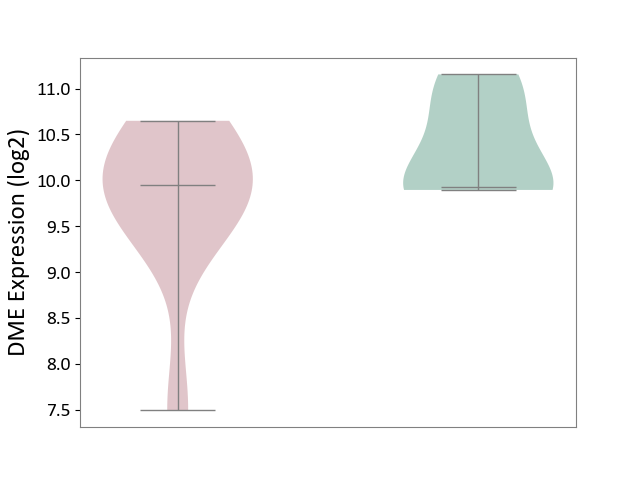
| The Expression Level of Disease Section Compare with the Healthy Individual Tissue | p-value: 1.80E-01; Fold-change: 1.81E-02; Z-score: 3.07E-02 | ||||
|
DME expression in the diseased tissue of patients
DME expression in the normal tissue of healthy individuals
|
|||||
| Violin Diagram of DME Disease-specific Protein Abundances |
|
Click to View the Clearer Original Diagram | |||
| ICD-11: 5A80 | Ovarian dysfunction | Click to Show/Hide | |||
| The Studied Tissue | Vastus lateralis muscle | ||||
| The Specified Disease | Polycystic ovary syndrome [ICD-11:5A80.1] | ||||
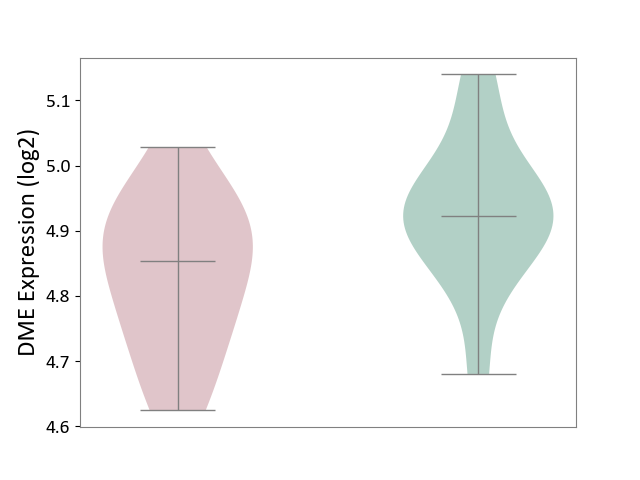
| The Expression Level of Disease Section Compare with the Healthy Individual Tissue | p-value: 3.62E-02; Fold-change: -6.86E-02; Z-score: -6.03E-01 | ||||
|
DME expression in the diseased tissue of patients
DME expression in the normal tissue of healthy individuals
|
|||||
| Violin Diagram of DME Disease-specific Protein Abundances |
|
Click to View the Clearer Original Diagram | |||
| ICD-11: 5C51 | Inborn carbohydrate metabolism disorder | Click to Show/Hide | |||
| The Studied Tissue | Biceps muscle | ||||
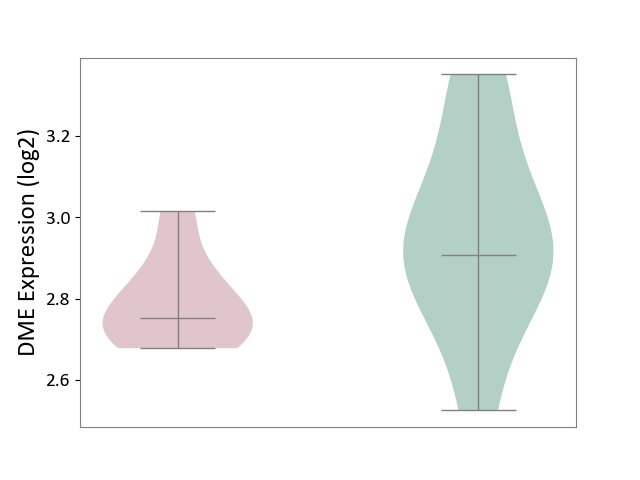
| The Specified Disease | Pompe disease [ICD-11:5C51.3] | ||||
| The Expression Level of Disease Section Compare with the Healthy Individual Tissue | p-value: 7.43E-02; Fold-change: -1.55E-01; Z-score: -6.44E-01 | ||||
|
DME expression in the diseased tissue of patients
DME expression in the normal tissue of healthy individuals
|
|||||
| Violin Diagram of DME Disease-specific Protein Abundances |
|
Click to View the Clearer Original Diagram | |||
| ICD-11: 5C56 | Lysosomal disease | Click to Show/Hide | |||
| The Studied Tissue | Whole blood | ||||
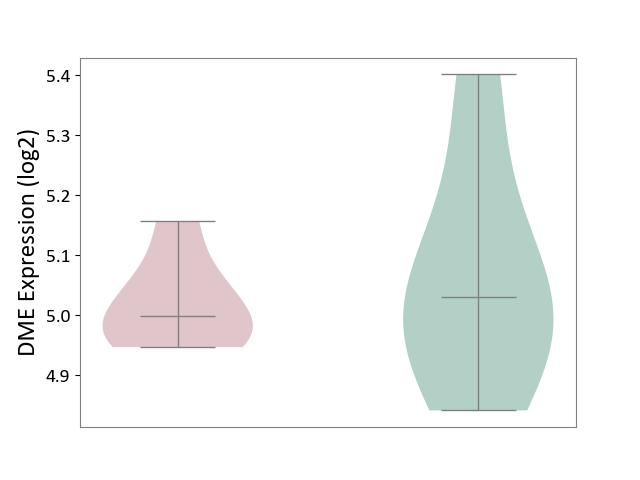
| The Specified Disease | Batten disease [ICD-11:5C56.1] | ||||
| The Expression Level of Disease Section Compare with the Healthy Individual Tissue | p-value: 5.80E-01; Fold-change: -3.14E-02; Z-score: -1.69E-01 | ||||
|
DME expression in the diseased tissue of patients
DME expression in the normal tissue of healthy individuals
|
|||||
| Violin Diagram of DME Disease-specific Protein Abundances |
|
Click to View the Clearer Original Diagram | |||
| ICD-11: 5C80 | Hyperlipoproteinaemia | Click to Show/Hide | |||
| The Studied Tissue | Peripheral blood | ||||
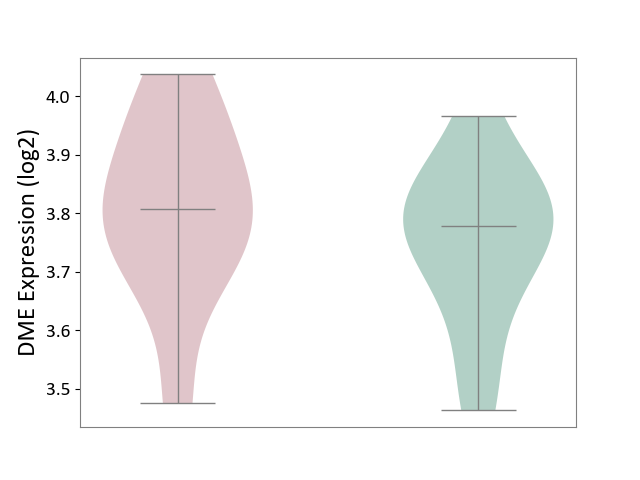
| The Specified Disease | Familial hypercholesterolemia [ICD-11:5C80.00] | ||||
| The Expression Level of Disease Section Compare with the Healthy Individual Tissue | p-value: 3.87E-01; Fold-change: 2.95E-02; Z-score: 2.13E-01 | ||||
|
DME expression in the diseased tissue of patients
DME expression in the normal tissue of healthy individuals
|
|||||
| Violin Diagram of DME Disease-specific Protein Abundances |
|
Click to View the Clearer Original Diagram | |||
| The Studied Tissue | Whole blood | ||||
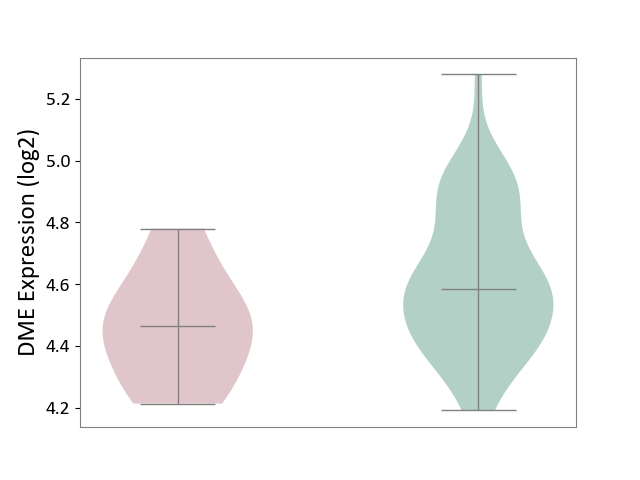
| The Specified Disease | Familial hypercholesterolemia [ICD-11:5C80.00] | ||||
| The Expression Level of Disease Section Compare with the Healthy Individual Tissue | p-value: 4.03E-02; Fold-change: -1.19E-01; Z-score: -5.11E-01 | ||||
|
DME expression in the diseased tissue of patients
DME expression in the normal tissue of healthy individuals
|
|||||
| Violin Diagram of DME Disease-specific Protein Abundances |
|
Click to View the Clearer Original Diagram | |||
| ICD Disease Classification 06 | Mental/behavioural/neurodevelopmental disorder | Click to Show/Hide | |||
| ICD-11: 6A02 | Autism spectrum disorder | Click to Show/Hide | |||
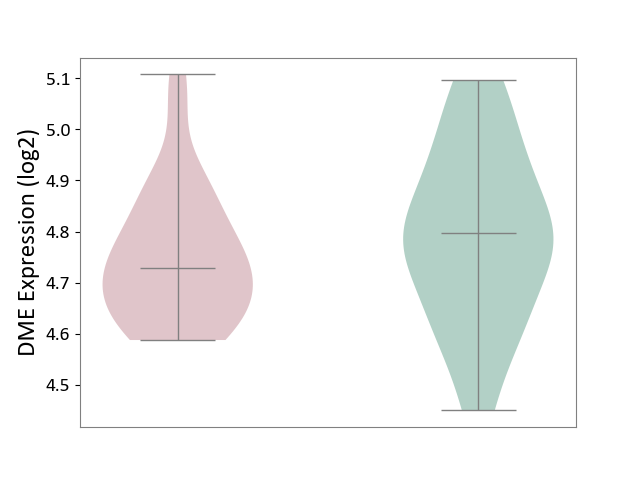
| The Studied Tissue | Whole blood | ||||
| The Specified Disease | Autism [ICD-11:6A02] | ||||
| The Expression Level of Disease Section Compare with the Healthy Individual Tissue | p-value: 2.63E-01; Fold-change: -6.81E-02; Z-score: -4.02E-01 | ||||
|
DME expression in the diseased tissue of patients
DME expression in the normal tissue of healthy individuals
|
|||||
| Violin Diagram of DME Disease-specific Protein Abundances |
|
Click to View the Clearer Original Diagram | |||
| ICD-11: 6A20 | Schizophrenia | Click to Show/Hide | |||
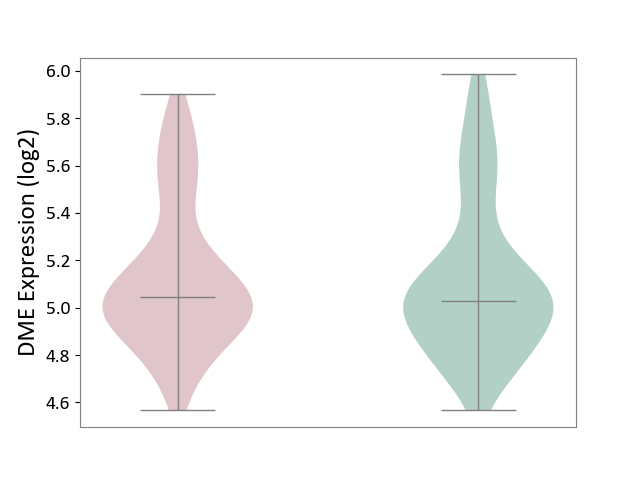
| The Studied Tissue | Prefrontal cortex | ||||
| The Specified Disease | Schizophrenia [ICD-11:6A20] | ||||
| The Expression Level of Disease Section Compare with the Healthy Individual Tissue | p-value: 7.39E-01; Fold-change: 1.54E-02; Z-score: 4.74E-02 | ||||
|
DME expression in the diseased tissue of patients
DME expression in the normal tissue of healthy individuals
|
|||||
| Violin Diagram of DME Disease-specific Protein Abundances |
|
Click to View the Clearer Original Diagram | |||
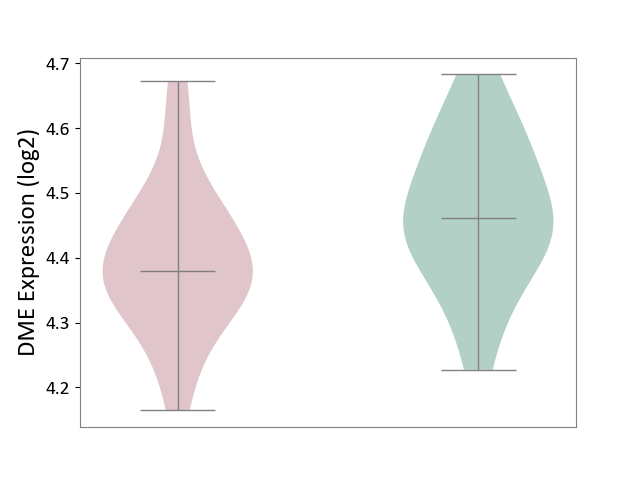
| The Studied Tissue | Superior temporal cortex | ||||
| The Specified Disease | Schizophrenia [ICD-11:6A20] | ||||
| The Expression Level of Disease Section Compare with the Healthy Individual Tissue | p-value: 4.64E-02; Fold-change: -8.21E-02; Z-score: -7.11E-01 | ||||
|
DME expression in the diseased tissue of patients
DME expression in the normal tissue of healthy individuals
|
|||||
| Violin Diagram of DME Disease-specific Protein Abundances |
|
Click to View the Clearer Original Diagram | |||
| ICD-11: 6A60 | Bipolar disorder | Click to Show/Hide | |||
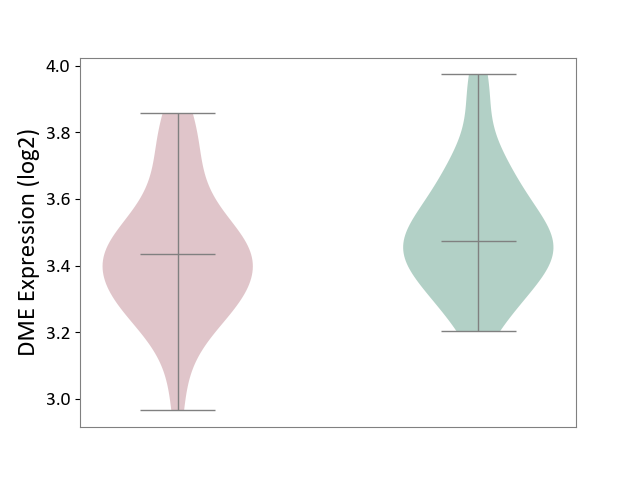
| The Studied Tissue | Prefrontal cortex | ||||
| The Specified Disease | Bipolar disorder [ICD-11:6A60-6A6Z] | ||||
| The Expression Level of Disease Section Compare with the Healthy Individual Tissue | p-value: 1.11E-01; Fold-change: -4.04E-02; Z-score: -2.22E-01 | ||||
|
DME expression in the diseased tissue of patients
DME expression in the normal tissue of healthy individuals
|
|||||
| Violin Diagram of DME Disease-specific Protein Abundances |
|
Click to View the Clearer Original Diagram | |||
| ICD-11: 6A70 | Depressive disorder | Click to Show/Hide | |||
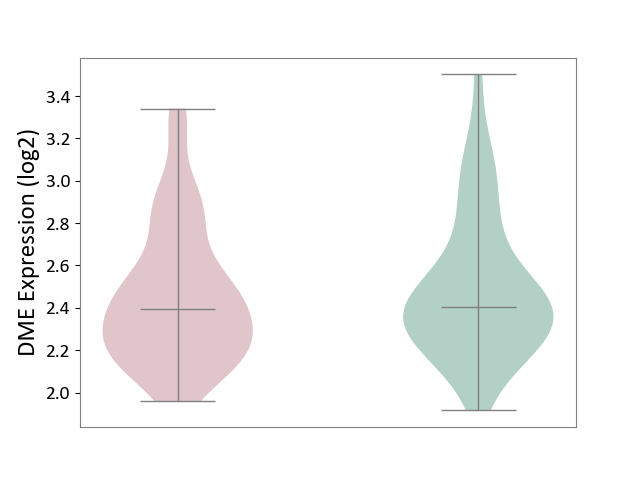
| The Studied Tissue | Whole blood | ||||
| The Specified Disease | Major depressive disorder [ICD-11:6A70-6A7Z] | ||||
| The Expression Level of Disease Section Compare with the Healthy Individual Tissue | p-value: 5.66E-01; Fold-change: -1.33E-02; Z-score: -3.98E-02 | ||||
|
DME expression in the diseased tissue of patients
DME expression in the normal tissue of healthy individuals
|
|||||
| Violin Diagram of DME Disease-specific Protein Abundances |
|
Click to View the Clearer Original Diagram | |||
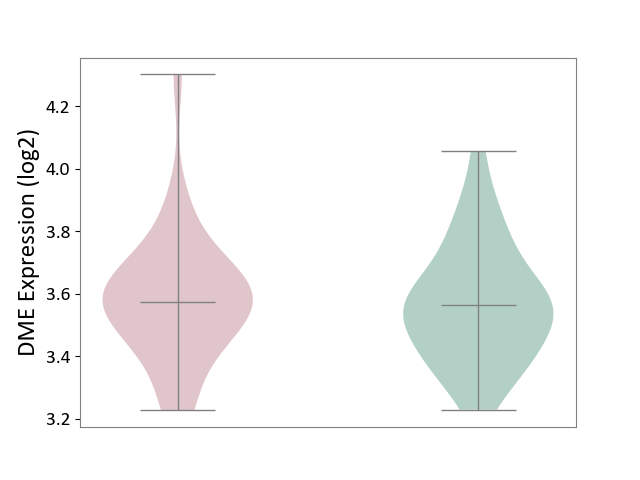
| The Studied Tissue | Hippocampus | ||||
| The Specified Disease | Major depressive disorder [ICD-11:6A70-6A7Z] | ||||
| The Expression Level of Disease Section Compare with the Healthy Individual Tissue | p-value: 7.66E-01; Fold-change: 9.19E-03; Z-score: 4.88E-02 | ||||
|
DME expression in the diseased tissue of patients
DME expression in the normal tissue of healthy individuals
|
|||||
| Violin Diagram of DME Disease-specific Protein Abundances |
|
Click to View the Clearer Original Diagram | |||
| ICD Disease Classification 08 | Nervous system disease | Click to Show/Hide | |||
| ICD-11: 8A00 | Parkinsonism | Click to Show/Hide | |||
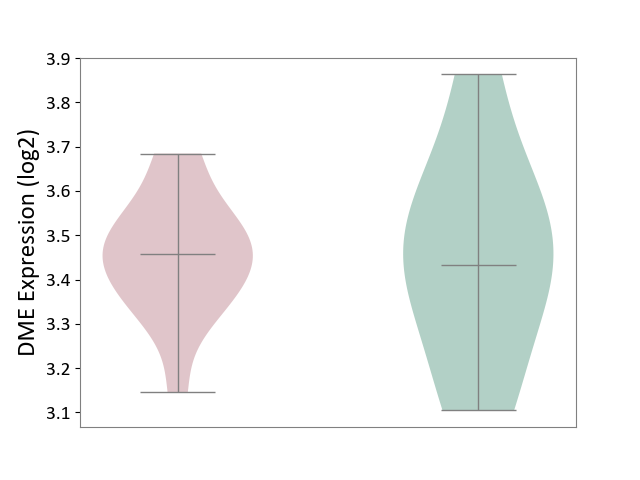
| The Studied Tissue | Substantia nigra tissue | ||||
| The Specified Disease | Parkinson's disease [ICD-11:8A00.0] | ||||
| The Expression Level of Disease Section Compare with the Healthy Individual Tissue | p-value: 9.62E-01; Fold-change: 2.57E-02; Z-score: 1.10E-01 | ||||
|
DME expression in the diseased tissue of patients
DME expression in the normal tissue of healthy individuals
|
|||||
| Violin Diagram of DME Disease-specific Protein Abundances |
|
Click to View the Clearer Original Diagram | |||
| ICD-11: 8A01 | Choreiform disorder | Click to Show/Hide | |||
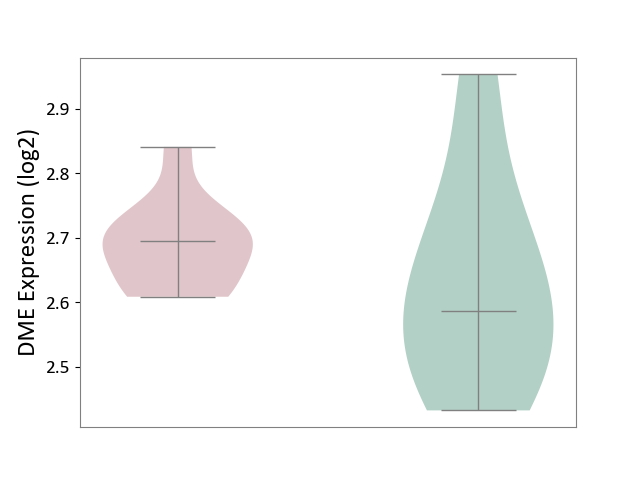
| The Studied Tissue | Whole blood | ||||
| The Specified Disease | Huntington's disease [ICD-11:8A01.10] | ||||
| The Expression Level of Disease Section Compare with the Healthy Individual Tissue | p-value: 3.35E-01; Fold-change: 1.08E-01; Z-score: 6.56E-01 | ||||
|
DME expression in the diseased tissue of patients
DME expression in the normal tissue of healthy individuals
|
|||||
| Violin Diagram of DME Disease-specific Protein Abundances |
|
Click to View the Clearer Original Diagram | |||
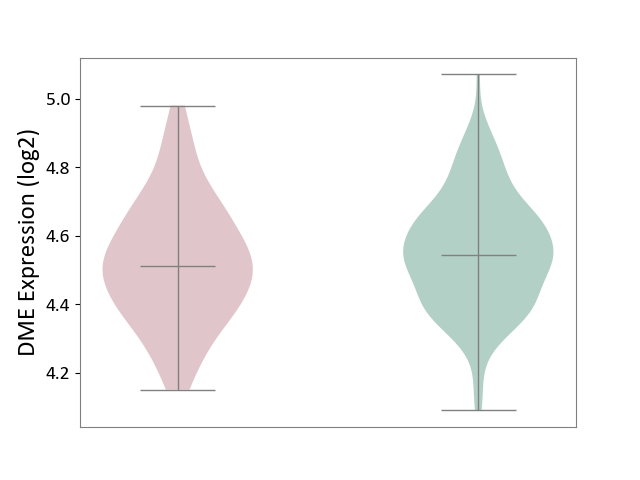
| ICD-11: 8A20 | Alzheimer disease | Click to Show/Hide | |||
| The Studied Tissue | Entorhinal cortex | ||||
| The Specified Disease | Alzheimer's disease [ICD-11:8A20] | ||||
| The Expression Level of Disease Section Compare with the Healthy Individual Tissue | p-value: 2.40E-01; Fold-change: -3.31E-02; Z-score: -1.97E-01 | ||||
|
DME expression in the diseased tissue of patients
DME expression in the normal tissue of healthy individuals
|
|||||
| Violin Diagram of DME Disease-specific Protein Abundances |
|
Click to View the Clearer Original Diagram | |||
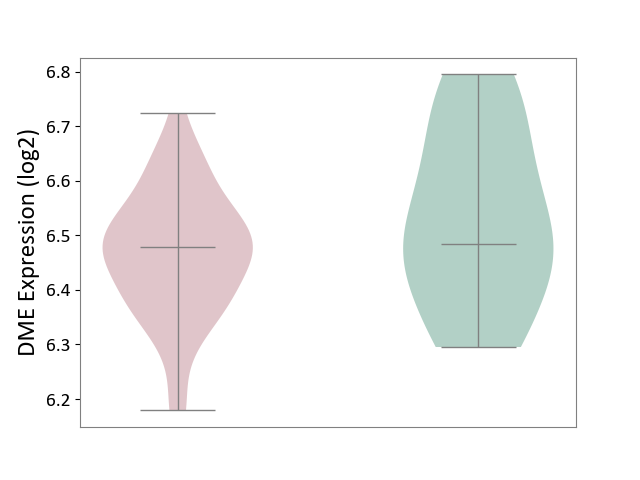
| ICD-11: 8A2Y | Neurocognitive impairment | Click to Show/Hide | |||
| The Studied Tissue | White matter tissue | ||||
| The Specified Disease | HIV-associated neurocognitive impairment [ICD-11:8A2Y-8A2Z] | ||||
| The Expression Level of Disease Section Compare with the Healthy Individual Tissue | p-value: 1.72E-01; Fold-change: -4.99E-03; Z-score: -3.09E-02 | ||||
|
DME expression in the diseased tissue of patients
DME expression in the normal tissue of healthy individuals
|
|||||
| Violin Diagram of DME Disease-specific Protein Abundances |
|
Click to View the Clearer Original Diagram | |||
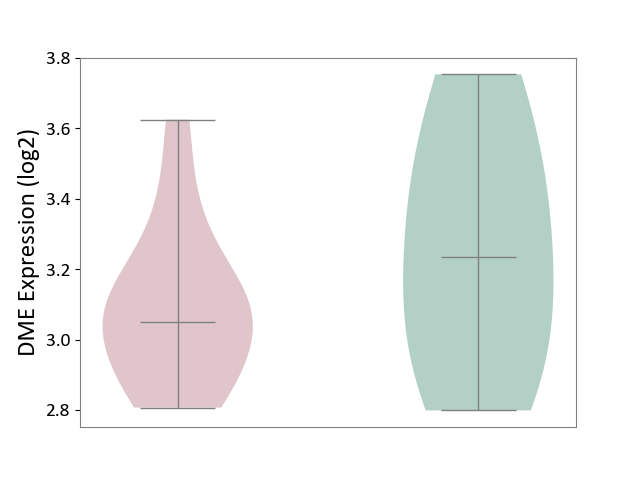
| ICD-11: 8A40 | Multiple sclerosis | Click to Show/Hide | |||
| The Studied Tissue | Plasmacytoid dendritic cells | ||||
| The Specified Disease | Multiple sclerosis [ICD-11:8A40] | ||||
| The Expression Level of Disease Section Compare with the Healthy Individual Tissue | p-value: 3.44E-01; Fold-change: -1.85E-01; Z-score: -5.25E-01 | ||||
|
DME expression in the diseased tissue of patients
DME expression in the normal tissue of healthy individuals
|
|||||
| Violin Diagram of DME Disease-specific Protein Abundances |
|
Click to View the Clearer Original Diagram | |||
| The Studied Tissue | Spinal cord | ||||
| The Specified Disease | Multiple sclerosis [ICD-11:8A40] | ||||
| The Expression Level of Disease Section Compare with the Adjacent Tissue | p-value: 7.48E-01; Fold-change: -6.47E-02; Z-score: -7.38E-01 | ||||
|
DME expression in the diseased tissue of patients
DME expression in the normal tissue adjacent to the diseased tissue of patients
|
|||||
| Violin Diagram of DME Disease-specific Protein Abundances |
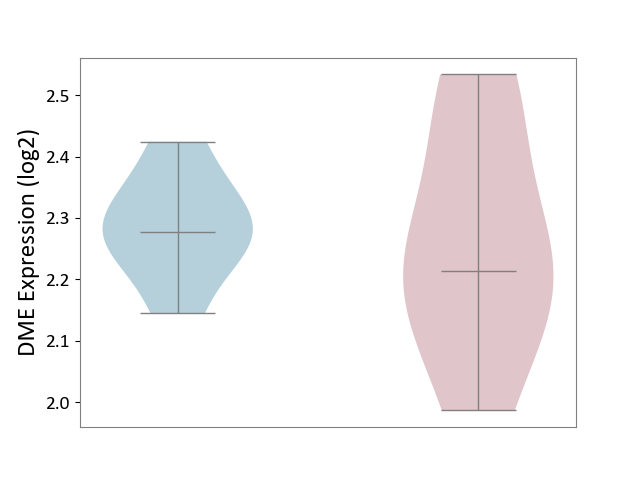
|
Click to View the Clearer Original Diagram | |||
| ICD-11: 8A60 | Epilepsy | Click to Show/Hide | |||
| The Studied Tissue | Peritumoral cortex tissue | ||||
| The Specified Disease | Epilepsy [ICD-11:8A60-8A6Z] | ||||
| The Expression Level of Disease Section Compare with the Other Disease Section | p-value: 7.52E-01; Fold-change: 6.78E-02; Z-score: 2.41E-01 | ||||
|
DME expression in the diseased tissue of patients
DME expression in tissue other than the diseased tissue of patients
|
|||||
| Violin Diagram of DME Disease-specific Protein Abundances |
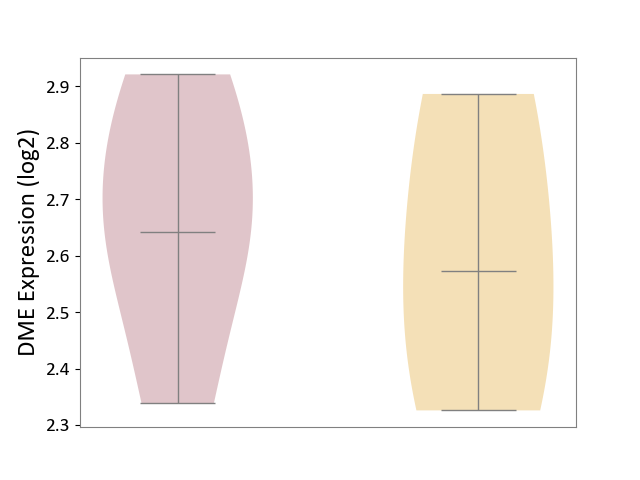
|
Click to View the Clearer Original Diagram | |||
| The Studied Tissue | Whole blood | ||||
| The Specified Disease | Seizure [ICD-11:8A60-8A6Z] | ||||
| The Expression Level of Disease Section Compare with the Healthy Individual Tissue | p-value: 9.70E-01; Fold-change: -2.22E-02; Z-score: -1.17E-01 | ||||
|
DME expression in the diseased tissue of patients
DME expression in the normal tissue of healthy individuals
|
|||||
| Violin Diagram of DME Disease-specific Protein Abundances |
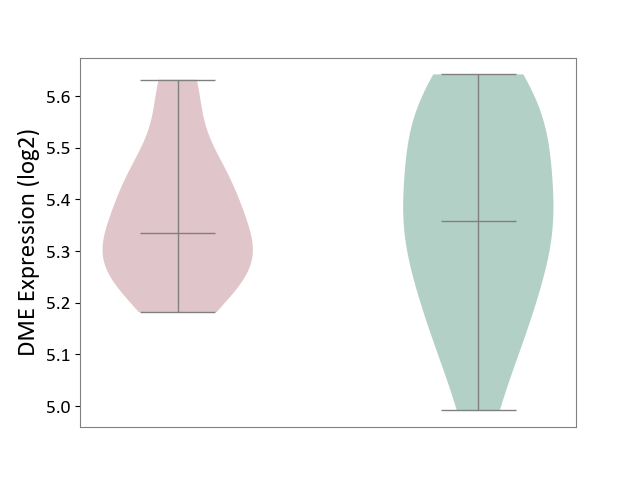
|
Click to View the Clearer Original Diagram | |||
| ICD-11: 8B01 | Subarachnoid haemorrhage | Click to Show/Hide | |||
| The Studied Tissue | Intracranial artery | ||||
| The Specified Disease | Intracranial aneurysm [ICD-11:8B01.0] | ||||
| The Expression Level of Disease Section Compare with the Healthy Individual Tissue | p-value: 7.97E-01; Fold-change: -1.01E-01; Z-score: -4.23E-01 | ||||
|
DME expression in the diseased tissue of patients
DME expression in the normal tissue of healthy individuals
|
|||||
| Violin Diagram of DME Disease-specific Protein Abundances |
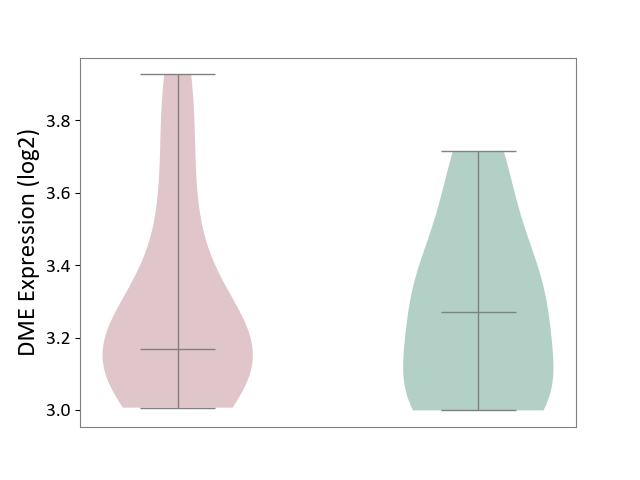
|
Click to View the Clearer Original Diagram | |||
| ICD-11: 8B11 | Cerebral ischaemic stroke | Click to Show/Hide | |||
| The Studied Tissue | Whole blood | ||||
| The Specified Disease | Cardioembolic stroke [ICD-11:8B11.20] | ||||
| The Expression Level of Disease Section Compare with the Healthy Individual Tissue | p-value: 3.79E-01; Fold-change: 6.76E-02; Z-score: 3.66E-01 | ||||
|
DME expression in the diseased tissue of patients
DME expression in the normal tissue of healthy individuals
|
|||||
| Violin Diagram of DME Disease-specific Protein Abundances |
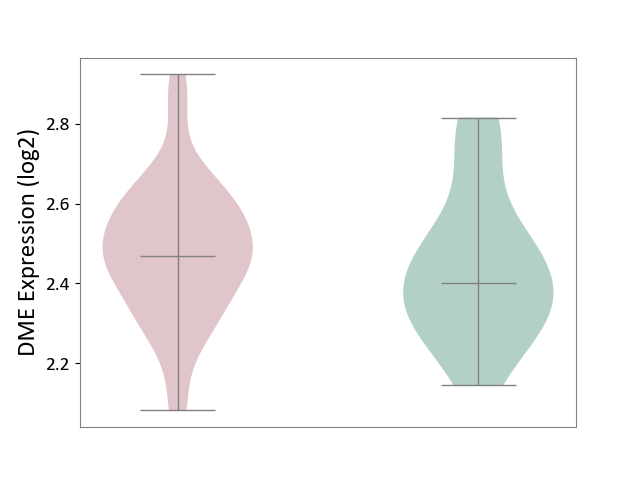
|
Click to View the Clearer Original Diagram | |||
| The Studied Tissue | Peripheral blood | ||||
| The Specified Disease | Ischemic stroke [ICD-11:8B11] | ||||
| The Expression Level of Disease Section Compare with the Healthy Individual Tissue | p-value: 1.72E-01; Fold-change: 2.64E-02; Z-score: 2.26E-01 | ||||
|
DME expression in the diseased tissue of patients
DME expression in the normal tissue of healthy individuals
|
|||||
| Violin Diagram of DME Disease-specific Protein Abundances |
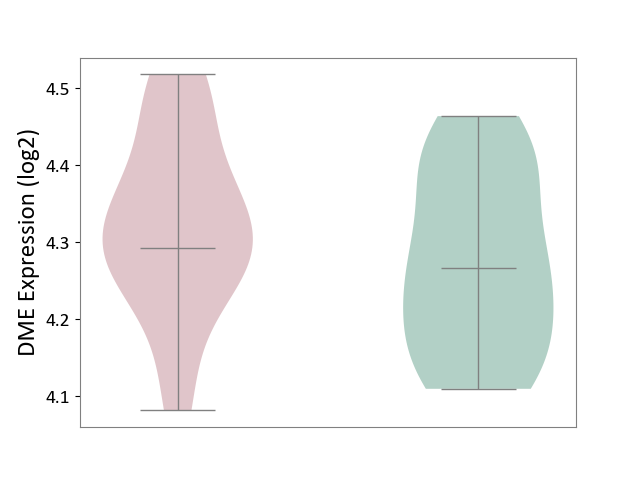
|
Click to View the Clearer Original Diagram | |||
| ICD-11: 8B60 | Motor neuron disease | Click to Show/Hide | |||
| The Studied Tissue | Skin | ||||
| The Specified Disease | Lateral sclerosis [ICD-11:8B60.4] | ||||
| The Expression Level of Disease Section Compare with the Healthy Individual Tissue | p-value: 6.32E-02; Fold-change: 1.30E-01; Z-score: 7.89E-01 | ||||
|
DME expression in the diseased tissue of patients
DME expression in the normal tissue of healthy individuals
|
|||||
| Violin Diagram of DME Disease-specific Protein Abundances |
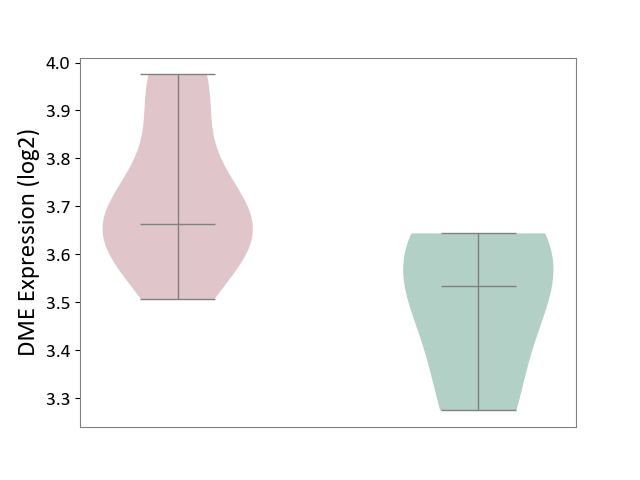
|
Click to View the Clearer Original Diagram | |||
| The Studied Tissue | Cervical spinal cord | ||||
| The Specified Disease | Lateral sclerosis [ICD-11:8B60.4] | ||||
| The Expression Level of Disease Section Compare with the Healthy Individual Tissue | p-value: 5.49E-01; Fold-change: 5.15E-02; Z-score: 1.92E-01 | ||||
|
DME expression in the diseased tissue of patients
DME expression in the normal tissue of healthy individuals
|
|||||
| Violin Diagram of DME Disease-specific Protein Abundances |
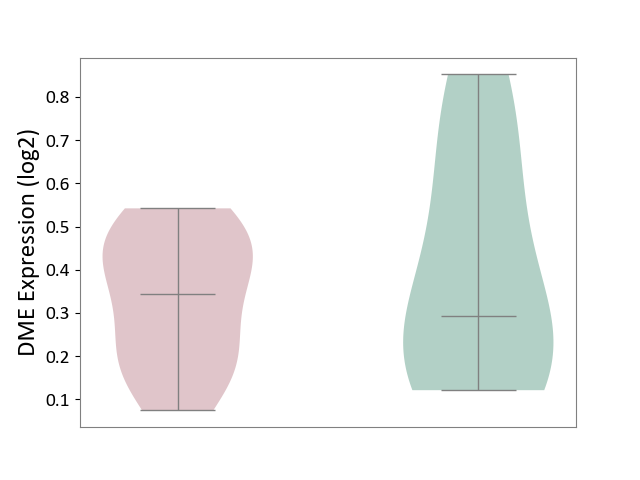
|
Click to View the Clearer Original Diagram | |||
| ICD-11: 8C70 | Muscular dystrophy | Click to Show/Hide | |||
| The Studied Tissue | Muscle tissue | ||||
| The Specified Disease | Myopathy [ICD-11:8C70.6] | ||||
| The Expression Level of Disease Section Compare with the Healthy Individual Tissue | p-value: 9.28E-02; Fold-change: -1.96E-01; Z-score: -1.04E+00 | ||||
|
DME expression in the diseased tissue of patients
DME expression in the normal tissue of healthy individuals
|
|||||
| Violin Diagram of DME Disease-specific Protein Abundances |
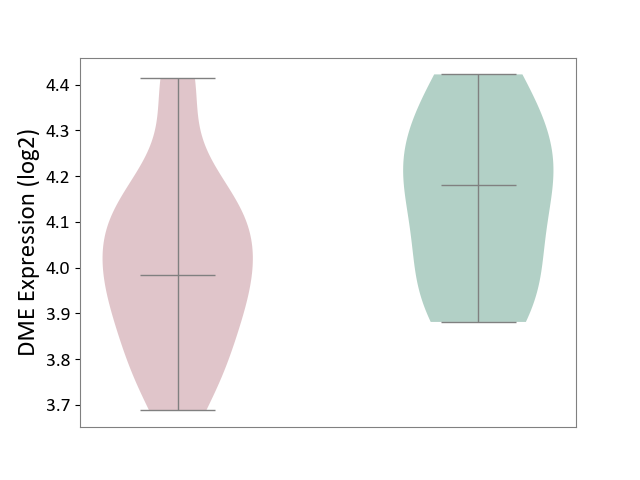
|
Click to View the Clearer Original Diagram | |||
| ICD-11: 8C75 | Distal myopathy | Click to Show/Hide | |||
| The Studied Tissue | Muscle tissue | ||||
| The Specified Disease | Tibial muscular dystrophy [ICD-11:8C75] | ||||
| The Expression Level of Disease Section Compare with the Healthy Individual Tissue | p-value: 1.00E-03; Fold-change: 1.34E-01; Z-score: 1.10E+00 | ||||
|
DME expression in the diseased tissue of patients
DME expression in the normal tissue of healthy individuals
|
|||||
| Violin Diagram of DME Disease-specific Protein Abundances |
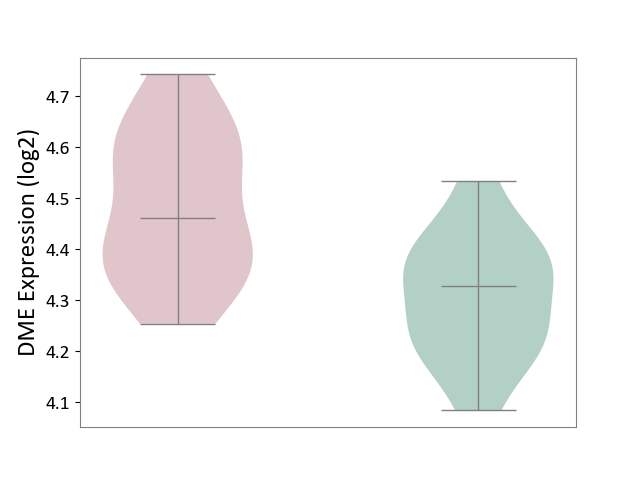
|
Click to View the Clearer Original Diagram | |||
| ICD Disease Classification 09 | Visual system disease | Click to Show/Hide | |||
| ICD-11: 9A96 | Anterior uveitis | Click to Show/Hide | |||
| The Studied Tissue | Peripheral monocyte | ||||
| The Specified Disease | Autoimmune uveitis [ICD-11:9A96] | ||||
| The Expression Level of Disease Section Compare with the Healthy Individual Tissue | p-value: 4.34E-02; Fold-change: -9.83E-02; Z-score: -5.71E-01 | ||||
|
DME expression in the diseased tissue of patients
DME expression in the normal tissue of healthy individuals
|
|||||
| Violin Diagram of DME Disease-specific Protein Abundances |
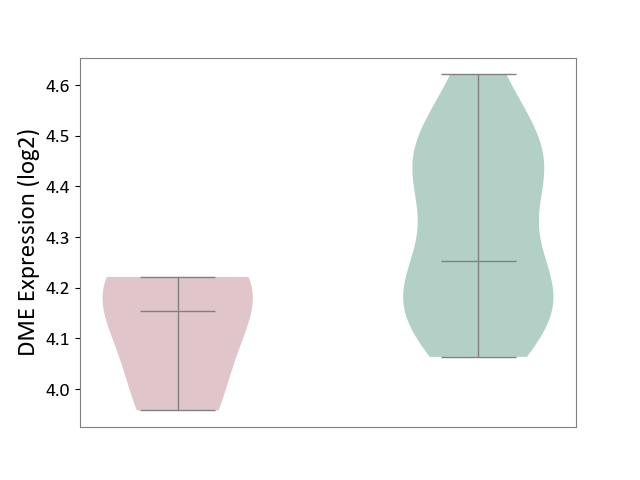
|
Click to View the Clearer Original Diagram | |||
| ICD Disease Classification 11 | Circulatory system disease | Click to Show/Hide | |||
| ICD-11: BA41 | Myocardial infarction | Click to Show/Hide | |||
| The Studied Tissue | Peripheral blood | ||||
| The Specified Disease | Myocardial infarction [ICD-11:BA41-BA50] | ||||
| The Expression Level of Disease Section Compare with the Healthy Individual Tissue | p-value: 2.35E-02; Fold-change: 1.96E-01; Z-score: 4.18E-01 | ||||
|
DME expression in the diseased tissue of patients
DME expression in the normal tissue of healthy individuals
|
|||||
| Violin Diagram of DME Disease-specific Protein Abundances |
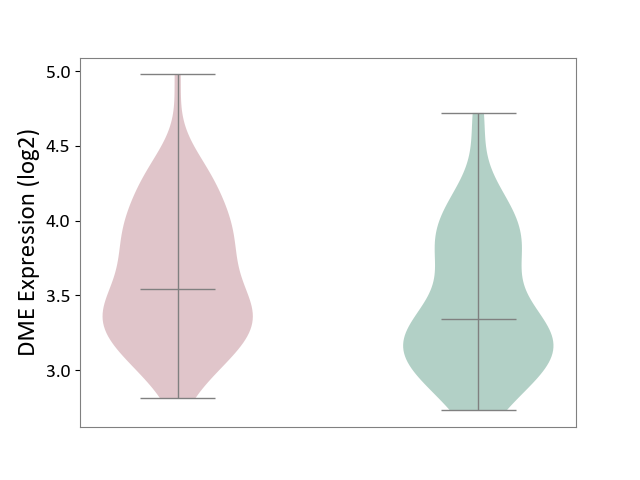
|
Click to View the Clearer Original Diagram | |||
| ICD-11: BA80 | Coronary artery disease | Click to Show/Hide | |||
| The Studied Tissue | Peripheral blood | ||||
| The Specified Disease | Coronary artery disease [ICD-11:BA80-BA8Z] | ||||
| The Expression Level of Disease Section Compare with the Healthy Individual Tissue | p-value: 2.83E-01; Fold-change: -8.91E-02; Z-score: -4.03E-01 | ||||
|
DME expression in the diseased tissue of patients
DME expression in the normal tissue of healthy individuals
|
|||||
| Violin Diagram of DME Disease-specific Protein Abundances |
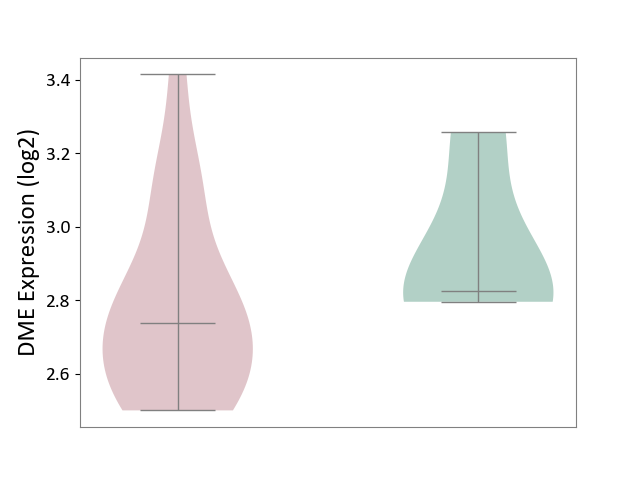
|
Click to View the Clearer Original Diagram | |||
| ICD-11: BB70 | Aortic valve stenosis | Click to Show/Hide | |||
| The Studied Tissue | Calcified aortic valve | ||||
| The Specified Disease | Aortic stenosis [ICD-11:BB70] | ||||
| The Expression Level of Disease Section Compare with the Healthy Individual Tissue | p-value: 9.75E-01; Fold-change: -7.15E-02; Z-score: -1.02E-01 | ||||
|
DME expression in the diseased tissue of patients
DME expression in the normal tissue of healthy individuals
|
|||||
| Violin Diagram of DME Disease-specific Protein Abundances |
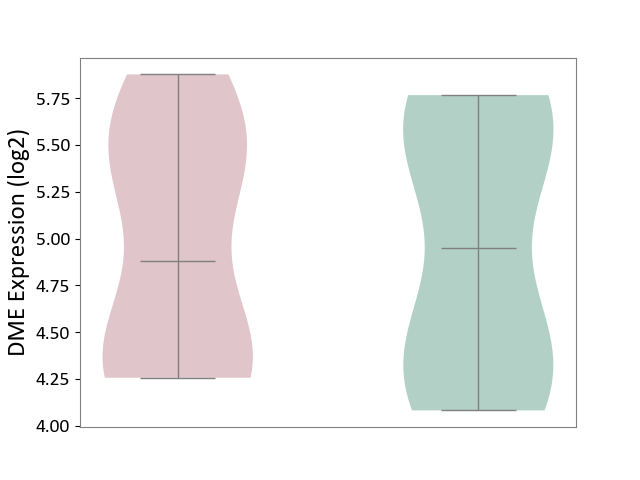
|
Click to View the Clearer Original Diagram | |||
| ICD Disease Classification 12 | Respiratory system disease | Click to Show/Hide | |||
| ICD-11: 7A40 | Central sleep apnoea | Click to Show/Hide | |||
| The Studied Tissue | Hyperplastic tonsil | ||||
| The Specified Disease | Apnea [ICD-11:7A40] | ||||
| The Expression Level of Disease Section Compare with the Healthy Individual Tissue | p-value: 4.67E-01; Fold-change: 7.68E-02; Z-score: 2.20E-01 | ||||
|
DME expression in the diseased tissue of patients
DME expression in the normal tissue of healthy individuals
|
|||||
| Violin Diagram of DME Disease-specific Protein Abundances |
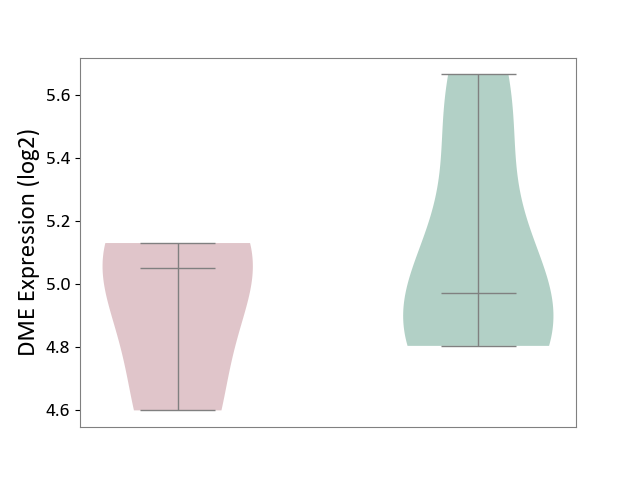
|
Click to View the Clearer Original Diagram | |||
| ICD-11: CA08 | Vasomotor or allergic rhinitis | Click to Show/Hide | |||
| The Studied Tissue | Peripheral blood | ||||
| The Specified Disease | Olive pollen allergy [ICD-11:CA08.00] | ||||
| The Expression Level of Disease Section Compare with the Healthy Individual Tissue | p-value: 8.52E-02; Fold-change: 8.13E-02; Z-score: 6.76E-01 | ||||
|
DME expression in the diseased tissue of patients
DME expression in the normal tissue of healthy individuals
|
|||||
| Violin Diagram of DME Disease-specific Protein Abundances |
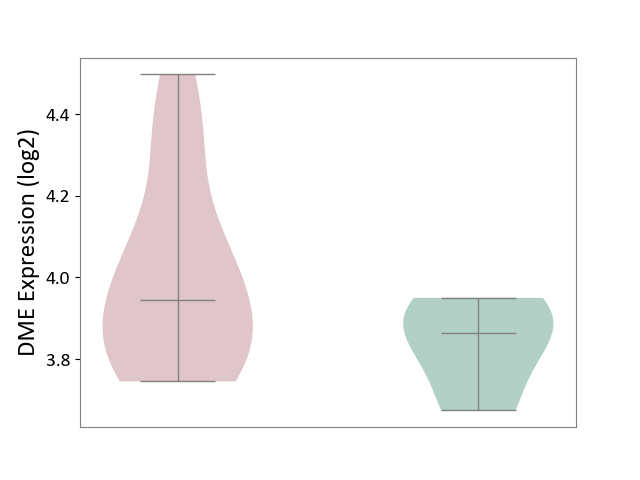
|
Click to View the Clearer Original Diagram | |||
| ICD-11: CA0A | Chronic rhinosinusitis | Click to Show/Hide | |||
| The Studied Tissue | Sinus mucosa tissue | ||||
| The Specified Disease | Chronic rhinosinusitis [ICD-11:CA0A] | ||||
| The Expression Level of Disease Section Compare with the Healthy Individual Tissue | p-value: 1.03E-01; Fold-change: 9.55E-02; Z-score: 9.27E-01 | ||||
|
DME expression in the diseased tissue of patients
DME expression in the normal tissue of healthy individuals
|
|||||
| Violin Diagram of DME Disease-specific Protein Abundances |
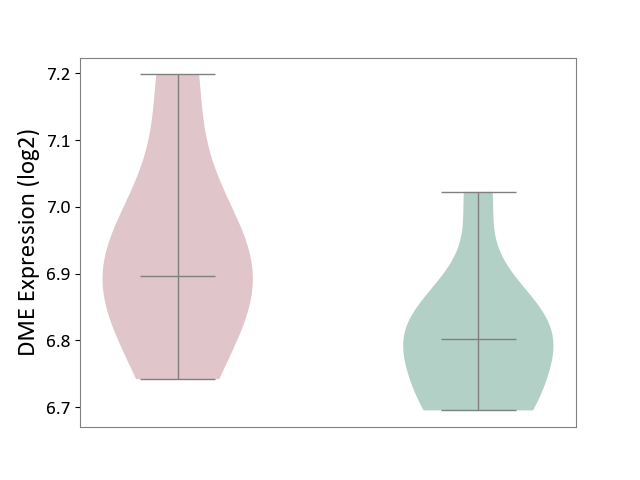
|
Click to View the Clearer Original Diagram | |||
| ICD-11: CA22 | Chronic obstructive pulmonary disease | Click to Show/Hide | |||
| The Studied Tissue | Lung tissue | ||||
| The Specified Disease | Chronic obstructive pulmonary disease [ICD-11:CA22] | ||||
| The Expression Level of Disease Section Compare with the Healthy Individual Tissue | p-value: 4.79E-03; Fold-change: 1.32E-01; Z-score: 7.85E-01 | ||||
|
DME expression in the diseased tissue of patients
DME expression in the normal tissue of healthy individuals
|
|||||
| Violin Diagram of DME Disease-specific Protein Abundances |
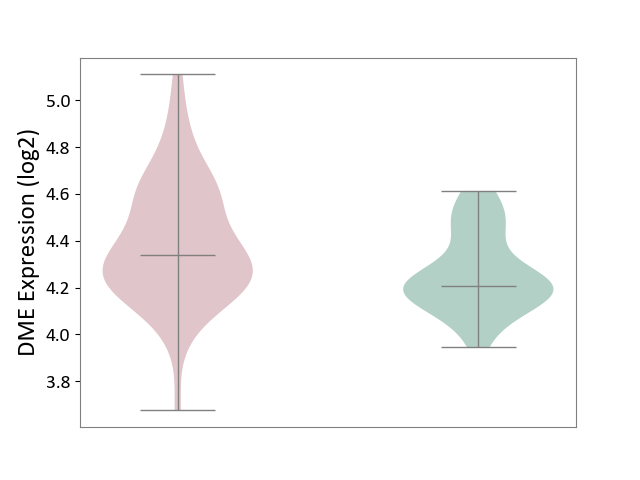
|
Click to View the Clearer Original Diagram | |||
| The Studied Tissue | Small airway epithelium | ||||
| The Specified Disease | Chronic obstructive pulmonary disease [ICD-11:CA22] | ||||
| The Expression Level of Disease Section Compare with the Healthy Individual Tissue | p-value: 1.82E-01; Fold-change: -1.71E-02; Z-score: -9.86E-02 | ||||
|
DME expression in the diseased tissue of patients
DME expression in the normal tissue of healthy individuals
|
|||||
| Violin Diagram of DME Disease-specific Protein Abundances |
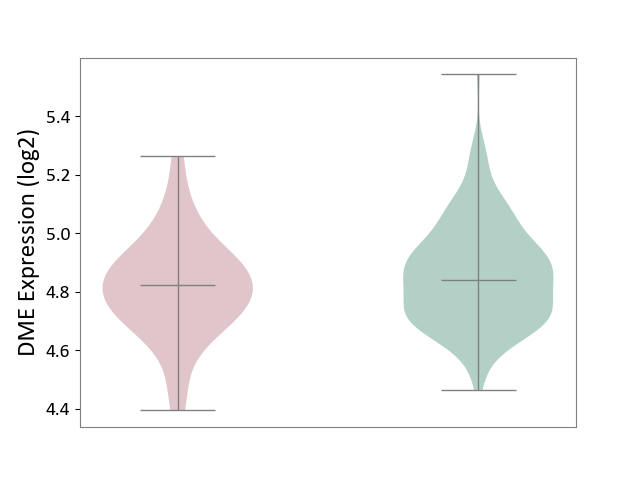
|
Click to View the Clearer Original Diagram | |||
| ICD-11: CA23 | Asthma | Click to Show/Hide | |||
| The Studied Tissue | Nasal and bronchial airway | ||||
| The Specified Disease | Asthma [ICD-11:CA23] | ||||
| The Expression Level of Disease Section Compare with the Healthy Individual Tissue | p-value: 1.65E-02; Fold-change: -4.37E-02; Z-score: -7.84E-02 | ||||
|
DME expression in the diseased tissue of patients
DME expression in the normal tissue of healthy individuals
|
|||||
| Violin Diagram of DME Disease-specific Protein Abundances |
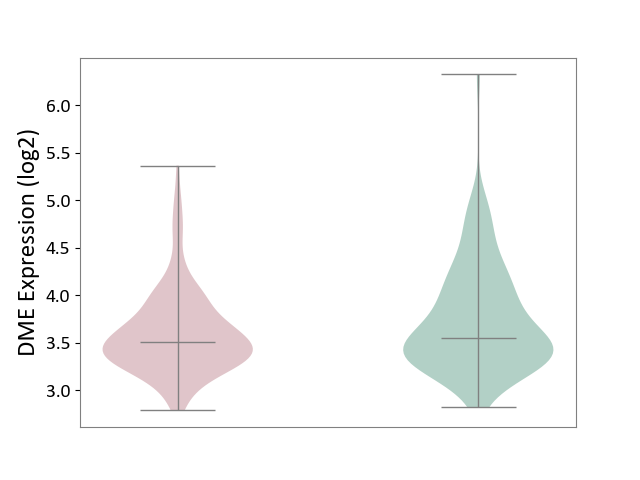
|
Click to View the Clearer Original Diagram | |||
| ICD-11: CB03 | Idiopathic interstitial pneumonitis | Click to Show/Hide | |||
| The Studied Tissue | Lung tissue | ||||
| The Specified Disease | Idiopathic pulmonary fibrosis [ICD-11:CB03.4] | ||||
| The Expression Level of Disease Section Compare with the Healthy Individual Tissue | p-value: 5.67E-01; Fold-change: -4.03E-02; Z-score: -2.13E-01 | ||||
|
DME expression in the diseased tissue of patients
DME expression in the normal tissue of healthy individuals
|
|||||
| Violin Diagram of DME Disease-specific Protein Abundances |
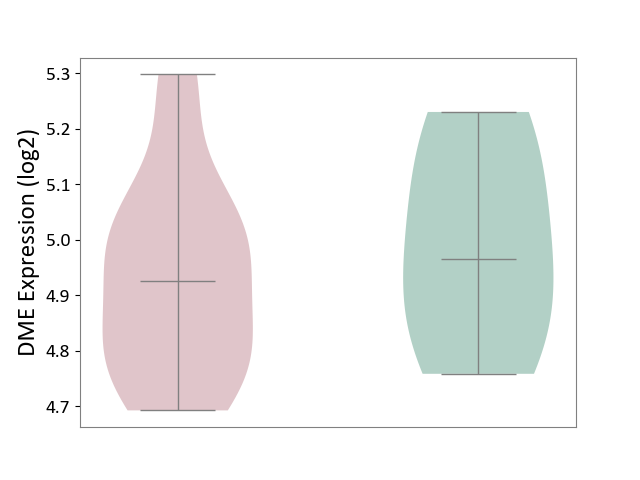
|
Click to View the Clearer Original Diagram | |||
| ICD Disease Classification 13 | Digestive system disease | Click to Show/Hide | |||
| ICD-11: DA0C | Periodontal disease | Click to Show/Hide | |||
| The Studied Tissue | Gingival tissue | ||||
| The Specified Disease | Periodontal disease [ICD-11:DA0C] | ||||
| The Expression Level of Disease Section Compare with the Adjacent Tissue | p-value: 8.60E-05; Fold-change: -2.42E-01; Z-score: -6.58E-01 | ||||
|
DME expression in the diseased tissue of patients
DME expression in the normal tissue adjacent to the diseased tissue of patients
|
|||||
| Violin Diagram of DME Disease-specific Protein Abundances |
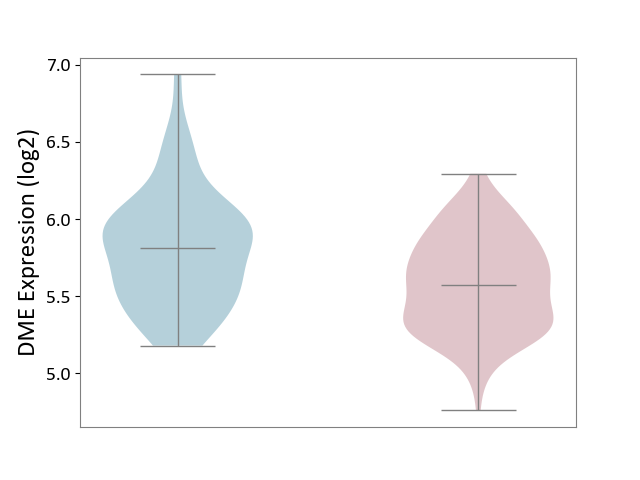
|
Click to View the Clearer Original Diagram | |||
| ICD-11: DA42 | Gastritis | Click to Show/Hide | |||
| The Studied Tissue | Gastric antrum tissue | ||||
| The Specified Disease | Eosinophilic gastritis [ICD-11:DA42.2] | ||||
| The Expression Level of Disease Section Compare with the Adjacent Tissue | p-value: 5.67E-01; Fold-change: -7.14E-03; Z-score: -9.59E-03 | ||||
|
DME expression in the diseased tissue of patients
DME expression in the normal tissue adjacent to the diseased tissue of patients
|
|||||
| Violin Diagram of DME Disease-specific Protein Abundances |
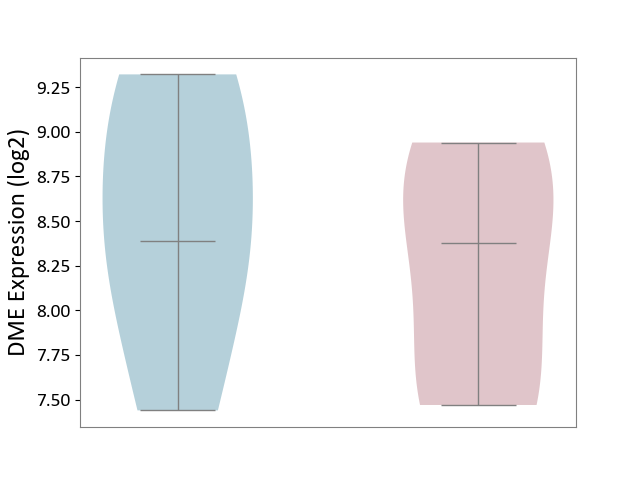
|
Click to View the Clearer Original Diagram | |||
| ICD-11: DB92 | Non-alcoholic fatty liver disease | Click to Show/Hide | |||
| The Studied Tissue | Liver tissue | ||||
| The Specified Disease | Non-alcoholic fatty liver disease [ICD-11:DB92] | ||||
| The Expression Level of Disease Section Compare with the Healthy Individual Tissue | p-value: 2.49E-01; Fold-change: 6.65E-01; Z-score: 5.19E-01 | ||||
|
DME expression in the diseased tissue of patients
DME expression in the normal tissue of healthy individuals
|
|||||
| Violin Diagram of DME Disease-specific Protein Abundances |
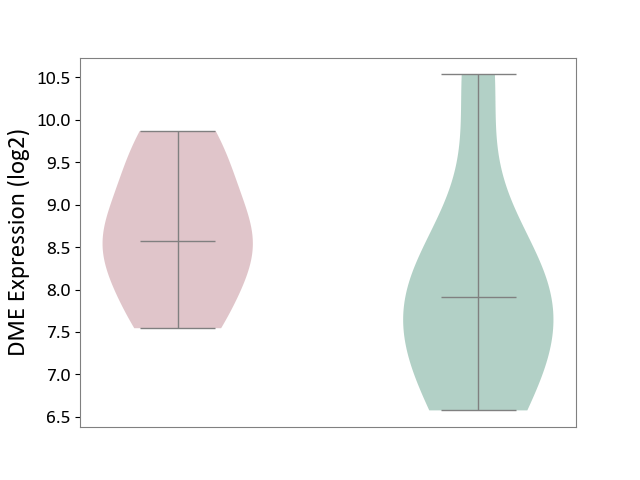
|
Click to View the Clearer Original Diagram | |||
| ICD-11: DB99 | Hepatic failure | Click to Show/Hide | |||
| The Studied Tissue | Liver tissue | ||||
| The Specified Disease | Liver failure [ICD-11:DB99.7-DB99.8] | ||||
| The Expression Level of Disease Section Compare with the Healthy Individual Tissue | p-value: 3.11E-04; Fold-change: -2.33E+00; Z-score: -2.27E+00 | ||||
|
DME expression in the diseased tissue of patients
DME expression in the normal tissue of healthy individuals
|
|||||
| Violin Diagram of DME Disease-specific Protein Abundances |
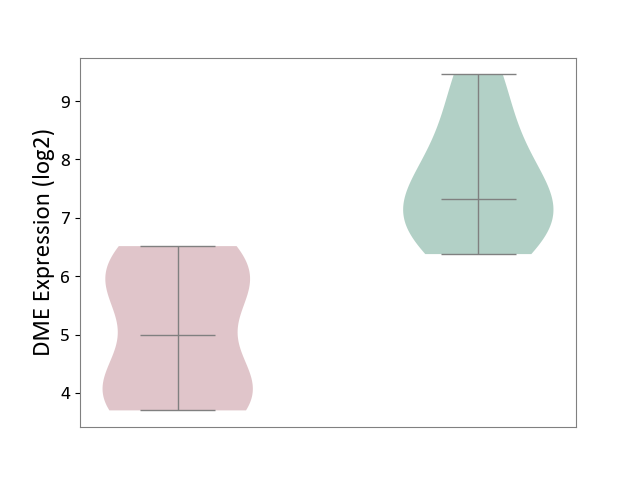
|
Click to View the Clearer Original Diagram | |||
| ICD-11: DD71 | Ulcerative colitis | Click to Show/Hide | |||
| The Studied Tissue | Colon mucosal tissue | ||||
| The Specified Disease | Ulcerative colitis [ICD-11:DD71] | ||||
| The Expression Level of Disease Section Compare with the Adjacent Tissue | p-value: 8.61E-02; Fold-change: 1.23E-01; Z-score: 6.11E-01 | ||||
|
DME expression in the diseased tissue of patients
DME expression in tissue other than the diseased tissue of patients
|
|||||
| Violin Diagram of DME Disease-specific Protein Abundances |
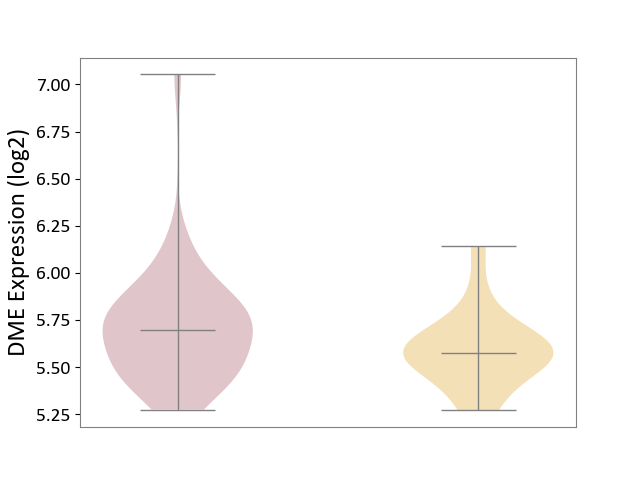
|
Click to View the Clearer Original Diagram | |||
| ICD-11: DD91 | Irritable bowel syndrome | Click to Show/Hide | |||
| The Studied Tissue | Rectal colon tissue | ||||
| The Specified Disease | Irritable bowel syndrome [ICD-11:DD91.0] | ||||
| The Expression Level of Disease Section Compare with the Healthy Individual Tissue | p-value: 2.16E-02; Fold-change: 2.13E-01; Z-score: 4.28E-01 | ||||
|
DME expression in the diseased tissue of patients
DME expression in the normal tissue of healthy individuals
|
|||||
| Violin Diagram of DME Disease-specific Protein Abundances |
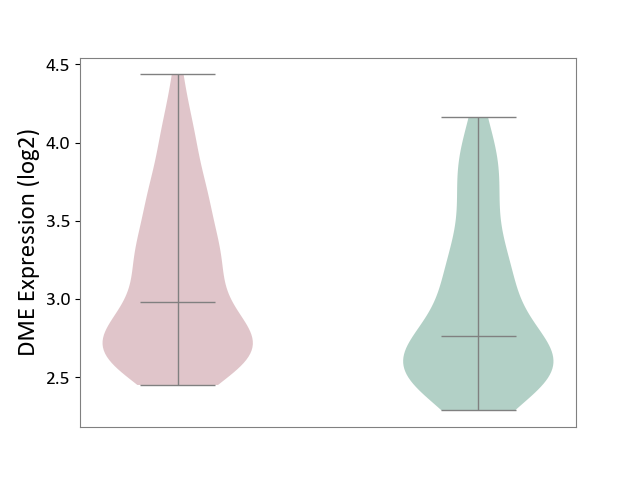
|
Click to View the Clearer Original Diagram | |||
| ICD Disease Classification 14 | Skin disease | Click to Show/Hide | |||
| ICD-11: EA80 | Atopic eczema | Click to Show/Hide | |||
| The Studied Tissue | Skin | ||||
| The Specified Disease | Atopic dermatitis [ICD-11:EA80] | ||||
| The Expression Level of Disease Section Compare with the Healthy Individual Tissue | p-value: 8.18E-02; Fold-change: 5.11E-02; Z-score: 3.21E-01 | ||||
|
DME expression in the diseased tissue of patients
DME expression in the normal tissue of healthy individuals
|
|||||
| Violin Diagram of DME Disease-specific Protein Abundances |
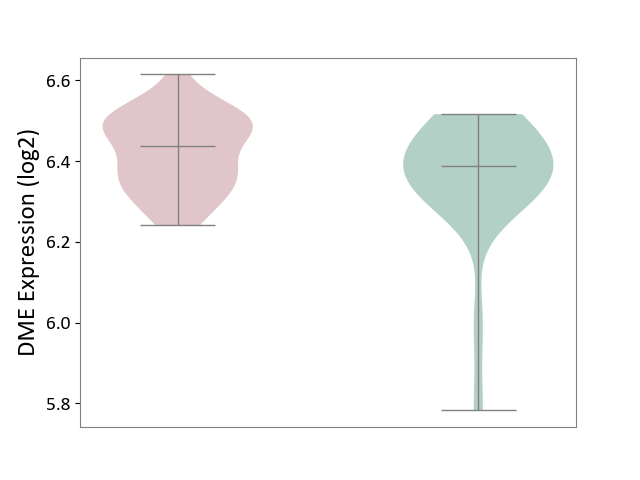
|
Click to View the Clearer Original Diagram | |||
| ICD-11: EA90 | Psoriasis | Click to Show/Hide | |||
| The Studied Tissue | Skin | ||||
| The Specified Disease | Psoriasis [ICD-11:EA90] | ||||
| The Expression Level of Disease Section Compare with the Healthy Individual Tissue | p-value: 1.39E-04; Fold-change: -1.32E-01; Z-score: -4.10E-01 | ||||
| The Expression Level of Disease Section Compare with the Adjacent Tissue | p-value: 2.45E-17; Fold-change: 3.46E-01; Z-score: 1.40E+00 | ||||
|
DME expression in the diseased tissue of patients
DME expression in the normal tissue adjacent to the diseased tissue of patients
DME expression in the normal tissue of healthy individuals
|
|||||
| Violin Diagram of DME Disease-specific Protein Abundances |
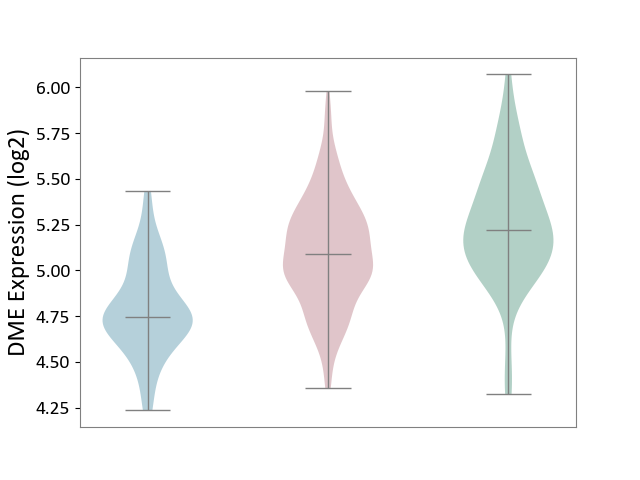
|
Click to View the Clearer Original Diagram | |||
| ICD-11: ED63 | Acquired hypomelanotic disorder | Click to Show/Hide | |||
| The Studied Tissue | Skin | ||||
| The Specified Disease | Vitiligo [ICD-11:ED63.0] | ||||
| The Expression Level of Disease Section Compare with the Healthy Individual Tissue | p-value: 4.37E-01; Fold-change: 0.00E+00; Z-score: 0.00E+00 | ||||
|
DME expression in the diseased tissue of patients
DME expression in the normal tissue of healthy individuals
|
|||||
| Violin Diagram of DME Disease-specific Protein Abundances |
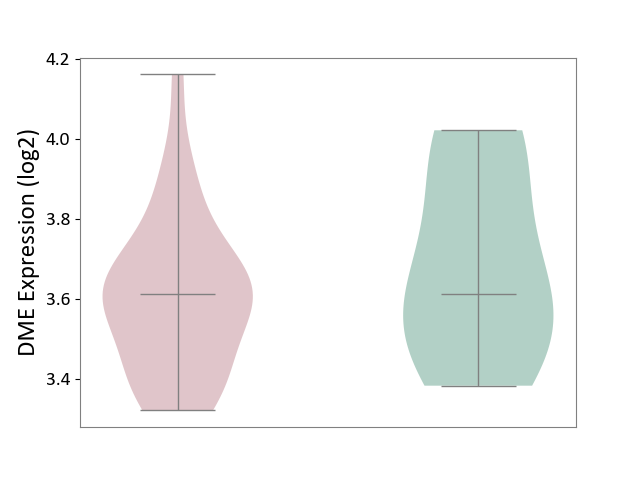
|
Click to View the Clearer Original Diagram | |||
| ICD-11: ED70 | Alopecia or hair loss | Click to Show/Hide | |||
| The Studied Tissue | Skin from scalp | ||||
| The Specified Disease | Alopecia [ICD-11:ED70] | ||||
| The Expression Level of Disease Section Compare with the Healthy Individual Tissue | p-value: 2.43E-01; Fold-change: 5.42E-02; Z-score: 1.47E-01 | ||||
|
DME expression in the diseased tissue of patients
DME expression in the normal tissue of healthy individuals
|
|||||
| Violin Diagram of DME Disease-specific Protein Abundances |
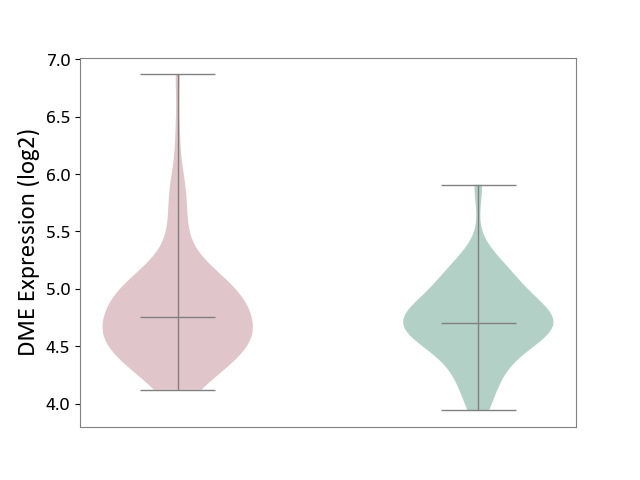
|
Click to View the Clearer Original Diagram | |||
| ICD-11: EK0Z | Contact dermatitis | Click to Show/Hide | |||
| The Studied Tissue | Skin | ||||
| The Specified Disease | Sensitive skin [ICD-11:EK0Z] | ||||
| The Expression Level of Disease Section Compare with the Healthy Individual Tissue | p-value: 8.28E-01; Fold-change: -2.95E-02; Z-score: -1.87E-01 | ||||
|
DME expression in the diseased tissue of patients
DME expression in the normal tissue of healthy individuals
|
|||||
| Violin Diagram of DME Disease-specific Protein Abundances |
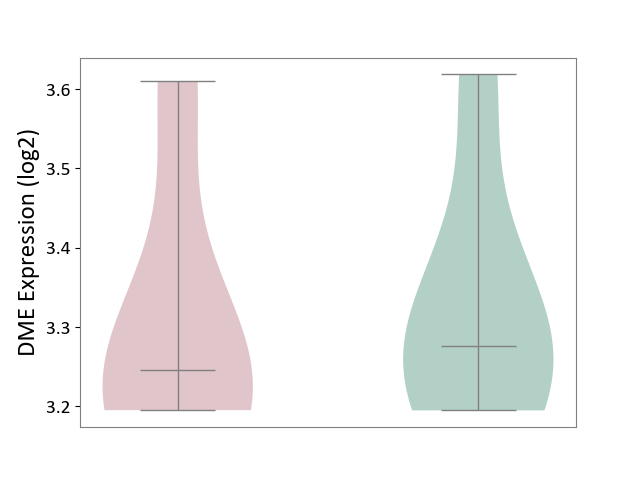
|
Click to View the Clearer Original Diagram | |||
| ICD Disease Classification 15 | Musculoskeletal system/connective tissue disease | Click to Show/Hide | |||
| ICD-11: FA00 | Osteoarthritis | Click to Show/Hide | |||
| The Studied Tissue | Peripheral blood | ||||
| The Specified Disease | Arthropathy [ICD-11:FA00-FA5Z] | ||||
| The Expression Level of Disease Section Compare with the Healthy Individual Tissue | p-value: 1.76E-01; Fold-change: -7.97E-02; Z-score: -6.68E-01 | ||||
|
DME expression in the diseased tissue of patients
DME expression in the normal tissue of healthy individuals
|
|||||
| Violin Diagram of DME Disease-specific Protein Abundances |
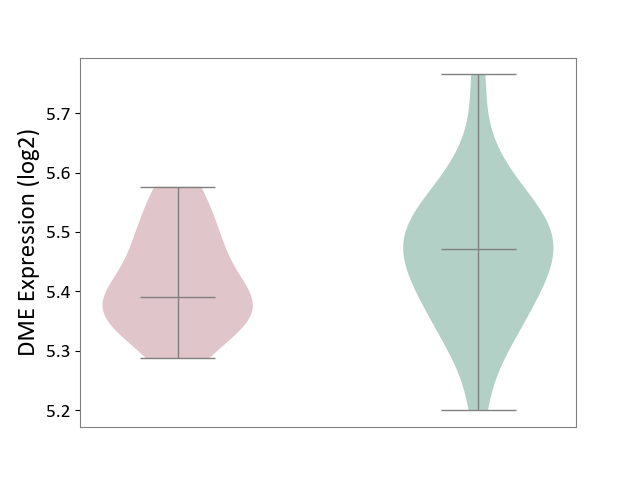
|
Click to View the Clearer Original Diagram | |||
| The Studied Tissue | Synovial tissue | ||||
| The Specified Disease | Osteoarthritis [ICD-11:FA00-FA0Z] | ||||
| The Expression Level of Disease Section Compare with the Healthy Individual Tissue | p-value: 5.17E-01; Fold-change: -3.87E-02; Z-score: -3.88E-01 | ||||
|
DME expression in the diseased tissue of patients
DME expression in the normal tissue of healthy individuals
|
|||||
| Violin Diagram of DME Disease-specific Protein Abundances |
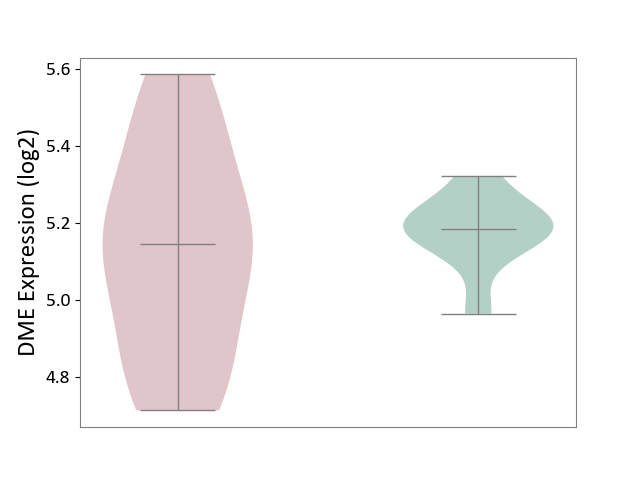
|
Click to View the Clearer Original Diagram | |||
| ICD-11: FA20 | Rheumatoid arthritis | Click to Show/Hide | |||
| The Studied Tissue | Peripheral blood | ||||
| The Specified Disease | Childhood onset rheumatic disease [ICD-11:FA20.Z] | ||||
| The Expression Level of Disease Section Compare with the Healthy Individual Tissue | p-value: 7.63E-01; Fold-change: -1.26E-02; Z-score: -9.04E-02 | ||||
|
DME expression in the diseased tissue of patients
DME expression in the normal tissue of healthy individuals
|
|||||
| Violin Diagram of DME Disease-specific Protein Abundances |
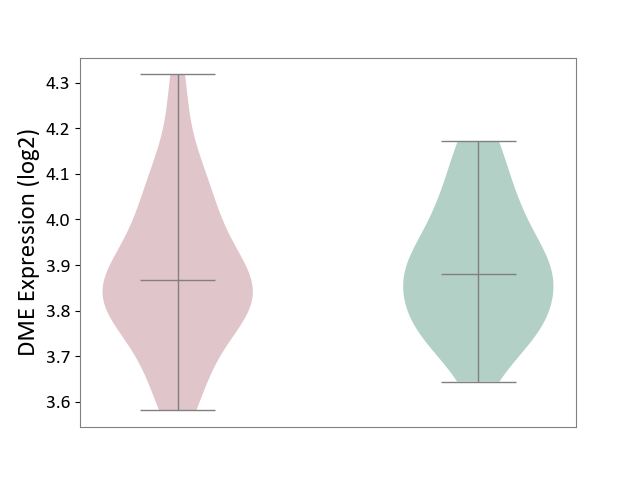
|
Click to View the Clearer Original Diagram | |||
| The Studied Tissue | Synovial tissue | ||||
| The Specified Disease | Rheumatoid arthritis [ICD-11:FA20] | ||||
| The Expression Level of Disease Section Compare with the Healthy Individual Tissue | p-value: 5.48E-01; Fold-change: 1.12E-01; Z-score: 7.24E-01 | ||||
|
DME expression in the diseased tissue of patients
DME expression in the normal tissue of healthy individuals
|
|||||
| Violin Diagram of DME Disease-specific Protein Abundances |
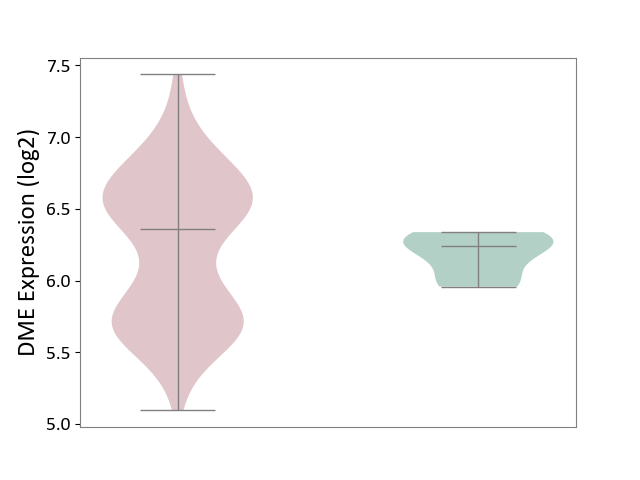
|
Click to View the Clearer Original Diagram | |||
| ICD-11: FA24 | Juvenile idiopathic arthritis | Click to Show/Hide | |||
| The Studied Tissue | Peripheral blood | ||||
| The Specified Disease | Juvenile idiopathic arthritis [ICD-11:FA24] | ||||
| The Expression Level of Disease Section Compare with the Healthy Individual Tissue | p-value: 3.42E-01; Fold-change: 3.89E-02; Z-score: 1.18E-01 | ||||
|
DME expression in the diseased tissue of patients
DME expression in the normal tissue of healthy individuals
|
|||||
| Violin Diagram of DME Disease-specific Protein Abundances |
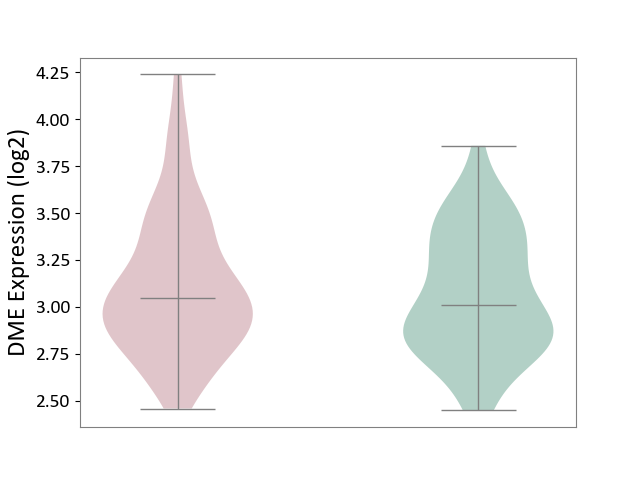
|
Click to View the Clearer Original Diagram | |||
| ICD-11: FA92 | Inflammatory spondyloarthritis | Click to Show/Hide | |||
| The Studied Tissue | Pheripheral blood | ||||
| The Specified Disease | Ankylosing spondylitis [ICD-11:FA92.0Z] | ||||
| The Expression Level of Disease Section Compare with the Healthy Individual Tissue | p-value: 6.27E-01; Fold-change: -2.63E-02; Z-score: -1.68E-01 | ||||
|
DME expression in the diseased tissue of patients
DME expression in the normal tissue of healthy individuals
|
|||||
| Violin Diagram of DME Disease-specific Protein Abundances |
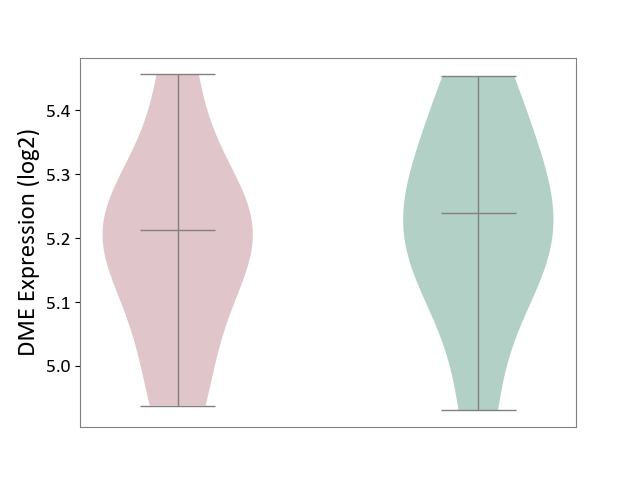
|
Click to View the Clearer Original Diagram | |||
| ICD-11: FB83 | Low bone mass disorder | Click to Show/Hide | |||
| The Studied Tissue | Bone marrow | ||||
| The Specified Disease | Osteoporosis [ICD-11:FB83.1] | ||||
| The Expression Level of Disease Section Compare with the Healthy Individual Tissue | p-value: 5.44E-01; Fold-change: 1.29E-03; Z-score: 1.52E-02 | ||||
|
DME expression in the diseased tissue of patients
DME expression in the normal tissue of healthy individuals
|
|||||
| Violin Diagram of DME Disease-specific Protein Abundances |
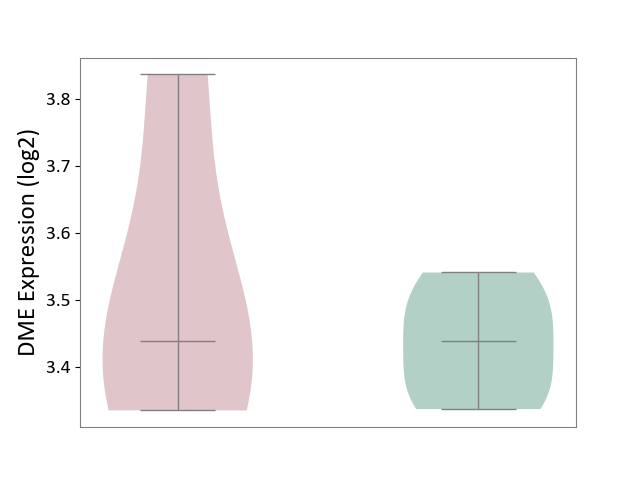
|
Click to View the Clearer Original Diagram | |||
| ICD Disease Classification 16 | Genitourinary system disease | Click to Show/Hide | |||
| ICD-11: GA10 | Endometriosis | Click to Show/Hide | |||
| The Studied Tissue | Endometrium tissue | ||||
| The Specified Disease | Endometriosis [ICD-11:GA10] | ||||
| The Expression Level of Disease Section Compare with the Healthy Individual Tissue | p-value: 1.02E-01; Fold-change: 2.47E-01; Z-score: 6.15E-01 | ||||
|
DME expression in the diseased tissue of patients
DME expression in the normal tissue of healthy individuals
|
|||||
| Violin Diagram of DME Disease-specific Protein Abundances |
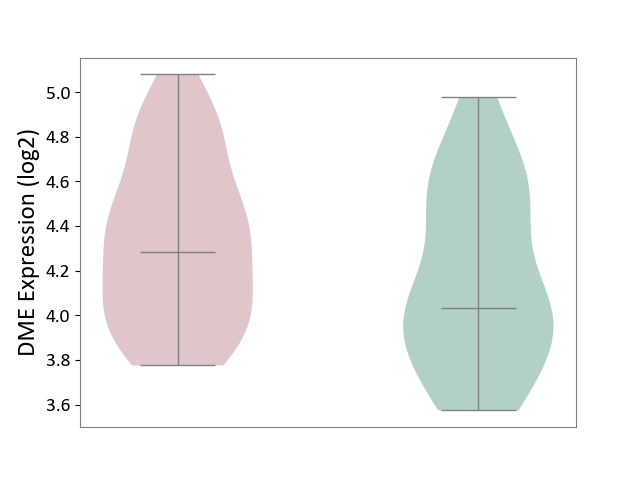
|
Click to View the Clearer Original Diagram | |||
| ICD-11: GC00 | Cystitis | Click to Show/Hide | |||
| The Studied Tissue | Bladder tissue | ||||
| The Specified Disease | Interstitial cystitis [ICD-11:GC00.3] | ||||
| The Expression Level of Disease Section Compare with the Healthy Individual Tissue | p-value: 4.53E-02; Fold-change: -2.16E-01; Z-score: -2.35E+00 | ||||
|
DME expression in the diseased tissue of patients
DME expression in the normal tissue of healthy individuals
|
|||||
| Violin Diagram of DME Disease-specific Protein Abundances |
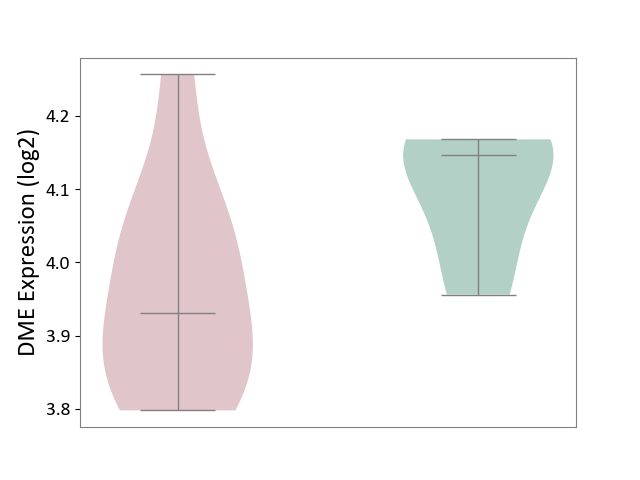
|
Click to View the Clearer Original Diagram | |||
| ICD Disease Classification 19 | Condition originating in perinatal period | Click to Show/Hide | |||
| ICD-11: KA21 | Short gestation disorder | Click to Show/Hide | |||
| The Studied Tissue | Myometrium | ||||
| The Specified Disease | Preterm birth [ICD-11:KA21.4Z] | ||||
| The Expression Level of Disease Section Compare with the Healthy Individual Tissue | p-value: 8.12E-01; Fold-change: -4.32E-02; Z-score: -2.58E-01 | ||||
|
DME expression in the diseased tissue of patients
DME expression in the normal tissue of healthy individuals
|
|||||
| Violin Diagram of DME Disease-specific Protein Abundances |
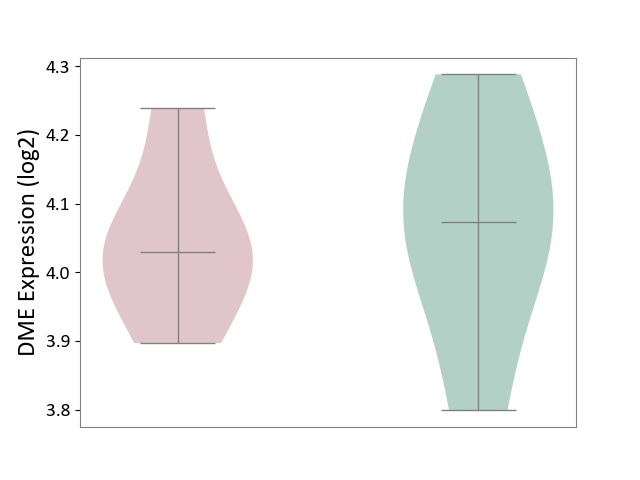
|
Click to View the Clearer Original Diagram | |||
| ICD Disease Classification 20 | Developmental anomaly | Click to Show/Hide | |||
| ICD-11: LD2C | Overgrowth syndrome | Click to Show/Hide | |||
| The Studied Tissue | Adipose tissue | ||||
| The Specified Disease | Simpson golabi behmel syndrome [ICD-11:LD2C] | ||||
| The Expression Level of Disease Section Compare with the Healthy Individual Tissue | p-value: 4.71E-01; Fold-change: 0.00E+00; Z-score: 0.00E+00 | ||||
|
DME expression in the diseased tissue of patients
DME expression in the normal tissue of healthy individuals
|
|||||
| Violin Diagram of DME Disease-specific Protein Abundances |
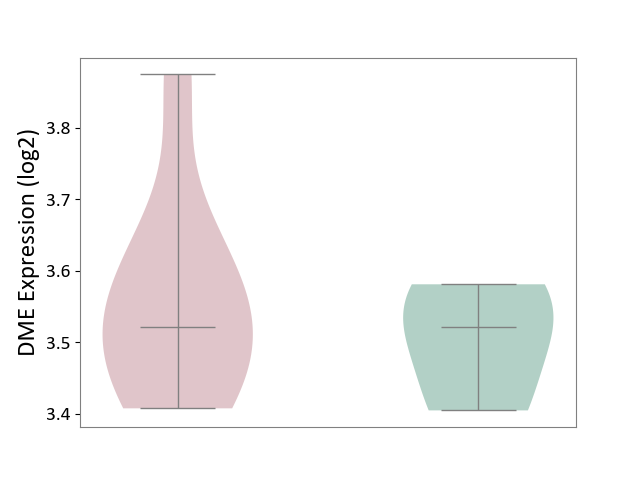
|
Click to View the Clearer Original Diagram | |||
| ICD-11: LD2D | Phakomatoses/hamartoneoplastic syndrome | Click to Show/Hide | |||
| The Studied Tissue | Perituberal tissue | ||||
| The Specified Disease | Tuberous sclerosis complex [ICD-11:LD2D.2] | ||||
| The Expression Level of Disease Section Compare with the Healthy Individual Tissue | p-value: 1.07E-01; Fold-change: 8.50E-02; Z-score: 9.43E-01 | ||||
|
DME expression in the diseased tissue of patients
DME expression in the normal tissue of healthy individuals
|
|||||
| Violin Diagram of DME Disease-specific Protein Abundances |
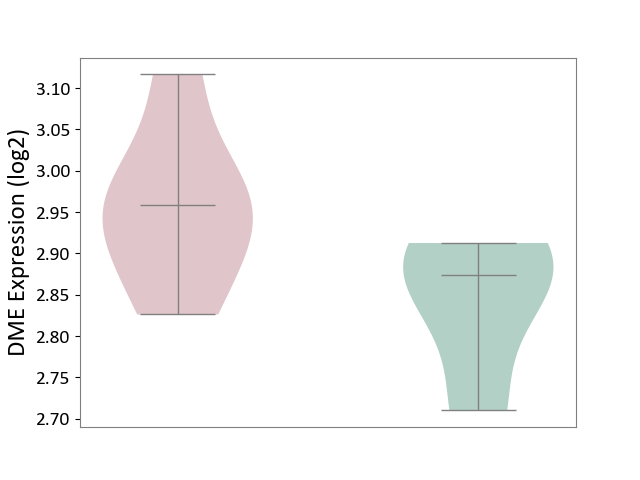
|
Click to View the Clearer Original Diagram | |||
| References | |||||
|---|---|---|---|---|---|
| 1 | Pharmacogenetic associations of CYP2C19 genotype with in vivo metabolisms and pharmacological effects of thalidomide. Cancer Biol Ther. 2002 Nov-Dec;1(6):669-73. | ||||
| 2 | DrugBank(Pharmacology-Metabolism)Bupropion | ||||
| 3 | Cytochrome P450 pharmacogenetics and cancer. Oncogene. 2006 Mar 13;25(11):1679-91. | ||||
| 4 | Identification of Novel Pathways in Idelalisib Metabolism and Bioactivation | ||||
| 5 | Metabolism of R- and S-warfarin by CYP2C19 into four hydroxywarfarins. Drug Metab Lett. 2012 Sep 1;6(3):157-64. | ||||
| 6 | Role of cytochrome P450 in estradiol metabolism in vitro. Acta Pharmacol Sin. 2001 Feb;22(2):148-54. | ||||
| 7 | DrugBank(Pharmacology-Metabolism)Estrone | ||||
| 8 | Metabolomics of Methylphenidate and Ethylphenidate: Implications in Pharmacological and Toxicological Effects | ||||
| 9 | Roles of CYP2A6 and CYP2B6 in nicotine C-oxidation by human liver microsomes. Arch Toxicol. 1999 Mar;73(2):65-70. | ||||
| 10 | Inhibition of cyclosporine and tetrahydrocannabinol metabolism by cannabidiol in mouse and human microsomes. Xenobiotica. 1996 Mar;26(3):275-84. | ||||
| 11 | Substrates, inducers, inhibitors and structure-activity relationships of human Cytochrome P450 2C9 and implications in drug development. Curr Med Chem. 2009;16(27):3480-675. | ||||
| 12 | Diclofenac and its derivatives as tools for studying human cytochromes P450 active sites: particular efficiency and regioselectivity of P450 2Cs. Biochemistry. 1999 Oct 26;38(43):14264-70. | ||||
| 13 | FDA LABEL:Hydrocodone | ||||
| 14 | Characterization of In Vitro and In Vivo Metabolism of Antazoline Using Liquid Chromatography-Tandem Mass Spectrometry | ||||
| 15 | Metabolic Profiles of Propofol and Fospropofol: Clinical and Forensic Interpretative Aspects | ||||
| 16 | In vitro metabolism of montelukast by cytochrome P450s and UDP-glucuronosyltransferases. Drug Metab Dispos. 2015 Dec;43(12):1905-16. | ||||
| 17 | Progesterone and testosterone hydroxylation by cytochromes P450 2C19, 2C9, and 3A4 in human liver microsomes. Arch Biochem Biophys. 1997 Oct 1;346(1):161-9. | ||||
| 18 | DrugBank(Pharmacology-Metabolism):Almogran | ||||
| 19 | U. S. FDA Label -Almogran | ||||
| 20 | Pharmacokinetics and metabolism of 14C-brivaracetam, a novel SV2A ligand, in healthy subjects. Drug Metab Dispos. 2008 Jan;36(1):36-45. | ||||
| 21 | Cytochrome P450-Catalyzed Metabolism of Cannabidiol to the Active Metabolite 7-Hydroxy-Cannabidiol Drug Metab Dispos. 2021 Oct;49(10):882-891. doi: 10.1124/dmd.120.000350. | ||||
| 22 | Metabolism of capsaicin by cytochrome P450 produces novel dehydrogenated metabolites and decreases cytotoxicity to lung and liver cells. Chem Res Toxicol. 2003 Mar;16(3):336-49. | ||||
| 23 | Serum clomipramine and desmethylclomipramine levels in a CYP2C19 and CYP2D6 intermediate metabolizer. Pharmacogenomics. 2017 May;18(7):601-605. | ||||
| 24 | Priapism induced by boceprevir-CYP3A4 inhibition and alpha-adrenergic blockade: case report. Clin Infect Dis. 2014 Jan;58(1):e35-8. | ||||
| 25 | The effect of ethinyloestradiol and levonorgestrel on the CYP2C19-mediated metabolism of omeprazole in healthy female subjects. Br J Clin Pharmacol. 2003 Aug;56(2):232-7. | ||||
| 26 | Effect of fluconazole on the pharmacokinetics of a single dose of fedratinib in healthy adults. Cancer Chemother Pharmacol. 2022 Oct;90(4):325-334. doi: 10.1007/s00280-022-04464-w. | ||||
| 27 | Development of a substrate-activity based approach to identify the major human liver P-450 catalysts of cyclophosphamide and ifosfamide activation based on cDNA-expressed activities and liver microsomal P-450 profiles. Drug Metab Dispos. 1999 Jun;27(6):655-66. | ||||
| 28 | Clinical pharmacokinetics of tyrosine kinase inhibitors. Cancer Treat Rev. 2009 Dec;35(8):692-706. | ||||
| 29 | Multiple cytochrome P-450s involved in the metabolism of terbinafine suggest a limited potential for drug-drug interactions. Drug Metab Dispos. 1999 Sep;27(9):1029-38. | ||||
| 30 | A phenotype-genotype approach to predicting CYP450 and P-glycoprotein drug interactions with the mixed inhibitor/inducer tipranavir/ritonavir. Clin Pharmacol Ther. 2010 Jun;87(6):735-42. | ||||
| 31 | A mechanistic approach to antiepileptic drug interactions. Ann Pharmacother. 1998 May;32(5):554-63. | ||||
| 32 | Identification of the human liver enzymes involved in the metabolism of the antimigraine agent almotriptan. Drug Metab Dispos. 2003 Apr;31(4):404-11. | ||||
| 33 | Cytochrome P450 3A4 is the major enzyme involved in the metabolism of the substance P receptor antagonist aprepitant. Drug Metab Dispos. 2004 Nov;32(11):1287-92. | ||||
| 34 | Oxidative metabolism of bupivacaine into pipecolylxylidine in humans is mainly catalyzed by CYP3A. Drug Metab Dispos. 2000 Apr;28(4):383-5. | ||||
| 35 | The effect of CYP2C19 and CYP2D6 genotypes on the metabolism of clomipramine in Japanese psychiatric patients. J Clin Psychopharmacol. 2001 Dec;21(6):549-55. | ||||
| 36 | Drug Interactions Flockhart Table | ||||
| 37 | Identification of the human cytochrome P450 enzymes involved in the in vitro biotransformation of lynestrenol and norethindrone. J Steroid Biochem Mol Biol. 2008 May;110(1-2):56-66. | ||||
| 38 | Quantitative contribution of CYP2D6 and CYP3A to oxycodone metabolism in human liver and intestinal microsomes. Drug Metab Dispos. 2004 Apr;32(4):447-54. | ||||
| 39 | In vitro characterization of the human biotransformation and CYP reaction phenotype of ET-743 (Yondelis, Trabectidin), a novel marine anti-cancer drug. Invest New Drugs. 2006 Jan;24(1):3-14. | ||||
| 40 | Danazol inhibits cytochrome P450 2J2 activity in a substrate-independent manner. Drug Metab Dispos. 2015 Aug;43(8):1250-3. | ||||
| 41 | Genetic polymorphism of cytochrome P450 2D6 determines oestrogen receptor activity of the major infertility drug clomiphene via its active metabolites | ||||
| 42 | Pharmacogenetics of schizophrenia. Am J Med Genet. 2000 Spring;97(1):98-106. | ||||
| 43 | CYP2D6 and CYP3A4 involvement in the primary oxidative metabolism of hydrocodone by human liver microsomes. Br J Clin Pharmacol. 2004 Mar;57(3):287-97. | ||||
| 44 | Impact of cytochrome P450 variation on meperidine N-demethylation to the neurotoxic metabolite normeperidine. Xenobiotica. 2020 Feb;50(2):209-222. | ||||
| 45 | Organic anion-transporting polypeptide B (OATP-B) and its functional comparison with three other OATPs of human liver. Gastroenterology. 2001 Feb;120(2):525-33. | ||||
| 46 | High-dose rabeprazole/amoxicillin therapy as the second-line regimen after failure to eradicate H. pylori by triple therapy with the usual doses of a proton pump inhibitor, clarithromycin and amoxicillin. Hepatogastroenterology. 2003 Nov-Dec;50(54):2274-8. | ||||
| 47 | Clinical pharmacology of axitinib. Clin Pharmacokinet. 2013 Sep;52(9):713-25. | ||||
| 48 | Interaction of cisapride with the human cytochrome P450 system: metabolism and inhibition studies. Drug Metab Dispos. 2000 Jul;28(7):789-800. | ||||
| 49 | Multiple human cytochromes contribute to biotransformation of dextromethorphan in-vitro: role of CYP2C9, CYP2C19, CYP2D6, and CYP3A. J Pharm Pharmacol. 1998 Sep;50(9):997-1004. | ||||
| 50 | Summary of information on human CYP enzymes: human P450 metabolism data. Drug Metab Rev. 2002 Feb-May;34(1-2):83-448. | ||||
| 51 | Contributions of CYP2D6, CYP2C9 and CYP2C19 to the biotransformation of E- and Z-doxepin in healthy volunteers. Pharmacogenetics. 2002 Oct;12(7):571-80. | ||||
| 52 | Identification of a novel glutathione conjugate of flutamide in incubations with human liver microsomes. Drug Metab Dispos. 2007 Jul;35(7):1081-8. | ||||
| 53 | FDA Approved Drug Products: Perforomist? inhalation solution | ||||
| 54 | In vitro characterization of the metabolism of haloperidol using recombinant cytochrome p450 enzymes and human liver microsomes. Drug Metab Dispos. 2001 Dec;29(12):1638-43. | ||||
| 55 | Effects of clarithromycin on lansoprazole pharmacokinetics between CYP2C19 genotypes. Br J Clin Pharmacol. 2005 Mar;59(3):302-9. | ||||
| 56 | In?vitro assessment of the potential for dolutegravir to affect hepatic clearance of levonorgestrel | ||||
| 57 | Identification of human cytochrome P450 and flavin-containing monooxygenase enzymes involved in the metabolism of lorcaserin, a novel selective human 5-hydroxytryptamine 2C agonist. Drug Metab Dispos. 2012 Apr;40(4):761-71. | ||||
| 58 | Investigation of the effects of ketoconazole on the pharmacokinetics of macitentan, a novel dual endothelin receptor antagonist, in healthy subjects. Clin Pharmacokinet. 2013 Aug;52(8):685-92. | ||||
| 59 | Population pharmacokinetics of pomalidomide. J Clin Pharmacol. 2015 May;55(5):563-72. | ||||
| 60 | Clinical relevance of genetic polymorphisms in the human CYP2C subfamily. Br J Clin Pharmacol. 2001 Oct;52(4):349-55. | ||||
| 61 | Cytochromes of the P450 2C subfamily are the major enzymes involved in the O-demethylation of verapamil in humans. Naunyn Schmiedebergs Arch Pharmacol. 1995 Dec;353(1):116-21. | ||||
| 62 | A study on CYP2C19 and CYP2D6 polymorphic effects on pharmacokinetics and pharmacodynamics of amitriptyline in healthy Koreans. Clin Transl Sci. 2017 Mar;10(2):93-101. | ||||
| 63 | The contribution of the enzymes CYP2D6 and CYP2C19 in the demethylation of artemether in healthy subjects. Eur J Drug Metab Pharmacokinet. 1998 Jul-Sep;23(3):429-36. | ||||
| 64 | Atomoxetine: a review of its pharmacokinetics and pharmacogenomics relative to drug disposition. J Child Adolesc Psychopharmacol. 2016 May;26(4):314-26. | ||||
| 65 | Transport, metabolism, and in vivo population pharmacokinetics of the chloro benztropine analogs, a class of compounds extensively evaluated in animal models of drug abuse. J Pharmacol Exp Ther. 2007 Jan;320(1):344-53. | ||||
| 66 | Metabolite profiling and reaction phenotyping for the in vitro assessment of the bioactivation of bromfenac. Chem Res Toxicol. 2020 Jan 21;33(1):249-257. | ||||
| 67 | Carbamazepine and its metabolites in human perfused placenta and in maternal and cord blood Epilepsia. 1995 Mar;36(3):241-8. doi: 10.1111/j.1528-1157.1995.tb00991.x. | ||||
| 68 | FDA label of Cenobamate. The 2020 official website of the U.S. Food and Drug Administration. | ||||
| 69 | A major influence of CYP2C19 genotype on the steady-state concentration of N-desmethylclobazam. Brain Dev. 2004 Dec;26(8):530-4. | ||||
| 70 | Effects of CYP3A4 inhibition by diltiazem on pharmacokinetics and dynamics of diazepam in relation to CYP2C19 genotype status. Drug Metab Dispos. 2001 Oct;29(10):1284-9. | ||||
| 71 | Effects of CYP2C19 genotype and CYP2C9 on fluoxetine N-demethylation in human liver microsomes. Acta Pharmacol Sin. 2001 Jan;22(1):85-90. | ||||
| 72 | Inhibitory effects of tricyclic antidepressants (TCAs) on human cytochrome P450 enzymes in vitro: mechanism of drug interaction between TCAs and phenytoin. Drug Metab Dispos. 2002 Oct;30(10):1102-7. | ||||
| 73 | In vitro metabolism studies on the isoxazole ring scission in the anti-inflammatory agent lefluonomide to its active alpha-cyanoenol metabolite A771726: mechanistic similarities with the cytochrome P450-catalyzed dehydration of aldoximes Drug Metab Dispos. 2003 Oct;31(10):1240-50. doi: 10.1124/dmd.31.10.1240. | ||||
| 74 | Characterization of Stereoselective Metabolism, Inhibitory Effect on Uric Acid Uptake Transporters, and Pharmacokinetics of Lesinurad Atropisomers Drug Metab Dispos. 2019 Feb;47(2):104-113. doi: 10.1124/dmd.118.080549. | ||||
| 75 | Cytochromes P450: a structure-based summary of biotransformations using representative substrates Drug Metab Rev. 2008;40(1):1-100. doi: 10.1080/03602530802309742. | ||||
| 76 | Nilutamide inhibits mephenytoin 4-hydroxylation in untreated male rats and in human liver microsomes. Xenobiotica. 1991 Dec;21(12):1559-70. | ||||
| 77 | In vitro metabolism of oxymetazoline: evidence for bioactivation to a reactive metabolite Drug Metab Dispos. 2011 Apr;39(4):693-702. doi: 10.1124/dmd.110.036004. | ||||
| 78 | Metabolic profile of oxazepam and related benzodiazepines: clinical and forensic aspects Drug Metab Rev. 2017 Nov;49(4):451-463. doi: 10.1080/03602532.2017.1377223. | ||||
| 79 | Substrates, inducers, inhibitors and structure-activity relationships of human Cytochrome P450 2C9 and implications in drug development Curr Med Chem. 2009;16(27):3480-675. doi: 10.2174/092986709789057635. | ||||
| 80 | Population pharmacokinetics and pharmacogenetics analysis of rilpivirine in HIV-1-infected individuals. Antimicrob Agents Chemother. 2016 Dec 27;61(1). | ||||
| 81 | Pharmacogenomics of statins: understanding susceptibility to adverse effects. Pharmgenomics Pers Med. 2016 Oct 3;9:97-106. | ||||
| 82 | Suvorexant: a promising, novel treatment for insomnia Neuropsychiatr Dis Treat. 2016 Feb 25;12:491-5. doi: 10.2147/NDT.S31495. | ||||
| 83 | Investigations into the drug-drug interaction potential of tapentadol in human liver microsomes and fresh human hepatocytes Drug Metab Lett. 2008 Jan;2(1):67-75. doi: 10.2174/187231208783478434. | ||||
| 84 | The pharmacokinetics, metabolism, and clearance mechanisms of tofacitinib, a janus kinase inhibitor, in humans. Drug Metab Dispos. 2014 Apr;42(4):759-73. | ||||
| 85 | Evaluation of drug interaction potential of zanubrutinib with cocktail probes representative of CYP3A4, CYP2C9, CYP2C19, P-gp and BCRP | ||||
| 86 | Zolpidem extended-release: a single insomnia treatment option for sleep induction and sleep maintenance symptoms. Am J Ther. 2007 May-Jun;14(3):299-305. | ||||
| 87 | A significant role of human cytochrome P450 2C8 in amiodarone N-deethylation: an approach to predict the contribution with relative activity factor. Drug Metab Dispos. 2000 Nov;28(11):1303-10. | ||||
| 88 | Isozyme-specific induction of low-dose aspirin on cytochrome P450 in healthy subjects. Clin Pharmacol Ther. 2003 Mar;73(3):264-71. | ||||
| 89 | In vitro identification of the human cytochrome P-450 enzymes involved in the N-demethylation of azelastine. Drug Metab Dispos. 1999 Aug;27(8):942-6. | ||||
| 90 | Bedaquiline metabolism: enzymes and novel metabolites. Drug Metab Dispos. 2014 May;42(5):863-6. | ||||
| 91 | Effects of Rifamycin Coadministration on Bedaquiline Desmethylation in Healthy Adult Volunteers | ||||
| 92 | Contribution of the different UDP-glucuronosyltransferase (UGT) isoforms to buprenorphine and norbuprenorphine metabolism and relationship with the main UGT polymorphisms in a bank of human liver microsomes. Drug Metab Dispos. 2010 Jan;38(1):40-5. | ||||
| 93 | Chlorpropamide 2-hydroxylation is catalysed by CYP2C9 and CYP2C19 in vitro: chlorpropamide disposition is influenced by CYP2C9, but not by CYP2C19 genetic polymorphism. Br J Clin Pharmacol. 2005 May;59(5):552-63. | ||||
| 94 | Citalopram and desmethylcitalopram in vitro: human cytochromes mediating transformation, and cytochrome inhibitory effects. Biol Psychiatry. 1999 Sep 15;46(6):839-49. | ||||
| 95 | Influence of CYP2C19 polymorphism and Helicobacter pylori genotype determined from gastric tissue samples on response to triple therapy for H pylori infection. Clin Gastroenterol Hepatol. 2005 Jun;3(6):564-73. | ||||
| 96 | Drug metabolism and atypical antipsychotics. Eur Neuropsychopharmacol. 1999 Jun;9(4):301-9. | ||||
| 97 | Predictive performance of physiologically based pharmacokinetic (PBPK) modeling of drugs extensively metabolized by major cytochrome P450s in children. Clin Pharmacol Ther. 2018 Jul;104(1):188-200. | ||||
| 98 | Biotransformation of the antiretroviral drug etravirine: metabolite identification, reaction phenotyping, and characterization of autoinduction of cytochrome P450-dependent metabolism. Drug Metab Dispos. 2012 Apr;40(4):803-14. | ||||
| 99 | CYP2C9, CYP2C19, and ABCB1 genotype and hospitalization for phenytoin toxicity. J Clin Pharmacol. 2009 Dec;49(12):1483-7. | ||||
| 100 | Pharmacokinetics of chlorpheniramine, phenytoin, glipizide and nifedipine in an individual homozygous for the CYP2C9*3 allele. Pharmacogenetics. 1999 Feb;9(1):71-80. | ||||
| 101 | In vitro identification of the human cytochrome p450 enzymes involved in the oxidative metabolism of loxapine. Biopharm Drug Dispos. 2011 Oct;32(7):398-407. | ||||
| 102 | A dual system platform for drug metabolism: Nalbuphine as a model compound | ||||
| 103 | Ospemifene metabolism in humans in vitro and in vivo: metabolite identification, quantitation, and CYP assignment of major hydroxylations. Drug Metabol Drug Interact. 2013;28(3):153-61. | ||||
| 104 | Identification of cytochrome P450 isoforms involved in the metabolism of paroxetine and estimation of their importance for human paroxetine metabolism using a population-based simulator. Drug Metab Dispos. 2010 Mar;38(3):376-85. | ||||
| 105 | CYP2C19 polymorphism effect on phenobarbitone. Pharmacokinetics in Japanese patients with epilepsy: analysis by population pharmacokinetics. Eur J Clin Pharmacol. 2000 Feb-Mar;55(11-12):821-5. | ||||
| 106 | Identification of the human cytochrome P450 isoforms mediating in vitro N-dealkylation of perphenazine. Br J Clin Pharmacol. 2000 Dec;50(6):563-71. | ||||
| 107 | Influence of cytochrome P450 genotype on the plasma disposition of prochlorperazine metabolites and their relationships with clinical responses in cancer patients Ann Clin Biochem. 2018 May;55(3):385-393. doi: 10.1177/0004563217731432. | ||||
| 108 | Possible involvement of multiple human cytochrome P450 isoforms in the liver metabolism of propofol. Br J Anaesth. 1998 Jun;80(6):788-95. | ||||
| 109 | A liquid chromatographic-electrospray-tandem mass spectrometric method for quantitation of quetiapine in human plasma and liver microsomes: application to study in vitro metabolism. J Anal Toxicol. 2004 Sep;28(6):443-8. | ||||
| 110 | Effects of clarithromycin and verapamil on rabeprazole pharmacokinetics between CYP2C19 genotypes. Eur J Clin Pharmacol. 2006 Aug;62(8):597-603. | ||||
| 111 | Metabolism of sumatriptan revisited | ||||
| 112 | Clinical assessment of drug-drug interactions of tasimelteon, a novel dual melatonin receptor agonist J Clin Pharmacol. 2015 Sep;55(9):1004-11. doi: 10.1002/jcph.507. | ||||
| 113 | CYP2J2 and CYP2C19 are the major enzymes responsible for metabolism of albendazole and fenbendazole in human liver microsomes and recombinant P450 assay systems. Antimicrob Agents Chemother. 2013 Nov;57(11):5448-56. | ||||
| 114 | Cytochrome P450-mediated metabolism of triclosan attenuates its cytotoxicity in hepatic cells | ||||
| 115 | O- and N-demethylation of venlafaxine in vitro by human liver microsomes and by microsomes from cDNA-transfected cells: effect of metabolic inhibitors and SSRI antidepressants. Neuropsychopharmacology. 1999 May;20(5):480-90. | ||||
| 116 | Vilazodone HCl (Viibryd): A Serotonin Partial Agonist and Reuptake Inhibitor For the Treatment of Major Depressive Disorder. P T. 2012 Jan;37(1):28-31. | ||||
| 117 | Vortioxetine: clinical pharmacokinetics and drug interactions. Clin Pharmacokinet. 2018 Jun;57(6):673-686. | ||||
| 118 | Apixaban. Hosp Pharm. 2013 Jun;48(6):494-509. | ||||
| 119 | More methemoglobin is produced by benzocaine treatment than lidocaine treatment in human in vitro systems | ||||
| 120 | A long-standing mystery solved: the formation of 3-hydroxydesloratadine is catalyzed by CYP2C8 but prior glucuronidation of desloratadine by UDP-glucuronosyltransferase 2B10 is an obligatory requirement Drug Metab Dispos. 2015 Apr;43(4):523-33. doi: 10.1124/dmd.114.062620. | ||||
| 121 | Pharmacological and safety profile of dexlansoprazole: a new proton pump inhibitor - implications for treatment of gastroesophageal reflux disease in the Asia Pacific region. J Neurogastroenterol Motil. 2016 Jul 30;22(3):355-66. | ||||
| 122 | FDA label of Fedratinib. The 2020 official website of the U.S. Food and Drug Administration. | ||||
| 123 | The impact of individual human cytochrome P450 enzymes on oxidative metabolism of anticancer drug lenvatinib | ||||
| 124 | The Role of Levomilnacipran in the Management of Major Depressive Disorder: A Comprehensive Review Curr Neuropharmacol. 2016;14(2):191-9. doi: 10.2174/1570159x14666151117122458. | ||||
| 125 | Methadone metabolism and drug-drug interactions: in vitro and in vivo literature review. J Pharm Sci. 2018 Dec;107(12):2983-2991. | ||||
| 126 | The in vitro metabolism of desglymidodrine, an active metabolite of prodrug midodrine by human liver microsomes | ||||
| 127 | Impact of CYP2C19 polymorphism on the pharmacokinetics of nelfinavir in patients with pancreatic cancer. Br J Clin Pharmacol. 2015 Aug;80(2):267-75. | ||||
| 128 | Proton pump inhibitors: from CYP2C19 pharmacogenetics to precision medicine. Expert Opin Drug Metab Toxicol. 2018 Apr;14(4):447-460. | ||||
| 129 | An evaluation of potential mechanism-based inactivation of human drug metabolizing cytochromes P450 by monoamine oxidase inhibitors, including isoniazid. Br J Clin Pharmacol. 2006 May;61(5):570-84. | ||||
| 130 | Effects of prototypical microsomal enzyme inducers on cytochrome P450 expression in cultured human hepatocytes. Drug Metab Dispos. 2003 Apr;31(4):421-31. | ||||
| 131 | Oxidation of ranitidine by isozymes of flavin-containing monooxygenase and cytochrome P450. Jpn J Pharmacol. 2000 Oct;84(2):213-20. | ||||
| 132 | Identification of cytochrome P450 and arylamine N-acetyltransferase isoforms involved in sulfadiazine metabolism. Drug Metab Dispos. 2005 Jul;33(7):969-76. | ||||
| 133 | PubChem:Tapinarof | ||||
| 134 | Lerman J. (2014). Neonatal Anesthesia. Springer. | ||||
| 135 | Metabolism of ophthalmic timolol: new aspects of an old drug. Basic Clin Pharmacol Toxicol. 2011 May;108(5):297-303. | ||||
| 136 | CYP2C19 participates in tolbutamide hydroxylation by human liver microsomes. Drug Metab Dispos. 2000 Mar;28(3):354-9. | ||||
| 137 | Tolterodine, a new muscarinic receptor antagonist, is metabolized by cytochromes P450 2D6 and 3A in human liver microsomes. Drug Metab Dispos. 1998 Apr;26(4):289-93. | ||||
| 138 | In vitro inhibitory effects of troglitazone and its metabolites on drug oxidation activities of human cytochrome P450 enzymes: comparison with pioglitazone and rosiglitazone. Xenobiotica. 2000 Jan;30(1):61-70. | ||||
| 139 | Effect of voriconazole on the pharmacokinetics of diclofenac. Fundam Clin Pharmacol. 2007 Dec;21(6):651-6. | ||||
| 140 | Application of substrate depletion assay to evaluation of CYP isoforms responsible for stereoselective metabolism of carvedilol. Drug Metab Pharmacokinet. 2016 Dec;31(6):425-432. | ||||
| 141 | Clinical pharmacokinetics and drug-drug interactions of endothelin receptor antagonists in pulmonary arterial hypertension. J Clin Pharmacol. 2012 Dec;52(12):1784-805. | ||||
| 142 | A comparison of the expression and metabolizing activities of phase I and II enzymes in freshly isolated human lung parenchymal cells and cryopreserved human hepatocytes. Drug Metab Dispos. 2007 Oct;35(10):1797-805. | ||||
| 143 | Drug Interactions with Angiotensin Receptor Blockers: Role of Human Cytochromes P450 | ||||
| 144 | Lithium Intoxication in the Elderly: A Possible Interaction between Azilsartan, Fluvoxamine, and Lithium | ||||
| 145 | Association between blood carisoprodol:meprobamate concentration ratios and CYP2C19 genotype in carisoprodol-drugged drivers: decreased metabolic capacity in heterozygous CYP2C19*1/CYP2C19*2 subjects? Pharmacogenetics. 2003 Jul;13(7):383-8. | ||||
| 146 | Chloramphenicol is a potent inhibitor of cytochrome P450 isoforms CYP2C19 and CYP3A4 in human liver microsomes. Antimicrob Agents Chemother. 2003 Nov;47(11):3464-9. | ||||
| 147 | Effects of CYP3A inhibition on the metabolism of cilostazol. Clin Pharmacokinet. 1999;37 Suppl 2:61-8. | ||||
| 148 | Impact of the CYP2C19 gene polymorphism on clopidogrel personalized drug regimen and the clinical outcomes. Clin Lab. 2016 Sep 1;62(9):1773-1780. | ||||
| 149 | CYP2C8/9 mediate dapsone N-hydroxylation at clinical concentrations of dapsone. Drug Metab Dispos. 2000 Aug;28(8):865-8. | ||||
| 150 | Dydrogesterone metabolism in human liver by aldo-keto reductases and cytochrome P450 enzymes Xenobiotica. 2016 Oct;46(10):868-74. doi: 10.3109/00498254.2015.1134852. | ||||
| 151 | Eletriptan metabolism by human hepatic CYP450 enzymes and transport by human P-glycoprotein. Drug Metab Dispos. 2003 Jul;31(7):861-9. | ||||
| 152 | Escitalopram pharmacogenetics: CYP2C19 relationships with dosing and clinical outcomes in autism spectrum disorder. Pharmacogenet Genomics. 2015 Nov;25(11):548-54. | ||||
| 153 | Flibanserin therapy and CYP2C19 genotype. | ||||
| 154 | An updated review of iclaprim: a potent and rapidly bactericidal antibiotic for the treatment of skin and skin structure infections and nosocomial pneumonia caused by gram-positive including multidrug-resistant bacteria. Open Forum Infect Dis. 2018 Jan 6;5(2):ofy003. | ||||
| 155 | Lacosamide therapeutic monitoring in patients with epilepsy: effect of concomitant antiepileptic drugs. Ther Drug Monit. 2013 Dec;35(6):849-52. | ||||
| 156 | Evaluation of the effects of the weak CYP3A inhibitors atorvastatin and ethinyl estradiol/norgestimate on lomitapide pharmacokinetics in healthy subjects. J Clin Pharmacol. 2016 Jan;56(1):47-55. | ||||
| 157 | Advances in high-resolution MS and hepatocyte models solve a long-standing metabolism challenge: the loratadine story. Bioanalysis. 2016 Aug;8(16):1645-62. | ||||
| 158 | Cytochromes P450 mediating the N-demethylation of amitriptyline. Br J Clin Pharmacol. 1997 Feb;43(2):137-44. | ||||
| 159 | Value of preemptive CYP2C19 genotyping in allogeneic stem cell transplant patients considered for pentamidine administration. Clin Transplant. 2011 May-Jun;25(3):E271-5. | ||||
| 160 | The evolution of antiplatelet therapy in the treatment of acute coronary syndromes: from aspirin to the present day. Drugs. 2012 Nov 12;72(16):2087-116. | ||||
| 161 | Clinically significant pharmacokinetic drug interactions between antiepileptic drugs. J Clin Pharm Ther. 1999 Apr;24(2):87-92. | ||||
| 162 | In vitro metabolism of quazepam in human liver and intestine and assessment of drug interactions. Xenobiotica. 2004 Nov-Dec;34(11-12):1001-11. | ||||
| 163 | Comparative studies on the cytochrome p450-associated metabolism and interaction potential of selegiline between human liver-derived in vitro systems. Drug Metab Dispos. 2003 Sep;31(9):1093-102. | ||||
| 164 | Influence of CYP2B6 and CYP2C19 polymorphisms on sertraline metabolism in major depression patients. Int J Clin Pharm. 2016 Apr;38(2):388-94. | ||||
| 165 | Identification of the cytochrome P450 enzymes involved in the N-demethylation of sildenafil. Br J Clin Pharmacol. 2001 Mar;51(3):239-48. | ||||
| 166 | FDA Label of Diacomit. The 2020 official website of the U.S. Food and Drug Administration. | ||||
| 167 | Human liver microsomal diazepam metabolism using cDNA-expressed cytochrome P450s: role of CYP2B6, 2C19 and the 3A subfamily. Xenobiotica. 1996 Nov;26(11):1155-66. | ||||
| 168 | In vitro drug-drug interaction potential of sulfoxide and/or sulfone metabolites of albendazole, triclabendazole, aldicarb, methiocarb, montelukast and ziprasidone. Drug Metab Lett. 2018;12(2):101-116. | ||||
| 169 | Effects of polymorphisms in CYP2D6, CYP2C9, and CYP2C19 on trimipramine pharmacokinetics. J Clin Psychopharmacol. 2003 Oct;23(5):459-66. | ||||
| 170 | Carbamazepine pharmacokinetics are not affected by zonisamide: in vitro mechanistic study and in vivo clinical study in epileptic patients. Epilepsy Res. 2004 Nov;62(1):1-11. | ||||
| 171 | Metabolism and Interactions of Chloroquine and Hydroxychloroquine with Human Cytochrome P450 Enzymes and Drug Transporters Curr Drug Metab. 2020;21(14):1127-1135. doi: 10.2174/1389200221999201208211537. | ||||
| 172 | The role of S-mephenytoin hydroxylase (CYP2C19) in the metabolism of the antimalarial biguanides. Br J Clin Pharmacol. 1995 Apr;39(4):441-4. | ||||
| 173 | Eight inhibitory monoclonal antibodies define the role of individual P-450s in human liver microsomal diazepam, 7-ethoxycoumarin, and imipramine metabolism. Drug Metab Dispos. 1999 Jan;27(1):102-9. | ||||
| 174 | Enasidenib for the treatment of acute myeloid leukemia. Expert Rev Clin Pharmacol. 2018 Aug;11(8):755-760. | ||||
| 175 | Development of encorafenib for BRAF-mutated advanced melanoma. Curr Opin Oncol. 2018 Mar;30(2):125-133. | ||||
| 176 | Pharmacokinetics, pharmacodynamics and drug interaction potential of enfuvirtide. Clin Pharmacokinet. 2005;44(2):175-86. | ||||
| 177 | Initial 48-hour acid inhibition by intravenous infusion of omeprazole, famotidine, or both in relation to cytochrome P450 2C19 genotype status. Clin Pharmacol Ther. 2006 Nov;80(5):539-48. | ||||
| 178 | Cross-species comparisons of the pharmacokinetics of ibudilast | ||||
| 179 | FDA label of Lorlatinib. The 2020 official website of the U.S. Food and Drug Administration. | ||||
| 180 | Evaluation of 24 CYP2D6 variants on the metabolism of nebivolol in vitro. Drug Metab Dispos. 2016 Nov;44(11):1828-1831. | ||||
| 181 | In vivo age-related changes in hepatic drug-oxidizing capacity in humans. J Clin Pharm Ther. 1998 Aug;23(4):247-55. | ||||
| 182 | Identification of human cytochrome P(450)s that metabolise anti-parasitic drugs and predictions of in vivo drug hepatic clearance from in vitro data. Eur J Clin Pharmacol. 2003 Sep;59(5-6):429-42. | ||||
| 183 | Rifampin markedly decreases plasma concentrations of praziquantel in healthy volunteers. Clin Pharmacol Ther. 2002 Nov;72(5):505-13. | ||||
| 184 | Identification of cytochrome P450 enzymes involved in the metabolism of FK228, a potent histone deacetylase inhibitor, in human liver microsomes. Biol Pharm Bull. 2005 Jan;28(1):124-9. | ||||
| 185 | In vitro metabolism of the opioid tilidine and interaction of tilidine and nortilidine with CYP3A4, CYP2C19, and CYP2D6 | ||||
| 186 | Evaluation of child/adult pharmacokinetic differences from a database derived from the therapeutic drug literature. Toxicol Sci. 2002 Apr;66(2):185-200. | ||||
| 187 | In vitro metabolism of oxymetazoline: evidence for bioactivation to a reactive metabolite. Drug Metab Dispos. 2011 Apr;39(4):693-702. | ||||
| 188 | Characterization of in vitro metabolites of deoxypodophyllotoxin in human and rat liver microsomes using liquid chromatography/tandem mass spectrometry. Rapid Commun Mass Spectrom. 2008;22(1):52-8. | ||||
| 189 | Pharmacotherapy of insomnia with ramelteon: safety, efficacy and clinical applications. J Cent Nerv Syst Dis. 2011 Apr 12;3:51-65. | ||||
| 190 | Characterization of testosterone 11 beta-hydroxylation catalyzed by human liver microsomal cytochromes P450 | ||||
| 191 | Clinical pharmacology of lumiracoxib: a selective cyclo-oxygenase-2 inhibitor. Clin Pharmacokinet. 2005;44(12):1247-66. | ||||
| 192 | CYP2D plays a major role in berberine metabolism in liver of mice and humans | ||||
| 193 | The role of CYP2C in the in vitro bioactivation of the contraceptive steroid desogestrel. J Pharmacol Exp Ther. 1998 Dec;287(3):975-82. | ||||
| 194 | Ketobemidone is a substrate for cytochrome P4502C9 and 3A4, but not for P-glycoprotein. Xenobiotica. 2005 Aug;35(8):785-96. | ||||
| 195 | Identification of human cytochrome P450 isozymes involved in the metabolism of naftopidil enantiomers in vitro. J Pharm Pharmacol. 2014 Nov;66(11):1534-51. | ||||
| 196 | No influence of the CYP2C19-selective inhibitor omeprazole on the pharmacokinetics of the dopamine receptor agonist rotigotine | ||||
| 197 | Open-label crossover study of primaquine and dihydroartemisinin-piperaquine pharmacokinetics in healthy adult thai subjects. Antimicrob Agents Chemother. 2014 Dec;58(12):7340-6. | ||||
| 198 | The effect of CYP2C19 substrate on the metabolism of melatonin in the elderly: a randomized, double-blind, placebo-controlled study. Methods Find Exp Clin Pharmacol. 2006 Sep;28(7):447-50. | ||||
| 199 | Identification of human cytochrome P450 isoforms involved in the stereoselective metabolism of mianserin enantiomers. J Pharmacol Exp Ther. 1996 Jul;278(1):21-30. | ||||
| 200 | In vitro metabolism of TAK-438, vonoprazan fumarate, a novel potassium-competitive acid blocker. Xenobiotica. 2017 Dec;47(12):1027-1034. | ||||
| 201 | The First-in-Class Potassium-Competitive Acid Blocker, Vonoprazan Fumarate: Pharmacokinetic and Pharmacodynamic Considerations | ||||
| 202 | Synthetic and natural compounds that interact with human cytochrome P450 1A2 and implications in drug development. Curr Med Chem. 2009;16(31):4066-218. | ||||
| 203 | Effects of cytochrome P450 (CYP)2C19 polymorphisms on pharmacokinetics of phenobarbital in neonates and infants with seizures. Arch Dis Child. 2012 Jun;97(6):569-72. | ||||
| 204 | Pharmacokinetic evaluation of idebenone. Expert Opin Drug Metab Toxicol. 2010 Nov;6(11):1437-44. | ||||
| 205 | Activation of phenacetin O-deethylase activity by alpha-naphthoflavone in human liver microsomes. Xenobiotica. 1999 Sep;29(9):885-98. | ||||
| 206 | Inhibition of human hepatic cytochrome P450s and steroidogenic CYP17 by nonylphenol. Biol Pharm Bull. 2002 Feb;25(2):235-8. | ||||
| 207 | Contribution of human hepatic cytochrome p450 isoforms to the metabolism of psychotropic drugs. Biol Pharm Bull. 2005 Sep;28(9):1711-6. | ||||
| 208 | The role of cytochrome P450 2C19 activity in flunitrazepam metabolism in vivo. J Clin Psychopharmacol. 2003 Apr;23(2):169-75. | ||||
| 209 | The metabolism of CYP2C9 and CYP2C19 for gliclazide by homology modeling and docking study. Eur J Med Chem. 2009 Feb;44(2):854-61. | ||||
| 210 | Cytochrome P-450 enzymes and FMO3 contribute to the disposition of the antipsychotic drug perazine in vitro. Psychopharmacology (Berl). 2000 Sep;151(4):312-20. | ||||
| 211 | PharmGKB summary: ibuprofen pathways. Pharmacogenet Genomics. 2015 Feb;25(2):96-106. | ||||
| 212 | Effects of genetic polymorphism of cytochrome P450 enzymes on the pharmacokinetics of benzodiazepines. J Clin Pharm Ther. 2007 Aug;32(4):333-41. | ||||
| 213 | Urinary diazepam metabolite distribution in a chronic pain population J Anal Toxicol. 2014 Apr;38(3):135-42. doi: 10.1093/jat/bku001. | ||||
| 214 | DrugBank(Pharmacology-Metabolism)Lofexidine | ||||
| 215 | Excretion and metabolism of milnacipran in humans after oral administration of milnacipran hydrochloride Drug Metab Dispos. 2012 Sep;40(9):1723-35. doi: 10.1124/dmd.112.045120. | ||||
| 216 | FDA LABEL:Milnacipran | ||||
| 217 | Polymorphic oxidative metabolism of proguanil in a Nigerian population. Eur J Clin Pharmacol. 2002 Nov;58(8):543-5. | ||||
| 218 | Characterization of moclobemide N-oxidation in human liver microsomes. Xenobiotica. 2001 Jul;31(7):387-97. | ||||
| 219 | Effects of Hepatic Impairment on the Pharmacokinetics of Abrocitinib and Its Metabolites | ||||
| 220 | CYP2C19*17 is associated with decreased breast cancer risk. Breast Cancer Res Treat. 2009 May;115(2):391-6. | ||||
| 221 | Preclinical pharmacokinetics and disposition of a novel selective VEGFR inhibitor fruquintinib (HMPL-013) and the prediction of its human pharmacokinetics | ||||
| 222 | Physiologically Based Pharmacokinetic Modeling for Selumetinib to Evaluate Drug-Drug Interactions and Pediatric Dose Regimens | ||||
| 223 | Metabolism, Excretion, and Pharmacokinetics of Selumetinib, an MEK1/2 inhibitor, in Healthy Adult Male Subjects | ||||
| 224 | Preclinical pharmacokinetics of triptolide: a potential antitumor drug. Curr Drug Metab. 2019;20(2):147-154. | ||||
| 225 | Involvement of multiple cytochrome P450 and UDP-glucuronosyltransferase enzymes in the in vitro metabolism of muraglitazar. Drug Metab Dispos. 2007 Jan;35(1):139-49. | ||||
| 226 | Australian Public Assessment Report for asunaprevir. | ||||
| 227 | Stereoselective hydroxylation by CYP2C19 and oxidation by ADH4 in the in vitro metabolism of tivantinib | ||||
| 228 | DrugBank(Pharmacology-Metabolism):Mavacamten | ||||
| 229 | Effect of omeprazole on the pharmacokinetics of moclobemide according to the genetic polymorphism of CYP2C19. Clin Pharmacol Ther. 2001 Apr;69(4):266-73. | ||||
| 230 | Molecular targets of cannabidiol in neurological disorders. Neurotherapeutics. 2015 Oct;12(4):699-730. | ||||
| 231 | Disposition and metabolism of semagacestat, a {gamma}-secretase inhibitor, in humans. Drug Metab Dispos. 2010 Apr;38(4):554-65. | ||||
| 232 | In vitro evaluation of fenfluramine and norfenfluramine as victims of drug interactions | ||||
| 233 | Roles of UGT, P450, and Gut Microbiota in the Metabolism of Epacadostat in Humans | ||||
| 234 | Multicenter phase I trial of the mitogen-activated protein kinase 1/2 inhibitor BAY 86-9766 in patients with advanced cancer. Clin Cancer Res. 2013 Mar 1;19(5):1232-43. | ||||
| 235 | DrugBank(Pharmacology-Metabolism):Ganaxolone | ||||
| 236 | Metabolism and metabolomics of ketamine: a toxicological approach. Forensic Sci Res. 2017 Feb 20;2(1):2-10. | ||||
| 237 | DrugBank(Pharmacology-Metabolism):PT2977 | ||||
| 238 | DrugBank(Pharmacology-Metabolism):Ag-221 | ||||
| 239 | Pharmacokinetics and disposition of momelotinib revealed a disproportionate human metabolite-resolution for clinical development. Drug Metab Dispos. 2018 Mar;46(3):237-247. | ||||
| 240 | A Pharmacokinetic, Safety, and Tolerability Trial of Palovarotene in Healthy Japanese and Non-Japanese Participants | ||||
| 241 | Determination of an optimal dosing regimen for fexinidazole, a novel oral drug for the treatment of human African trypanosomiasis: first-in-human studies | ||||
| 242 | Fexinidazole--a new oral nitroimidazole drug candidate entering clinical development for the treatment of sleeping sickness. PLoS Negl Trop Dis. 2010 Dec 21;4(12):e923. | ||||
| 243 | The Effect of Modafinil on the Safety and Pharmacokinetics of Lorlatinib: A Phase I Study in Healthy Participants | ||||
| 244 | Pharmacokinetics, metabolism, and excretion of licogliflozin, a dual inhibitor of SGLT1/2, in rats, dogs, and humans | ||||
| 245 | Interspecies pharmacokinetics and in vitro metabolism of SQ109. Br J Pharmacol. 2006 Mar;147(5):476-85. | ||||
| 246 | Metabolic Profiling of the Novel Hypoxia-Inducible Factor 2 Inhibitor PT2385 In Vivo and In Vitro | ||||
| 247 | Assessment of the drug interaction risk for remogliflozin etabonate, a sodium-dependent glucose cotransporter-2 inhibitor: evidence from in vitro, human mass balance, and ketoconazole interaction studies | ||||
| 248 | In vitro inhibition and enhancement of liver microsomal S-777469 metabolism by long-chain fatty acids and serum albumin: insight into in vitro and in vivo discrepancy of metabolite formation in humans | ||||
| 249 | In vitro metabolism of ferroquine (SSR97193) in animal and human hepatic models and antimalarial activity of major metabolites on Plasmodium falciparum. Drug Metab Dispos. 2006 Apr;34(4):667-82. | ||||
| 250 | 17alpha-alkynyl 3alpha, 17beta-androstanediol non-clinical and clinical pharmacology, pharmacokinetics and metabolism. Invest New Drugs. 2012 Feb;30(1):59-78. | ||||
| 251 | Effect of deuteration on metabolism and clearance of Nerispirdine (HP184) and AVE5638 | ||||
| 252 | Clinical pharmacokinetics and pharmacogenetics of tamoxifen and endoxifen | ||||
| 253 | Identification of metabolic pathways involved in the biotransformation of tolperisone by human microsomal enzymes. Drug Metab Dispos. 2003 May;31(5):631-6. | ||||
| 254 | Anti-inflammatory effects of ladostigil and its metabolites in aged rat brain and in microglial cells | ||||
| 255 | Metabolism of the MEK1/2 inhibitor pimasertib involves a novel conjugation with phosphoethanolamine in patients with solid tumors. Drug Metab Dispos. 2017 Feb;45(2):174-182. | ||||
| 256 | In vitro prediction and in vivo verification of enantioselective human tofisopam metabolite profiles | ||||
| 257 | Role of CYP2C9, CYP2C19 and EPHX Polymorphism in the Pharmacokinetic of Phenytoin: A Study on Uruguayan Caucasian Subjects | ||||
| 258 | Pharmacokinetics, tissue distribution and identification of putative metabolites of JI-101 - a novel triple kinase inhibitor in rats | ||||
| 259 | Phase I clinical trial of MPC-6827 (Azixa), a microtubule destabilizing agent, in patients with advanced cancer | ||||
| 260 | CYP2C9 and CYP2C19 polymorphic forms are related to increased indisulam exposure and higher risk of severe hematologic toxicity. Clin Cancer Res. 2007 May 15;13(10):2970-6. | ||||
| 261 | Simulation of human plasma concentration-time profiles of the partial glucokinase activator PF-04937319 and its disproportionate N-demethylated metabolite using humanized chimeric mice and semi-physiological pharmacokinetic modeling | ||||
| 262 | In vitro metabolism, pharmacokinetics and drug interaction potentials of emvododstat, a DHODH inhibitor | ||||
| 263 | Evaluation of the drug-drug interaction potential for trazpiroben (TAK-906), a D(2)/D(3) receptor antagonist for gastroparesis, towards cytochrome P450s and transporters | ||||
| 264 | Metabolic map and bioactivation of the anti-tumour drug noscapine | ||||
| 265 | The Utilization of Mu-Opioid Receptor Biased Agonists: Oliceridine, an Opioid Analgesic with Reduced Adverse Effects | ||||
| 266 | Main contribution of the cytochrome P450 isoenzyme 1A2 (CYP1A2) to N-demethylation and 5-sulfoxidation of the phenothiazine neuroleptic chlorpromazine in human liver--A comparison with other phenothiazines. Biochem Pharmacol. 2010 Oct 15;80(8):1252-9. | ||||
| 267 | Metabolism and pharmacokinetics of allitinib in cancer patients: the roles of cytochrome P450s and epoxide hydrolase in its biotransformation | ||||
| 268 | Pharmacokinetics and Metabolism of Naringin and Active Metabolite Naringenin in Rats, Dogs, Humans, and the Differences Between Species | ||||
| 269 | Nonclinical pharmacokinetics and in vitro metabolism of H3B-6545, a novel selective ERalpha covalent antagonist (SERCA). Cancer Chemother Pharmacol. 2019 Jan;83(1):151-160. | ||||
| 270 | In vitro metabolism of 17-(dimethylaminoethylamino)-17-demethoxygeldanamycin in human liver microsomes | ||||
| 271 | Elucidating the Mechanisms of Formation for Two Unusual Cytochrome P450-Mediated Fused Ring Metabolites of GDC-0623, a MAPK/ERK Kinase Inhibitor | ||||
| 272 | ITX 5061 quantitation in human plasma with reverse phase liquid chromatography and mass spectrometry detection. Antivir Ther. 2013;18(3):329-36. | ||||
| 273 | An assessment of human liver-derived in vitro systems to predict the in vivo metabolism and clearance of almokalant | ||||
| 274 | Absorption, metabolism, and excretion of [14C]MK-0767 (2-methoxy-5-(2,4-dioxo-5-thiazolidinyl)-N-[[4-(trifluoromethyl)phenyl] methyl]benzamide) in humans | ||||
| 275 | In vitro metabolism of 7 neuronal nicotinic receptor agonist AZD0328 and enzyme identification for its N-oxide metabolite | ||||
| 276 | Identification of cytochrome P450 isoform involved in the metabolism of YM992, a novel selective serotonin re-uptake inhibitor, in human liver microsomes | ||||
| 277 | Behavior of thymidylate kinase toward monophosphate metabolites and its role in the metabolism of 1-(2'-deoxy-2'-fluoro-beta-L-arabinofuranosyl)-5-methyluracil (Clevudine) and 2',3'-didehydro-2',3'-dideoxythymidine in cells. Antimicrob Agents Chemother. 2005 May;49(5):2044-9. doi: 10.1128/AAC.49.5.2044-2049.2005. | ||||
| 278 | Metabolic mechanism and anti-inflammation effects of sinomenine and its major metabolites N-demethylsinomenine and sinomenine-N-oxide | ||||
| 279 | Combined in vitro-in vivo approach to assess the hepatobiliary disposition of a novel oral thrombin inhibitor | ||||
| 280 | In vitro interactions between a potential muscle relaxant E2101 and human cytochromes P450 | ||||
| 281 | In vitro metabolism studies of nomifensine monooxygenation pathways: metabolite identification, reaction phenotyping, and bioactivation mechanism | ||||
| 282 | Identification of cytochromes P450 involved in the human liver microsomal metabolism of the thromboxane A2 inhibitor seratrodast (ABT-001). Drug Metab Dispos. 1997 Jan;25(1):110-5. | ||||
| 283 | A novel single nucleotide polymorphism (SNP) of the CYP2C19 gene in a Japanese subject with lowered capacity of mephobarbital 4'-hydroxylation. Drug Metab Pharmacokinet. 2004 Jun;19(3):236-8. | ||||
| 284 | Hepatotoxicity observed in clinical trials of aplaviroc (GW873140). Antimicrob Agents Chemother. 2008 Mar;52(3):858-65. | ||||
| 285 | Antidepressants: Past, Present and Future. Edited by Sheldon H. Preskorn Christina Y. Stanga John P. Feighner Ruth Ross. Page: 574. | ||||
| 286 | Using chimeric mice with humanized livers to predict human drug metabolism and a drug-drug interaction. J Pharmacol Exp Ther. 2013 Feb;344(2):388-96. | ||||
| 287 | Stereoselective hexobarbital 3'-hydroxylation by CYP2C19 expressed in yeast cells and the roles of amino acid residues at positions 300 and 476. Chirality. 2007 Jul;19(7):550-8. | ||||
| 288 | The role of CYP2C19 in the metabolism of (+/-) bufuralol, the prototypic substrate of CYP2D6 | ||||
| 289 | Kinetic characterization and identification of the enzymes responsible for the hepatic biotransformation of adinazolam and N-desmethyladinazolam in man. J Pharm Pharmacol. 1998 Mar;50(3):265-74. | ||||
| 290 | Selective serotonin reuptake inhibitors and CNS drug interactions. A critical review of the evidence. Clin Pharmacokinet. 1997 Dec;33(6):454-71. | ||||
| 291 | Midazolam and other benzodiazepines. Handb Exp Pharmacol. 2008;(182):335-60. | ||||
| 292 | Orphenadrine and methimazole inhibit multiple cytochrome P450 enzymes in human liver microsomes. Drug Metab Dispos. 1997 Mar;25(3):390-3. | ||||
| 293 | A cytochrome P450 class I electron transfer system from Novosphingobium aromaticivorans. Appl Microbiol Biotechnol. 2010 Mar;86(1):163-75. | ||||
| 294 | Study on the cytochrome P450-mediated oxidative metabolism of the terpene alcohol linalool: indication of biological epoxidation | ||||
| 295 | Metabolism of geraniol and linalool in the rat and effects on liver and lung microsomal enzymes | ||||
| 296 | Active cyamemazine metabolites in patients treated with cyamemazine (Tercian?): influence on cerebral dopamine D2 and serotonin 5-HT (2A) receptor occupancy as measured by positron emission tomography (PET) | ||||
| 297 | Characterization of human cytochrome P450 enzymes involved in the metabolism of cyamemazine. Eur J Pharm Sci. 2007 Dec;32(4-5):357-66. | ||||
| 298 | Effect of the gene dosage of CgammaP2C19 on diazepam metabolism in Chinese subjects. Clin Pharmacol Ther. 1999 Dec;66(6):642-6. | ||||
| 299 | Metabolism of JQ1, an inhibitor of bromodomain and extra terminal bromodomain proteins, in human and mouse liver microsomes? | ||||
| 300 | High-performance liquid chromatographic determination of seratrodast and its metabolites in human serum and urine | ||||
| 301 | U. S. FDA Label - Acebutolol | ||||
| 302 | Characterizing novel metabolic pathways of melatonin receptor agonist agomelatine using metabolomic approaches Biochem Pharmacol. 2016 Jun 1;109:70-82. doi: 10.1016/j.bcp.2016.03.020. | ||||
| 303 | Clinical pharmacokinetics of almotriptan, a serotonin 5-HT(1B/1D) receptor agonist for the treatment of migraine. Clin Pharmacokinet. 2005;44(3):237-46. | ||||
| 304 | Effect of ketoconazole on the pharmacokinetic profile of ambrisentan. J Clin Pharmacol. 2009 Jun;49(6):719-24. | ||||
| 305 | Potential for pharmacokinetic interactions between ambrisentan and cyclosporine. Clin Pharmacol Ther. 2010 Oct;88(4):513-20. | ||||
| 306 | CYP2D6 and CYP2C19 genotypes and amitriptyline metabolite ratios in a series of medicolegal autopsies | ||||
| 307 | Amitriptyline Therapy and CYP2D6 and CYP2C19 Genotype | ||||
| 308 | Apixaban. After hip or knee replacement: LMWH remains the standard treatment. Prescrire Int. 2012 Sep;21(130):201-2, 204. | ||||
| 309 | Lack of effect of aprepitant on the pharmacokinetics of docetaxel in cancer patients. Cancer Chemother Pharmacol. 2005 Jun;55(6):609-16. | ||||
| 310 | Genetic toxicology and toxicokinetics of arecoline and related areca nut compounds: an updated review | ||||
| 311 | A simplified procedure for the analysis of formoterol in human urine by liquid chromatography-electrospray tandem mass spectrometry: application to the characterization of the metabolic profile and stability of formoterol in urine | ||||
| 312 | Mass balance and metabolism of [(3)H]Formoterol in healthy men after combined i.v. and oral administration-mimicking inhalation Drug Metab Dispos. 1999 Oct;27(10):1104-16. | ||||
| 313 | Current pharmacogenomic recommendations in chronic respiratory diseases: Is there a biomarker ready for clinical implementation? | ||||
| 314 | Use of a physiologically-based pharmacokinetic model to simulate artemether dose adjustment for overcoming the drug-drug interaction with efavirenz In Silico Pharmacol. 2013 Mar 1;1:4. doi: 10.1186/2193-9616-1-4. | ||||
| 315 | In Vitro Kinetic Characterization of Axitinib Metabolism | ||||
| 316 | The metabolism of berberine and its contribution to the pharmacological effects | ||||
| 317 | LABEL: JUXTAPID- lomitapide mesylate capsule | ||||
| 318 | Glucuronidation as a major metabolic clearance pathway of 14c-labeled muraglitazar in humans: metabolic profiles in subjects with or without bile collection Drug Metab Dispos. 2006 Mar;34(3):427-39. doi: 10.1124/dmd.105.007617. | ||||
| 319 | Metabolic disposition of 14C-bromfenac in healthy male volunteers J Clin Pharmacol. 1998 Aug;38(8):744-52. doi: 10.1002/j.1552-4604.1998.tb04815.x. | ||||
| 320 | Structural elucidation of phase I and II metabolites of bupivacaine in horse urine and fungi of the Cunninghamella species using liquid chromatography/multi-stage mass spectrometry Rapid Commun Mass Spectrom. 2012 Jun 15;26(11):1338-46. doi: 10.1002/rcm.6225. | ||||
| 321 | Abuse Potential of Soma: the GABA(A) Receptor as a Target Mol Cell Pharmacol. 2009 Jan 1;1(4):180-186. | ||||
| 322 | Determination of cilostazol and its metabolites in human urine by high performance liquid chromatography J Pharm Biomed Anal. 2001 Jan;24(3):381-9. doi: 10.1016/s0731-7085(00)00426-x. | ||||
| 323 | Characterization of human cytochrome p450 enzymes involved in the metabolism of cilostazol Drug Metab Dispos. 2007 Oct;35(10):1730-2. doi: 10.1124/dmd.107.016758. | ||||
| 324 | PharmGKB summary: citalopram pharmacokinetics pathway. Pharmacogenet Genomics. 2011 Nov;21(11):769-72. | ||||
| 325 | Analytical methodologies for the enantiodetermination of citalopram and its metabolites | ||||
| 326 | Kinetics and metabolism of clobazam in animals and man | ||||
| 327 | In vitro characterization of clobazam metabolism by recombinant cytochrome P450 enzymes: importance of CYP2C19. Drug Metab Dispos. 2004 Nov;32(11):1279-86. | ||||
| 328 | Pharmacogenomics knowledge for personalized medicine Clin Pharmacol Ther. 2012 Oct;92(4):414-7. doi: 10.1038/clpt.2012.96. | ||||
| 329 | Metabolism of clomipramine in a Japanese psychiatric population: hydroxylation, desmethylation, and glucuronidation | ||||
| 330 | Population pharmacokinetics of clomipramine, desmethylclomipramine, and hydroxylated metabolites in patients with depression receiving chronic treatment: model evaluation | ||||
| 331 | The KEGG resource for deciphering the genome | ||||
| 332 | In vitro characterization and pharmacokinetics of dapagliflozin (BMS-512148), a potent sodium-glucose cotransporter type II inhibitor, in animals and humans Drug Metab Dispos. 2010 Mar;38(3):405-14. doi: 10.1124/dmd.109.029165. | ||||
| 333 | Pharmacogenetic roles of CYP2C19 and CYP2B6 in the metabolism of R- and S-mephobarbital in humans. Pharmacogenetics. 2004 Aug;14(8):549-56. | ||||
| 334 | Absorption, distribution, metabolism and excretion of [14C]dexlansoprazole in healthy male subjects. Clin Drug Investig. 2012 May 1;32(5):319-32. | ||||
| 335 | Study on the Pharmacokinetics of Diazepam and Its Metabolites in Blood of Chinese People Eur J Drug Metab Pharmacokinet. 2020 Aug;45(4):477-485. doi: 10.1007/s13318-020-00614-8. | ||||
| 336 | Pharmacokinetics of Diazepam and Its Metabolites in Urine of Chinese Participants. Drugs R D. 2022 Mar;22(1):43-50. doi: 10.1007/s40268-021-00375-y. | ||||
| 337 | Kinetic disposition of diazepam and its metabolites after intravenous administration of diazepam in the horse: Relevance for doping control. J Vet Pharmacol Ther. 2021 Sep;44(5):733-744. doi: 10.1111/jvp.12991. | ||||
| 338 | DrugBank(Pharmacology-Metabolism)Diazepam | ||||
| 339 | Plasma and synovial fluid concentrations of diclofenac sodium and its major hydroxylated metabolites during long-term treatment of rheumatoid arthritis Eur J Clin Pharmacol. 1983;25(3):389-94. doi: 10.1007/BF01037953. | ||||
| 340 | Simultaneous determination of diclofenac sodium and its hydroxy metabolites by capillary column gas chromatography with electron-capture detection J Chromatogr. 1981 Nov 6;217:263-71. doi: 10.1016/s0021-9673(00)88081-4. | ||||
| 341 | Identification of human cytochrome p450 isozymes involved in diphenhydramine N-demethylation. Drug Metab Dispos. 2007 Jan;35(1):72-8. | ||||
| 342 | Bioconcentration, metabolism and effects of diphenhydramine on behavioral and biochemical markers in crucian carp (Carassius auratus) Sci Total Environ. 2016 Feb 15;544:400-9. doi: 10.1016/j.scitotenv.2015.11.132. | ||||
| 343 | Non-invasive skin sampling detects systemically administered drugs in humans. PLoS One. 2022 Jul 26;17(7):e0271794. doi: 10.1371/journal.pone.0271794. | ||||
| 344 | CYP2C-catalyzed delta9-tetrahydrocannabinol metabolism: kinetics, pharmacogenetics and interaction with phenytoin. Biochem Pharmacol. 2005 Oct 1;70(7):1096-103. | ||||
| 345 | Characterization of human hepatic and extrahepatic UDP-glucuronosyltransferase enzymes involved in the metabolism of classic cannabinoids | ||||
| 346 | Cannabinoid Metabolites as Inhibitors of Major Hepatic CYP450 Enzymes, with Implications for Cannabis-Drug Interactions | ||||
| 347 | #N/A | ||||
| 348 | FDA:Enasidenib | ||||
| 349 | Escitalopram (S-citalopram) and its metabolites in vitro: cytochromes mediating biotransformation, inhibitory effects, and comparison to R-citalopram Drug Metab Dispos. 2001 Aug;29(8):1102-9. | ||||
| 350 | Identification of a novel CYP2C19-mediated metabolic pathway of S-citalopram in vitro Drug Metab Dispos. 2009 Dec;37(12):2340-8. doi: 10.1124/dmd.109.029355. | ||||
| 351 | Expression, activity and regulation of CYP3A in human and rodent brain Drug Metab Rev. 2008;40(1):149-68. doi: 10.1080/03602530701836712. | ||||
| 352 | Pharmacokinetic studies with esomeprazole, the (S)-isomer of omeprazole Clin Pharmacokinet. 2001;40(6):411-26. doi: 10.2165/00003088-200140060-00003. | ||||
| 353 | Characterization of the oxidative metabolites of 17beta-estradiol and estrone formed by 15 selectively expressed human cytochrome p450 isoforms. Endocrinology. 2003 Aug;144(8):3382-98. | ||||
| 354 | Inhibition of the metabolism of etizolam by itraconazole in humans: evidence for the involvement of CYP3A4 in etizolam metabolism. Eur J Clin Pharmacol. 2004 Aug;60(6):427-30. | ||||
| 355 | Clinical pharmacokinetics and pharmacodynamics of etravirine. Clin Pharmacokinet. 2009;48(9):561-74. | ||||
| 356 | LABEL:INREBIC- fedratinib hydrochloride capsule | ||||
| 357 | Felbamate-induced apoptosis of hematopoietic cells is mediated by redox-sensitive and redox-independent pathways Epilepsy Res. 2002 Jan;48(1-2):57-69. doi: 10.1016/s0920-1211(01)00320-5. | ||||
| 358 | U. S. FDA Label -Fenfluramine | ||||
| 359 | LABEL:DDYI- flibanserin tablet, film coated | ||||
| 360 | Flunitrazepam metabolism by cytochrome P450S 2C19 and 3A4. Drug Metab Dispos. 2001 Apr;29(4 Pt 1):460-5. | ||||
| 361 | Flunitrazepam oxidative metabolism in human liver microsomes: involvement of CYP2C19 and CYP3A4. Xenobiotica. 1999 Oct;29(10):973-86. | ||||
| 362 | Lack of interaction of buprenorphine with flunitrazepam metabolism | ||||
| 363 | DrugBank(Pharmacology-Metabolism):Fluoxetine hydrochloride | ||||
| 364 | (R)-, (S)-, and racemic fluoxetine N-demethylation by human cytochrome P450 enzymes. Drug Metab Dispos. 2000 Oct;28(10):1187-91. | ||||
| 365 | Simultaneous identification and quantitation of fluoxetine and its metabolite, norfluoxetine, in biological samples by GC-MS | ||||
| 366 | O-Dealkylation of fluoxetine in relation to CYP2C19 gene dose and involvement of CYP3A4 in human liver microsomes. J Pharmacol Exp Ther. 2002 Jan;300(1):105-11. | ||||
| 367 | Esophageal bezoar due to karaya gum granules used as a laxative | ||||
| 368 | Ganaxolone | ||||
| 369 | Kinetics of glyburide metabolism by hepatic and placental microsomes of human and baboon | ||||
| 370 | Identification of CYP3A7 for glyburide metabolism in human fetal livers. Biochem Pharmacol. 2014 Dec 15;92(4):690-700. | ||||
| 371 | Identification of glyburide metabolites formed by hepatic and placental microsomes of humans and baboons | ||||
| 372 | The metabolism of gliclazide in man | ||||
| 373 | Contribution of cytochrome P450 isoforms to gliquidone metabolism in rats and human | ||||
| 374 | Polymorphism of human cytochrome P450 2D6 and its clinical significance: part II. Clin Pharmacokinet. 2009;48(12):761-804. | ||||
| 375 | DrugBank(Pharmacology-Metabolism):Hydrocodone bitartrate | ||||
| 376 | Role of cytochrome P450 activity in the fate of anticancer agents and in drug resistance: focus on tamoxifen, paclitaxel and imatinib metabolism | ||||
| 377 | Comparative in vitro metabolism of phospho-tyrosol-indomethacin by mice, rats and humans Biochem Pharmacol. 2013 Apr 15;85(8):1195-202. doi: 10.1016/j.bcp.2013.01.031. | ||||
| 378 | PubChem : JNJ-54135419 | ||||
| 379 | Absorption, disposition, metabolic fate and elimination of the anti-epileptic drug lacosamide in humans: mass balance following intravenous and oral administration Eur J Drug Metab Pharmacokinet. 2012 Dec;37(4):241-8. doi: 10.1007/s13318-012-0093-x. | ||||
| 380 | Identification of the human P450 enzymes involved in lansoprazole metabolism. J Pharmacol Exp Ther. 1996 May;277(2):805-16. | ||||
| 381 | The role of levomilnacipran in the management of major depressive disorder: a comprehensive review. Curr Neuropharmacol. 2016;14(2):191-9. | ||||
| 382 | #N/A | ||||
| 383 | Clinical pharmacokinetics and pharmacodynamics of the endothelin receptor antagonist macitentan | ||||
| 384 | In vitro and in vivo pharmacokinetic characterization of mavacamten, a first-in-class small molecule allosteric modulator of beta cardiac myosin | ||||
| 385 | Meperidine and normeperidine levels following meperidine administration during labor. I. Mother | ||||
| 386 | Effects of ethinyl estradiol on pharmacokinetics of meperidine and pentobarbital in the rat | ||||
| 387 | Quantification of mephenytoin and its metabolites 4'-hydroxymephenytoin and nirvanol in human urine using a simple sample processing method | ||||
| 388 | Effects of cytochrome P450 single nucleotide polymorphisms on methadone metabolism and pharmacodynamics | ||||
| 389 | Identification of novel metoclopramide metabolites in humans: in vitro and in vivo studies | ||||
| 390 | Characterization of Ca(2+)-antagonistic effects of three metabolites of the new antihypertensive agent naftopidil, (naphthyl)hydroxy-naftopidil, (phenyl)hydroxy-naftopidil, and O-desmethyl-naftopidil J Cardiovasc Pharmacol. 1991 Dec;18(6):918-25. doi: 10.1097/00005344-199112000-00020. | ||||
| 391 | Effect of CYP2C19 polymorphism on nelfinavir to M8 biotransformation in HIV patients Br J Clin Pharmacol. 2008 Apr;65(4):548-57. doi: 10.1111/j.1365-2125.2007.03039.x. | ||||
| 392 | Nelfinavir and Its Active Metabolite M8 Are Partial Agonists and Competitive Antagonists of the Human Pregnane X Receptor Mol Pharmacol. 2021 Mar;99(3):184-196. doi: 10.1124/molpharm.120.000116. | ||||
| 393 | Absorption, disposition, metabolic fate, and elimination of the dopamine agonist rotigotine in man: administration by intravenous infusion or transdermal delivery | ||||
| 394 | Neutrophil- and myeloperoxidase-mediated metabolism of reduced nimesulide: evidence for bioactivation Chem Res Toxicol. 2010 Nov 15;23(11):1691-700. doi: 10.1021/tx1001496. | ||||
| 395 | Quantitative Modeling Analysis Demonstrates the Impact of CYP2C19 and CYP2D6 Genetic Polymorphisms on the Pharmacokinetics of Amitriptyline and Its Metabolite, Nortriptyline J Clin Pharmacol. 2019 Apr;59(4):532-540. doi: 10.1002/jcph.1344. | ||||
| 396 | DrugBank(Pharmacology-Metabolism)Nortriptyline hydrochloride | ||||
| 397 | The metabolism of the piperazine-type phenothiazine neuroleptic perazine by the human cytochrome P-450 isoenzymes. Eur Neuropsychopharmacol. 2004 May;14(3):199-208. | ||||
| 398 | Anti-Parkinson's disease drugs and pharmacogenetic considerations Expert Opin Drug Metab Toxicol. 2013 Jul;9(7):859-74. doi: 10.1517/17425255.2013.789018. | ||||
| 399 | Validation of enantioseparation and quantitation of an active metabolite of abrocitinib in human plasma | ||||
| 400 | The Pharmacokinetics, Metabolism, and Clearance Mechanisms of Abrocitinib, a Selective Janus Kinase Inhibitor, in Humans | ||||
| 401 | Safety, pharmacokinetics and pharmacodynamics of four-hour intravenous infusions of eritoran in healthy Japanese and Caucasian men | ||||
| 402 | Insights into the mechanisms of action of the MAO inhibitors phenelzine and tranylcypromine: a review J Psychiatry Neurosci. 1992 Nov;17(5):206-14. | ||||
| 403 | DrugBank(Pharmacology-Metabolism)Phenobarbital | ||||
| 404 | Determination of the active and inactive metabolites of prasugrel in human plasma by liquid chromatography/tandem mass spectrometry Rapid Commun Mass Spectrom. 2007;21(2):169-79. doi: 10.1002/rcm.2813. | ||||
| 405 | Interactions of fentanyl with blood platelets and plasma proteins: platelet sensitivity to prasugrel metabolite is not affected by fentanyl under in vitro conditions. Pharmacol Rep. 2023 Apr;75(2):423-441. doi: 10.1007/s43440-023-00447-7. | ||||
| 406 | Pharmacokinetic and Pharmacodynamic Modeling and Simulation Analysis of Prasugrel in Healthy Male Volunteers. Clin Pharmacol Drug Dev. 2023 Jan;12(1):21-29. doi: 10.1002/cpdd.1172. | ||||
| 407 | Metabolic profile of oxazepam and related benzodiazepines: clinical and forensic aspects. Drug Metab Rev. 2017 Nov;49(4):451-463. | ||||
| 408 | Prazepam metabolism by man Clin Pharmacol Ther. 1970 Nov-Dec;11(6):890-7. doi: 10.1002/cpt1970116890. | ||||
| 409 | Prazepam metabolites in dog urine J Pharm Sci. 1970 Mar;59(3):322-5. doi: 10.1002/jps.2600590309. | ||||
| 410 | In vitro and in vivo human metabolism and pharmacokinetics of S- and R-praziquantel Pharmacol Res Perspect. 2020 Aug;8(4):e00618. doi: 10.1002/prp2.618. | ||||
| 411 | Biotransformation of praziquantel by human cytochrome p450 3A4 (CYP 3A4). Acta Pol Pharm. 2006 Sep-Oct;63(5):381-5. | ||||
| 412 | Physiologically based pharmacokinetics model of primidone and its metabolites phenobarbital and phenylethylmalonamide in humans, rats, and mice Drug Metab Dispos. 1998 Jun;26(6):585-94. | ||||
| 413 | Blood and cerebrospinal fluid pharmacokinetics of primidone and its primary pharmacologically active metabolites, phenobarbital and phenylethylmalonamide in the rat Eur J Drug Metab Pharmacokinet. 1999 Jul-Sep;24(3):255-64. doi: 10.1007/BF03190029. | ||||
| 414 | Managing the Drug-Drug Interaction With Apixaban and Primidone: A Case Report. Hosp Pharm. 2023 Aug;58(4):345-349. doi: 10.1177/00185787221150928. | ||||
| 415 | Ticagrelor and primidone interaction masquerading as dual antiplatelet therapy noncompliance. Future Cardiol. 2023 Jun 14. doi: 10.2217/fca-2023-0011. | ||||
| 416 | Simultaneous determination of prochlorperazine and its metabolites in human plasma using isocratic liquid chromatography tandem mass spectrometry Biomed Chromatogr. 2012 Jun;26(6):754-60. doi: 10.1002/bmc.1725. | ||||
| 417 | Bioavailability and metabolism of prochlorperazine administered via the buccal and oral delivery route J Clin Pharmacol. 2005 Dec;45(12):1383-90. doi: 10.1177/0091270005281044. | ||||
| 418 | In vitro proguanil activation to cycloguanil is mediated by CYP2C19 and CYP3A4 in adult Chinese liver microsomes. Acta Pharmacol Sin. 2000 Aug;21(8):747-52. | ||||
| 419 | Sensitive method for the quantitative determination of proguanil and its metabolites in rat blood and plasma by liquid chromatography-mass spectrometry | ||||
| 420 | Single dose pharmacokinetics of proguanil and its metabolites in pregnancy | ||||
| 421 | FDA label:Belzutifan | ||||
| 422 | CYP450 phenotyping and metabolite identification of quinine by accurate mass UPLC-MS analysis: a possible metabolic link to blackwater fever | ||||
| 423 | Determination of rabeprazole enantiomers and their metabolites by high-performance liquid chromatography with solid-phase extraction | ||||
| 424 | Biotransformation of moclobemide in humans | ||||
| 425 | Simultaneous Determination of Rosuvastatin, Rosuvastatin-5?S-lactone, and N-desmethyl Rosuvastatin in Human Plasma by UPLC-MS/MS and Its Application to Clinical Study | ||||
| 426 | Effects of ketoconazole treatment on the pharmacokinetics of safinamide and its plasma metabolites in healthy adult subjects | ||||
| 427 | A Phase 1 Study to Evaluate Absolute Bioavailability and Absorption, Distribution, Metabolism, and Excretion of Savolitinib in Healthy Male Volunteers | ||||
| 428 | DrugBank(Pharmacology-Metabolism)Sertraline hydrochloride | ||||
| 429 | Sertraline is metabolized by multiple cytochrome P450 enzymes, monoamine oxidases, and glucuronyl transferases in human: an in vitro study. Drug Metab Dispos. 2005 Feb;33(2):262-70. | ||||
| 430 | Pharmacogenetic Testing and Therapeutic Drug Monitoring Of Sertraline at a Residential Treatment Center for Children and Adolescents: A Pilot Study. Innov Pharm. 2022 Dec 26;13(4):10.24926/iip.v13i4.5035. doi: 10.24926/iip.v13i4.5035. | ||||
| 431 | Sertraline. 2022 May 15. Drugs and Lactation Database (LactMed?) [Internet]. Bethesda (MD): National Institute of Child Health and Human Development; 2006C. | ||||
| 432 | Neonicotinoids and pharmaceuticals in hair of the Red fox (Vulpes vulpes) from the Cavallino-Treporti peninsula, Italy. Environ Res. 2023 Jul 1;228:115837. doi: 10.1016/j.envres.2023.115837. | ||||
| 433 | The contributions of cytochromes P450 3A4 and 3A5 to the metabolism of the phosphodiesterase type 5 inhibitors sildenafil, udenafil, and vardenafil. Drug Metab Dispos. 2008 Jun;36(6):986-90. | ||||
| 434 | Pharmacokinetics of sildenafil after single oral doses in healthy male subjects: absolute bioavailability, food effects and dose proportionality. Br J Clin Pharmacol. 2002;53 Suppl 1(Suppl 1):5S-12S. doi: 10.1046/j.0306-5251.2001.00027.x. | ||||
| 435 | Erectile dysfunction drugs changed the protein expressions and activities of drug-metabolising enzymes in the liver of male rats. Oxid Med Cell Longev. 2016;2016:4970906. | ||||
| 436 | Pharmacokinetics of stiripentol in normal man: evidence of nonlinearity | ||||
| 437 | Suvorexant: a promising, novel treatment for insomnia. Neuropsychiatr Dis Treat. 2016 Feb 25;12:491-5. | ||||
| 438 | CYP450-Mediated metabolism of suvorexant and investigation of metabolites in forensic case specimens Forensic Sci Int. 2020 Jul;312:110307. doi: 10.1016/j.forsciint.2020.110307. | ||||
| 439 | In vitro and in vivo characterisation of the metabolism and disposition of suvorexant in humans Xenobiotica. 2016 Oct;46(10):882-95. doi: 10.3109/00498254.2015.1129565. | ||||
| 440 | Metabolism of tamoxifen by recombinant human cytochrome P450 enzymes: formation of the 4-hydroxy, 4'-hydroxy and N-desmethyl metabolites and isomerization of trans-4-hydroxytamoxifen. Drug Metab Dispos. 2002 Aug;30(8):869-74. | ||||
| 441 | Endoxifen and other metabolites of tamoxifen inhibit human hydroxysteroid sulfotransferase 2A1 (hSULT2A1). Drug Metab Dispos. 2014 Nov;42(11):1843-50. | ||||
| 442 | Metabolism and transport of tamoxifen in relation to its effectiveness: new perspectives on an ongoing controversy. Future Oncol. 2014 Jan;10(1):107-22. | ||||
| 443 | Identification and biological activity of tamoxifen metabolites in human serum Biochem Pharmacol. 1983 Jul 1;32(13):2045-52. doi: 10.1016/0006-2952(83)90425-2. | ||||
| 444 | PharmGKB summary: tamoxifen pathway, pharmacokinetics Pharmacogenet Genomics. 2013 Nov;23(11):643-7. doi: 10.1097/FPC.0b013e3283656bc1. | ||||
| 445 | The tamoxifen dilemma. Carcinogenesis. 1999 Jul;20(7):1153-60. | ||||
| 446 | Investigations into the drug-drug interaction potential of tapentadol in human liver microsomes and fresh human hepatocytes. Drug Metab Lett. 2008 Jan;2(1):67-75. | ||||
| 447 | LABEL:UCYNTA- tapentadol hydrochloride tablet, film coated | ||||
| 448 | Clinical assessment of drug-drug interactions of tasimelteon, a novel dual melatonin receptor agonist. J Clin Pharmacol. 2015 Sep;55(9):1004-11. | ||||
| 449 | Pharmacokinetics and metabolism of temazepam in man and several animal species Br J Clin Pharmacol. 1979;8(1):23S-29S. doi: 10.1111/j.1365-2125.1979.tb00451.x. | ||||
| 450 | Sigmoidal kinetic model for two co-operative substrate-binding sites in a cytochrome P450 3A4 active site: an example of the metabolism of diazepam and its derivatives. Biochem J. 1999 Jun 15;340 ( Pt 3):845-53. | ||||
| 451 | Drug Interactions Flockhart Table:Docetaxel | ||||
| 452 | A multi-residue chiral liquid chromatography coupled with tandem mass spectrometry method for analysis of antifungal agents and their metabolites in aqueous environmental matrices. Anal Methods. 2021 Jun 14;13(22):2466-2477. doi: 10.1039/d1ay00556a. | ||||
| 453 | Thalidomide metabolism and hydrolysis: mechanisms and implications | ||||
| 454 | Contribution of CYP2C19 and CYP3A4 to the formation of the active nortilidine from the prodrug tilidine | ||||
| 455 | Timolol metabolism in human liver microsomes is mediated principally by CYP2D6. Drug Metab Dispos. 2007 Jul;35(7):1135-41. | ||||
| 456 | Metabolism-mediated drug interactions associated with ritonavir-boosted tipranavir in mice. Drug Metab Dispos. 2010 May;38(5):871-8. | ||||
| 457 | Total determination of triclabendazole and its metabolites in bovine tissues using liquid chromatography-tandem mass spectrometry J Chromatogr B Analyt Technol Biomed Life Sci. 2019 Mar 1;1109:54-59. doi: 10.1016/j.jchromb.2019.01.021. | ||||
| 458 | Egaten FDA label | ||||
| 459 | Venlafaxine oxidation in vitro is catalysed by CYP2D6. Br J Clin Pharmacol. 1996 Feb;41(2):149-56. | ||||
| 460 | Comparison of the pharmacokinetics of venlafaxine extended release and desvenlafaxine in extensive and poor cytochrome P450 2D6 metabolizers | ||||
| 461 | Accidental intoxications in toddlers: lack of cross-reactivity of vilazodone and its urinary metabolite M17 with drug of abuse screening immunoassays | ||||
| 462 | DETERMINATION OF VENLAFAXINE, VILAZODONE AND THEIR MAIN ACTIVE METABOLITES IN HUMAN SERUM BY HPLC-DAD AND HPLC-MS | ||||
| 463 | Assessments of CYP?inhibition?based drug-drug interaction between vonoprazan and poziotinib in?vitro and in?vivo | ||||
| 464 | Vonoprazan fumarate, a novel potassium-competitive acid blocker, in the management of gastroesophageal reflux disease: safety and clinical evidence to date | ||||
| 465 | The disposition of voriconazole in mouse, rat, rabbit, guinea pig, dog, and human | ||||
| 466 | Roles of CYP3A4 and CYP2C19 in methyl hydroxylated and N-oxidized metabolite formation from voriconazole, a new anti-fungal agent, in human liver microsomes. Biochem Pharmacol. 2007 Jun 15;73(12):2020-6. | ||||
| 467 | FDA Approved Drug Products:Oxbryta (voxelotor) tablets | ||||
| 468 | Comparative pharmacokinetics of vitamin K antagonists: warfarin, phenprocoumon and acenocoumarol. Clin Pharmacokinet. 2005;44(12):1227-46. | ||||
| 469 | BioTransformer: a comprehensive computational tool for small molecule metabolism prediction and metabolite identification | ||||
| 470 | Metabolism and pharmacokinetics of the combination Zidovudine plus Lamivudine in the adult Erythrocebus patas monkey determined by liquid chromatography-tandem mass spectrometric analysis | ||||
| 471 | Zolpidem urine excretion profiles and cross-reactivity with ELISA(?) kits in subjects using Zolpidem or Ambien(?) CR as a prescription sleep aid | ||||
| 472 | Norzotepine, a major metabolite of zotepine, exerts atypical antipsychotic-like and antidepressant-like actions through its potent inhibition of norepinephrine reuptake | ||||
If you find any error in data or bug in web service, please kindly report it to Dr. Yin and Dr. Li.

