Details of Drug-Metabolizing Enzyme (DME)
| Full List of Drug(s) Metabolized by This DME | |||||
|---|---|---|---|---|---|
| Drugs Approved by FDA | Click to Show/Hide the Full List of Drugs: 223 Drugs | ||||
Thalidomide |
Drug Info | Approved | Breast cancer | ICD11: 2C60 | [1] |
Bupropion |
Drug Info | Approved | Nicotine dependence | ICD11: 6C4A | [2] |
Tamoxifen citrate |
Drug Info | Approved | Breast cancer | ICD11: 2C60 | [3] |
Yn-968D1 |
Drug Info | Approved | Breast cancer | ICD11: 2C60-2C6Y | [4] |
Alosetron hydrochloride |
Drug Info | Approved | Irritable bowel syndrome | ICD11: DD91 | [5] |
Idelalisib |
Drug Info | Approved | Chronic lymphocytic leukaemia | ICD11: 2A82 | [6] |
Warfarin sodium |
Drug Info | Approved | Atrial fibrillation | ICD11: BC81 | [7] |
Estradiol acetate |
Drug Info | Approved | Acquired prion disease | ICD11: 8E01 | [8] |
Estradiol cypionate |
Drug Info | Approved | Acquired prion disease | ICD11: 8E01 | [8] |
Estradiol valerate |
Drug Info | Approved | Acquired prion disease | ICD11: 8E01 | [8] |
Estrone |
Drug Info | Approved | Menopausal disorder | ICD11: GA30 | [8] |
Nicotine |
Drug Info | Approved | Nicotine dependence | ICD11: 6C4A | [9] |
Atazanavir |
Drug Info | Approved | Human immunodeficiency virus infection | ICD11: 1C60 | [10] |
Nabumetone |
Drug Info | Approved | Rheumatoid arthritis | ICD11: FA20 | [11] |
Dronabinol |
Drug Info | Approved | Anorexia nervosa | ICD11: 6B80 | [12] |
Bortezomib |
Drug Info | Approved | Breast cancer | ICD11: 2C60 | [13] |
Diclofenac sodium |
Drug Info | Approved | Osteoarthritis | ICD11: FA00 | [14] |
Fospropofol disodium |
Drug Info | Approved | Monitored anaesthesia care | ICD11: N.A. | [15] |
Montelukast sodium |
Drug Info | Approved | Asthma | ICD11: CA23 | [16] |
Progesterone |
Drug Info | Approved | Premature labour | ICD11: JB00 | [17] |
Rosiglitazone |
Drug Info | Approved | Diabetes mellitus | ICD11: 5A10 | [18] |
Rosiglitazone |
Drug Info | Approved | Diabetes mellitus | ICD11: 5A10 | [19] |
Rosiglitazone |
Drug Info | Approved | Diabetes mellitus | ICD11: 5A10 | [20] |
Imatinib mesylate |
Drug Info | Approved | Chronic myelogenous leukaemia | ICD11: 2A20 | [21] |
Lidocaine |
Drug Info | Approved | Anaesthesia | ICD11: 8E22 | [22] |
Metronidazole |
Drug Info | Approved | Amebiasis | ICD11: 1A36 | [22] |
Valdecoxib |
Drug Info | Approved | Osteoarthritis | ICD11: FA00 | [23] |
Brivaracetam |
Drug Info | Approved | Focal seizure | ICD11: 8A68 | [24] |
Cannabidiol |
Drug Info | Approved | Lennox-Gastaut syndrome | ICD11: 8A62 | [25] |
Capsaicin |
Drug Info | Approved | Herpes zoster | ICD11: 1E91 | [26] |
Doxazosin |
Drug Info | Approved | Essential hypertension | ICD11: BA00 | [27] |
Ethinyl estradiol |
Drug Info | Approved | Menopausal disorder | ICD11: GA30 | [28] |
Ifosfamide |
Drug Info | Approved | Lung cancer | ICD11: 2C25 | [29] |
Irbesartan |
Drug Info | Approved | Essential hypertension | ICD11: BA00 | [30] |
Lapatinib ditosylate |
Drug Info | Approved | Breast cancer | ICD11: 2C60 | [31] |
Pitavastatin |
Drug Info | Approved | Hypertriglyceridaemia | ICD11: 5C80 | [32] |
Pitavastatin |
Drug Info | Approved | Hypertriglyceridaemia | ICD11: 5C80 | [33], [34] |
Siponimod |
Drug Info | Approved | Multiple sclerosis | ICD11: 8A40 | [35] |
Terbinafine hydrochloride |
Drug Info | Approved | Pityriasis versicolor | ICD11: 1F2D | [36] |
Tretinoin |
Drug Info | Approved | Acne vulgaris | ICD11: ED80 | [22] |
Valproic acid |
Drug Info | Approved | Epilepsy | ICD11: 8A60 | [37] |
Duloxetine hydrochloride |
Drug Info | Approved | Depression | ICD11: 6A71 | [38] |
Enzalutamide |
Drug Info | Approved | Prostate cancer | ICD11: 2C82 | [39] |
Febuxostat |
Drug Info | Approved | Hyperuricaemia | ICD11: 5C55 | [40] |
Norethindrone |
Drug Info | Approved | Solid tumour/cancer | ICD11: 2A00-2F9Z | [41] |
Pioglitazone hydrochloride |
Drug Info | Approved | Diabetes mellitus | ICD11: 5A10 | [42] |
Pravastatin |
Drug Info | Approved | Dyslipidaemia | ICD11: 5C81 | [43] |
Trabectedin |
Drug Info | Approved | Leiomyosarcoma | ICD11: 2B58 | [44] |
Dopamine hydrochloride |
Drug Info | Approved | Parkinsonism | ICD11: 8A00 | [45] |
Halothane |
Drug Info | Approved | Anaesthesia | ICD11: 8E22 | [46] |
Ketamine |
Drug Info | Approved | Anaesthesia | ICD11: 8E22 | [47] |
Ketorolac |
Drug Info | Approved | Rheumatoid arthritis | ICD11: FA20 | [48] |
Quinine sulfate |
Drug Info | Approved | Malaria | ICD11: 1F40 | [49] |
Suprofen |
Drug Info | Approved | Iris sphincter disorder | ICD11: 9B01 | [50] |
Alitretinoin |
Drug Info | Approved | Kaposi sarcoma | ICD11: 2B57 | [51] |
Caffeine |
Drug Info | Approved | Orthostatic hypotension | ICD11: BA21 | [52] |
Carvedilol |
Drug Info | Approved | Congestive heart failure | ICD11: BD10 | [53] |
Cisapride |
Drug Info | Approved | Gastro-oesophageal reflux disease | ICD11: DA22 | [54] |
Dextromethorphan hydrobromide |
Drug Info | Approved | Atherosclerosis | ICD11: BA80 | [55] |
Diazepam |
Drug Info | Approved | Epilepsy | ICD11: 8A60 | [56] |
Doxepin hydrochloride |
Drug Info | Approved | Depression | ICD11: 6A71 | [57] |
Formoterol |
Drug Info | Approved | Asthma | ICD11: CA23 | [58] |
Haloperidol decanoate |
Drug Info | Approved | Agitation/aggression | ICD11: 6D86 | [59] |
Ketoprofen |
Drug Info | Approved | Anaesthesia | ICD11: 8E22 | [60] |
Lansoprazole |
Drug Info | Approved | Duodenal ulcer | ICD11: DA63 | [36] |
Levonorgestrel |
Drug Info | Approved | Menorrhagia | ICD11: GA20 | [61] |
Macitentan |
Drug Info | Approved | Pulmonary hypertension | ICD11: BB01 | [62] |
Naproxen |
Drug Info | Approved | Rheumatoid arthritis | ICD11: FA20 | [63] |
Nateglinide |
Drug Info | Approved | Diabetes mellitus | ICD11: 5A10 | [64] |
Nevirapine |
Drug Info | Approved | Human immunodeficiency virus infection | ICD11: 1C60 | [65] |
Ondansetron |
Drug Info | Approved | Gastritis | ICD11: DA42 | [22] |
Phenylbutazone |
Drug Info | Approved | Anaesthesia | ICD11: 8E22 | [66] |
Rofecoxib |
Drug Info | Approved | Rheumatoid arthritis | ICD11: FA20 | [67] |
Trimethoprim |
Drug Info | Approved | Infectious cystitis | ICD11: GC00 | [68] |
Verapamil hydrochloride |
Drug Info | Approved | Essential hypertension | ICD11: BA00 | [69] |
Amitriptyline hydrochloride |
Drug Info | Approved | Depression | ICD11: 6A71 | [70] |
Amprenavir |
Drug Info | Approved | Human immunodeficiency virus infection | ICD11: 1C60 | [71] |
Artemether |
Drug Info | Approved | Malaria | ICD11: 1F40 | [72] |
Avanafil |
Drug Info | Approved | Erectile dysfunction | ICD11: HA01 | [73] |
Belinostat |
Drug Info | Approved | Anaplastic large cell lymphoma | ICD11: 2A90 | [74] |
Bromfenac |
Drug Info | Approved | Cataract | ICD11: 9B10 | [75] |
Cyclophosphamide |
Drug Info | Approved | Multiple myeloma | ICD11: 2A83 | [29] |
Diltiazem hydrochloride |
Drug Info | Approved | Essential hypertension | ICD11: BA00 | [69] |
Donepezil hydrochloride |
Drug Info | Approved | Alzheimer disease | ICD11: 8A20 | [76] |
Erdafitinib |
Drug Info | Approved | Renal cell carcinoma | ICD11: 2C90 | [77] |
Etodolac |
Drug Info | Approved | Rheumatoid arthritis | ICD11: FA20 | [78] |
Fluoxetine hydrochloride |
Drug Info | Approved | Depression | ICD11: 6A71 | [79] |
Fluvastatin sodium |
Drug Info | Approved | Hypertriglyceridaemia | ICD11: 5C80 | [80] |
Histamine |
Drug Info | Approved | Allergy | ICD11: 4A80 | [10] |
Ibuprofen |
Drug Info | Approved | Anaesthesia | ICD11: 8E22 | [22] |
Indomethacin |
Drug Info | Approved | Rheumatoid arthritis | ICD11: FA20 | [36] |
Isotretinoin |
Drug Info | Approved | Acne vulgaris | ICD11: ED80 | [81] |
Istradefylline |
Drug Info | Approved | Parkinsonism | ICD11: 8A00 | [82] |
Leflunomide |
Drug Info | Approved | Rheumatoid arthritis | ICD11: FA20 | [83] |
Lesinurad |
Drug Info | Approved | Uncontrolled gout | ICD11: FA25 | [84] |
Oxaprozin |
Drug Info | Approved | Rheumatoid arthritis | ICD11: FA20 | [85] |
Phenytoin |
Drug Info | Approved | Epilepsy | ICD11: 8A60 | [86] |
Promazine |
Drug Info | Approved | Schizophrenia | ICD11: 6A20 | [87] |
Quinidine |
Drug Info | Approved | Ventricular tachyarrhythmia | ICD11: BC71 | [88] |
Simvastatin |
Drug Info | Approved | Dyslipidaemia | ICD11: 5C81 | [89] |
Tapentadol |
Drug Info | Approved | Neuropathic pain | ICD11: 8E43 | [90] |
Vismodegib |
Drug Info | Approved | Melanoma | ICD11: 2C30 | [91] |
Zileuton |
Drug Info | Approved | Asthma | ICD11: CA23 | [92] |
Zolpidem tartrate |
Drug Info | Approved | Insomnia | ICD11: 7A00 | [93] |
Amiodarone hydrochloride |
Drug Info | Approved | Ventricular tachyarrhythmia | ICD11: BC71 | [36] |
Aspirin |
Drug Info | Approved | Myocardial infarction | ICD11: BA41 | [94] |
Azelastine |
Drug Info | Approved | Allergic rhinitis | ICD11: CA08 | [95] |
Buprenorphine hydrochloride |
Drug Info | Approved | Anaesthesia | ICD11: 8E22 | [36] |
Cabozantinib |
Drug Info | Approved | Thyroid cancer | ICD11: 2D10 | [96] |
Chlorpropamide |
Drug Info | Approved | Diabetes mellitus | ICD11: 5A10 | [97] |
Clozapine |
Drug Info | Approved | Schizophrenia | ICD11: 6A20 | [98] |
Diphenhydramine |
Drug Info | Approved | Meniere disease | ICD11: AB31 | [99] |
Dolasetron mesylate |
Drug Info | Approved | Functional nausea/vomiting | ICD11: DD90 | [22] |
Eszopiclone |
Drug Info | Approved | Insomnia | ICD11: 7A00 | [87] |
Etravirine |
Drug Info | Approved | Human immunodeficiency virus infection | ICD11: 1C60 | [100] |
Fosphenytoin sodium |
Drug Info | Approved | Epilepsy | ICD11: 8A60 | [36] |
Glipizide |
Drug Info | Approved | Diabetes mellitus | ICD11: 5A10 | [101] |
Mirtazapine |
Drug Info | Approved | Depression | ICD11: 6A71 | [22] |
Nalbuphine |
Drug Info | Approved | Pain | ICD11: MG30-MG3Z | [102] |
Omeprazole |
Drug Info | Approved | Gastro-oesophageal reflux disease | ICD11: DA22 | [103] |
Ospemifene |
Drug Info | Approved | Dyspareunia | ICD11: GA12 | [104] |
Pentobarbital |
Drug Info | Approved | Insomnia | ICD11: 7A00 | [105] |
Perphenazine |
Drug Info | Approved | Schizophrenia | ICD11: 6A20 | [106] |
Phenprocoumon |
Drug Info | Approved | Thrombosis | ICD11: DB61 | [107] |
Propofol |
Drug Info | Approved | Anaesthesia | ICD11: 8E22 | [108] |
Sulfamethoxazole |
Drug Info | Approved | Infectious cystitis | ICD11: GC00 | [109] |
Tasimelteon |
Drug Info | Approved | Insomnia | ICD11: 7A00 | [110] |
Testosterone undecanoate |
Drug Info | Approved | Hypogonadism | ICD11: 5A61 | [111] |
Tolazamide |
Drug Info | Approved | Diabetes mellitus | ICD11: 5A10 | [112] |
Torasemide |
Drug Info | Approved | Congestive heart failure | ICD11: BD10 | [36] |
Treprostinil |
Drug Info | Approved | Pulmonary hypertension | ICD11: BB01 | [113] |
Venlafaxine hydrochloride |
Drug Info | Approved | Depression | ICD11: 6A71 | [114] |
Vortioxetine hydrobromide |
Drug Info | Approved | Depression | ICD11: 6A71 | [115] |
Zafirlukast |
Drug Info | Approved | Asthma | ICD11: CA23 | [116] |
Acetaminophen |
Drug Info | Approved | Anaesthesia | ICD11: 8E22 | [22] |
Acetohexamide |
Drug Info | Approved | Diabetes mellitus | ICD11: 5A10 | [112] |
Alprazolam |
Drug Info | Approved | Anxiety disorder | ICD11: 6B00 | [36] |
Apixaban |
Drug Info | Approved | Deep vein thrombosis | ICD11: BD71 | [117] |
Avapritinib |
Drug Info | Approved | Gastrointestinal stromal tumour | ICD11: 2B5B | [118] |
Avapritinib |
Drug Info | Approved | Gastrointestinal stromal tumour | ICD11: 2B5B | [119] |
Binimetinib |
Drug Info | Approved | Melanoma | ICD11: 2C30 | [120] |
Candesartan cilexetil |
Drug Info | Approved | Essential hypertension | ICD11: BA00 | [121] |
Dapagliflozin |
Drug Info | Approved | Diabetes mellitus | ICD11: 5A10 | [122] |
Dicumarol |
Drug Info | Approved | Menorrhagia | ICD11: GA20 | [123] |
Levomethadyl acetate hydrochloride |
Drug Info | Approved | Opiate dependence | ICD11: 6C43 | [124] |
Losartan potassium |
Drug Info | Approved | Essential hypertension | ICD11: BA00 | [36] |
Lovastatin |
Drug Info | Approved | Hypertriglyceridaemia | ICD11: 5C80 | [125] |
Methadone |
Drug Info | Approved | Anaesthesia | ICD11: 8E22 | [126] |
Phenobarbital |
Drug Info | Approved | Epilepsy | ICD11: 8A60 | [127] |
Piroxicam |
Drug Info | Approved | Anaesthesia | ICD11: 8E22 | [128] |
Pitavastatin calcium |
Drug Info | Approved | Hypertriglyceridaemia | ICD11: 5C80 | [129] |
Ruxolitinib |
Drug Info | Approved | Chronic myelogenous leukaemia | ICD11: 2A20 | [130] |
Ruxolitinib |
Drug Info | Approved | Chronic myelogenous leukaemia | ICD11: 2A20 | [131] |
Ruxolitinib phosphate |
Drug Info | Approved | Myelofibrosis | ICD11: 2A22 | [130] |
Sulfadiazine |
Drug Info | Approved | Toxoplasmosis | ICD11: 1F57 | [132] |
Tapinarof |
Drug Info | Approved | Discovery agent | ICD: N.A. | [133] |
Timolol maleate |
Drug Info | Approved | Essential hypertension | ICD11: BA00 | [134] |
Tolbutamide |
Drug Info | Approved | Diabetes mellitus | ICD11: 5A10 | [135] |
Tolterodine tartrate |
Drug Info | Approved | Overactive bladder | ICD11: GC50 | [136] |
Troglitazone |
Drug Info | Approved | Diabetes mellitus | ICD11: 5A10 | [137] |
Voriconazole |
Drug Info | Approved | Candidiasis | ICD11: 1F23 | [138] |
Zidovudine |
Drug Info | Approved | Human immunodeficiency virus infection | ICD11: 1C60 | [22] |
Azilsartan |
Drug Info | Approved | Hypertension | ICD11: BA00-BA04 | [139] |
Azilsartan |
Drug Info | Approved | Hypertension | ICD11: BA00-BA04 | [140], [141] |
Azilsartan medoxomil |
Drug Info | Approved | Essential hypertension | ICD11: BA00 | [142] |
Bosentan |
Drug Info | Approved | Pulmonary hypertension | ICD11: BB01 | [143] |
Celecoxib |
Drug Info | Approved | Rheumatoid arthritis | ICD11: FA20 | [63] |
Clofibrate |
Drug Info | Approved | Hypertriglyceridaemia | ICD11: 5C80 | [144] |
Clopidogrel bisulfate |
Drug Info | Approved | Acute coronary syndrome | ICD11: BA4Z | [145] |
Dapsone |
Drug Info | Approved | Pneumocystis pneumonia | ICD11: CA40 | [146] |
Eletriptan hydrobromide |
Drug Info | Approved | Migraine | ICD11: 8A80 | [147] |
Epoprostenol |
Drug Info | Approved | Pulmonary hypertension | ICD11: BB01 | [148] |
Fenoprofen |
Drug Info | Approved | Rheumatoid arthritis | ICD11: FA20 | [149] |
Fenoprofen |
Drug Info | Approved | Rheumatoid arthritis | ICD11: FA20 | [150] |
Flibanserin |
Drug Info | Approved | Inhibited sexual desire | ICD11: HA00 | [151] |
Fluconazole |
Drug Info | Approved | Candidiasis | ICD11: 1F23 | [152] |
Flurbiprofen sodium |
Drug Info | Approved | Rheumatoid arthritis | ICD11: FA20 | [153] |
Hydromorphone |
Drug Info | Approved | Anaesthesia | ICD11: 8E22 | [154] |
Iclaprim |
Drug Info | Approved | Methicillin-resistant staphylococcus infection | ICD11: 1D01 | [155] |
Lacosamide |
Drug Info | Approved | Epilepsy | ICD11: 8A60 | [156] |
Loratadine |
Drug Info | Approved | Allergic rhinitis | ICD11: CA08 | [157] |
Mefenamic acid |
Drug Info | Approved | Female pelvic pain | ICD11: GA34 | [158] |
Mephenytoin |
Drug Info | Approved | Epilepsy | ICD11: 8A60 | [159] |
Niclosamide |
Drug Info | Approved | Tapeworm infestation | ICD11: 1F7Y | [160] |
Prasugrel hydrochloride |
Drug Info | Approved | Acute coronary syndrome | ICD11: BA4Z | [161] |
Primidone |
Drug Info | Approved | Epilepsy | ICD11: 8A60 | [162] |
Quazepam |
Drug Info | Approved | Insomnia | ICD11: 7A00 | [163] |
Rosuvastatin |
Drug Info | Approved | Hypertriglyceridaemia | ICD11: 5C80 | [164] |
Selegiline hydrochloride |
Drug Info | Approved | Parkinsonism | ICD11: 8A00 | [22] |
Sertraline hydrochloride |
Drug Info | Approved | Depression | ICD11: 6A71 | [165] |
Sildenafil citrate |
Drug Info | Approved | Erectile dysfunction | ICD11: HA01 | [36] |
Temazepam |
Drug Info | Approved | Insomnia | ICD11: 7A00 | [166] |
Triclabendazole |
Drug Info | Approved | Fascioliasis | ICD11: 1F82 | [167] |
Trimipramine |
Drug Info | Approved | Depression | ICD11: 6A71 | [168] |
Voxelotor |
Drug Info | Approved | Sickle-cell anaemia | ICD11: 3A51 | [169] |
Ampiroxicam |
Drug Info | Approved | Inflammation | ICD11: 1A00-CA43 | [170] |
Bexarotene |
Drug Info | Approved | Anaplastic large cell lymphoma | ICD11: 2A90 | [22] |
Dacomitinib |
Drug Info | Approved | Lung cancer | ICD11: 2C25 | [171] |
Dorzolamide hydrochloride |
Drug Info | Approved | Glaucoma | ICD11: 9C61 | [22] |
Enasidenib |
Drug Info | Approved | Acute myeloid leukaemia | ICD11: 2A60 | [172] |
Glimepiride |
Drug Info | Approved | Diabetes mellitus | ICD11: 5A10 | [173] |
Idarubicin |
Drug Info | Approved | Acute myeloid leukaemia | ICD11: 2A60 | [174] |
Meloxicam |
Drug Info | Approved | Osteoarthritis | ICD11: FA00 | [22] |
Nortriptyline hydrochloride |
Drug Info | Approved | Depression | ICD11: 6A71 | [36] |
Olodaterol hydrochloride |
Drug Info | Approved | Chronic obstructive pulmonary disease | ICD11: CA22 | [175] |
Paramethadione |
Drug Info | Approved | Embryofetopathy | ICD11: LD2F | [176] |
Rifampicin |
Drug Info | Approved | Osteoporosis | ICD11: FB83 | [36] |
Rimegepant |
Drug Info | Approved | Migraine | ICD11: 8A80 | [177] |
Rimegepant |
Drug Info | Approved | Migraine | ICD11: 8A80 | [178] |
Sevoflurane |
Drug Info | Approved | Anaesthesia | ICD11: 8E22 | [179] |
Testosterone cypionate |
Drug Info | Approved | Testosterone deficiency | ICD11: 5A81 | [111] |
Testosterone enanthate |
Drug Info | Approved | Testosterone deficiency | ICD11: 5A81 | [111] |
Trimethadione |
Drug Info | Approved | Epilepsy | ICD11: 8A60 | [180] |
Valsartan |
Drug Info | Approved | Essential hypertension | ICD11: BA00 | [181] |
Zalcitabine |
Drug Info | Approved | Human immunodeficiency virus infection | ICD11: 1C60 | [182] |
Avatrombopag maleate |
Drug Info | Approved | Thrombocytopenia | ICD11: 3B64 | [183] |
Methoxyflurane |
Drug Info | Approved | Anaesthesia | ICD11: 8E22 | [184] |
Nabilone |
Drug Info | Approved | Insomnia | ICD11: 7A00-7A0Z | [185] |
Testosterone |
Drug Info | Approved | Osteoporosis | ICD11: FB83 | [186] |
Trifarotene |
Drug Info | Approved | Acne vulgaris | ICD11: ED80 | [187] |
Umbralisib |
Drug Info | Approved | Follicular lymphoma | ICD11: 2A80 | [188] |
LAROPIPRANT |
Drug Info | Phase 4 | Atherosclerosis | ICD11: BA80 | [197] |
Neupro |
Drug Info | Phase 4 | Restless legs syndrome | ICD11: 7A80 | [199] |
| Drugs in Phase 4 Clinical Trial | Click to Show/Hide the Full List of Drugs: 40 Drugs | ||||
Lumiracoxib |
Drug Info | Phase 4 | Anaesthesia | ICD11: 8E22 | [189] |
Ethinylestradiol propanesulfonate |
Drug Info | Phase 4 | Prostate cancer | ICD11: 2C82 | [190], [191] |
Desogestrel |
Drug Info | Phase 4 | Female pelvic pain | ICD11: GA34 | [192] |
Parecoxib |
Drug Info | Phase 4 | Anaesthesia | ICD11: 8E22 | [193] |
Mestranol |
Drug Info | Phase 4 | Menorrhagia | ICD11: GA20 | [36] |
Benzbromarone |
Drug Info | Phase 4 | Hyperuricaemia | ICD11: 5C55 | [194] |
Cinnarizine |
Drug Info | Phase 4 | Haemorrhagic stroke | ICD11: 8B20 | [36] |
Glibenclamide |
Drug Info | Phase 4 | Diabetes mellitus | ICD11: 5A10 | [195] |
Ketobemidone |
Drug Info | Phase 4 | Anaesthesia | ICD11: 8E22 | [196] |
Naftopidil |
Drug Info | Phase 4 | Prostatic hyperplasia | ICD11: GA90 | [198] |
Piperaquine |
Drug Info | Phase 4 | Malaria | ICD11: 1F40 | [200] |
Melatonin |
Drug Info | Phase 4 | Foetal growth restriction | ICD11: KA20 | [14] |
Tropisetron |
Drug Info | Phase 4 | Anaesthesia | ICD11: 8E22 | [22] |
Vonoprazan |
Drug Info | Phase 4 | Gastro-oesophageal reflux disease | ICD11: DA22 | [201] |
Aceclofenac |
Drug Info | Phase 4 | Rheumatoid arthritis | ICD11: FA20 | [202] |
Etoricoxib |
Drug Info | Phase 4 | Anaesthesia | ICD11: 8E22 | [203] |
Idebenone |
Drug Info | Phase 4 | Mitochondrial myopathy | ICD11: 8C73 | [204] |
Imrecoxib |
Drug Info | Phase 4 | Osteoarthritis | ICD11: FA00 | [205] |
Phenacetin |
Drug Info | Phase 4 | Anaesthesia | ICD11: 8E22 | [206] |
Terfenadine |
Drug Info | Phase 4 | Allergy | ICD11: 4A80 | [207] |
Tienilic acid |
Drug Info | Phase 4 | Congestive heart failure | ICD11: BD10 | [208] |
Tranilast |
Drug Info | Phase 4 | Conjunctivitis | ICD11: 9A60 | [209] |
Aminophenazone |
Drug Info | Phase 4 | Anaesthesia | ICD11: 8E22 | [36] |
Flunarizine |
Drug Info | Phase 4 | Schizophrenia | ICD11: 6A20 | [144] |
Flunitrazepam |
Drug Info | Phase 4 | Insomnia | ICD11: 7A00 | [210] |
Gliclazide |
Drug Info | Phase 4 | Diabetes mellitus | ICD11: 5A10 | [36] |
Lynestrenol |
Drug Info | Phase 4 | Transsexualism | ICD11: HA60 | [41] |
Perazine |
Drug Info | Phase 4 | Cerebrovascular dementia | ICD11: 6D81 | [211] |
Zaltoprofen |
Drug Info | Phase 4 | Anaesthesia | ICD11: 8E22 | [36] |
Zopiclone |
Drug Info | Phase 4 | Insomnia | ICD11: 7A00 | [212] |
Dexibuprofen |
Drug Info | Phase 4 | Osteoarthritis | ICD11: FA00 | [14] |
Flucloxacillin |
Drug Info | Phase 4 | Staphylococcus infection | ICD11: 1B73 | [213] |
Proguanil |
Drug Info | Phase 4 | Malaria | ICD11: 1F40 | [22] |
Rupatadine |
Drug Info | Phase 4 | Allergy | ICD11: 4A80 | [214] |
Tenoxicam |
Drug Info | Phase 4 | Anaesthesia | ICD11: 8E22 | [215] |
Ximelagatran |
Drug Info | Phase 4 | Coagulation defect | ICD11: 3B10 | [216] |
Gliquidone |
Drug Info | Phase 4 | Diabetes mellitus | ICD11: 5A10 | [112] |
Lornoxicam |
Drug Info | Phase 4 | Myocardial infarction | ICD11: BA41 | [217] |
Sitaxentan |
Drug Info | Phase 4 | Pulmonary hypertension | ICD11: BB01 | [218] |
Thiamylal |
Drug Info | Phase 4 | Anaesthesia | ICD11: 8E22 | [219] |
| Drugs in Phase 3 Clinical Trial | Click to Show/Hide the Full List of Drugs: 27 Drugs | ||||
PF-04965842 |
Drug Info | Phase 3 | Atopic dermatitis | ICD11: EA80 | [220] |
E-3A |
Drug Info | Phase 3 | Turner syndrome | ICD11: LD50 | [221] |
Selumetinib |
Drug Info | Phase 3 | Neurofibromatosis | ICD11: LD2D | [222], [223] |
BMS-298585 |
Drug Info | Phase 3 | Diabetes mellitus | ICD11: 5A10 | [224] |
BMS-650032 |
Drug Info | Phase 3 | Viral hepatitis | ICD11: 1E51 | [225] |
BAF-312 |
Drug Info | Phase 3 | Multiple sclerosis | ICD11: 8A40 | [35] |
Mavacamten |
Drug Info | Phase 3 | Hypertrophic cardiomyopathy | ICD11: BC43 | [226] |
RO-111163 |
Drug Info | Phase 3 | Hypersalivation | ICD11: DA04 | [22] |
SCH-417690 |
Drug Info | Phase 3 | Human immunodeficiency virus infection | ICD11: 1C60 | [36] |
Alilusem |
Drug Info | Phase 3 | Essential hypertension | ICD11: BA00 | [227] |
GW-1000 |
Drug Info | Phase 3 | Cerebral vasospasm | ICD11: BA85 | [228] |
Losartan |
Drug Info | Phase 3 | Hypertension | ICD11: BA00-BA04 | [229] |
LY-450139 |
Drug Info | Phase 3 | Alzheimer disease | ICD11: 8A20 | [230] |
R-1124 |
Drug Info | Phase 3 | Functional nausea/vomiting | ICD11: DD90 | [231] |
SC-411 |
Drug Info | Phase 3 | Alzheimer disease | ICD11: 8A20 | [232] |
CR-2017 |
Drug Info | Phase 3 | Irritable bowel syndrome | ICD11: DD91 | [233] |
Esonarimod |
Drug Info | Phase 3 | Rheumatoid arthritis | ICD11: FA20 | [234] |
Fenfluramine |
Drug Info | Phase 3 | Dravet syndrome | ICD11: 8A61-8A6Z | [235] |
Imatinib |
Drug Info | Phase 3 | Mantle cell lymphoma | ICD11: 2A85 | [236] |
TAK-491 |
Drug Info | Phase 3 | Hypertension | ICD11: BA00-BA04 | [237] |
JNJ-54135419 |
Drug Info | Phase 3 | Depression | ICD11: 6A71 | [47] |
MRTX849 |
Drug Info | Phase 3 | Lung cancer | ICD11: 2C25 | [238] |
Sildenafil |
Drug Info | Phase 3 | Erectile dysfunction | ICD11: HA00-HA01 | [239] |
Ag-221 |
Drug Info | Phase 3 | Acute myelogenous leukaemia | ICD11: 2A41 | [240] |
Clazosentan |
Drug Info | Phase 3 | Cerebral vasospasm | ICD11: BA85 | [241] |
CYT-387 |
Drug Info | Phase 3 | Myelofibrosis | ICD11: 2A22 | [242] |
Montelukast |
Drug Info | Phase 3 | Asthma | ICD11: CA23 | [36] |
| Drugs in Phase 2 Clinical Trial | Click to Show/Hide the Full List of Drugs: 21 Drugs | ||||
Verapamil |
Drug Info | Phase 2/3 | Hypertension | ICD11: BA00-BA04 | [243] |
EMD-128130 |
Drug Info | Phase 2/3 | Rett syndrome | ICD11: LD90 | [244] |
ANW-43703 |
Drug Info | Phase 2/3 | Anogenital warts | ICD11: 1A95 | [245] |
ONO-2506 |
Drug Info | Phase 2/3 | Haemorrhagic stroke | ICD11: 8B20 | [246] |
LIK-066 |
Drug Info | Phase 2 | Heart failure | ICD11: BD10-BD1Z | [247] |
LJN452 |
Drug Info | Phase 2 | Primary biliary cholangitis | ICD11: DB96 | [248] |
PT2385 |
Drug Info | Phase 2 | Von hippel-lindau disease | ICD11: 5A75 | [249] |
VATALANIB |
Drug Info | Phase 2 | Solid tumour/cancer | ICD11: 2A00-2F9Z | [250] |
Remogliflozin etabonate |
Drug Info | Phase 2 | Type-1/2 diabetes | ICD11: 5A10-5A11 | [251] |
S-777469 |
Drug Info | Phase 2 | Atopic dermatitis | ICD11: EA80 | [252] |
SSR-97193 |
Drug Info | Phase 2 | Malaria | ICD11: 1F40 | [253] |
HP-184 |
Drug Info | Phase 2 | Multiple sclerosis | ICD11: 8A40 | [254] |
J-005528 |
Drug Info | Phase 2 | Infectious cystitis | ICD11: GC00 | [132] |
Z-4828 |
Drug Info | Phase 2 | Histiocytic sarcoma | ICD11: 2B31 | [255] |
AZD2624 |
Drug Info | Phase 2 | Multiple sclerosis | ICD11: 8A40 | [256] |
BRN-0592109 |
Drug Info | Phase 2 | Diabetes mellitus | ICD11: 5A10 | [112] |
Dextofisopam |
Drug Info | Phase 2 | Irritable bowel syndrome | ICD11: DD91 | [257] |
HPPH |
Drug Info | Phase 2 | Lung cancer | ICD11: 2C25 | [258] |
Tarafenacin |
Drug Info | Phase 2 | Overactive bladder | ICD11: GC50 | [250] |
E-7070 |
Drug Info | Phase 2 | Breast cancer | ICD11: 2C60 | [259] |
TAK-906 |
Drug Info | Phase 2 | Gastroparesis | ICD11: DA41 | [260] |
| Drugs in Phase 1 Clinical Trial | Click to Show/Hide the Full List of Drugs: 12 Drugs | ||||
CB-3304 |
Drug Info | Phase 1/2 | Chronic lymphocytic leukaemia | ICD11: 2A82 | [261] |
CC-223 |
Drug Info | Phase 1/2 | Lung cancer | ICD11: 2C25 | [262] |
TRV-130 |
Drug Info | Phase 1/2 | Hypothyroidism | ICD11: 5A00 | [263] |
AG-1549 |
Drug Info | Phase 1 | Human immunodeficiency virus infection | ICD11: 1C60 | [264] |
STX 64 |
Drug Info | Phase 1 | Prostate cancer | ICD11: 2C82 | [265] |
BE-14348A |
Drug Info | Phase 1 | Viral hepatitis | ICD11: 1E51 | [266] |
H3B-6545 |
Drug Info | Phase 1 | Breast cancer | ICD11: 2C60 | [267] |
GDC-0623 |
Drug Info | Phase 1 | Solid tumour/cancer | ICD11: 2A00-2F9Z | [268] |
MN-1695 |
Drug Info | Phase 1 | Gastric ulcer | ICD11: DA60 | [269] |
BZ-55 |
Drug Info | Phase 1 | Diabetes mellitus | ICD11: 5A10 | [112] |
G-23350 |
Drug Info | Phase 1 | Venous thromboembolism | ICD11: BD72 | [217] |
HSP-990 |
Drug Info | Phase 1 | Breast cancer | ICD11: 2C60 | [270] |
| Discontinued/withdrawn Drugs | Click to Show/Hide the Full List of Drugs: 10 Drugs | ||||
Almokalant |
Drug Info | Discontinued in Phase 3 | Cardiac arrhythmias | ICD11: BC9Z | [271] |
KRP-297 |
Drug Info | Discontinued in Phase 2 | Hypertriglyceridaemia | ICD11: 5C80 | [272] |
Tetramethylpyrazine |
Drug Info | Discontinued in Phase 2 | Neurological disorder | ICD11: 6B60 | [273] |
BMS-181168 |
Drug Info | Discontinued in Phase 2 | Cognitive impairment | ICD11: 6D71 | [274] |
AZD0837 |
Drug Info | Discontinued in Phase 2 | Atrial fibrillation | ICD11: BC81 | [275] |
Tr-14035 |
Drug Info | Discontinued in Phase 1 | Multiple sclerosis | ICD11: 8A40 | [276] |
FCF-89 |
Drug Info | Discontinued | Rheumatoid arthritis | ICD11: FA20 | [277], [278] |
GV-150526 |
Drug Info | Discontinued | Cerebral stroke | ICD11: 8B11 | [36] |
ML-3000 |
Drug Info | Discontinued | Osteoarthritis | ICD11: FA00 | [36] |
ABT-001 |
Drug Info | Discontinued | Asthma | ICD11: CA23 | [22] |
| Preclinical/investigative Agents | Click to Show/Hide the Full List of Drugs: 8 Drugs | ||||
EPX-100 |
Drug Info | Preclinical | Dravet syndrome | ICD11: 8A61 | [279] |
VA-10872 |
Drug Info | Preclinical | Anaesthesia | ICD11: 8E22 | [22] |
Coumarin |
Drug Info | Investigative | Discovery agent | ICD: N.A. | [7] |
Arachidonic acid |
Drug Info | Investigative | Discovery agent | ICD: N.A. | [14] |
Antipyrine |
Drug Info | Investigative | Discovery agent | ICD: N.A. | [36] |
Estrone sulfate |
Drug Info | Investigative | Discovery agent | ICD: N.A. | [7] |
Lauric acid |
Drug Info | Investigative | Alzheimer disease | ICD11: 8A20 | [280] |
Cyamemazine |
Drug Info | Investigative | Discovery agent | ICD: N.A. | [281] |
| Tissue/Disease-Specific Protein Abundances of This DME | |||||
|---|---|---|---|---|---|
| Tissue-specific Protein Abundances in Healthy Individuals | Click to Show/Hide | ||||
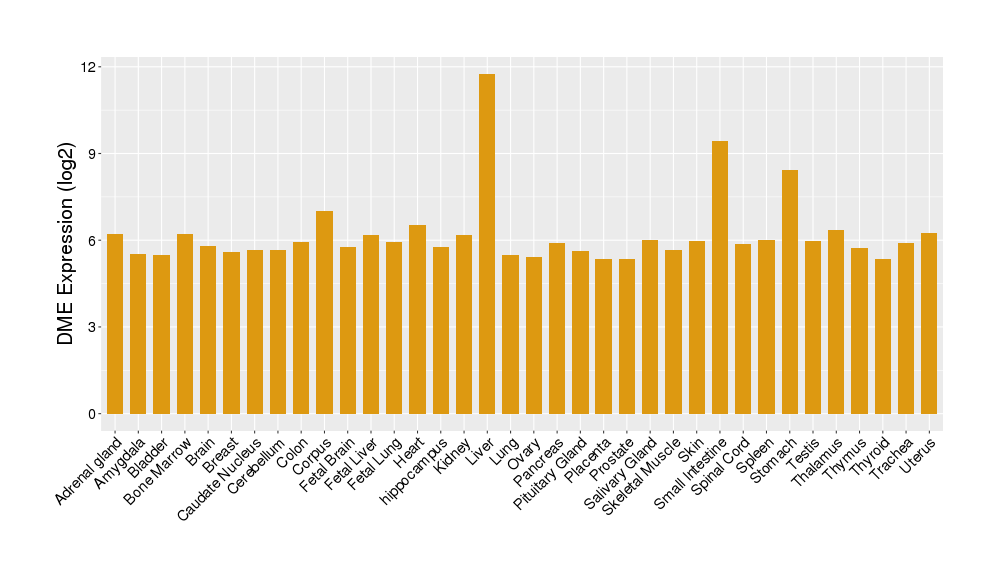
|
|||||
| ICD Disease Classification 01 | Infectious/parasitic disease | Click to Show/Hide | |||
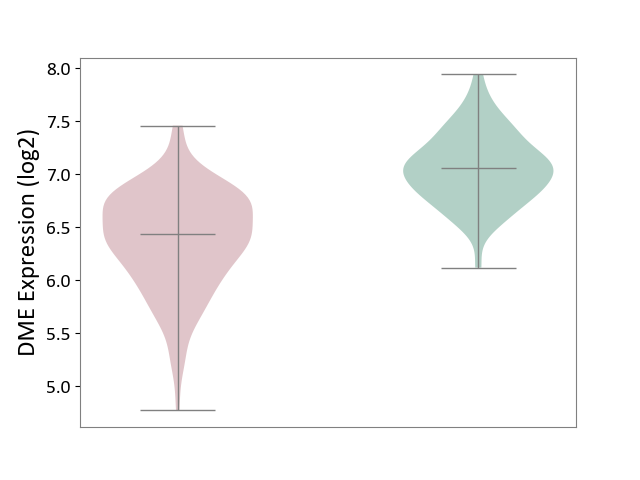
| ICD-11: 1C1H | Necrotising ulcerative gingivitis | Click to Show/Hide | |||
| The Studied Tissue | Gingival tissue | ||||
| The Specified Disease | Bacterial infection of gingival [ICD-11:1C1H] | ||||
| The Expression Level of Disease Section Compare with the Healthy Individual Tissue | p-value: 4.43E-24; Fold-change: -6.29E-01; Z-score: -1.88E+00 | ||||
|
DME expression in the diseased tissue of patients
DME expression in the normal tissue of healthy individuals
|
|||||
| Violin Diagram of DME Disease-specific Protein Abundances |
|
Click to View the Clearer Original Diagram | |||
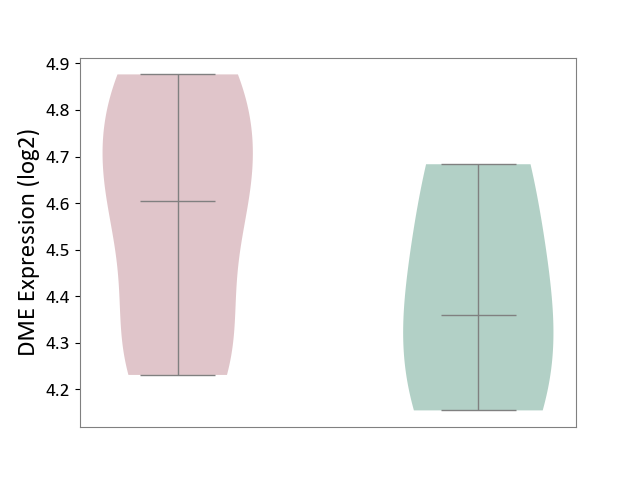
| ICD-11: 1E30 | Influenza | Click to Show/Hide | |||
| The Studied Tissue | Whole blood | ||||
| The Specified Disease | Influenza [ICD-11:1E30] | ||||
| The Expression Level of Disease Section Compare with the Healthy Individual Tissue | p-value: 3.74E-01; Fold-change: 2.46E-01; Z-score: 9.22E-01 | ||||
|
DME expression in the diseased tissue of patients
DME expression in the normal tissue of healthy individuals
|
|||||
| Violin Diagram of DME Disease-specific Protein Abundances |
|
Click to View the Clearer Original Diagram | |||
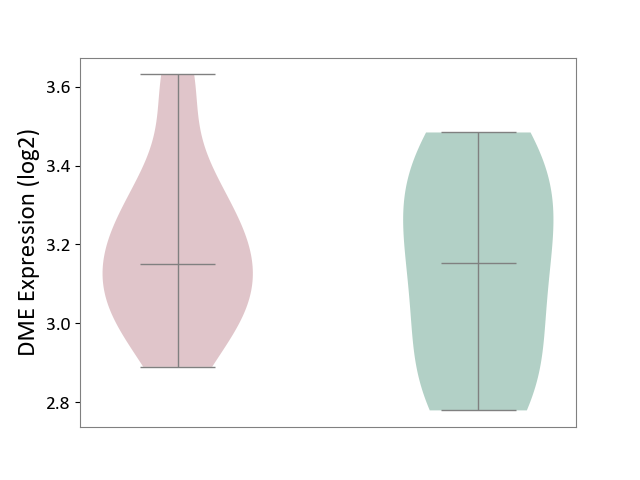
| ICD-11: 1E51 | Chronic viral hepatitis | Click to Show/Hide | |||
| The Studied Tissue | Whole blood | ||||
| The Specified Disease | Chronic hepatitis C [ICD-11:1E51.1] | ||||
| The Expression Level of Disease Section Compare with the Healthy Individual Tissue | p-value: 5.98E-01; Fold-change: -3.47E-03; Z-score: -1.39E-02 | ||||
|
DME expression in the diseased tissue of patients
DME expression in the normal tissue of healthy individuals
|
|||||
| Violin Diagram of DME Disease-specific Protein Abundances |
|
Click to View the Clearer Original Diagram | |||
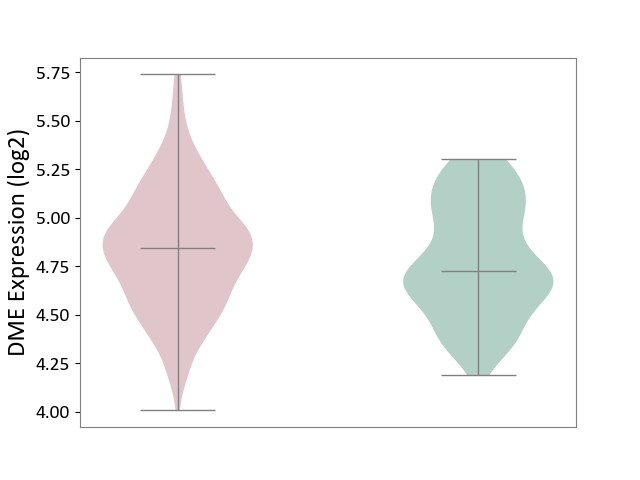
| ICD-11: 1G41 | Sepsis with septic shock | Click to Show/Hide | |||
| The Studied Tissue | Whole blood | ||||
| The Specified Disease | Sepsis with septic shock [ICD-11:1G41] | ||||
| The Expression Level of Disease Section Compare with the Healthy Individual Tissue | p-value: 2.64E-02; Fold-change: 1.15E-01; Z-score: 3.95E-01 | ||||
|
DME expression in the diseased tissue of patients
DME expression in the normal tissue of healthy individuals
|
|||||
| Violin Diagram of DME Disease-specific Protein Abundances |
|
Click to View the Clearer Original Diagram | |||
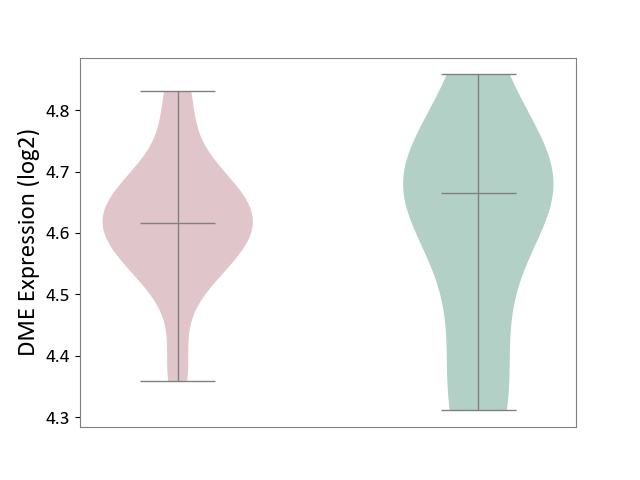
| ICD-11: CA40 | Respiratory syncytial virus infection | Click to Show/Hide | |||
| The Studied Tissue | Peripheral blood | ||||
| The Specified Disease | Pediatric respiratory syncytial virus infection [ICD-11:CA40.11] | ||||
| The Expression Level of Disease Section Compare with the Healthy Individual Tissue | p-value: 7.84E-01; Fold-change: -4.96E-02; Z-score: -2.85E-01 | ||||
|
DME expression in the diseased tissue of patients
DME expression in the normal tissue of healthy individuals
|
|||||
| Violin Diagram of DME Disease-specific Protein Abundances |
|
Click to View the Clearer Original Diagram | |||
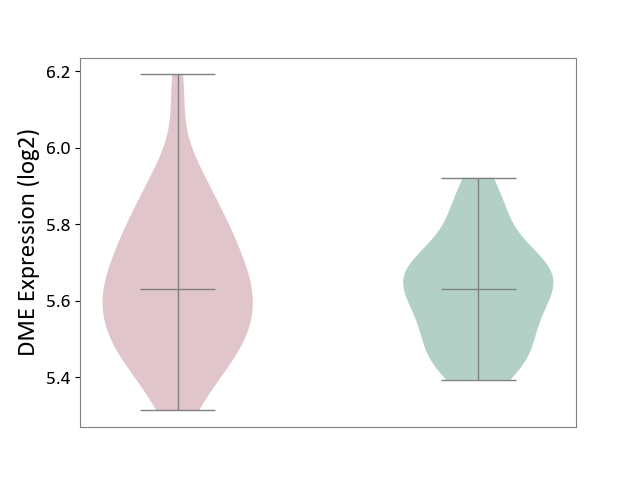
| ICD-11: CA42 | Rhinovirus infection | Click to Show/Hide | |||
| The Studied Tissue | Nasal epithelium tissue | ||||
| The Specified Disease | Rhinovirus infection [ICD-11:CA42.1] | ||||
| The Expression Level of Disease Section Compare with the Healthy Individual Tissue | p-value: 5.34E-01; Fold-change: 4.64E-04; Z-score: 3.34E-03 | ||||
|
DME expression in the diseased tissue of patients
DME expression in the normal tissue of healthy individuals
|
|||||
| Violin Diagram of DME Disease-specific Protein Abundances |
|
Click to View the Clearer Original Diagram | |||
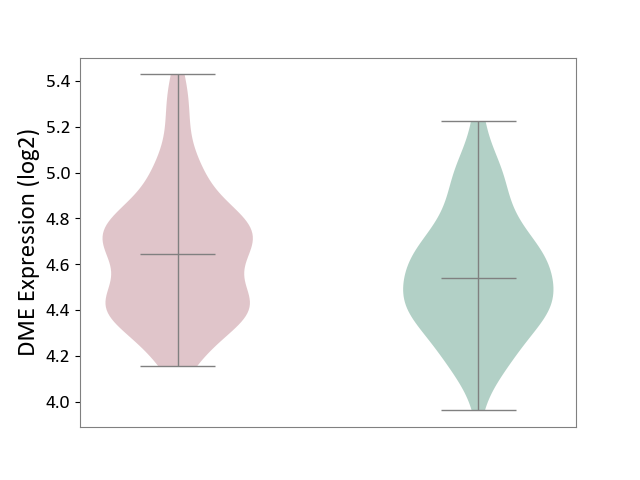
| ICD-11: KA60 | Neonatal sepsis | Click to Show/Hide | |||
| The Studied Tissue | Whole blood | ||||
| The Specified Disease | Neonatal sepsis [ICD-11:KA60] | ||||
| The Expression Level of Disease Section Compare with the Healthy Individual Tissue | p-value: 1.69E-02; Fold-change: 1.06E-01; Z-score: 3.95E-01 | ||||
|
DME expression in the diseased tissue of patients
DME expression in the normal tissue of healthy individuals
|
|||||
| Violin Diagram of DME Disease-specific Protein Abundances |
|
Click to View the Clearer Original Diagram | |||
| ICD Disease Classification 02 | Neoplasm | Click to Show/Hide | |||
| ICD-11: 2A00 | Brain cancer | Click to Show/Hide | |||
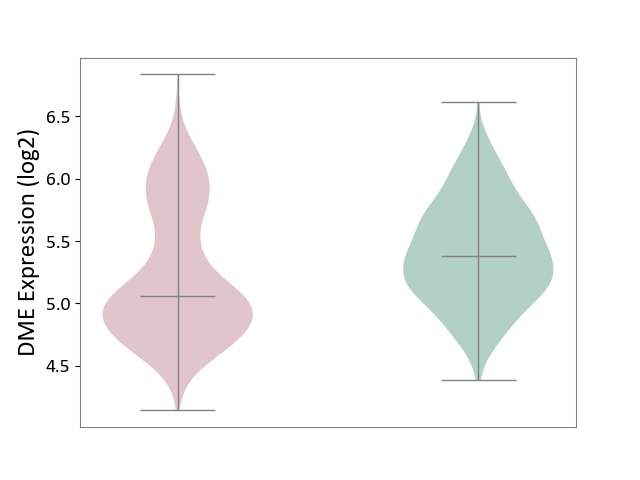
| The Studied Tissue | Nervous tissue | ||||
| The Specified Disease | Glioblastopma [ICD-11:2A00.00] | ||||
| The Expression Level of Disease Section Compare with the Healthy Individual Tissue | p-value: 7.53E-12; Fold-change: -3.19E-01; Z-score: -7.75E-01 | ||||
|
DME expression in the diseased tissue of patients
DME expression in the normal tissue of healthy individuals
|
|||||
| Violin Diagram of DME Disease-specific Protein Abundances |
|
Click to View the Clearer Original Diagram | |||
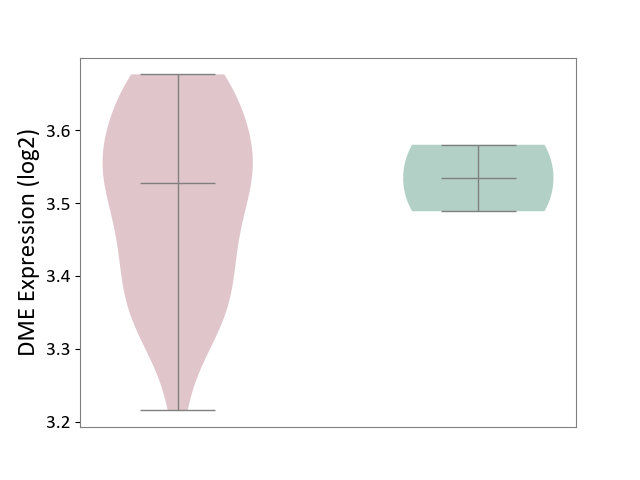
| The Studied Tissue | Brain stem tissue | ||||
| The Specified Disease | Glioma [ICD-11:2A00.0Y-2A00.0Z] | ||||
| The Expression Level of Disease Section Compare with the Healthy Individual Tissue | p-value: 5.93E-01; Fold-change: -7.33E-03; Z-score: -1.14E-01 | ||||
|
DME expression in the diseased tissue of patients
DME expression in the normal tissue of healthy individuals
|
|||||
| Violin Diagram of DME Disease-specific Protein Abundances |
|
Click to View the Clearer Original Diagram | |||
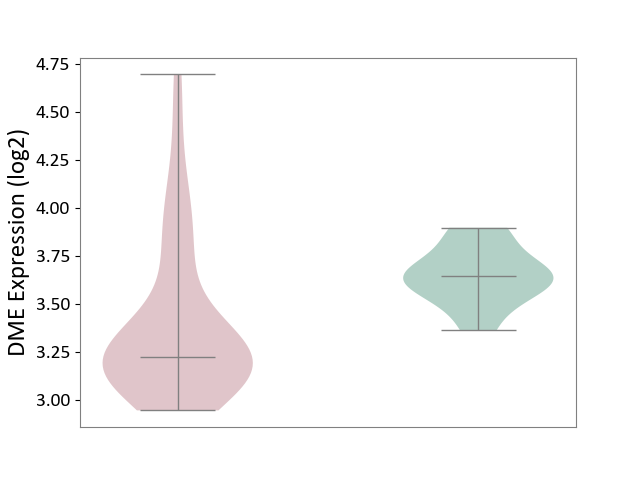
| The Studied Tissue | White matter tissue | ||||
| The Specified Disease | Glioma [ICD-11:2A00.0Y-2A00.0Z] | ||||
| The Expression Level of Disease Section Compare with the Healthy Individual Tissue | p-value: 1.46E-03; Fold-change: -4.23E-01; Z-score: -2.75E+00 | ||||
|
DME expression in the diseased tissue of patients
DME expression in the normal tissue of healthy individuals
|
|||||
| Violin Diagram of DME Disease-specific Protein Abundances |
|
Click to View the Clearer Original Diagram | |||
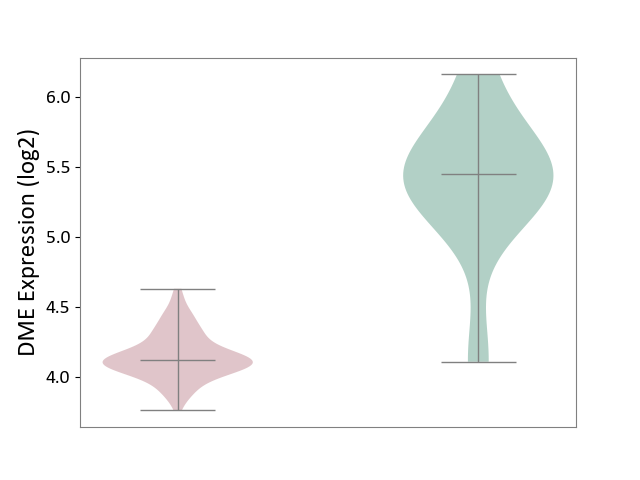
| The Studied Tissue | Brain stem tissue | ||||
| The Specified Disease | Neuroectodermal tumour [ICD-11:2A00.11] | ||||
| The Expression Level of Disease Section Compare with the Healthy Individual Tissue | p-value: 3.82E-05; Fold-change: -1.32E+00; Z-score: -2.53E+00 | ||||
|
DME expression in the diseased tissue of patients
DME expression in the normal tissue of healthy individuals
|
|||||
| Violin Diagram of DME Disease-specific Protein Abundances |
|
Click to View the Clearer Original Diagram | |||
| ICD-11: 2A20 | Myeloproliferative neoplasm | Click to Show/Hide | |||
| The Studied Tissue | Whole blood | ||||
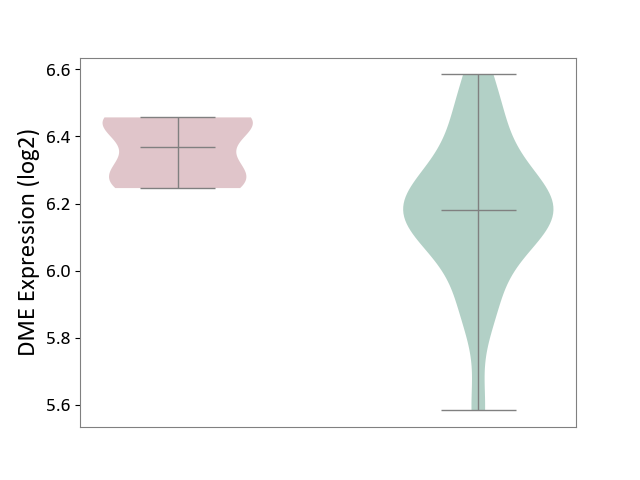
| The Specified Disease | Myelofibrosis [ICD-11:2A20.2] | ||||
| The Expression Level of Disease Section Compare with the Healthy Individual Tissue | p-value: 7.76E-04; Fold-change: 1.89E-01; Z-score: 8.57E-01 | ||||
|
DME expression in the diseased tissue of patients
DME expression in the normal tissue of healthy individuals
|
|||||
| Violin Diagram of DME Disease-specific Protein Abundances |
|
Click to View the Clearer Original Diagram | |||
| The Studied Tissue | Whole blood | ||||
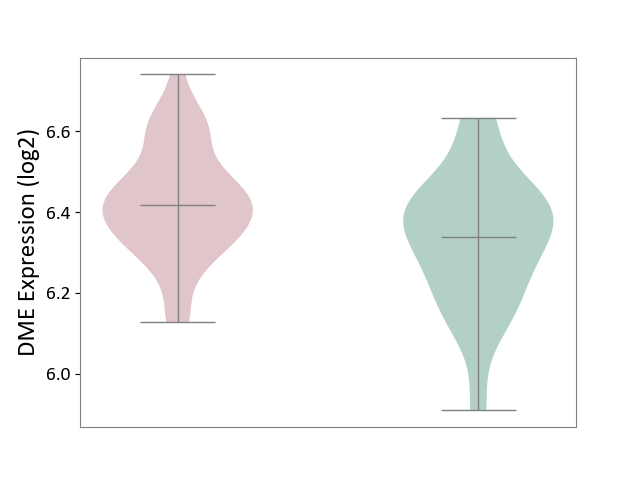
| The Specified Disease | Polycythemia vera [ICD-11:2A20.4] | ||||
| The Expression Level of Disease Section Compare with the Healthy Individual Tissue | p-value: 2.78E-03; Fold-change: 8.00E-02; Z-score: 4.77E-01 | ||||
|
DME expression in the diseased tissue of patients
DME expression in the normal tissue of healthy individuals
|
|||||
| Violin Diagram of DME Disease-specific Protein Abundances |
|
Click to View the Clearer Original Diagram | |||
| ICD-11: 2A36 | Myelodysplastic syndrome | Click to Show/Hide | |||
| The Studied Tissue | Bone marrow | ||||
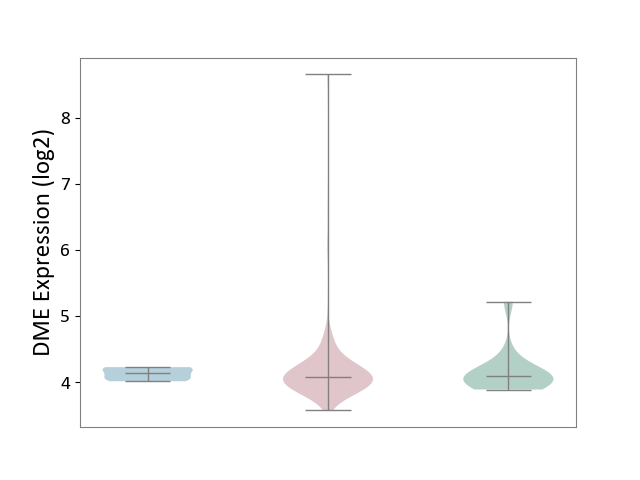
| The Specified Disease | Myelodysplastic syndrome [ICD-11:2A36-2A3Z] | ||||
| The Expression Level of Disease Section Compare with the Healthy Individual Tissue | p-value: 8.96E-01; Fold-change: -9.61E-03; Z-score: -2.89E-02 | ||||
| The Expression Level of Disease Section Compare with the Adjacent Tissue | p-value: 6.46E-01; Fold-change: -5.23E-02; Z-score: -4.98E-01 | ||||
|
DME expression in the diseased tissue of patients
DME expression in the normal tissue adjacent to the diseased tissue of patients
DME expression in the normal tissue of healthy individuals
|
|||||
| Violin Diagram of DME Disease-specific Protein Abundances |
|
Click to View the Clearer Original Diagram | |||
| ICD-11: 2A81 | Diffuse large B-cell lymphoma | Click to Show/Hide | |||
| The Studied Tissue | Tonsil tissue | ||||
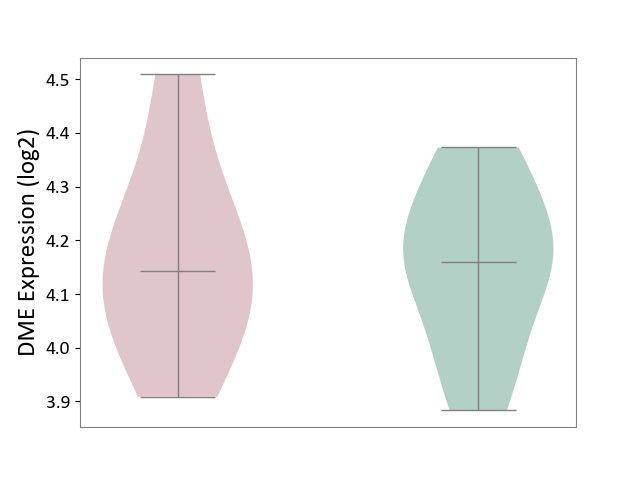
| The Specified Disease | Diffuse large B-cell lymphoma [ICD-11:2A81] | ||||
| The Expression Level of Disease Section Compare with the Healthy Individual Tissue | p-value: 8.67E-01; Fold-change: -1.78E-02; Z-score: -1.15E-01 | ||||
|
DME expression in the diseased tissue of patients
DME expression in the normal tissue of healthy individuals
|
|||||
| Violin Diagram of DME Disease-specific Protein Abundances |
|
Click to View the Clearer Original Diagram | |||
| ICD-11: 2A83 | Plasma cell neoplasm | Click to Show/Hide | |||
| The Studied Tissue | Peripheral blood | ||||
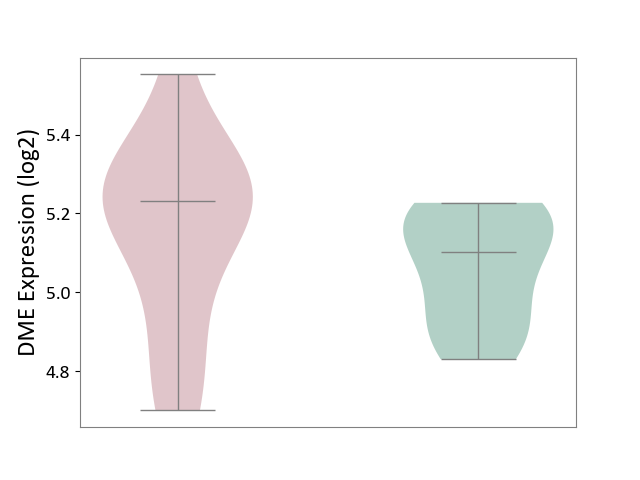
| The Specified Disease | Multiple myeloma [ICD-11:2A83.1] | ||||
| The Expression Level of Disease Section Compare with the Healthy Individual Tissue | p-value: 2.70E-01; Fold-change: 1.32E-01; Z-score: 9.13E-01 | ||||
|
DME expression in the diseased tissue of patients
DME expression in the normal tissue of healthy individuals
|
|||||
| Violin Diagram of DME Disease-specific Protein Abundances |
|
Click to View the Clearer Original Diagram | |||
| The Studied Tissue | Bone marrow | ||||
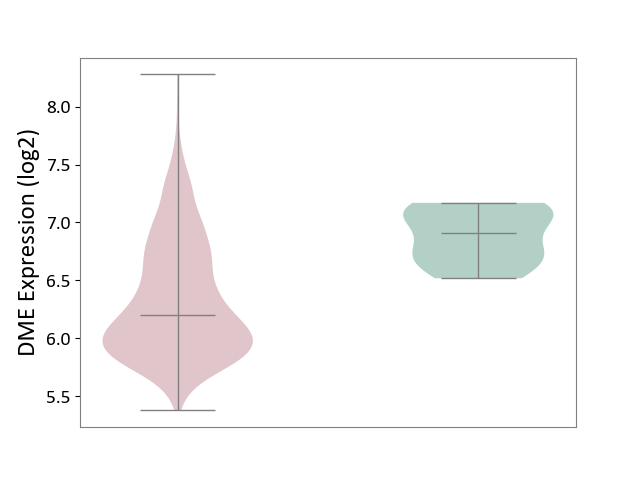
| The Specified Disease | Multiple myeloma [ICD-11:2A83.1] | ||||
| The Expression Level of Disease Section Compare with the Healthy Individual Tissue | p-value: 2.83E-04; Fold-change: -7.08E-01; Z-score: -2.91E+00 | ||||
|
DME expression in the diseased tissue of patients
DME expression in the normal tissue of healthy individuals
|
|||||
| Violin Diagram of DME Disease-specific Protein Abundances |
|
Click to View the Clearer Original Diagram | |||
| ICD-11: 2B33 | Leukaemia | Click to Show/Hide | |||
| The Studied Tissue | Bone marrow | ||||
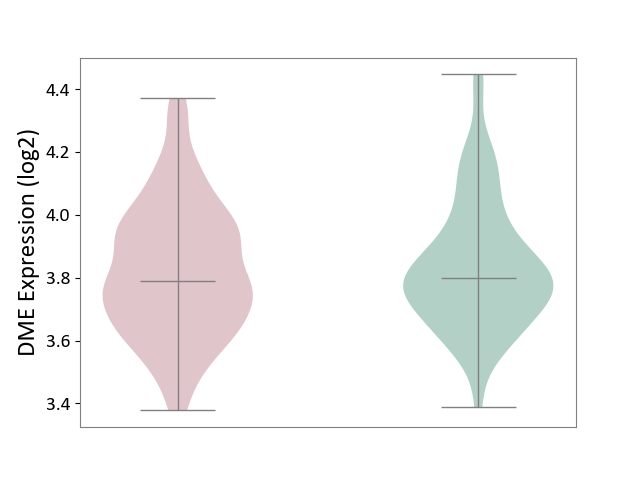
| The Specified Disease | Acute myelocytic leukaemia [ICD-11:2B33.1] | ||||
| The Expression Level of Disease Section Compare with the Healthy Individual Tissue | p-value: 5.63E-01; Fold-change: -9.82E-03; Z-score: -4.80E-02 | ||||
|
DME expression in the diseased tissue of patients
DME expression in the normal tissue of healthy individuals
|
|||||
| Violin Diagram of DME Disease-specific Protein Abundances |
|
Click to View the Clearer Original Diagram | |||
| ICD-11: 2B6E | Oral cancer | Click to Show/Hide | |||
| The Studied Tissue | Oral tissue | ||||
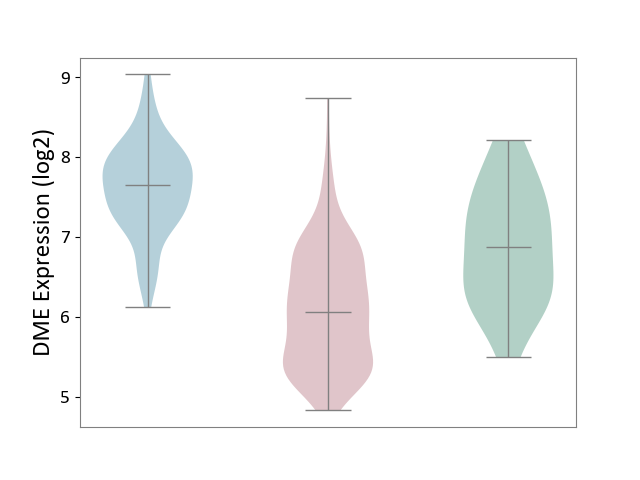
| The Specified Disease | Oral cancer [ICD-11:2B6E] | ||||
| The Expression Level of Disease Section Compare with the Healthy Individual Tissue | p-value: 1.09E-05; Fold-change: -8.12E-01; Z-score: -1.13E+00 | ||||
| The Expression Level of Disease Section Compare with the Adjacent Tissue | p-value: 1.06E-45; Fold-change: -1.58E+00; Z-score: -2.78E+00 | ||||
|
DME expression in the diseased tissue of patients
DME expression in the normal tissue adjacent to the diseased tissue of patients
DME expression in the normal tissue of healthy individuals
|
|||||
| Violin Diagram of DME Disease-specific Protein Abundances |
|
Click to View the Clearer Original Diagram | |||
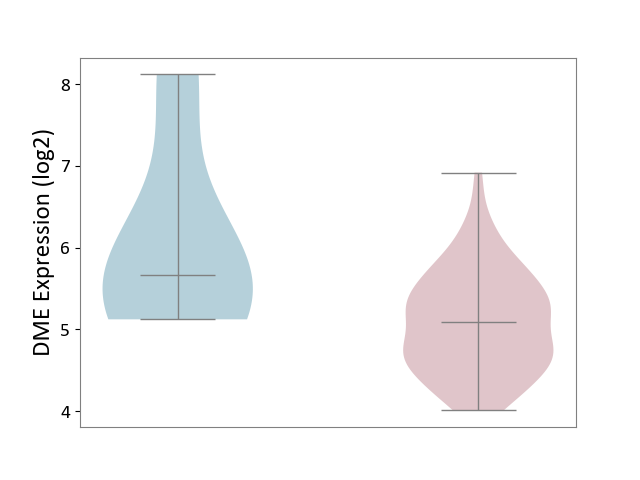
| ICD-11: 2B70 | Esophageal cancer | Click to Show/Hide | |||
| The Studied Tissue | Esophagus | ||||
| The Specified Disease | Esophagal cancer [ICD-11:2B70] | ||||
| The Expression Level of Disease Section Compare with the Adjacent Tissue | p-value: 1.62E-01; Fold-change: -5.78E-01; Z-score: -4.78E-01 | ||||
|
DME expression in the diseased tissue of patients
DME expression in the normal tissue adjacent to the diseased tissue of patients
|
|||||
| Violin Diagram of DME Disease-specific Protein Abundances |
|
Click to View the Clearer Original Diagram | |||
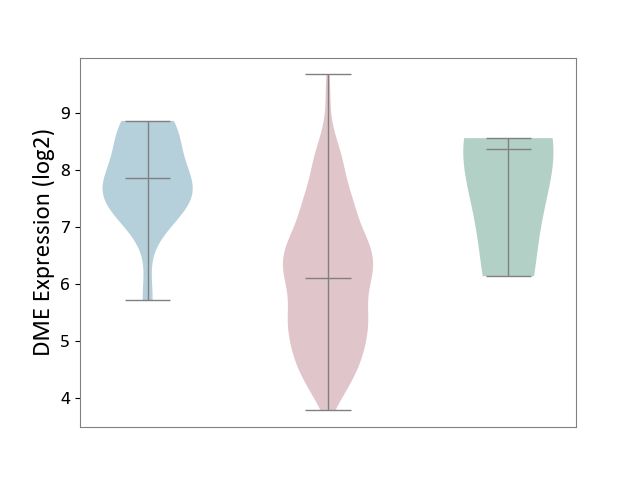
| ICD-11: 2B72 | Stomach cancer | Click to Show/Hide | |||
| The Studied Tissue | Gastric tissue | ||||
| The Specified Disease | Gastric cancer [ICD-11:2B72] | ||||
| The Expression Level of Disease Section Compare with the Healthy Individual Tissue | p-value: 1.80E-01; Fold-change: -2.27E+00; Z-score: -1.68E+00 | ||||
| The Expression Level of Disease Section Compare with the Adjacent Tissue | p-value: 8.73E-08; Fold-change: -1.76E+00; Z-score: -2.21E+00 | ||||
|
DME expression in the diseased tissue of patients
DME expression in the normal tissue adjacent to the diseased tissue of patients
DME expression in the normal tissue of healthy individuals
|
|||||
| Violin Diagram of DME Disease-specific Protein Abundances |
|
Click to View the Clearer Original Diagram | |||
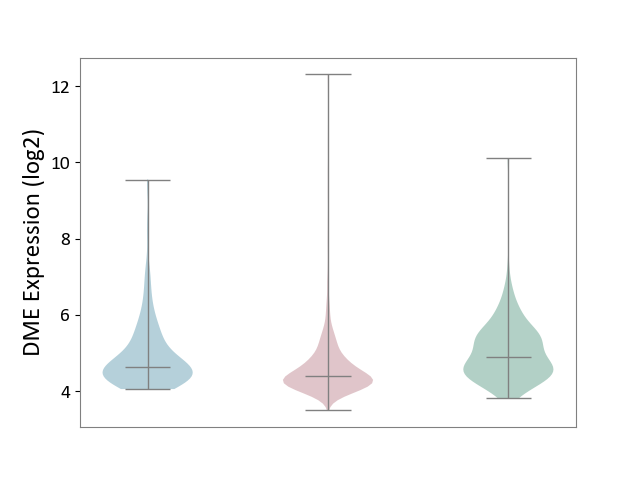
| ICD-11: 2B90 | Colon cancer | Click to Show/Hide | |||
| The Studied Tissue | Colon tissue | ||||
| The Specified Disease | Colon cancer [ICD-11:2B90] | ||||
| The Expression Level of Disease Section Compare with the Healthy Individual Tissue | p-value: 1.35E-09; Fold-change: -5.03E-01; Z-score: -6.35E-01 | ||||
| The Expression Level of Disease Section Compare with the Adjacent Tissue | p-value: 1.35E-04; Fold-change: -2.35E-01; Z-score: -2.71E-01 | ||||
|
DME expression in the diseased tissue of patients
DME expression in the normal tissue adjacent to the diseased tissue of patients
DME expression in the normal tissue of healthy individuals
|
|||||
| Violin Diagram of DME Disease-specific Protein Abundances |
|
Click to View the Clearer Original Diagram | |||
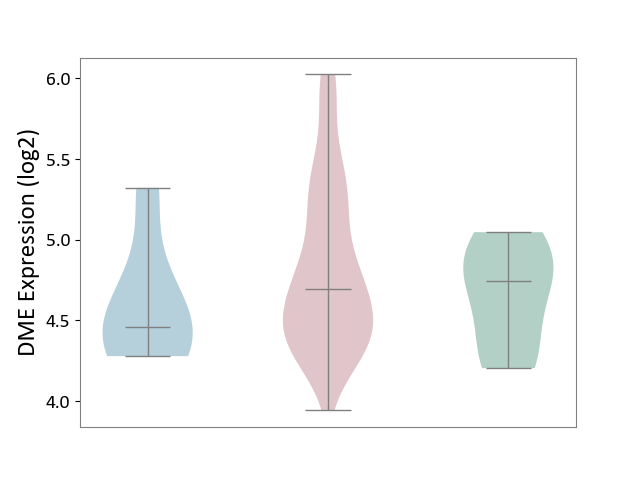
| ICD-11: 2B92 | Rectal cancer | Click to Show/Hide | |||
| The Studied Tissue | Rectal colon tissue | ||||
| The Specified Disease | Rectal cancer [ICD-11:2B92] | ||||
| The Expression Level of Disease Section Compare with the Healthy Individual Tissue | p-value: 3.04E-01; Fold-change: -5.14E-02; Z-score: -1.57E-01 | ||||
| The Expression Level of Disease Section Compare with the Adjacent Tissue | p-value: 2.18E-01; Fold-change: 2.37E-01; Z-score: 6.08E-01 | ||||
|
DME expression in the diseased tissue of patients
DME expression in the normal tissue adjacent to the diseased tissue of patients
DME expression in the normal tissue of healthy individuals
|
|||||
| Violin Diagram of DME Disease-specific Protein Abundances |
|
Click to View the Clearer Original Diagram | |||
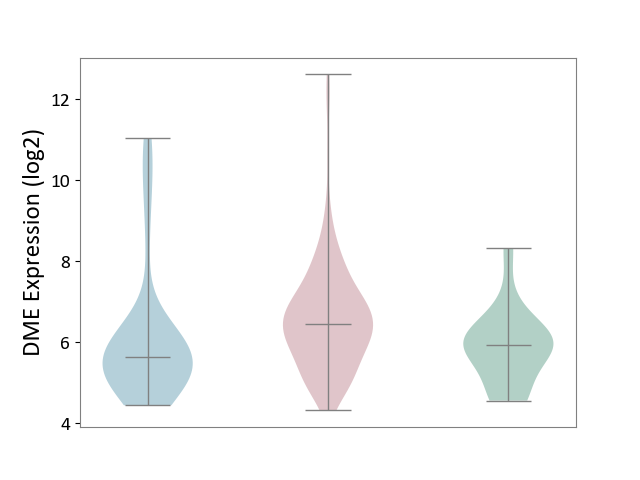
| ICD-11: 2C10 | Pancreatic cancer | Click to Show/Hide | |||
| The Studied Tissue | Pancreas | ||||
| The Specified Disease | Pancreatic cancer [ICD-11:2C10] | ||||
| The Expression Level of Disease Section Compare with the Healthy Individual Tissue | p-value: 1.36E-02; Fold-change: 5.20E-01; Z-score: 5.54E-01 | ||||
| The Expression Level of Disease Section Compare with the Adjacent Tissue | p-value: 2.89E-02; Fold-change: 8.19E-01; Z-score: 5.11E-01 | ||||
|
DME expression in the diseased tissue of patients
DME expression in the normal tissue adjacent to the diseased tissue of patients
DME expression in the normal tissue of healthy individuals
|
|||||
| Violin Diagram of DME Disease-specific Protein Abundances |
|
Click to View the Clearer Original Diagram | |||
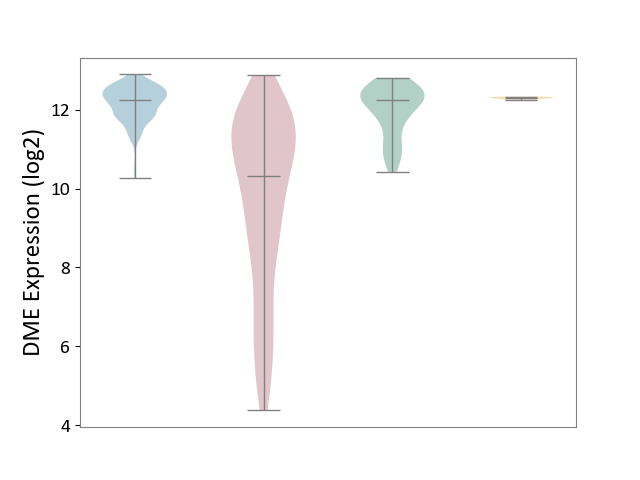
| ICD-11: 2C12 | Liver cancer | Click to Show/Hide | |||
| The Studied Tissue | Liver tissue | ||||
| The Specified Disease | Liver cancer [ICD-11:2C12.0] | ||||
| The Expression Level of Disease Section Compare with the Healthy Individual Tissue | p-value: 2.95E-34; Fold-change: -1.91E+00; Z-score: -2.96E+00 | ||||
| The Expression Level of Disease Section Compare with the Adjacent Tissue | p-value: 2.08E-71; Fold-change: -1.92E+00; Z-score: -4.42E+00 | ||||
| The Expression Level of Disease Section Compare with the Other Disease Section | p-value: 3.07E-76; Fold-change: -1.97E+00; Z-score: -6.29E+01 | ||||
|
DME expression in the diseased tissue of patients
DME expression in the normal tissue adjacent to the diseased tissue of patients
DME expression in the normal tissue of healthy individuals
DME expression in tissue other than the diseased tissue of patients
|
|||||
| Violin Diagram of DME Disease-specific Protein Abundances |
|
Click to View the Clearer Original Diagram | |||
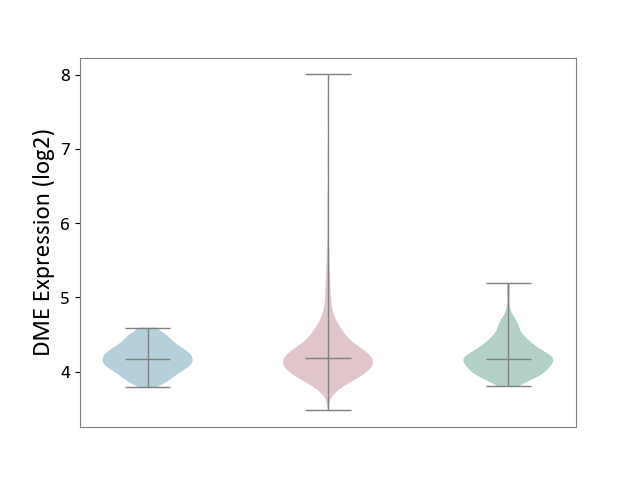
| ICD-11: 2C25 | Lung cancer | Click to Show/Hide | |||
| The Studied Tissue | Lung tissue | ||||
| The Specified Disease | Lung cancer [ICD-11:2C25] | ||||
| The Expression Level of Disease Section Compare with the Healthy Individual Tissue | p-value: 1.08E-03; Fold-change: 1.76E-02; Z-score: 7.09E-02 | ||||
| The Expression Level of Disease Section Compare with the Adjacent Tissue | p-value: 7.39E-06; Fold-change: 9.49E-03; Z-score: 4.90E-02 | ||||
|
DME expression in the diseased tissue of patients
DME expression in the normal tissue adjacent to the diseased tissue of patients
DME expression in the normal tissue of healthy individuals
|
|||||
| Violin Diagram of DME Disease-specific Protein Abundances |
|
Click to View the Clearer Original Diagram | |||
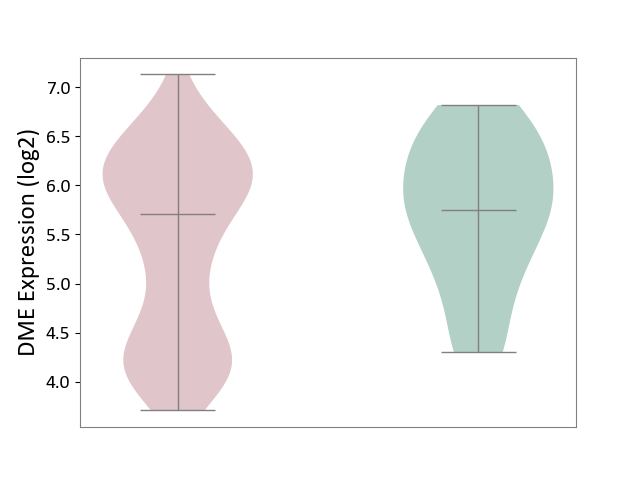
| ICD-11: 2C30 | Skin cancer | Click to Show/Hide | |||
| The Studied Tissue | Skin | ||||
| The Specified Disease | Melanoma [ICD-11:2C30] | ||||
| The Expression Level of Disease Section Compare with the Healthy Individual Tissue | p-value: 6.22E-02; Fold-change: -4.36E-02; Z-score: -5.84E-02 | ||||
|
DME expression in the diseased tissue of patients
DME expression in the normal tissue of healthy individuals
|
|||||
| Violin Diagram of DME Disease-specific Protein Abundances |
|
Click to View the Clearer Original Diagram | |||
| The Studied Tissue | Skin | ||||
| The Specified Disease | Skin cancer [ICD-11:2C30-2C3Z] | ||||
| The Expression Level of Disease Section Compare with the Healthy Individual Tissue | p-value: 4.91E-03; Fold-change: -1.59E-01; Z-score: -3.84E-01 | ||||
| The Expression Level of Disease Section Compare with the Adjacent Tissue | p-value: 2.27E-01; Fold-change: -1.55E-01; Z-score: -3.08E-01 | ||||
|
DME expression in the diseased tissue of patients
DME expression in the normal tissue adjacent to the diseased tissue of patients
DME expression in the normal tissue of healthy individuals
|
|||||
| Violin Diagram of DME Disease-specific Protein Abundances |
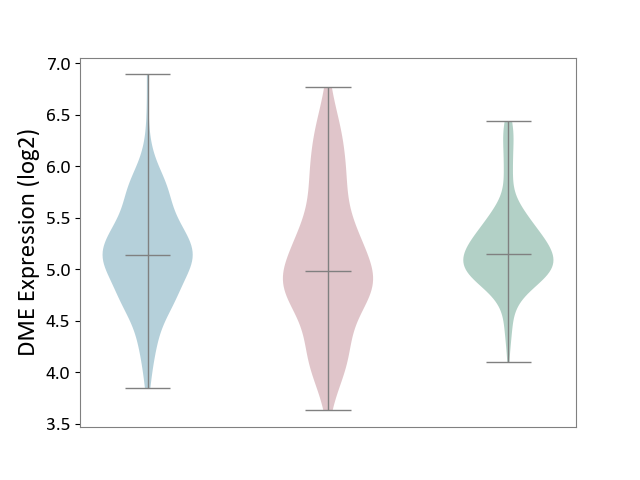
|
Click to View the Clearer Original Diagram | |||
| ICD-11: 2C6Z | Breast cancer | Click to Show/Hide | |||
| The Studied Tissue | Breast tissue | ||||
| The Specified Disease | Breast cancer [ICD-11:2C60-2C6Z] | ||||
| The Expression Level of Disease Section Compare with the Healthy Individual Tissue | p-value: 1.07E-11; Fold-change: -1.16E-01; Z-score: -2.53E-01 | ||||
| The Expression Level of Disease Section Compare with the Adjacent Tissue | p-value: 6.69E-02; Fold-change: -1.28E-02; Z-score: -3.31E-02 | ||||
|
DME expression in the diseased tissue of patients
DME expression in the normal tissue adjacent to the diseased tissue of patients
DME expression in the normal tissue of healthy individuals
|
|||||
| Violin Diagram of DME Disease-specific Protein Abundances |
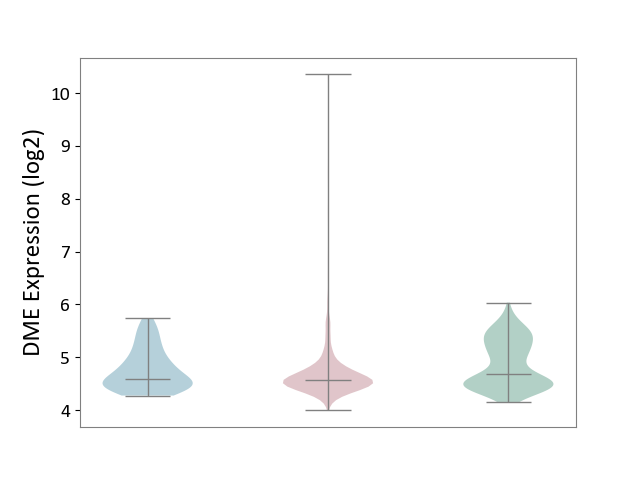
|
Click to View the Clearer Original Diagram | |||
| ICD-11: 2C73 | Ovarian cancer | Click to Show/Hide | |||
| The Studied Tissue | Ovarian tissue | ||||
| The Specified Disease | Ovarian cancer [ICD-11:2C73] | ||||
| The Expression Level of Disease Section Compare with the Healthy Individual Tissue | p-value: 2.69E-01; Fold-change: 6.97E-02; Z-score: 1.48E-01 | ||||
| The Expression Level of Disease Section Compare with the Adjacent Tissue | p-value: 1.97E-08; Fold-change: 9.08E-02; Z-score: 5.54E-01 | ||||
|
DME expression in the diseased tissue of patients
DME expression in the normal tissue adjacent to the diseased tissue of patients
DME expression in the normal tissue of healthy individuals
|
|||||
| Violin Diagram of DME Disease-specific Protein Abundances |
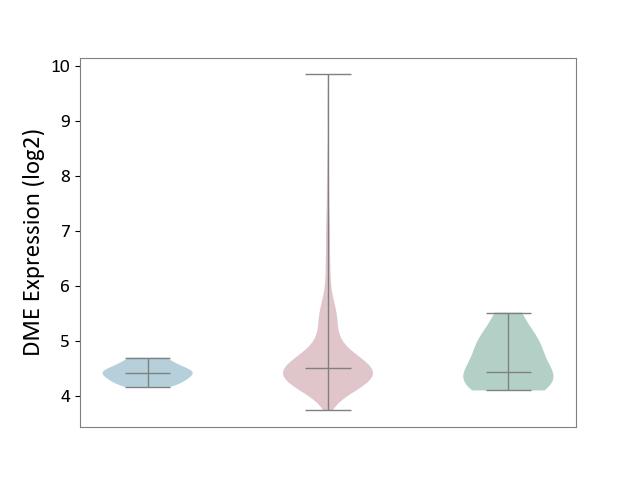
|
Click to View the Clearer Original Diagram | |||
| ICD-11: 2C77 | Cervical cancer | Click to Show/Hide | |||
| The Studied Tissue | Cervical tissue | ||||
| The Specified Disease | Cervical cancer [ICD-11:2C77] | ||||
| The Expression Level of Disease Section Compare with the Healthy Individual Tissue | p-value: 4.97E-02; Fold-change: -4.39E-01; Z-score: -8.20E-01 | ||||
|
DME expression in the diseased tissue of patients
DME expression in the normal tissue of healthy individuals
|
|||||
| Violin Diagram of DME Disease-specific Protein Abundances |
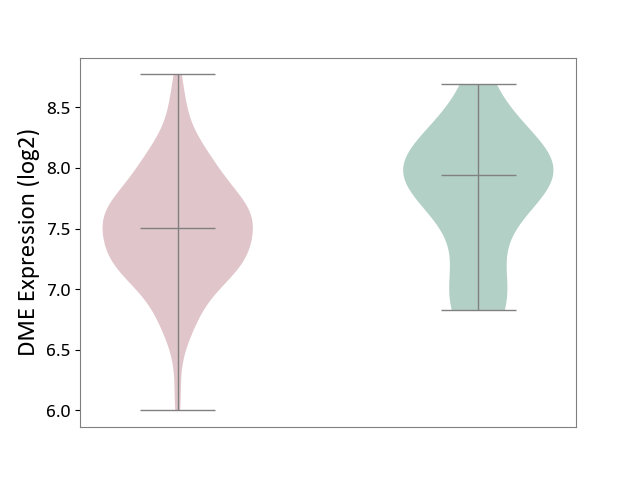
|
Click to View the Clearer Original Diagram | |||
| ICD-11: 2C78 | Uterine cancer | Click to Show/Hide | |||
| The Studied Tissue | Endometrium tissue | ||||
| The Specified Disease | Uterine cancer [ICD-11:2C78] | ||||
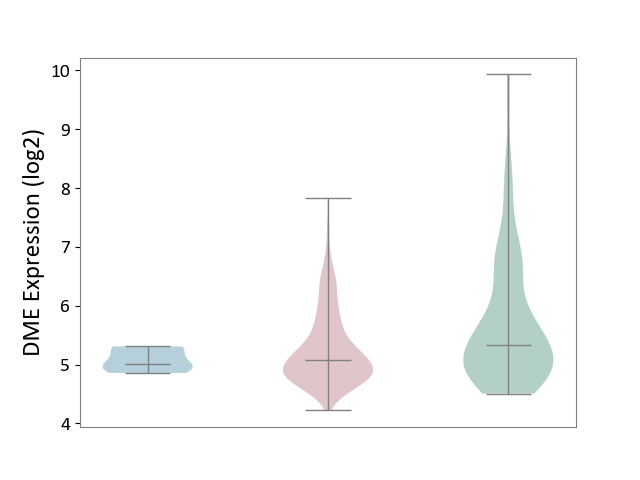
| The Expression Level of Disease Section Compare with the Healthy Individual Tissue | p-value: 4.46E-05; Fold-change: -2.53E-01; Z-score: -2.36E-01 | ||||
| The Expression Level of Disease Section Compare with the Adjacent Tissue | p-value: 1.32E-01; Fold-change: 6.61E-02; Z-score: 3.21E-01 | ||||
|
DME expression in the diseased tissue of patients
DME expression in the normal tissue adjacent to the diseased tissue of patients
DME expression in the normal tissue of healthy individuals
|
|||||
| Violin Diagram of DME Disease-specific Protein Abundances |
|
Click to View the Clearer Original Diagram | |||
| ICD-11: 2C82 | Prostate cancer | Click to Show/Hide | |||
| The Studied Tissue | Prostate | ||||
| The Specified Disease | Prostate cancer [ICD-11:2C82] | ||||
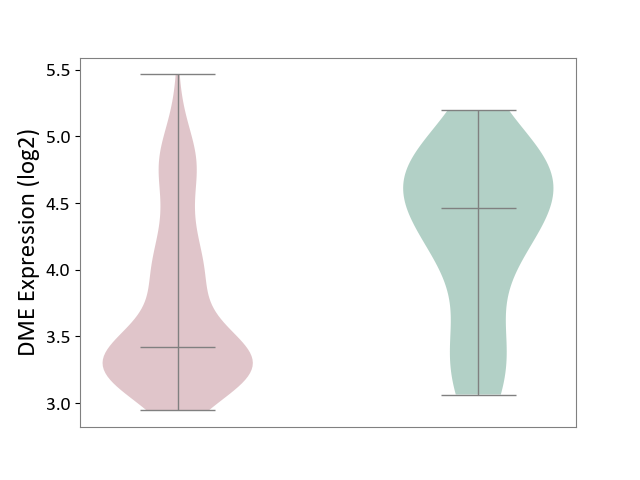
| The Expression Level of Disease Section Compare with the Healthy Individual Tissue | p-value: 4.97E-04; Fold-change: -1.04E+00; Z-score: -1.67E+00 | ||||
|
DME expression in the diseased tissue of patients
DME expression in the normal tissue of healthy individuals
|
|||||
| Violin Diagram of DME Disease-specific Protein Abundances |
|
Click to View the Clearer Original Diagram | |||
| ICD-11: 2C90 | Renal cancer | Click to Show/Hide | |||
| The Studied Tissue | Kidney | ||||
| The Specified Disease | Renal cancer [ICD-11:2C90-2C91] | ||||
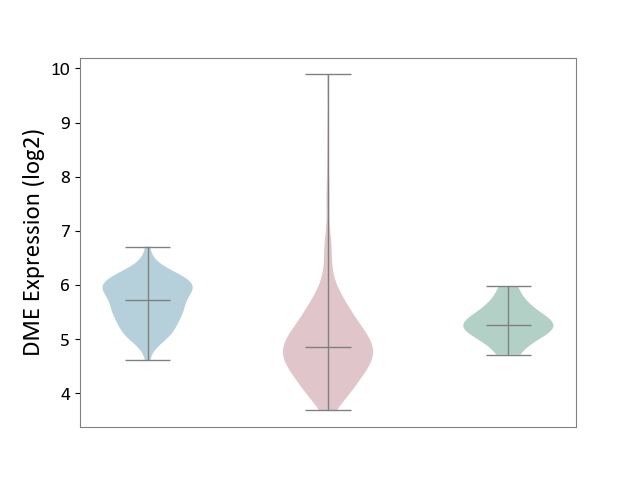
| The Expression Level of Disease Section Compare with the Healthy Individual Tissue | p-value: 1.62E-02; Fold-change: -4.23E-01; Z-score: -1.25E+00 | ||||
| The Expression Level of Disease Section Compare with the Adjacent Tissue | p-value: 6.28E-20; Fold-change: -8.75E-01; Z-score: -2.07E+00 | ||||
|
DME expression in the diseased tissue of patients
DME expression in the normal tissue adjacent to the diseased tissue of patients
DME expression in the normal tissue of healthy individuals
|
|||||
| Violin Diagram of DME Disease-specific Protein Abundances |
|
Click to View the Clearer Original Diagram | |||
| ICD-11: 2C92 | Ureter cancer | Click to Show/Hide | |||
| The Studied Tissue | Urothelium | ||||
| The Specified Disease | Ureter cancer [ICD-11:2C92] | ||||
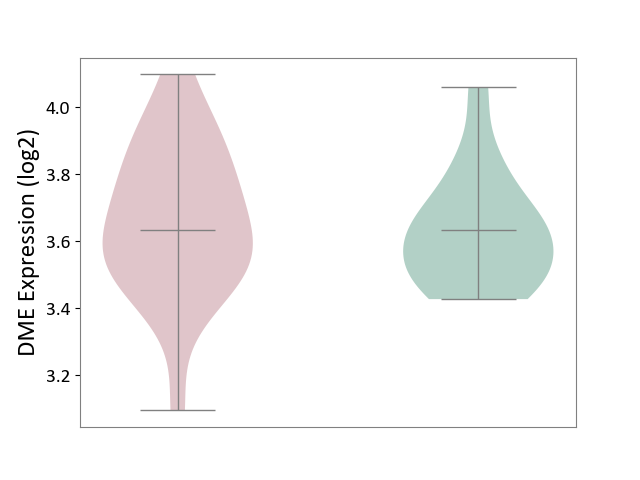
| The Expression Level of Disease Section Compare with the Healthy Individual Tissue | p-value: 6.40E-01; Fold-change: -1.32E-03; Z-score: -7.76E-03 | ||||
|
DME expression in the diseased tissue of patients
DME expression in the normal tissue of healthy individuals
|
|||||
| Violin Diagram of DME Disease-specific Protein Abundances |
|
Click to View the Clearer Original Diagram | |||
| ICD-11: 2C94 | Bladder cancer | Click to Show/Hide | |||
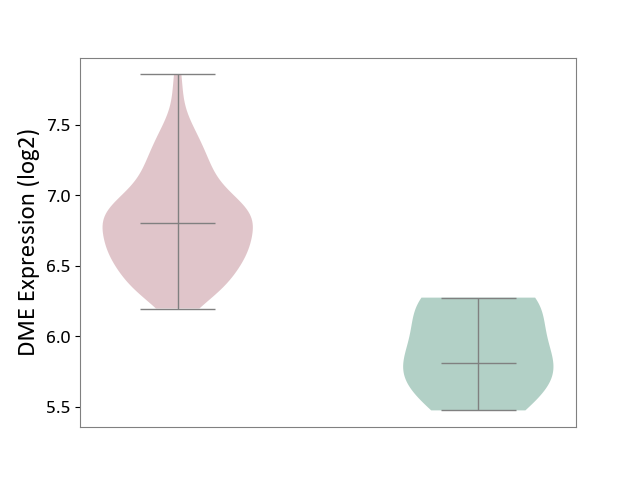
| The Studied Tissue | Bladder tissue | ||||
| The Specified Disease | Bladder cancer [ICD-11:2C94] | ||||
| The Expression Level of Disease Section Compare with the Healthy Individual Tissue | p-value: 1.33E-04; Fold-change: 9.95E-01; Z-score: 3.23E+00 | ||||
|
DME expression in the diseased tissue of patients
DME expression in the normal tissue of healthy individuals
|
|||||
| Violin Diagram of DME Disease-specific Protein Abundances |
|
Click to View the Clearer Original Diagram | |||
| ICD-11: 2D02 | Retinal cancer | Click to Show/Hide | |||
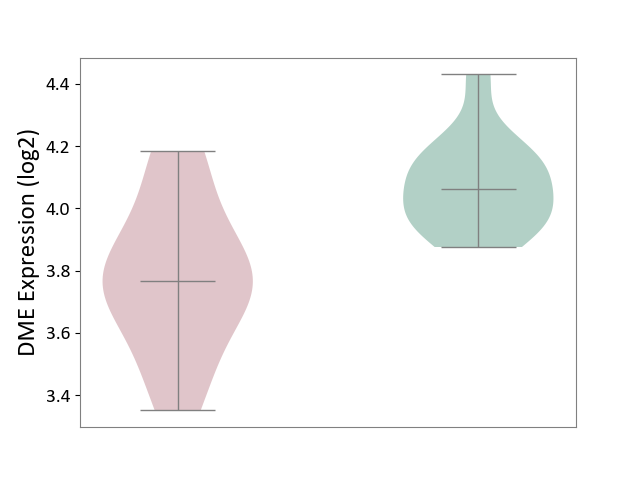
| The Studied Tissue | Uvea | ||||
| The Specified Disease | Retinoblastoma [ICD-11:2D02.2] | ||||
| The Expression Level of Disease Section Compare with the Healthy Individual Tissue | p-value: 8.01E-04; Fold-change: -2.94E-01; Z-score: -1.95E+00 | ||||
|
DME expression in the diseased tissue of patients
DME expression in the normal tissue of healthy individuals
|
|||||
| Violin Diagram of DME Disease-specific Protein Abundances |
|
Click to View the Clearer Original Diagram | |||
| ICD-11: 2D10 | Thyroid cancer | Click to Show/Hide | |||
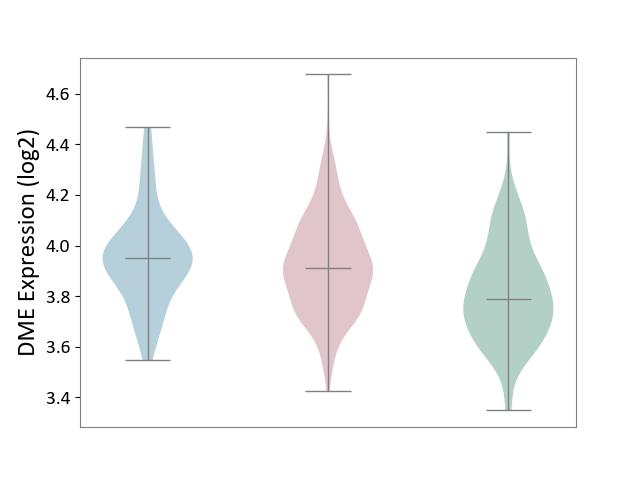
| The Studied Tissue | Thyroid | ||||
| The Specified Disease | Thyroid cancer [ICD-11:2D10] | ||||
| The Expression Level of Disease Section Compare with the Healthy Individual Tissue | p-value: 2.84E-06; Fold-change: 1.24E-01; Z-score: 6.31E-01 | ||||
| The Expression Level of Disease Section Compare with the Adjacent Tissue | p-value: 4.18E-01; Fold-change: -3.93E-02; Z-score: -2.10E-01 | ||||
|
DME expression in the diseased tissue of patients
DME expression in the normal tissue adjacent to the diseased tissue of patients
DME expression in the normal tissue of healthy individuals
|
|||||
| Violin Diagram of DME Disease-specific Protein Abundances |
|
Click to View the Clearer Original Diagram | |||
| ICD-11: 2D11 | Adrenal cancer | Click to Show/Hide | |||
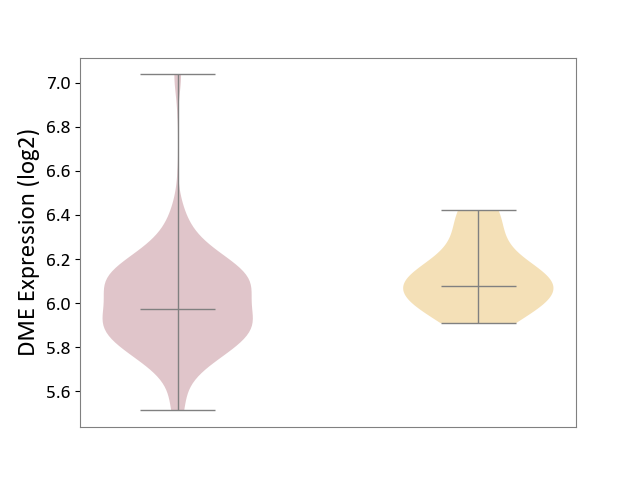
| The Studied Tissue | Adrenal cortex | ||||
| The Specified Disease | Adrenocortical carcinoma [ICD-11:2D11.Z] | ||||
| The Expression Level of Disease Section Compare with the Other Disease Section | p-value: 9.72E-03; Fold-change: -1.02E-01; Z-score: -6.69E-01 | ||||
|
DME expression in the diseased tissue of patients
DME expression in tissue other than the diseased tissue of patients
|
|||||
| Violin Diagram of DME Disease-specific Protein Abundances |
|
Click to View the Clearer Original Diagram | |||
| ICD-11: 2D12 | Endocrine gland neoplasm | Click to Show/Hide | |||
| The Studied Tissue | Pituitary tissue | ||||
| The Specified Disease | Pituitary cancer [ICD-11:2D12] | ||||
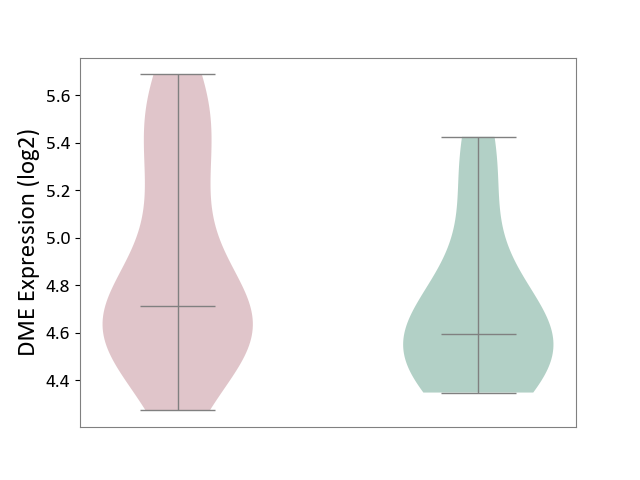
| The Expression Level of Disease Section Compare with the Healthy Individual Tissue | p-value: 1.63E-01; Fold-change: 1.21E-01; Z-score: 3.60E-01 | ||||
|
DME expression in the diseased tissue of patients
DME expression in the normal tissue of healthy individuals
|
|||||
| Violin Diagram of DME Disease-specific Protein Abundances |
|
Click to View the Clearer Original Diagram | |||
| The Studied Tissue | Pituitary tissue | ||||
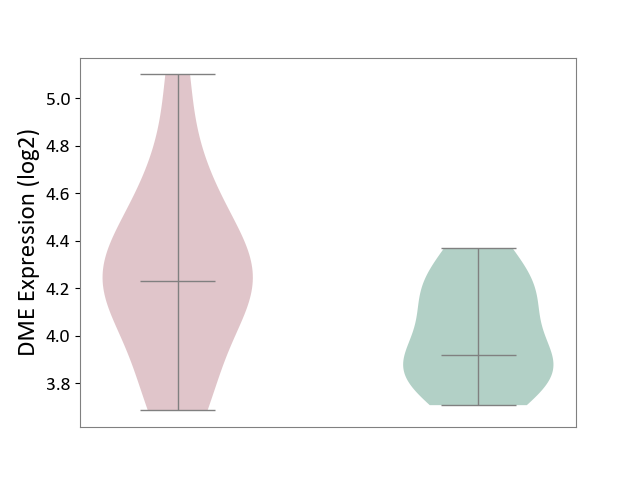
| The Specified Disease | Pituitary gonadotrope tumour [ICD-11:2D12] | ||||
| The Expression Level of Disease Section Compare with the Healthy Individual Tissue | p-value: 5.04E-02; Fold-change: 3.10E-01; Z-score: 1.42E+00 | ||||
|
DME expression in the diseased tissue of patients
DME expression in the normal tissue of healthy individuals
|
|||||
| Violin Diagram of DME Disease-specific Protein Abundances |
|
Click to View the Clearer Original Diagram | |||
| ICD-11: 2D42 | Head and neck cancer | Click to Show/Hide | |||
| The Studied Tissue | Head and neck tissue | ||||
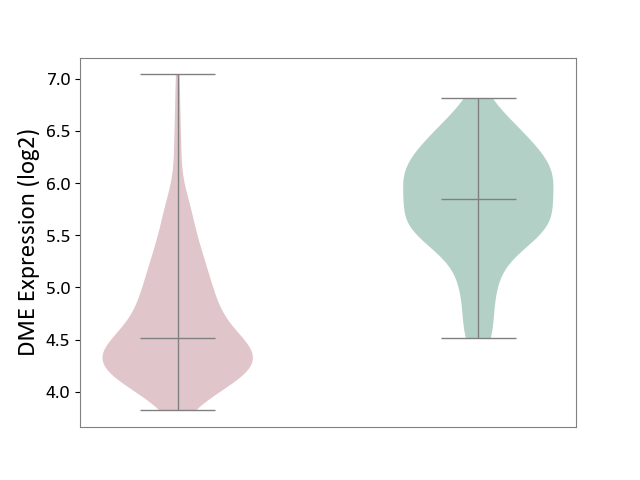
| The Specified Disease | Head and neck cancer [ICD-11:2D42] | ||||
| The Expression Level of Disease Section Compare with the Healthy Individual Tissue | p-value: 4.60E-34; Fold-change: -1.33E+00; Z-score: -2.50E+00 | ||||
|
DME expression in the diseased tissue of patients
DME expression in the normal tissue of healthy individuals
|
|||||
| Violin Diagram of DME Disease-specific Protein Abundances |
|
Click to View the Clearer Original Diagram | |||
| ICD Disease Classification 03 | Blood/blood-forming organ disease | Click to Show/Hide | |||
| ICD-11: 3A51 | Sickle cell disorder | Click to Show/Hide | |||
| The Studied Tissue | Peripheral blood | ||||
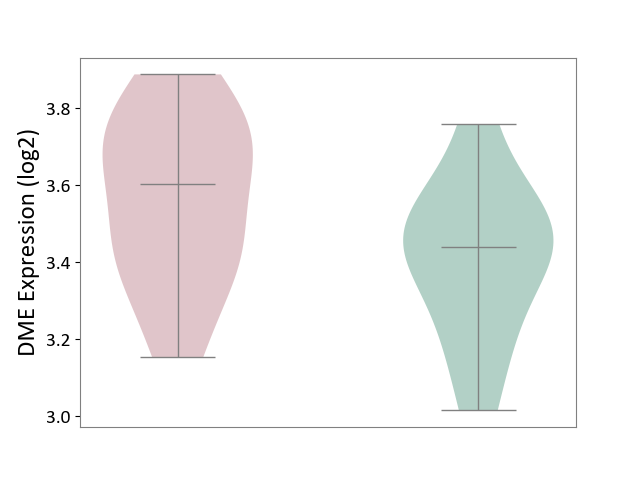
| The Specified Disease | Sickle cell disease [ICD-11:3A51.0-3A51.3] | ||||
| The Expression Level of Disease Section Compare with the Healthy Individual Tissue | p-value: 7.69E-02; Fold-change: 1.66E-01; Z-score: 8.10E-01 | ||||
|
DME expression in the diseased tissue of patients
DME expression in the normal tissue of healthy individuals
|
|||||
| Violin Diagram of DME Disease-specific Protein Abundances |
|
Click to View the Clearer Original Diagram | |||
| ICD-11: 3A70 | Aplastic anaemia | Click to Show/Hide | |||
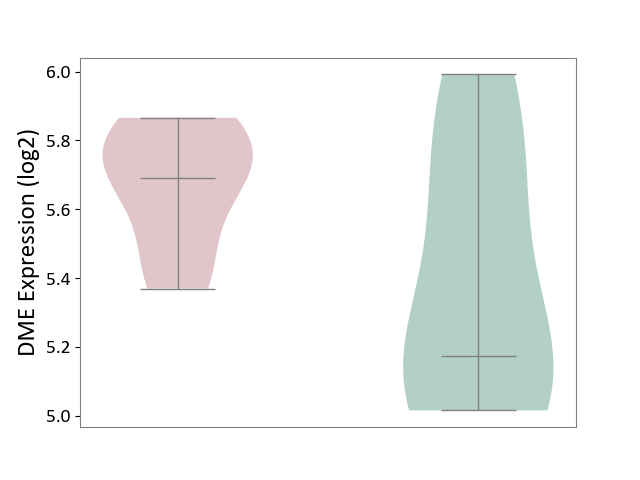
| The Studied Tissue | Bone marrow | ||||
| The Specified Disease | Shwachman-Diamond syndrome [ICD-11:3A70.0] | ||||
| The Expression Level of Disease Section Compare with the Healthy Individual Tissue | p-value: 1.21E-01; Fold-change: 5.16E-01; Z-score: 1.33E+00 | ||||
|
DME expression in the diseased tissue of patients
DME expression in the normal tissue of healthy individuals
|
|||||
| Violin Diagram of DME Disease-specific Protein Abundances |
|
Click to View the Clearer Original Diagram | |||
| ICD-11: 3B63 | Thrombocytosis | Click to Show/Hide | |||
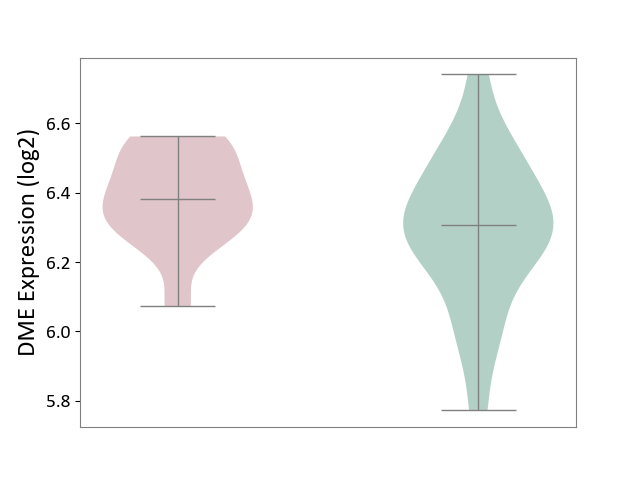
| The Studied Tissue | Whole blood | ||||
| The Specified Disease | Thrombocythemia [ICD-11:3B63] | ||||
| The Expression Level of Disease Section Compare with the Healthy Individual Tissue | p-value: 4.18E-02; Fold-change: 7.53E-02; Z-score: 3.45E-01 | ||||
|
DME expression in the diseased tissue of patients
DME expression in the normal tissue of healthy individuals
|
|||||
| Violin Diagram of DME Disease-specific Protein Abundances |
|
Click to View the Clearer Original Diagram | |||
| ICD-11: 3B64 | Thrombocytopenia | Click to Show/Hide | |||
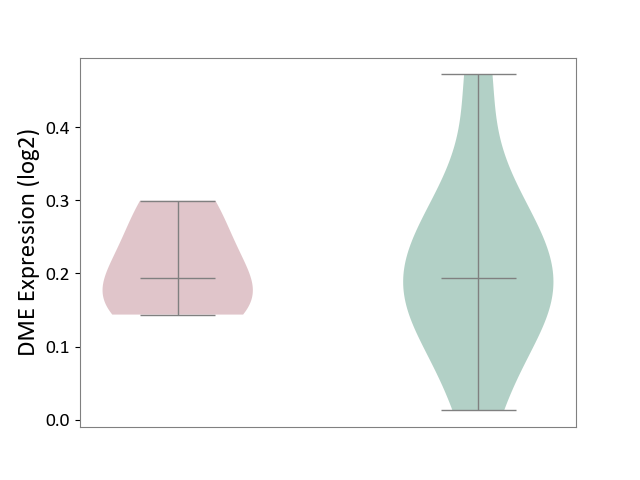
| The Studied Tissue | Whole blood | ||||
| The Specified Disease | Thrombocytopenia [ICD-11:3B64] | ||||
| The Expression Level of Disease Section Compare with the Healthy Individual Tissue | p-value: 9.69E-01; Fold-change: 4.32E-04; Z-score: 3.45E-03 | ||||
|
DME expression in the diseased tissue of patients
DME expression in the normal tissue of healthy individuals
|
|||||
| Violin Diagram of DME Disease-specific Protein Abundances |
|
Click to View the Clearer Original Diagram | |||
| ICD Disease Classification 04 | Immune system disease | Click to Show/Hide | |||
| ICD-11: 4A00 | Immunodeficiency | Click to Show/Hide | |||
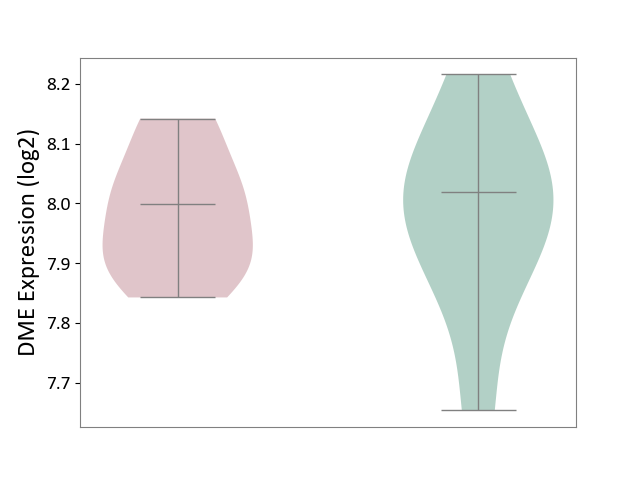
| The Studied Tissue | Peripheral blood | ||||
| The Specified Disease | Immunodeficiency [ICD-11:4A00-4A20] | ||||
| The Expression Level of Disease Section Compare with the Healthy Individual Tissue | p-value: 9.43E-01; Fold-change: -2.09E-02; Z-score: -1.29E-01 | ||||
|
DME expression in the diseased tissue of patients
DME expression in the normal tissue of healthy individuals
|
|||||
| Violin Diagram of DME Disease-specific Protein Abundances |
|
Click to View the Clearer Original Diagram | |||
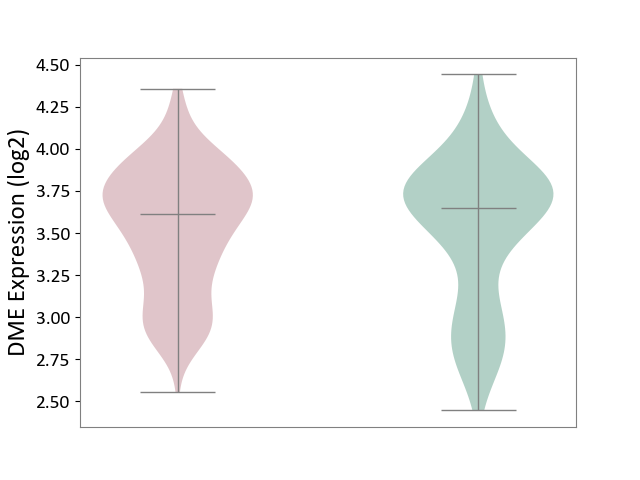
| ICD-11: 4A40 | Lupus erythematosus | Click to Show/Hide | |||
| The Studied Tissue | Whole blood | ||||
| The Specified Disease | Lupus erythematosus [ICD-11:4A40] | ||||
| The Expression Level of Disease Section Compare with the Healthy Individual Tissue | p-value: 8.68E-01; Fold-change: -3.49E-02; Z-score: -8.01E-02 | ||||
|
DME expression in the diseased tissue of patients
DME expression in the normal tissue of healthy individuals
|
|||||
| Violin Diagram of DME Disease-specific Protein Abundances |
|
Click to View the Clearer Original Diagram | |||
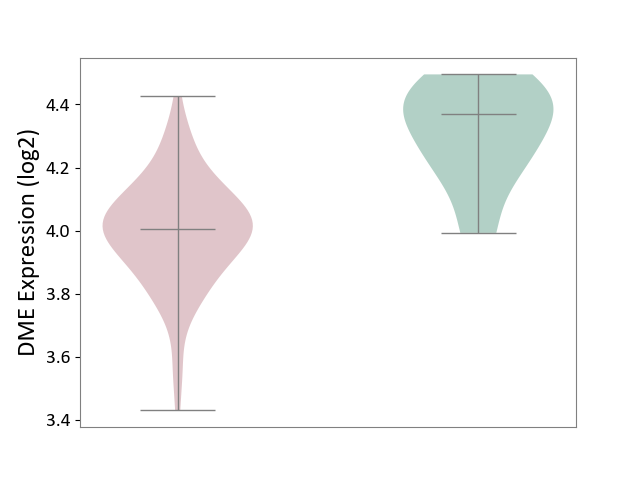
| ICD-11: 4A42 | Systemic sclerosis | Click to Show/Hide | |||
| The Studied Tissue | Whole blood | ||||
| The Specified Disease | Scleroderma [ICD-11:4A42.Z] | ||||
| The Expression Level of Disease Section Compare with the Healthy Individual Tissue | p-value: 2.23E-04; Fold-change: -3.65E-01; Z-score: -2.31E+00 | ||||
|
DME expression in the diseased tissue of patients
DME expression in the normal tissue of healthy individuals
|
|||||
| Violin Diagram of DME Disease-specific Protein Abundances |
|
Click to View the Clearer Original Diagram | |||
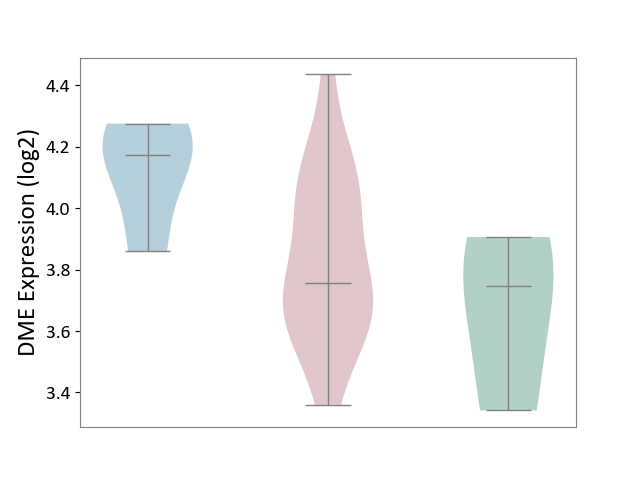
| ICD-11: 4A43 | Systemic autoimmune disease | Click to Show/Hide | |||
| The Studied Tissue | Salivary gland tissue | ||||
| The Specified Disease | Sjogren's syndrome [ICD-11:4A43.2] | ||||
| The Expression Level of Disease Section Compare with the Healthy Individual Tissue | p-value: 4.22E-01; Fold-change: 9.30E-03; Z-score: 3.20E-02 | ||||
| The Expression Level of Disease Section Compare with the Adjacent Tissue | p-value: 4.14E-02; Fold-change: -4.16E-01; Z-score: -2.26E+00 | ||||
|
DME expression in the diseased tissue of patients
DME expression in the normal tissue adjacent to the diseased tissue of patients
DME expression in the normal tissue of healthy individuals
|
|||||
| Violin Diagram of DME Disease-specific Protein Abundances |
|
Click to View the Clearer Original Diagram | |||
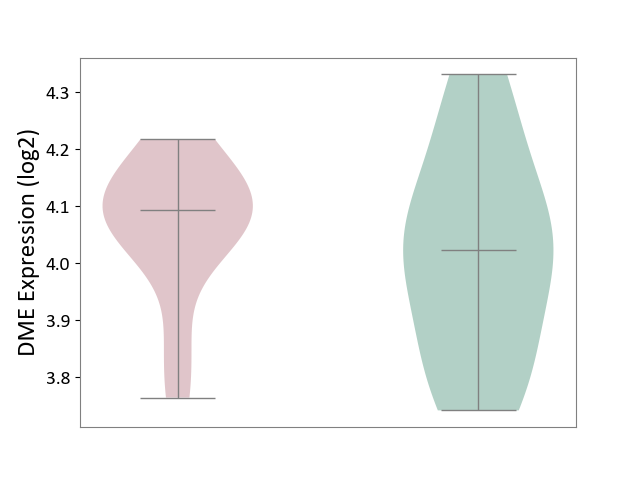
| ICD-11: 4A62 | Behcet disease | Click to Show/Hide | |||
| The Studied Tissue | Peripheral blood | ||||
| The Specified Disease | Behcet's disease [ICD-11:4A62] | ||||
| The Expression Level of Disease Section Compare with the Healthy Individual Tissue | p-value: 4.44E-01; Fold-change: 6.98E-02; Z-score: 3.83E-01 | ||||
|
DME expression in the diseased tissue of patients
DME expression in the normal tissue of healthy individuals
|
|||||
| Violin Diagram of DME Disease-specific Protein Abundances |
|
Click to View the Clearer Original Diagram | |||
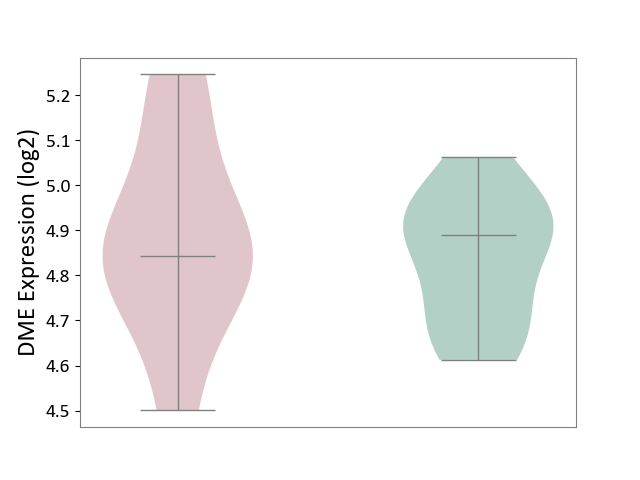
| ICD-11: 4B04 | Monocyte count disorder | Click to Show/Hide | |||
| The Studied Tissue | Whole blood | ||||
| The Specified Disease | Autosomal dominant monocytopenia [ICD-11:4B04] | ||||
| The Expression Level of Disease Section Compare with the Healthy Individual Tissue | p-value: 6.22E-01; Fold-change: -4.70E-02; Z-score: -3.26E-01 | ||||
|
DME expression in the diseased tissue of patients
DME expression in the normal tissue of healthy individuals
|
|||||
| Violin Diagram of DME Disease-specific Protein Abundances |
|
Click to View the Clearer Original Diagram | |||
| ICD Disease Classification 05 | Endocrine/nutritional/metabolic disease | Click to Show/Hide | |||
| ICD-11: 5A11 | Type 2 diabetes mellitus | Click to Show/Hide | |||
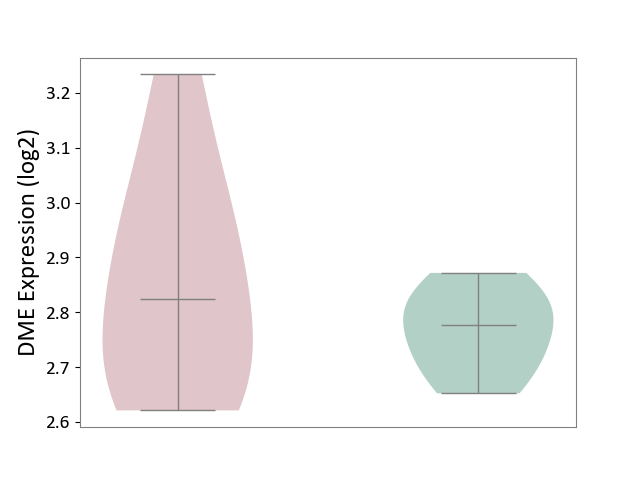
| The Studied Tissue | Omental adipose tissue | ||||
| The Specified Disease | Obesity related type 2 diabetes [ICD-11:5A11] | ||||
| The Expression Level of Disease Section Compare with the Healthy Individual Tissue | p-value: 2.69E-01; Fold-change: 4.67E-02; Z-score: 5.90E-01 | ||||
|
DME expression in the diseased tissue of patients
DME expression in the normal tissue of healthy individuals
|
|||||
| Violin Diagram of DME Disease-specific Protein Abundances |
|
Click to View the Clearer Original Diagram | |||
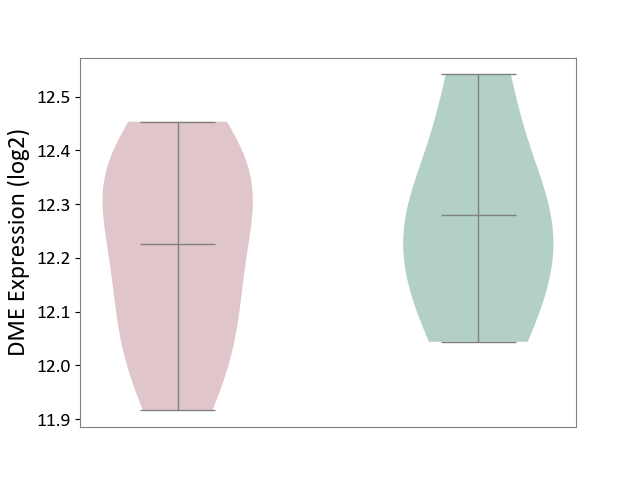
| The Studied Tissue | Liver tissue | ||||
| The Specified Disease | Type 2 diabetes [ICD-11:5A11] | ||||
| The Expression Level of Disease Section Compare with the Healthy Individual Tissue | p-value: 5.93E-01; Fold-change: -5.40E-02; Z-score: -2.92E-01 | ||||
|
DME expression in the diseased tissue of patients
DME expression in the normal tissue of healthy individuals
|
|||||
| Violin Diagram of DME Disease-specific Protein Abundances |
|
Click to View the Clearer Original Diagram | |||
| ICD-11: 5A80 | Ovarian dysfunction | Click to Show/Hide | |||
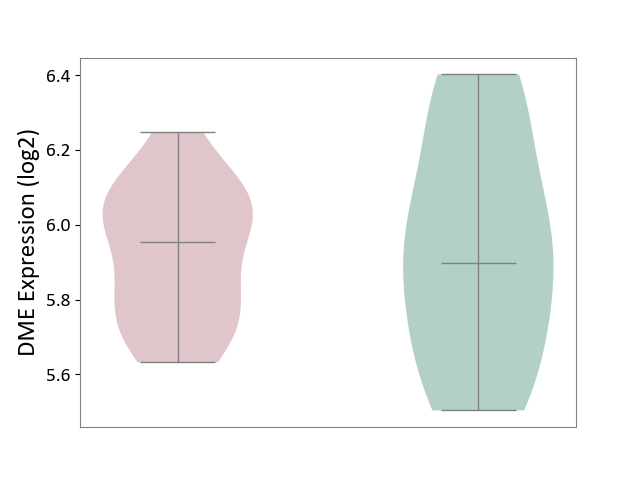
| The Studied Tissue | Vastus lateralis muscle | ||||
| The Specified Disease | Polycystic ovary syndrome [ICD-11:5A80.1] | ||||
| The Expression Level of Disease Section Compare with the Healthy Individual Tissue | p-value: 8.74E-01; Fold-change: 5.62E-02; Z-score: 1.87E-01 | ||||
|
DME expression in the diseased tissue of patients
DME expression in the normal tissue of healthy individuals
|
|||||
| Violin Diagram of DME Disease-specific Protein Abundances |
|
Click to View the Clearer Original Diagram | |||
| ICD-11: 5C51 | Inborn carbohydrate metabolism disorder | Click to Show/Hide | |||
| The Studied Tissue | Biceps muscle | ||||
| The Specified Disease | Pompe disease [ICD-11:5C51.3] | ||||
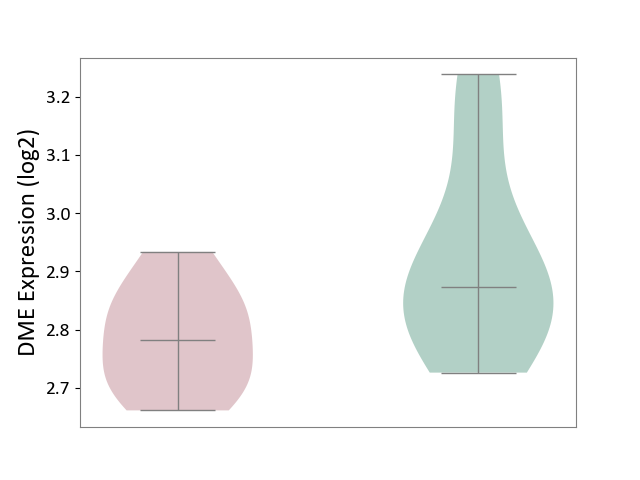
| The Expression Level of Disease Section Compare with the Healthy Individual Tissue | p-value: 4.55E-02; Fold-change: -8.95E-02; Z-score: -5.46E-01 | ||||
|
DME expression in the diseased tissue of patients
DME expression in the normal tissue of healthy individuals
|
|||||
| Violin Diagram of DME Disease-specific Protein Abundances |
|
Click to View the Clearer Original Diagram | |||
| ICD-11: 5C56 | Lysosomal disease | Click to Show/Hide | |||
| The Studied Tissue | Whole blood | ||||
| The Specified Disease | Batten disease [ICD-11:5C56.1] | ||||
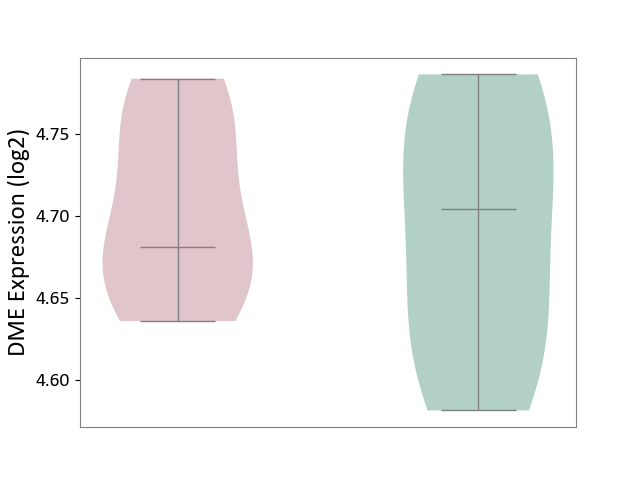
| The Expression Level of Disease Section Compare with the Healthy Individual Tissue | p-value: 6.95E-01; Fold-change: -2.28E-02; Z-score: -2.92E-01 | ||||
|
DME expression in the diseased tissue of patients
DME expression in the normal tissue of healthy individuals
|
|||||
| Violin Diagram of DME Disease-specific Protein Abundances |
|
Click to View the Clearer Original Diagram | |||
| ICD-11: 5C80 | Hyperlipoproteinaemia | Click to Show/Hide | |||
| The Studied Tissue | Peripheral blood | ||||
| The Specified Disease | Familial hypercholesterolemia [ICD-11:5C80.00] | ||||
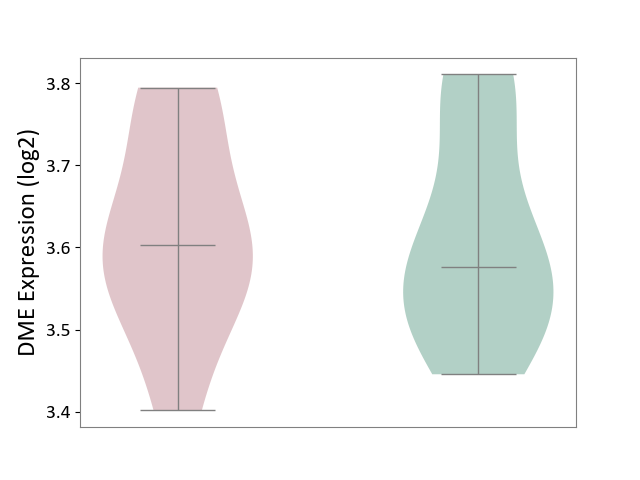
| The Expression Level of Disease Section Compare with the Healthy Individual Tissue | p-value: 9.22E-01; Fold-change: 2.66E-02; Z-score: 2.11E-01 | ||||
|
DME expression in the diseased tissue of patients
DME expression in the normal tissue of healthy individuals
|
|||||
| Violin Diagram of DME Disease-specific Protein Abundances |
|
Click to View the Clearer Original Diagram | |||
| The Studied Tissue | Whole blood | ||||
| The Specified Disease | Familial hypercholesterolemia [ICD-11:5C80.00] | ||||
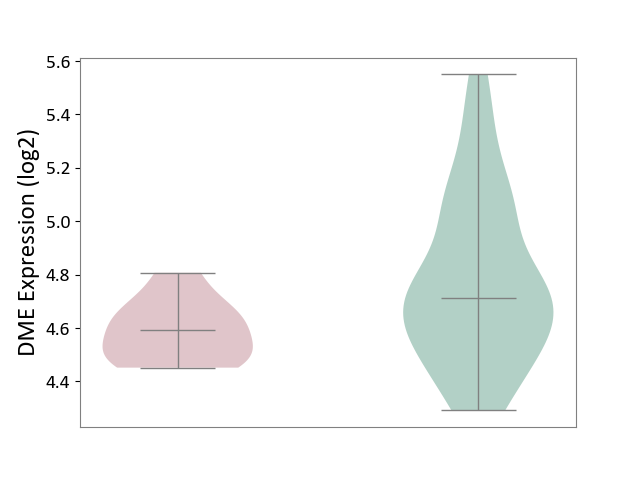
| The Expression Level of Disease Section Compare with the Healthy Individual Tissue | p-value: 2.63E-03; Fold-change: -1.18E-01; Z-score: -3.80E-01 | ||||
|
DME expression in the diseased tissue of patients
DME expression in the normal tissue of healthy individuals
|
|||||
| Violin Diagram of DME Disease-specific Protein Abundances |
|
Click to View the Clearer Original Diagram | |||
| ICD Disease Classification 06 | Mental/behavioural/neurodevelopmental disorder | Click to Show/Hide | |||
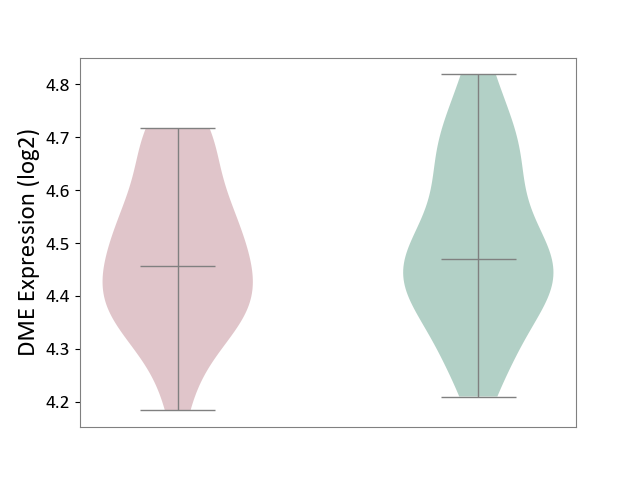
| ICD-11: 6A02 | Autism spectrum disorder | Click to Show/Hide | |||
| The Studied Tissue | Whole blood | ||||
| The Specified Disease | Autism [ICD-11:6A02] | ||||
| The Expression Level of Disease Section Compare with the Healthy Individual Tissue | p-value: 5.66E-01; Fold-change: -1.19E-02; Z-score: -7.61E-02 | ||||
|
DME expression in the diseased tissue of patients
DME expression in the normal tissue of healthy individuals
|
|||||
| Violin Diagram of DME Disease-specific Protein Abundances |
|
Click to View the Clearer Original Diagram | |||
| ICD-11: 6A20 | Schizophrenia | Click to Show/Hide | |||
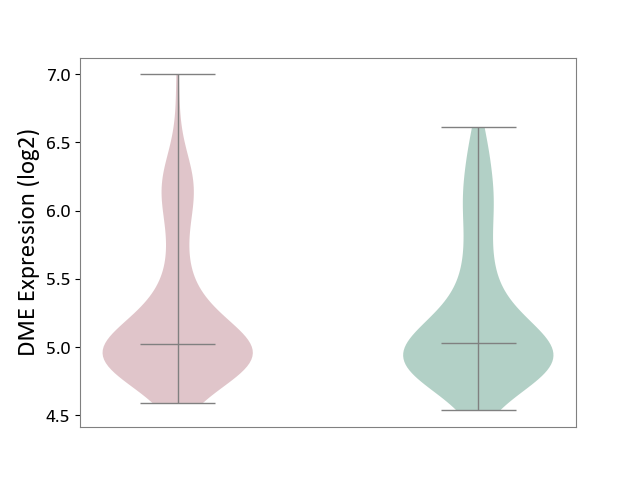
| The Studied Tissue | Prefrontal cortex | ||||
| The Specified Disease | Schizophrenia [ICD-11:6A20] | ||||
| The Expression Level of Disease Section Compare with the Healthy Individual Tissue | p-value: 8.99E-01; Fold-change: -6.93E-03; Z-score: -1.36E-02 | ||||
|
DME expression in the diseased tissue of patients
DME expression in the normal tissue of healthy individuals
|
|||||
| Violin Diagram of DME Disease-specific Protein Abundances |
|
Click to View the Clearer Original Diagram | |||
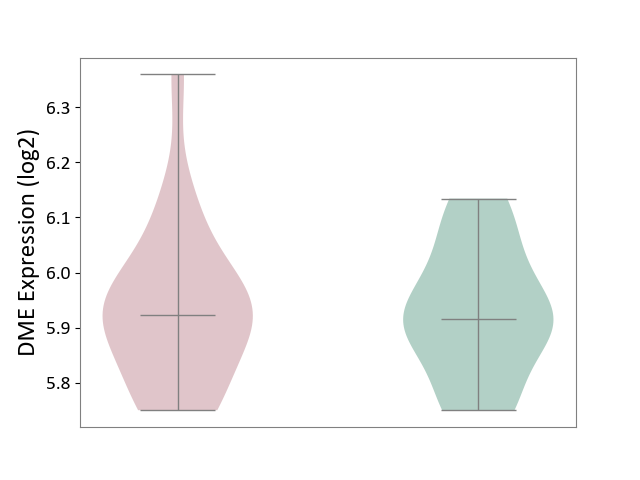
| The Studied Tissue | Superior temporal cortex | ||||
| The Specified Disease | Schizophrenia [ICD-11:6A20] | ||||
| The Expression Level of Disease Section Compare with the Healthy Individual Tissue | p-value: 9.21E-01; Fold-change: 7.31E-03; Z-score: 6.10E-02 | ||||
|
DME expression in the diseased tissue of patients
DME expression in the normal tissue of healthy individuals
|
|||||
| Violin Diagram of DME Disease-specific Protein Abundances |
|
Click to View the Clearer Original Diagram | |||
| ICD-11: 6A60 | Bipolar disorder | Click to Show/Hide | |||
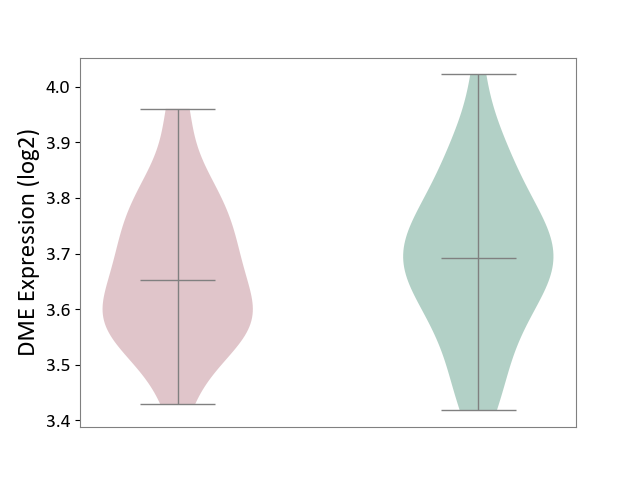
| The Studied Tissue | Prefrontal cortex | ||||
| The Specified Disease | Bipolar disorder [ICD-11:6A60-6A6Z] | ||||
| The Expression Level of Disease Section Compare with the Healthy Individual Tissue | p-value: 4.05E-01; Fold-change: -3.98E-02; Z-score: -2.83E-01 | ||||
|
DME expression in the diseased tissue of patients
DME expression in the normal tissue of healthy individuals
|
|||||
| Violin Diagram of DME Disease-specific Protein Abundances |
|
Click to View the Clearer Original Diagram | |||
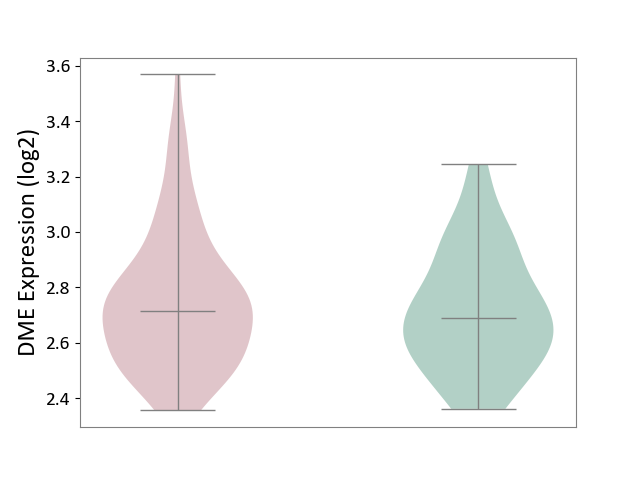
| ICD-11: 6A70 | Depressive disorder | Click to Show/Hide | |||
| The Studied Tissue | Whole blood | ||||
| The Specified Disease | Major depressive disorder [ICD-11:6A70-6A7Z] | ||||
| The Expression Level of Disease Section Compare with the Healthy Individual Tissue | p-value: 4.67E-01; Fold-change: 2.59E-02; Z-score: 1.20E-01 | ||||
|
DME expression in the diseased tissue of patients
DME expression in the normal tissue of healthy individuals
|
|||||
| Violin Diagram of DME Disease-specific Protein Abundances |
|
Click to View the Clearer Original Diagram | |||
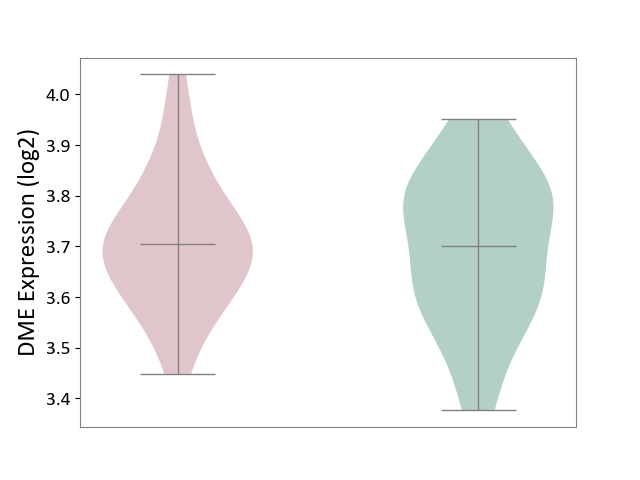
| The Studied Tissue | Hippocampus | ||||
| The Specified Disease | Major depressive disorder [ICD-11:6A70-6A7Z] | ||||
| The Expression Level of Disease Section Compare with the Healthy Individual Tissue | p-value: 7.83E-01; Fold-change: 2.32E-03; Z-score: 1.53E-02 | ||||
|
DME expression in the diseased tissue of patients
DME expression in the normal tissue of healthy individuals
|
|||||
| Violin Diagram of DME Disease-specific Protein Abundances |
|
Click to View the Clearer Original Diagram | |||
| ICD Disease Classification 08 | Nervous system disease | Click to Show/Hide | |||
| ICD-11: 8A00 | Parkinsonism | Click to Show/Hide | |||
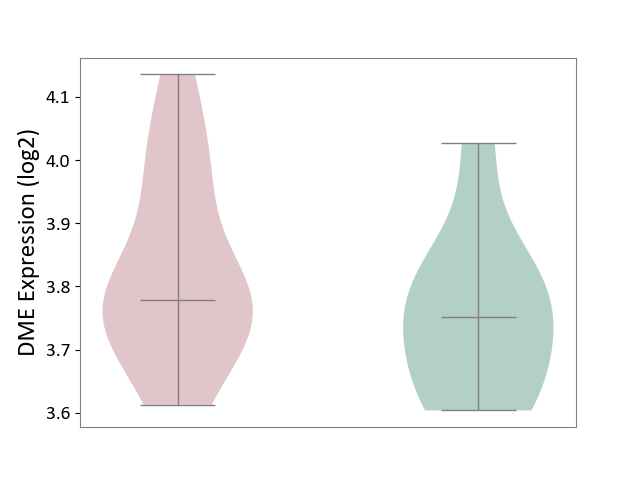
| The Studied Tissue | Substantia nigra tissue | ||||
| The Specified Disease | Parkinson's disease [ICD-11:8A00.0] | ||||
| The Expression Level of Disease Section Compare with the Healthy Individual Tissue | p-value: 2.35E-01; Fold-change: 2.78E-02; Z-score: 2.09E-01 | ||||
|
DME expression in the diseased tissue of patients
DME expression in the normal tissue of healthy individuals
|
|||||
| Violin Diagram of DME Disease-specific Protein Abundances |
|
Click to View the Clearer Original Diagram | |||
| ICD-11: 8A01 | Choreiform disorder | Click to Show/Hide | |||
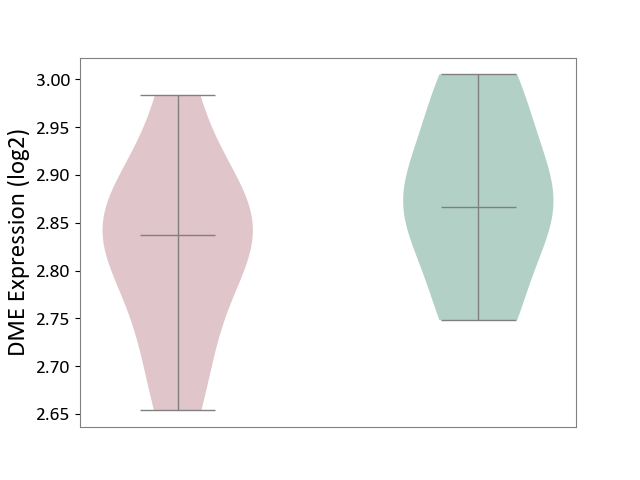
| The Studied Tissue | Whole blood | ||||
| The Specified Disease | Huntington's disease [ICD-11:8A01.10] | ||||
| The Expression Level of Disease Section Compare with the Healthy Individual Tissue | p-value: 2.24E-01; Fold-change: -2.99E-02; Z-score: -3.40E-01 | ||||
|
DME expression in the diseased tissue of patients
DME expression in the normal tissue of healthy individuals
|
|||||
| Violin Diagram of DME Disease-specific Protein Abundances |
|
Click to View the Clearer Original Diagram | |||
| ICD-11: 8A20 | Alzheimer disease | Click to Show/Hide | |||
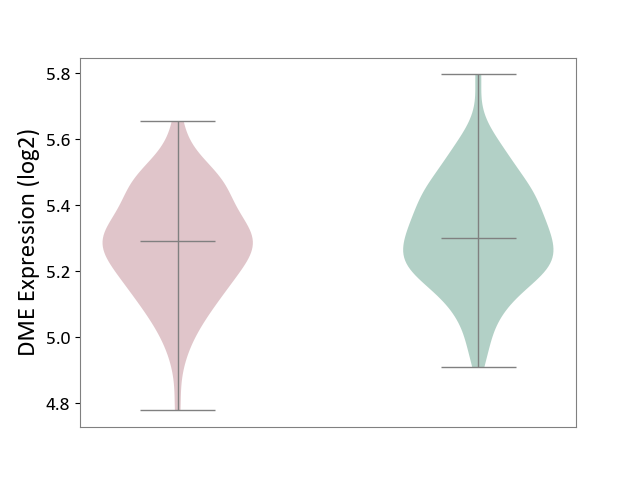
| The Studied Tissue | Entorhinal cortex | ||||
| The Specified Disease | Alzheimer's disease [ICD-11:8A20] | ||||
| The Expression Level of Disease Section Compare with the Healthy Individual Tissue | p-value: 1.90E-01; Fold-change: -9.81E-03; Z-score: -5.96E-02 | ||||
|
DME expression in the diseased tissue of patients
DME expression in the normal tissue of healthy individuals
|
|||||
| Violin Diagram of DME Disease-specific Protein Abundances |
|
Click to View the Clearer Original Diagram | |||
| ICD-11: 8A2Y | Neurocognitive impairment | Click to Show/Hide | |||
| The Studied Tissue | White matter tissue | ||||
| The Specified Disease | HIV-associated neurocognitive impairment [ICD-11:8A2Y-8A2Z] | ||||
| The Expression Level of Disease Section Compare with the Healthy Individual Tissue | p-value: 8.29E-02; Fold-change: -2.43E-02; Z-score: -8.06E-02 | ||||
|
DME expression in the diseased tissue of patients
DME expression in the normal tissue of healthy individuals
|
|||||
| Violin Diagram of DME Disease-specific Protein Abundances |
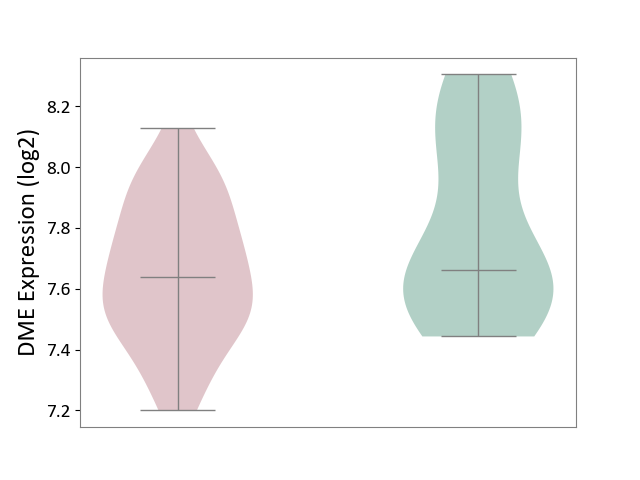
|
Click to View the Clearer Original Diagram | |||
| ICD-11: 8A40 | Multiple sclerosis | Click to Show/Hide | |||
| The Studied Tissue | Plasmacytoid dendritic cells | ||||
| The Specified Disease | Multiple sclerosis [ICD-11:8A40] | ||||
| The Expression Level of Disease Section Compare with the Healthy Individual Tissue | p-value: 9.09E-01; Fold-change: -9.26E-02; Z-score: -3.68E-01 | ||||
|
DME expression in the diseased tissue of patients
DME expression in the normal tissue of healthy individuals
|
|||||
| Violin Diagram of DME Disease-specific Protein Abundances |
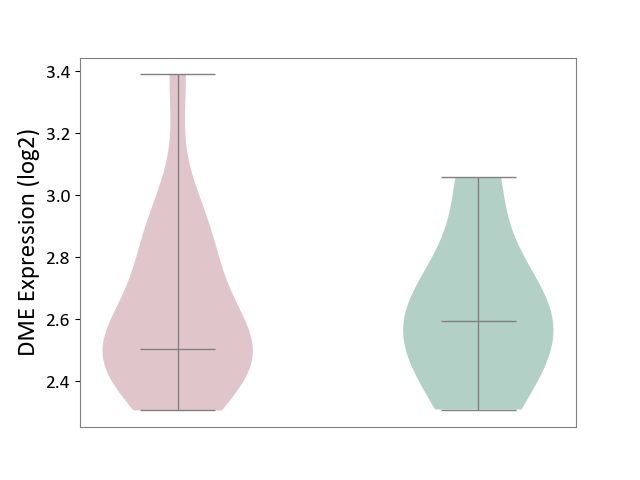
|
Click to View the Clearer Original Diagram | |||
| The Studied Tissue | Spinal cord | ||||
| The Specified Disease | Multiple sclerosis [ICD-11:8A40] | ||||
| The Expression Level of Disease Section Compare with the Adjacent Tissue | p-value: 3.71E-01; Fold-change: -1.39E-01; Z-score: -8.19E-01 | ||||
|
DME expression in the diseased tissue of patients
DME expression in the normal tissue adjacent to the diseased tissue of patients
|
|||||
| Violin Diagram of DME Disease-specific Protein Abundances |
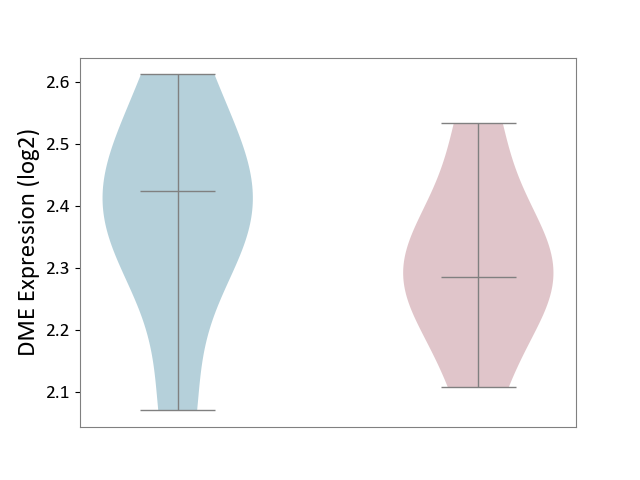
|
Click to View the Clearer Original Diagram | |||
| ICD-11: 8A60 | Epilepsy | Click to Show/Hide | |||
| The Studied Tissue | Peritumoral cortex tissue | ||||
| The Specified Disease | Epilepsy [ICD-11:8A60-8A6Z] | ||||
| The Expression Level of Disease Section Compare with the Other Disease Section | p-value: 2.08E-01; Fold-change: 1.24E-01; Z-score: 6.43E-01 | ||||
|
DME expression in the diseased tissue of patients
DME expression in tissue other than the diseased tissue of patients
|
|||||
| Violin Diagram of DME Disease-specific Protein Abundances |
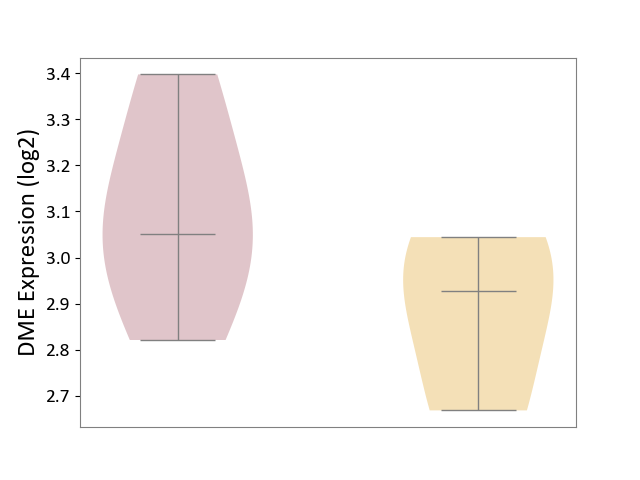
|
Click to View the Clearer Original Diagram | |||
| The Studied Tissue | Whole blood | ||||
| The Specified Disease | Seizure [ICD-11:8A60-8A6Z] | ||||
| The Expression Level of Disease Section Compare with the Healthy Individual Tissue | p-value: 8.61E-01; Fold-change: 1.32E-01; Z-score: 7.15E-01 | ||||
|
DME expression in the diseased tissue of patients
DME expression in the normal tissue of healthy individuals
|
|||||
| Violin Diagram of DME Disease-specific Protein Abundances |
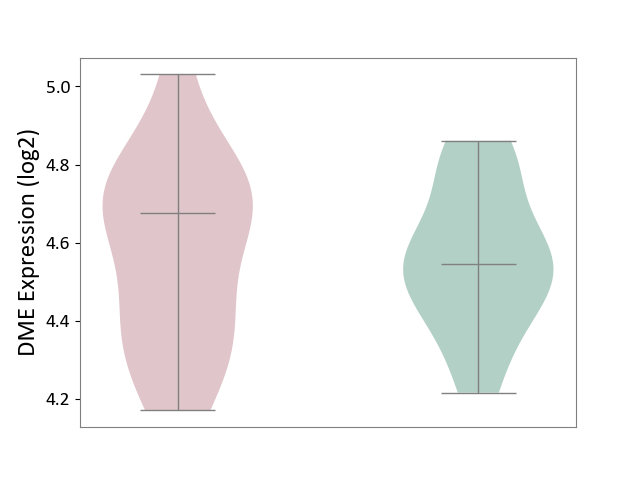
|
Click to View the Clearer Original Diagram | |||
| ICD-11: 8B01 | Subarachnoid haemorrhage | Click to Show/Hide | |||
| The Studied Tissue | Intracranial artery | ||||
| The Specified Disease | Intracranial aneurysm [ICD-11:8B01.0] | ||||
| The Expression Level of Disease Section Compare with the Healthy Individual Tissue | p-value: 7.35E-01; Fold-change: 7.01E-02; Z-score: 4.26E-01 | ||||
|
DME expression in the diseased tissue of patients
DME expression in the normal tissue of healthy individuals
|
|||||
| Violin Diagram of DME Disease-specific Protein Abundances |
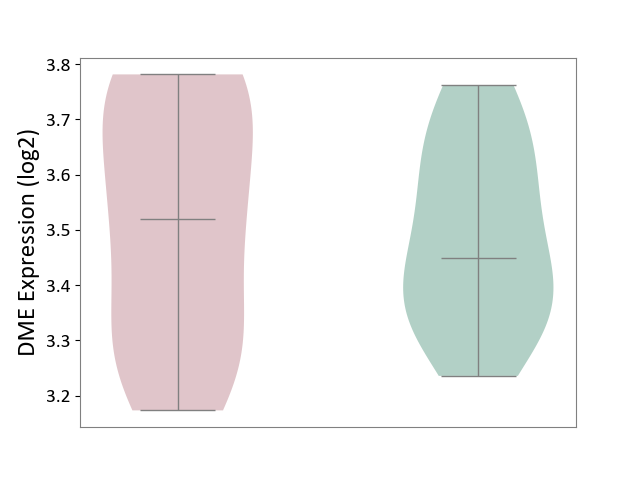
|
Click to View the Clearer Original Diagram | |||
| ICD-11: 8B11 | Cerebral ischaemic stroke | Click to Show/Hide | |||
| The Studied Tissue | Whole blood | ||||
| The Specified Disease | Cardioembolic stroke [ICD-11:8B11.20] | ||||
| The Expression Level of Disease Section Compare with the Healthy Individual Tissue | p-value: 2.76E-04; Fold-change: 1.36E-01; Z-score: 1.00E+00 | ||||
|
DME expression in the diseased tissue of patients
DME expression in the normal tissue of healthy individuals
|
|||||
| Violin Diagram of DME Disease-specific Protein Abundances |
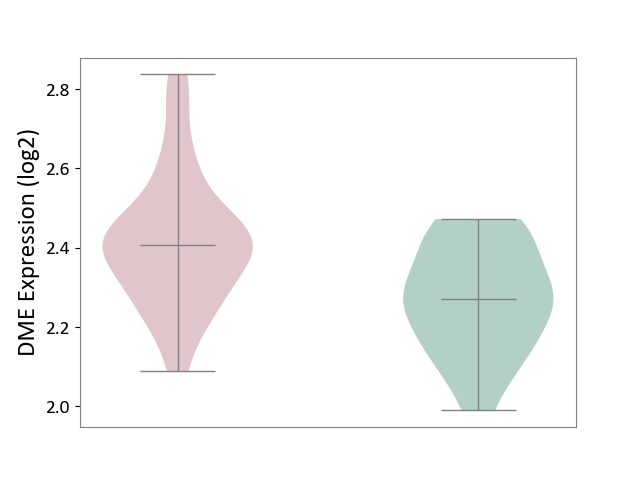
|
Click to View the Clearer Original Diagram | |||
| The Studied Tissue | Peripheral blood | ||||
| The Specified Disease | Ischemic stroke [ICD-11:8B11] | ||||
| The Expression Level of Disease Section Compare with the Healthy Individual Tissue | p-value: 3.86E-01; Fold-change: 6.16E-02; Z-score: 2.91E-01 | ||||
|
DME expression in the diseased tissue of patients
DME expression in the normal tissue of healthy individuals
|
|||||
| Violin Diagram of DME Disease-specific Protein Abundances |
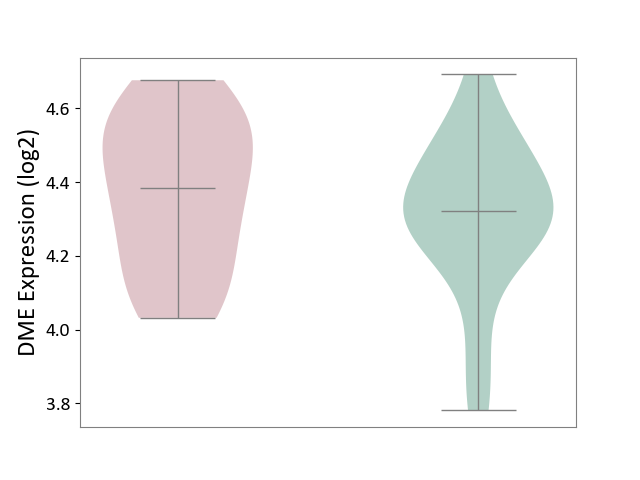
|
Click to View the Clearer Original Diagram | |||
| ICD-11: 8B60 | Motor neuron disease | Click to Show/Hide | |||
| The Studied Tissue | Skin | ||||
| The Specified Disease | Lateral sclerosis [ICD-11:8B60.4] | ||||
| The Expression Level of Disease Section Compare with the Healthy Individual Tissue | p-value: 9.31E-01; Fold-change: 2.00E-02; Z-score: 1.82E-01 | ||||
|
DME expression in the diseased tissue of patients
DME expression in the normal tissue of healthy individuals
|
|||||
| Violin Diagram of DME Disease-specific Protein Abundances |
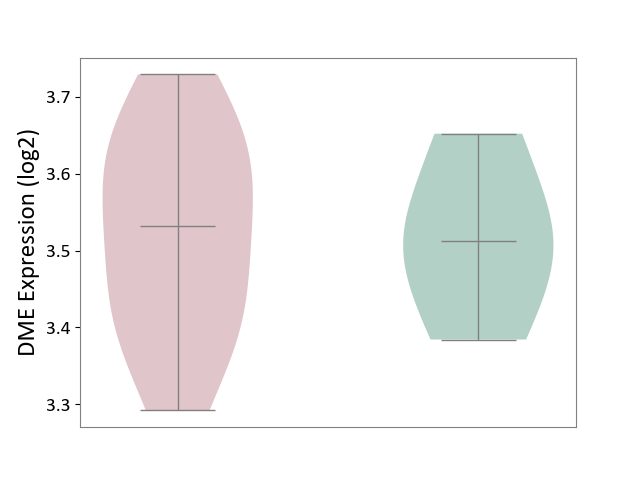
|
Click to View the Clearer Original Diagram | |||
| The Studied Tissue | Cervical spinal cord | ||||
| The Specified Disease | Lateral sclerosis [ICD-11:8B60.4] | ||||
| The Expression Level of Disease Section Compare with the Healthy Individual Tissue | p-value: 2.00E-01; Fold-change: 4.21E-02; Z-score: 3.26E-01 | ||||
|
DME expression in the diseased tissue of patients
DME expression in the normal tissue of healthy individuals
|
|||||
| Violin Diagram of DME Disease-specific Protein Abundances |
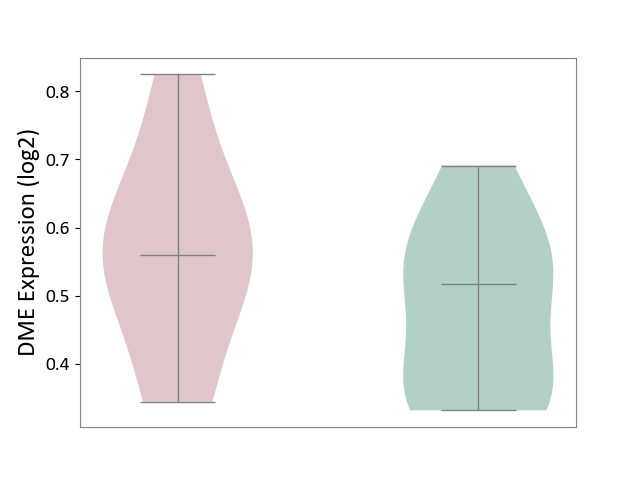
|
Click to View the Clearer Original Diagram | |||
| ICD-11: 8C70 | Muscular dystrophy | Click to Show/Hide | |||
| The Studied Tissue | Muscle tissue | ||||
| The Specified Disease | Myopathy [ICD-11:8C70.6] | ||||
| The Expression Level of Disease Section Compare with the Healthy Individual Tissue | p-value: 1.14E-01; Fold-change: -1.32E-01; Z-score: -7.08E-01 | ||||
|
DME expression in the diseased tissue of patients
DME expression in the normal tissue of healthy individuals
|
|||||
| Violin Diagram of DME Disease-specific Protein Abundances |
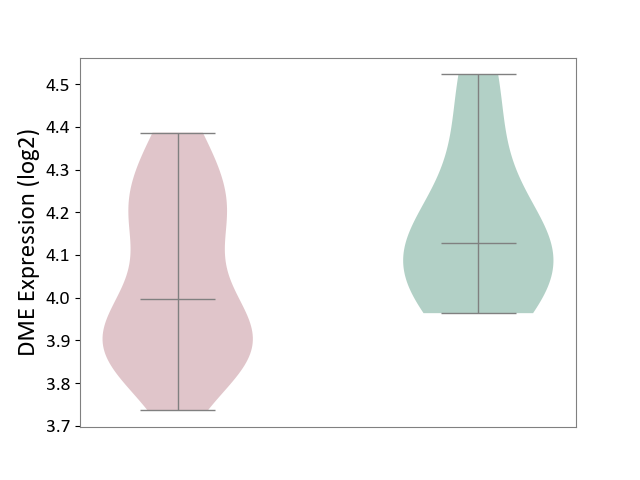
|
Click to View the Clearer Original Diagram | |||
| ICD-11: 8C75 | Distal myopathy | Click to Show/Hide | |||
| The Studied Tissue | Muscle tissue | ||||
| The Specified Disease | Tibial muscular dystrophy [ICD-11:8C75] | ||||
| The Expression Level of Disease Section Compare with the Healthy Individual Tissue | p-value: 3.55E-01; Fold-change: -9.41E-02; Z-score: -5.58E-01 | ||||
|
DME expression in the diseased tissue of patients
DME expression in the normal tissue of healthy individuals
|
|||||
| Violin Diagram of DME Disease-specific Protein Abundances |
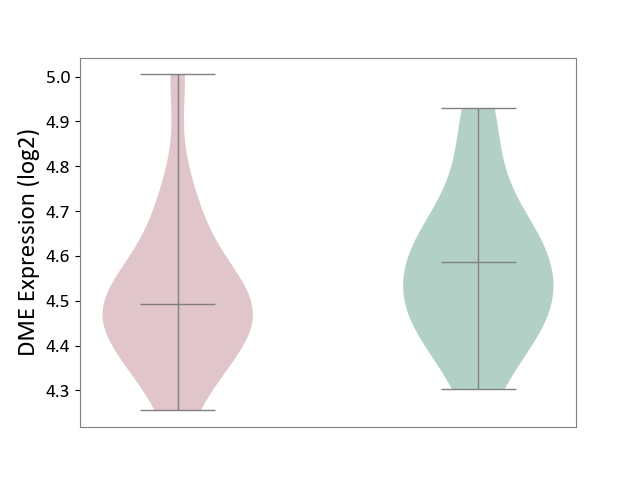
|
Click to View the Clearer Original Diagram | |||
| ICD Disease Classification 09 | Visual system disease | Click to Show/Hide | |||
| ICD-11: 9A96 | Anterior uveitis | Click to Show/Hide | |||
| The Studied Tissue | Peripheral monocyte | ||||
| The Specified Disease | Autoimmune uveitis [ICD-11:9A96] | ||||
| The Expression Level of Disease Section Compare with the Healthy Individual Tissue | p-value: 1.82E-01; Fold-change: -9.64E-02; Z-score: -5.91E-01 | ||||
|
DME expression in the diseased tissue of patients
DME expression in the normal tissue of healthy individuals
|
|||||
| Violin Diagram of DME Disease-specific Protein Abundances |
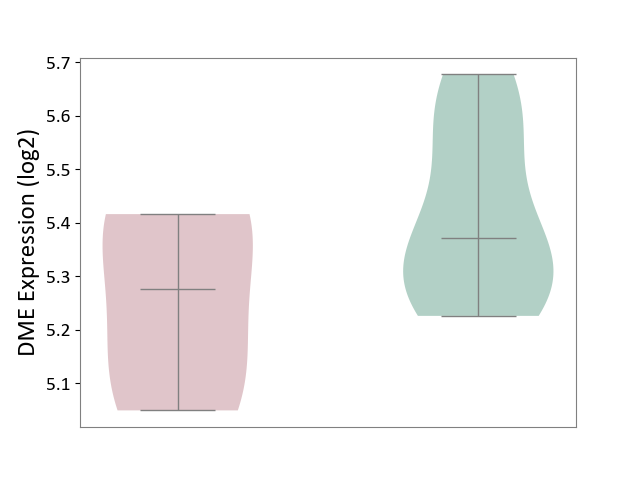
|
Click to View the Clearer Original Diagram | |||
| ICD Disease Classification 11 | Circulatory system disease | Click to Show/Hide | |||
| ICD-11: BA41 | Myocardial infarction | Click to Show/Hide | |||
| The Studied Tissue | Peripheral blood | ||||
| The Specified Disease | Myocardial infarction [ICD-11:BA41-BA50] | ||||
| The Expression Level of Disease Section Compare with the Healthy Individual Tissue | p-value: 6.91E-02; Fold-change: 2.91E-01; Z-score: 5.07E-01 | ||||
|
DME expression in the diseased tissue of patients
DME expression in the normal tissue of healthy individuals
|
|||||
| Violin Diagram of DME Disease-specific Protein Abundances |
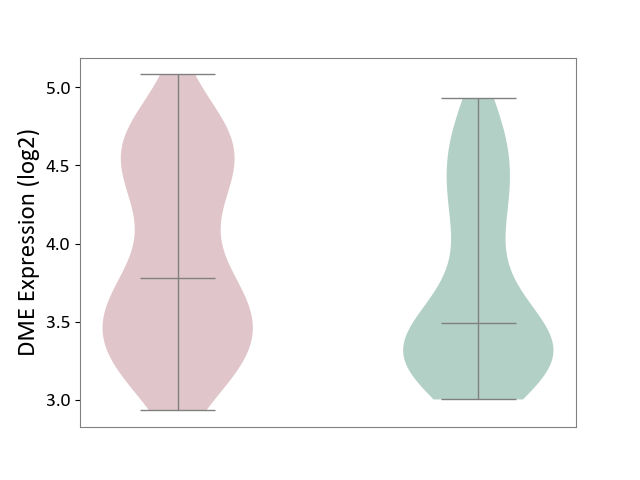
|
Click to View the Clearer Original Diagram | |||
| ICD-11: BA80 | Coronary artery disease | Click to Show/Hide | |||
| The Studied Tissue | Peripheral blood | ||||
| The Specified Disease | Coronary artery disease [ICD-11:BA80-BA8Z] | ||||
| The Expression Level of Disease Section Compare with the Healthy Individual Tissue | p-value: 5.20E-01; Fold-change: -2.18E-02; Z-score: -2.26E-01 | ||||
|
DME expression in the diseased tissue of patients
DME expression in the normal tissue of healthy individuals
|
|||||
| Violin Diagram of DME Disease-specific Protein Abundances |
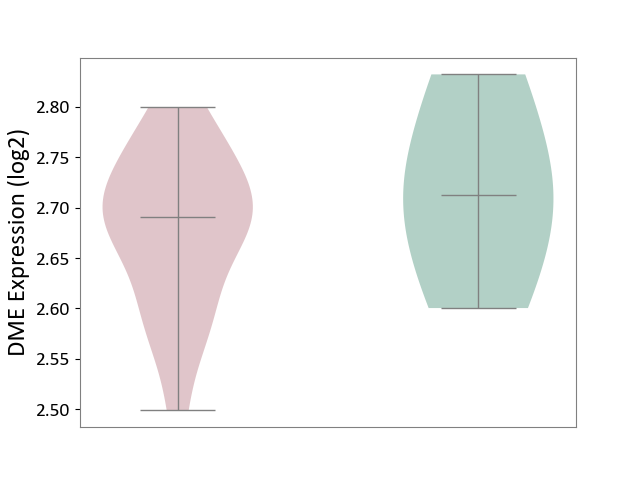
|
Click to View the Clearer Original Diagram | |||
| ICD-11: BB70 | Aortic valve stenosis | Click to Show/Hide | |||
| The Studied Tissue | Calcified aortic valve | ||||
| The Specified Disease | Aortic stenosis [ICD-11:BB70] | ||||
| The Expression Level of Disease Section Compare with the Healthy Individual Tissue | p-value: 9.97E-01; Fold-change: -3.93E-02; Z-score: -4.88E-02 | ||||
|
DME expression in the diseased tissue of patients
DME expression in the normal tissue of healthy individuals
|
|||||
| Violin Diagram of DME Disease-specific Protein Abundances |
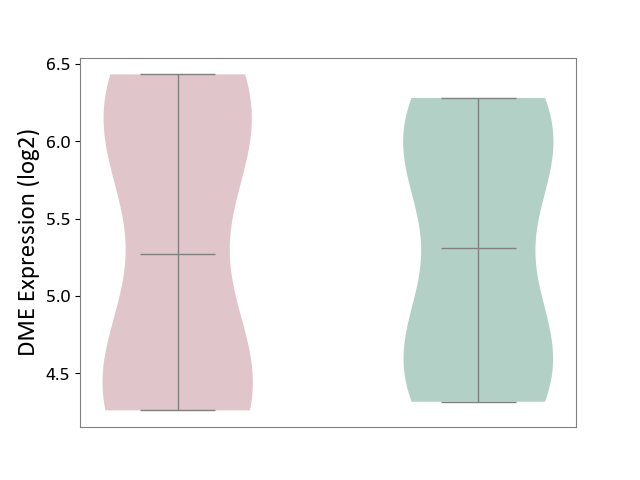
|
Click to View the Clearer Original Diagram | |||
| ICD Disease Classification 12 | Respiratory system disease | Click to Show/Hide | |||
| ICD-11: 7A40 | Central sleep apnoea | Click to Show/Hide | |||
| The Studied Tissue | Hyperplastic tonsil | ||||
| The Specified Disease | Apnea [ICD-11:7A40] | ||||
| The Expression Level of Disease Section Compare with the Healthy Individual Tissue | p-value: 2.42E-01; Fold-change: -1.95E-01; Z-score: -4.99E-01 | ||||
|
DME expression in the diseased tissue of patients
DME expression in the normal tissue of healthy individuals
|
|||||
| Violin Diagram of DME Disease-specific Protein Abundances |
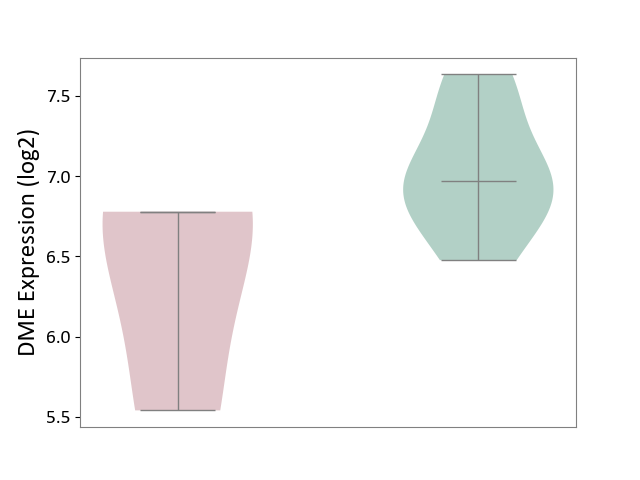
|
Click to View the Clearer Original Diagram | |||
| ICD-11: CA08 | Vasomotor or allergic rhinitis | Click to Show/Hide | |||
| The Studied Tissue | Peripheral blood | ||||
| The Specified Disease | Olive pollen allergy [ICD-11:CA08.00] | ||||
| The Expression Level of Disease Section Compare with the Healthy Individual Tissue | p-value: 2.96E-03; Fold-change: 2.40E-01; Z-score: 6.04E+00 | ||||
|
DME expression in the diseased tissue of patients
DME expression in the normal tissue of healthy individuals
|
|||||
| Violin Diagram of DME Disease-specific Protein Abundances |
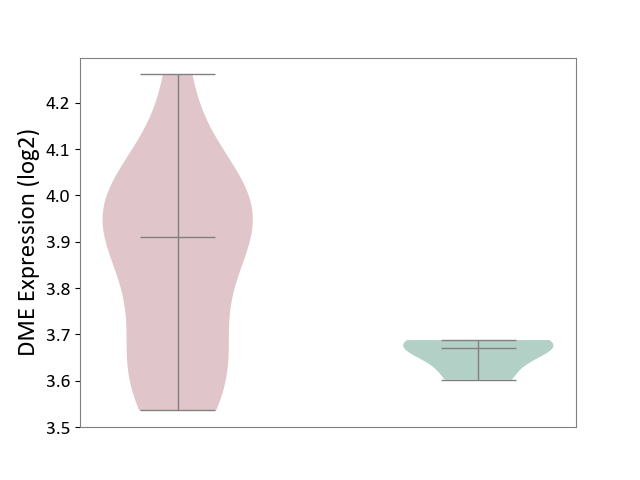
|
Click to View the Clearer Original Diagram | |||
| ICD-11: CA0A | Chronic rhinosinusitis | Click to Show/Hide | |||
| The Studied Tissue | Sinus mucosa tissue | ||||
| The Specified Disease | Chronic rhinosinusitis [ICD-11:CA0A] | ||||
| The Expression Level of Disease Section Compare with the Healthy Individual Tissue | p-value: 6.84E-01; Fold-change: 1.84E-02; Z-score: 1.37E-01 | ||||
|
DME expression in the diseased tissue of patients
DME expression in the normal tissue of healthy individuals
|
|||||
| Violin Diagram of DME Disease-specific Protein Abundances |
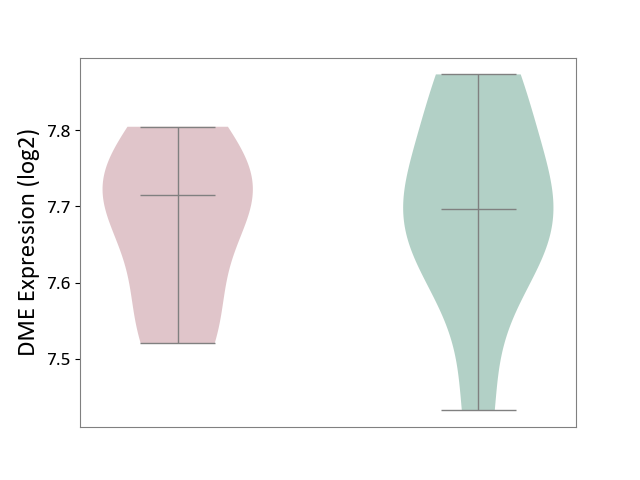
|
Click to View the Clearer Original Diagram | |||
| ICD-11: CA22 | Chronic obstructive pulmonary disease | Click to Show/Hide | |||
| The Studied Tissue | Lung tissue | ||||
| The Specified Disease | Chronic obstructive pulmonary disease [ICD-11:CA22] | ||||
| The Expression Level of Disease Section Compare with the Healthy Individual Tissue | p-value: 7.33E-02; Fold-change: 5.59E-02; Z-score: 2.99E-01 | ||||
|
DME expression in the diseased tissue of patients
DME expression in the normal tissue of healthy individuals
|
|||||
| Violin Diagram of DME Disease-specific Protein Abundances |
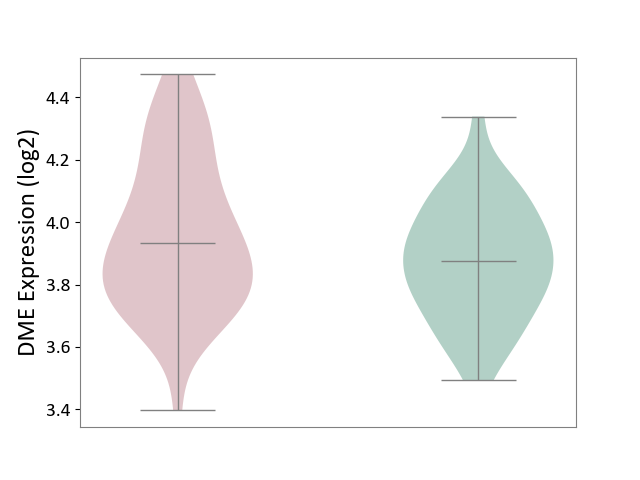
|
Click to View the Clearer Original Diagram | |||
| The Studied Tissue | Small airway epithelium | ||||
| The Specified Disease | Chronic obstructive pulmonary disease [ICD-11:CA22] | ||||
| The Expression Level of Disease Section Compare with the Healthy Individual Tissue | p-value: 5.65E-03; Fold-change: -7.28E-02; Z-score: -1.24E-01 | ||||
|
DME expression in the diseased tissue of patients
DME expression in the normal tissue of healthy individuals
|
|||||
| Violin Diagram of DME Disease-specific Protein Abundances |
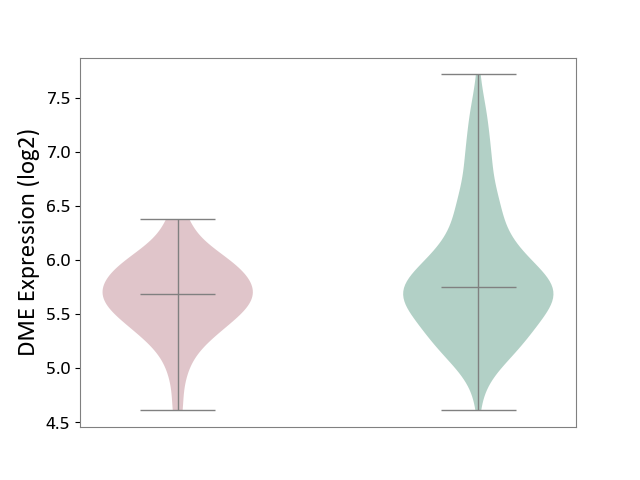
|
Click to View the Clearer Original Diagram | |||
| ICD-11: CA23 | Asthma | Click to Show/Hide | |||
| The Studied Tissue | Nasal and bronchial airway | ||||
| The Specified Disease | Asthma [ICD-11:CA23] | ||||
| The Expression Level of Disease Section Compare with the Healthy Individual Tissue | p-value: 2.25E-03; Fold-change: -4.98E-01; Z-score: -6.49E-01 | ||||
|
DME expression in the diseased tissue of patients
DME expression in the normal tissue of healthy individuals
|
|||||
| Violin Diagram of DME Disease-specific Protein Abundances |
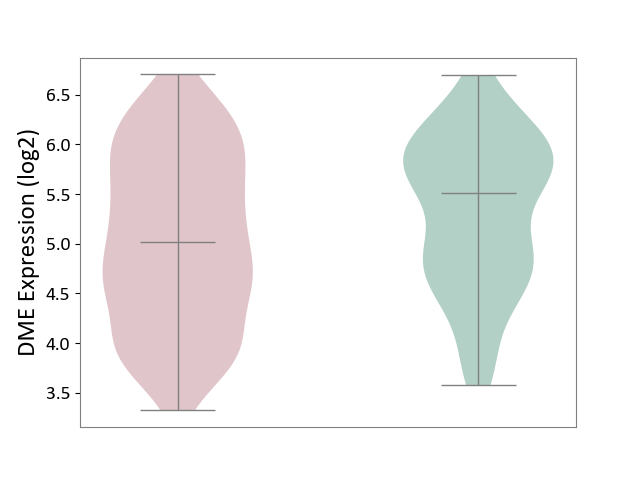
|
Click to View the Clearer Original Diagram | |||
| ICD-11: CB03 | Idiopathic interstitial pneumonitis | Click to Show/Hide | |||
| The Studied Tissue | Lung tissue | ||||
| The Specified Disease | Idiopathic pulmonary fibrosis [ICD-11:CB03.4] | ||||
| The Expression Level of Disease Section Compare with the Healthy Individual Tissue | p-value: 1.00E-01; Fold-change: 3.06E-02; Z-score: 1.84E-01 | ||||
|
DME expression in the diseased tissue of patients
DME expression in the normal tissue of healthy individuals
|
|||||
| Violin Diagram of DME Disease-specific Protein Abundances |
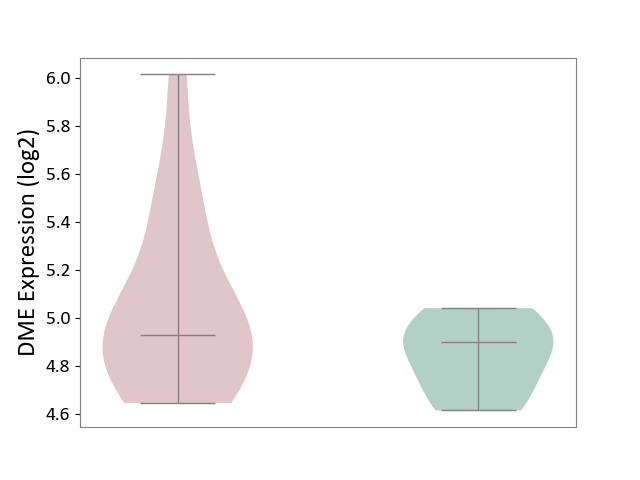
|
Click to View the Clearer Original Diagram | |||
| ICD Disease Classification 13 | Digestive system disease | Click to Show/Hide | |||
| ICD-11: DA0C | Periodontal disease | Click to Show/Hide | |||
| The Studied Tissue | Gingival tissue | ||||
| The Specified Disease | Periodontal disease [ICD-11:DA0C] | ||||
| The Expression Level of Disease Section Compare with the Adjacent Tissue | p-value: 6.62E-17; Fold-change: -5.67E-01; Z-score: -1.49E+00 | ||||
|
DME expression in the diseased tissue of patients
DME expression in the normal tissue adjacent to the diseased tissue of patients
|
|||||
| Violin Diagram of DME Disease-specific Protein Abundances |
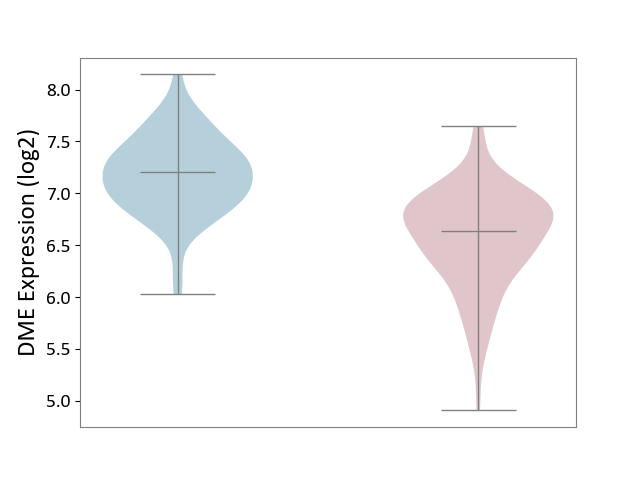
|
Click to View the Clearer Original Diagram | |||
| ICD-11: DA42 | Gastritis | Click to Show/Hide | |||
| The Studied Tissue | Gastric antrum tissue | ||||
| The Specified Disease | Eosinophilic gastritis [ICD-11:DA42.2] | ||||
| The Expression Level of Disease Section Compare with the Adjacent Tissue | p-value: 2.78E-02; Fold-change: -7.28E-01; Z-score: -1.31E+00 | ||||
|
DME expression in the diseased tissue of patients
DME expression in the normal tissue adjacent to the diseased tissue of patients
|
|||||
| Violin Diagram of DME Disease-specific Protein Abundances |
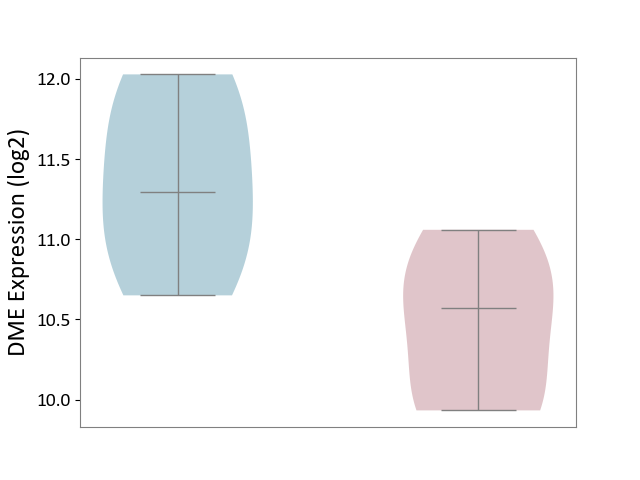
|
Click to View the Clearer Original Diagram | |||
| ICD-11: DB92 | Non-alcoholic fatty liver disease | Click to Show/Hide | |||
| The Studied Tissue | Liver tissue | ||||
| The Specified Disease | Non-alcoholic fatty liver disease [ICD-11:DB92] | ||||
| The Expression Level of Disease Section Compare with the Healthy Individual Tissue | p-value: 4.19E-01; Fold-change: 9.45E-02; Z-score: 1.75E-01 | ||||
|
DME expression in the diseased tissue of patients
DME expression in the normal tissue of healthy individuals
|
|||||
| Violin Diagram of DME Disease-specific Protein Abundances |
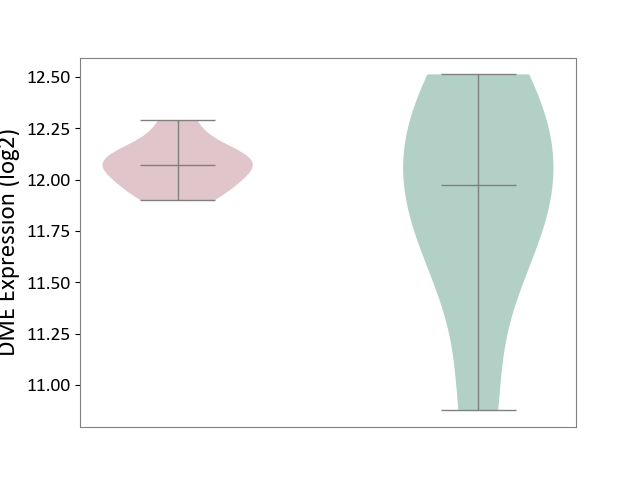
|
Click to View the Clearer Original Diagram | |||
| ICD-11: DB99 | Hepatic failure | Click to Show/Hide | |||
| The Studied Tissue | Liver tissue | ||||
| The Specified Disease | Liver failure [ICD-11:DB99.7-DB99.8] | ||||
| The Expression Level of Disease Section Compare with the Healthy Individual Tissue | p-value: 3.26E-03; Fold-change: -3.74E+00; Z-score: -9.96E+00 | ||||
|
DME expression in the diseased tissue of patients
DME expression in the normal tissue of healthy individuals
|
|||||
| Violin Diagram of DME Disease-specific Protein Abundances |
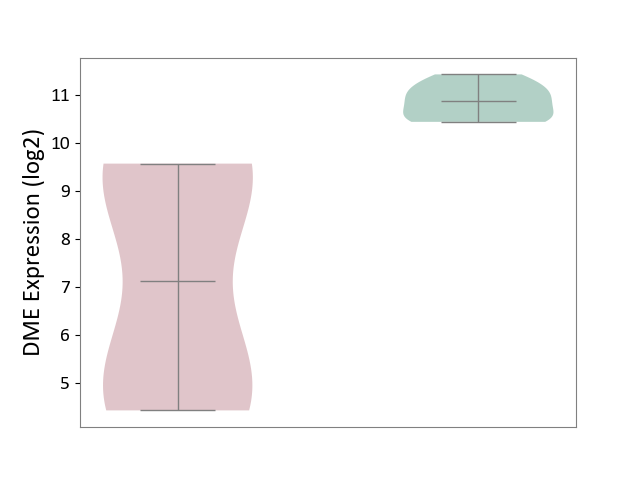
|
Click to View the Clearer Original Diagram | |||
| ICD-11: DD71 | Ulcerative colitis | Click to Show/Hide | |||
| The Studied Tissue | Colon mucosal tissue | ||||
| The Specified Disease | Ulcerative colitis [ICD-11:DD71] | ||||
| The Expression Level of Disease Section Compare with the Adjacent Tissue | p-value: 3.00E-01; Fold-change: 1.20E-01; Z-score: 2.52E-01 | ||||
|
DME expression in the diseased tissue of patients
DME expression in tissue other than the diseased tissue of patients
|
|||||
| Violin Diagram of DME Disease-specific Protein Abundances |
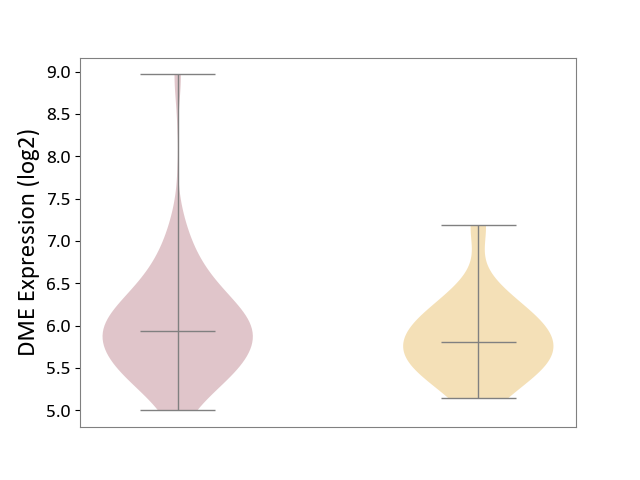
|
Click to View the Clearer Original Diagram | |||
| ICD-11: DD91 | Irritable bowel syndrome | Click to Show/Hide | |||
| The Studied Tissue | Rectal colon tissue | ||||
| The Specified Disease | Irritable bowel syndrome [ICD-11:DD91.0] | ||||
| The Expression Level of Disease Section Compare with the Healthy Individual Tissue | p-value: 7.48E-04; Fold-change: 3.43E-01; Z-score: 6.77E-01 | ||||
|
DME expression in the diseased tissue of patients
DME expression in the normal tissue of healthy individuals
|
|||||
| Violin Diagram of DME Disease-specific Protein Abundances |
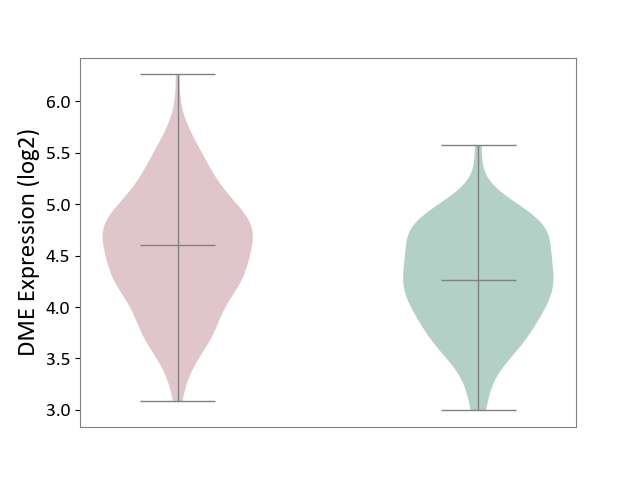
|
Click to View the Clearer Original Diagram | |||
| ICD Disease Classification 14 | Skin disease | Click to Show/Hide | |||
| ICD-11: EA80 | Atopic eczema | Click to Show/Hide | |||
| The Studied Tissue | Skin | ||||
| The Specified Disease | Atopic dermatitis [ICD-11:EA80] | ||||
| The Expression Level of Disease Section Compare with the Healthy Individual Tissue | p-value: 1.06E-06; Fold-change: -4.93E-01; Z-score: -1.66E+00 | ||||
|
DME expression in the diseased tissue of patients
DME expression in the normal tissue of healthy individuals
|
|||||
| Violin Diagram of DME Disease-specific Protein Abundances |
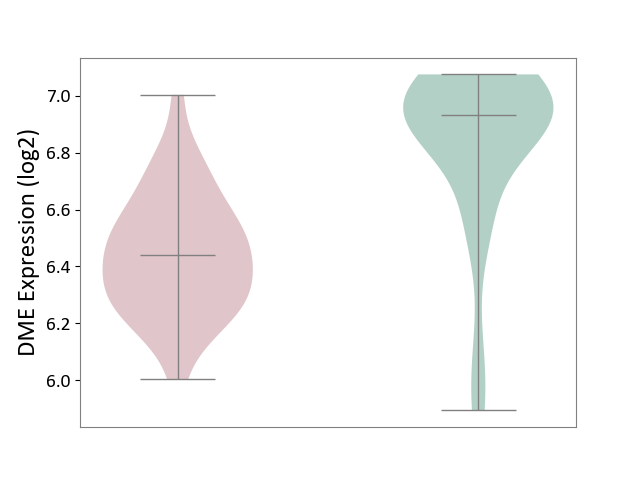
|
Click to View the Clearer Original Diagram | |||
| ICD-11: EA90 | Psoriasis | Click to Show/Hide | |||
| The Studied Tissue | Skin | ||||
| The Specified Disease | Psoriasis [ICD-11:EA90] | ||||
| The Expression Level of Disease Section Compare with the Healthy Individual Tissue | p-value: 1.22E-05; Fold-change: 1.49E-01; Z-score: 5.34E-01 | ||||
| The Expression Level of Disease Section Compare with the Adjacent Tissue | p-value: 2.37E-01; Fold-change: 8.23E-02; Z-score: 1.62E-01 | ||||
|
DME expression in the diseased tissue of patients
DME expression in the normal tissue adjacent to the diseased tissue of patients
DME expression in the normal tissue of healthy individuals
|
|||||
| Violin Diagram of DME Disease-specific Protein Abundances |
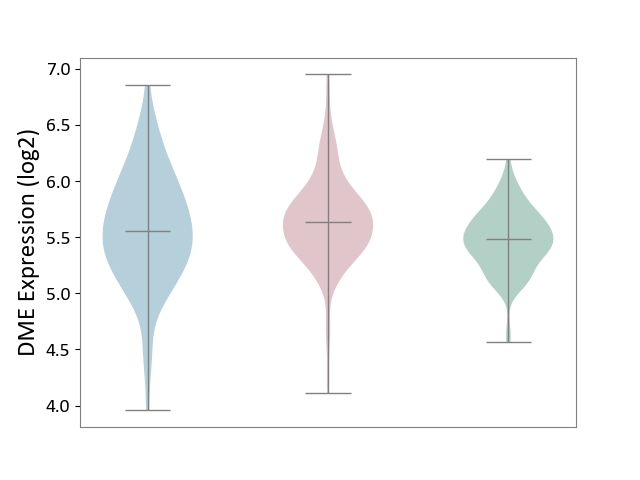
|
Click to View the Clearer Original Diagram | |||
| ICD-11: ED63 | Acquired hypomelanotic disorder | Click to Show/Hide | |||
| The Studied Tissue | Skin | ||||
| The Specified Disease | Vitiligo [ICD-11:ED63.0] | ||||
| The Expression Level of Disease Section Compare with the Healthy Individual Tissue | p-value: 1.43E-01; Fold-change: -3.38E-01; Z-score: -8.82E-01 | ||||
|
DME expression in the diseased tissue of patients
DME expression in the normal tissue of healthy individuals
|
|||||
| Violin Diagram of DME Disease-specific Protein Abundances |
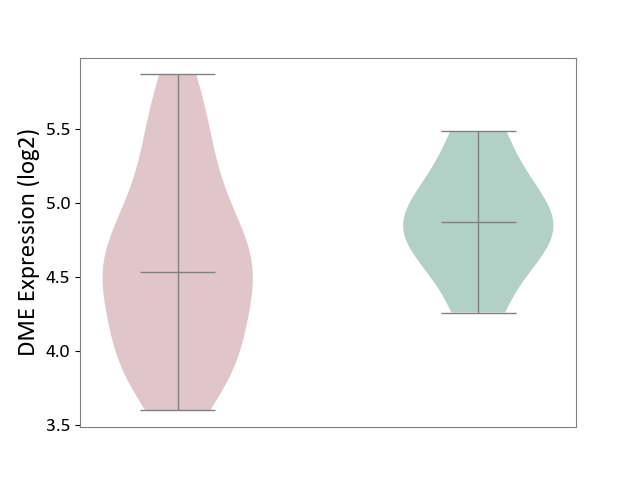
|
Click to View the Clearer Original Diagram | |||
| ICD-11: ED70 | Alopecia or hair loss | Click to Show/Hide | |||
| The Studied Tissue | Skin from scalp | ||||
| The Specified Disease | Alopecia [ICD-11:ED70] | ||||
| The Expression Level of Disease Section Compare with the Healthy Individual Tissue | p-value: 4.96E-01; Fold-change: -1.10E-01; Z-score: -1.61E-01 | ||||
|
DME expression in the diseased tissue of patients
DME expression in the normal tissue of healthy individuals
|
|||||
| Violin Diagram of DME Disease-specific Protein Abundances |
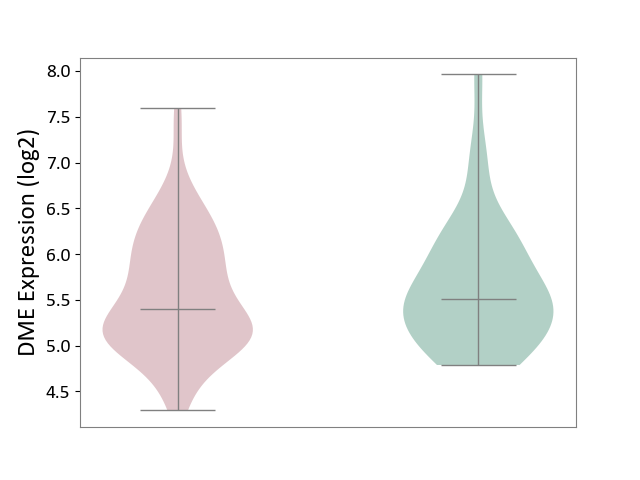
|
Click to View the Clearer Original Diagram | |||
| ICD-11: EK0Z | Contact dermatitis | Click to Show/Hide | |||
| The Studied Tissue | Skin | ||||
| The Specified Disease | Sensitive skin [ICD-11:EK0Z] | ||||
| The Expression Level of Disease Section Compare with the Healthy Individual Tissue | p-value: 1.42E-02; Fold-change: 1.53E-01; Z-score: 1.10E+00 | ||||
|
DME expression in the diseased tissue of patients
DME expression in the normal tissue of healthy individuals
|
|||||
| Violin Diagram of DME Disease-specific Protein Abundances |
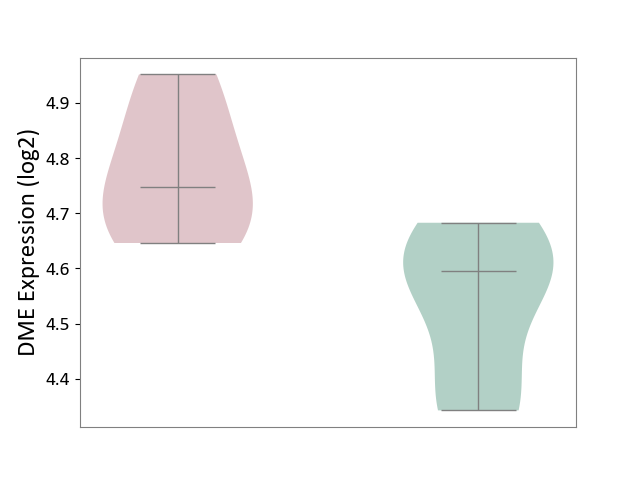
|
Click to View the Clearer Original Diagram | |||
| ICD Disease Classification 15 | Musculoskeletal system/connective tissue disease | Click to Show/Hide | |||
| ICD-11: FA00 | Osteoarthritis | Click to Show/Hide | |||
| The Studied Tissue | Peripheral blood | ||||
| The Specified Disease | Arthropathy [ICD-11:FA00-FA5Z] | ||||
| The Expression Level of Disease Section Compare with the Healthy Individual Tissue | p-value: 2.33E-01; Fold-change: 2.06E-02; Z-score: 1.51E-01 | ||||
|
DME expression in the diseased tissue of patients
DME expression in the normal tissue of healthy individuals
|
|||||
| Violin Diagram of DME Disease-specific Protein Abundances |
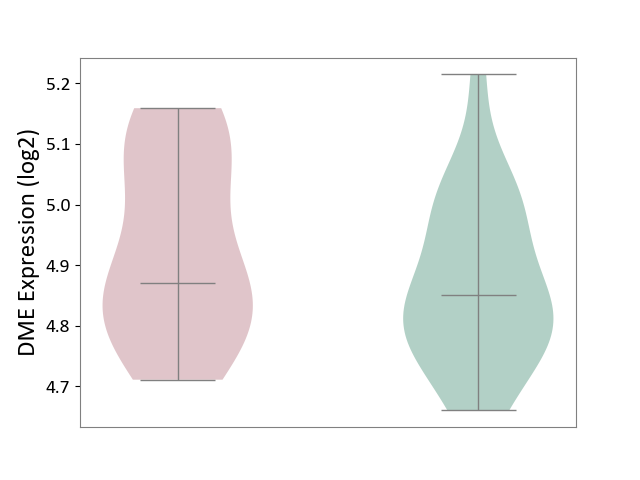
|
Click to View the Clearer Original Diagram | |||
| The Studied Tissue | Synovial tissue | ||||
| The Specified Disease | Osteoarthritis [ICD-11:FA00-FA0Z] | ||||
| The Expression Level of Disease Section Compare with the Healthy Individual Tissue | p-value: 7.34E-03; Fold-change: -2.37E-01; Z-score: -1.13E+00 | ||||
|
DME expression in the diseased tissue of patients
DME expression in the normal tissue of healthy individuals
|
|||||
| Violin Diagram of DME Disease-specific Protein Abundances |
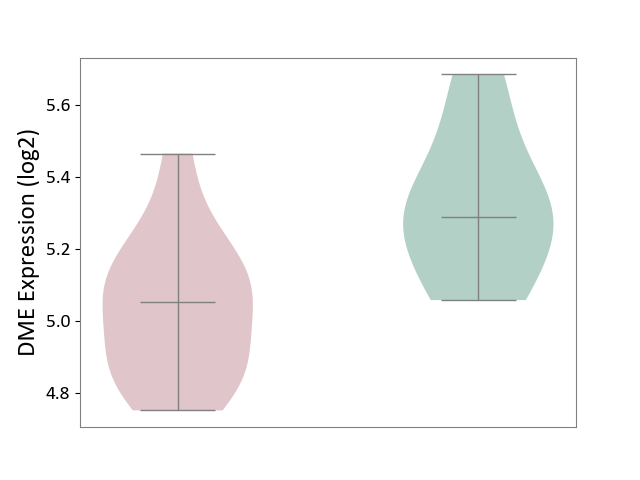
|
Click to View the Clearer Original Diagram | |||
| ICD-11: FA20 | Rheumatoid arthritis | Click to Show/Hide | |||
| The Studied Tissue | Peripheral blood | ||||
| The Specified Disease | Childhood onset rheumatic disease [ICD-11:FA20.Z] | ||||
| The Expression Level of Disease Section Compare with the Healthy Individual Tissue | p-value: 7.49E-01; Fold-change: -3.67E-02; Z-score: -1.81E-01 | ||||
|
DME expression in the diseased tissue of patients
DME expression in the normal tissue of healthy individuals
|
|||||
| Violin Diagram of DME Disease-specific Protein Abundances |
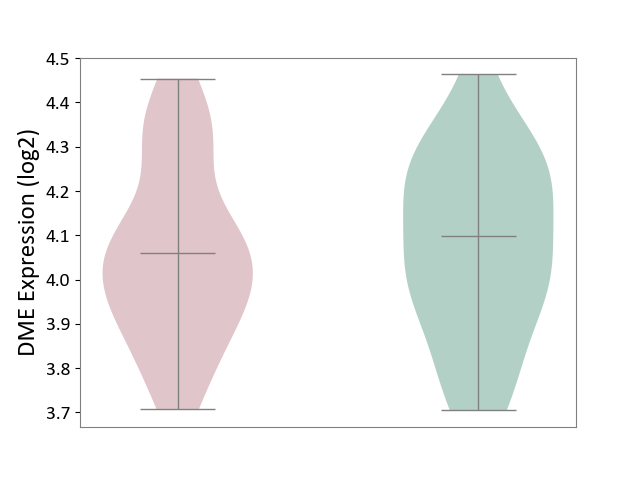
|
Click to View the Clearer Original Diagram | |||
| The Studied Tissue | Synovial tissue | ||||
| The Specified Disease | Rheumatoid arthritis [ICD-11:FA20] | ||||
| The Expression Level of Disease Section Compare with the Healthy Individual Tissue | p-value: 4.28E-02; Fold-change: -1.99E-01; Z-score: -6.09E-01 | ||||
|
DME expression in the diseased tissue of patients
DME expression in the normal tissue of healthy individuals
|
|||||
| Violin Diagram of DME Disease-specific Protein Abundances |
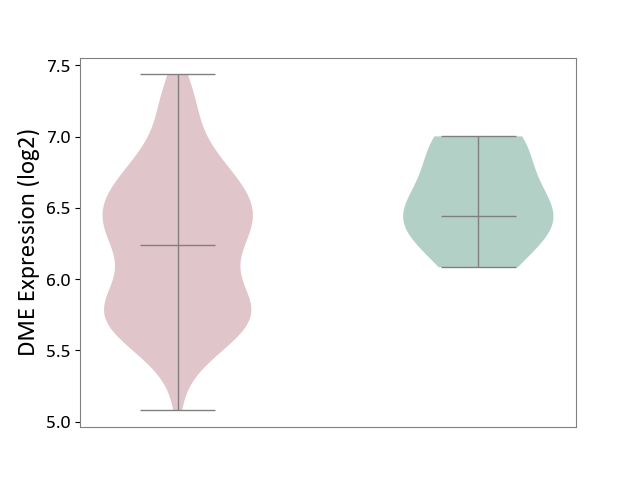
|
Click to View the Clearer Original Diagram | |||
| ICD-11: FA24 | Juvenile idiopathic arthritis | Click to Show/Hide | |||
| The Studied Tissue | Peripheral blood | ||||
| The Specified Disease | Juvenile idiopathic arthritis [ICD-11:FA24] | ||||
| The Expression Level of Disease Section Compare with the Healthy Individual Tissue | p-value: 1.24E-01; Fold-change: 6.31E-02; Z-score: 1.90E-01 | ||||
|
DME expression in the diseased tissue of patients
DME expression in the normal tissue of healthy individuals
|
|||||
| Violin Diagram of DME Disease-specific Protein Abundances |
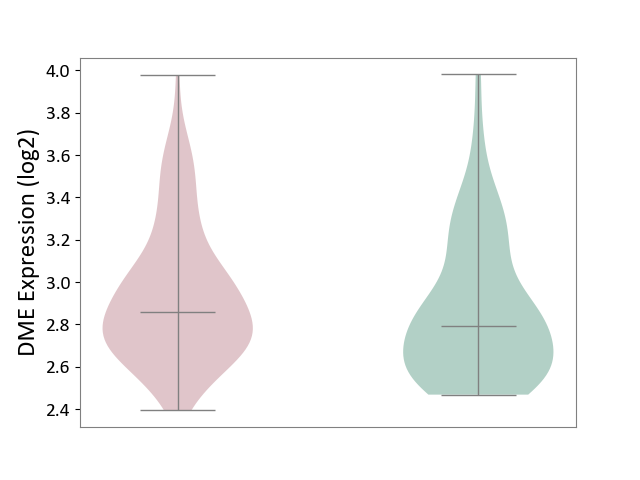
|
Click to View the Clearer Original Diagram | |||
| ICD-11: FA92 | Inflammatory spondyloarthritis | Click to Show/Hide | |||
| The Studied Tissue | Pheripheral blood | ||||
| The Specified Disease | Ankylosing spondylitis [ICD-11:FA92.0Z] | ||||
| The Expression Level of Disease Section Compare with the Healthy Individual Tissue | p-value: 9.93E-01; Fold-change: 1.60E-02; Z-score: 8.67E-02 | ||||
|
DME expression in the diseased tissue of patients
DME expression in the normal tissue of healthy individuals
|
|||||
| Violin Diagram of DME Disease-specific Protein Abundances |
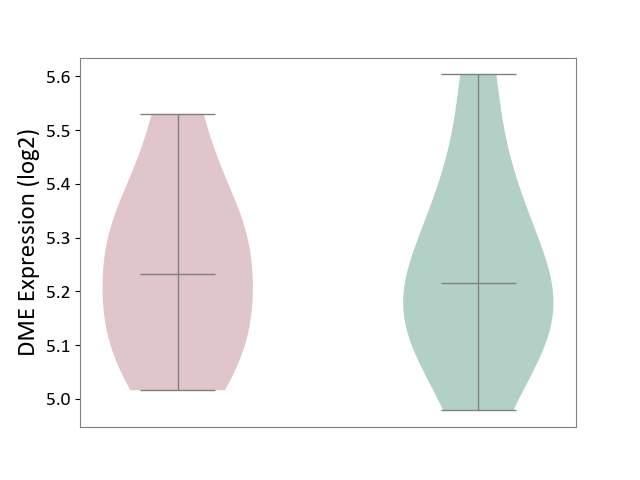
|
Click to View the Clearer Original Diagram | |||
| ICD-11: FB83 | Low bone mass disorder | Click to Show/Hide | |||
| The Studied Tissue | Bone marrow | ||||
| The Specified Disease | Osteoporosis [ICD-11:FB83.1] | ||||
| The Expression Level of Disease Section Compare with the Healthy Individual Tissue | p-value: 4.63E-01; Fold-change: -2.60E-02; Z-score: -2.43E-01 | ||||
|
DME expression in the diseased tissue of patients
DME expression in the normal tissue of healthy individuals
|
|||||
| Violin Diagram of DME Disease-specific Protein Abundances |
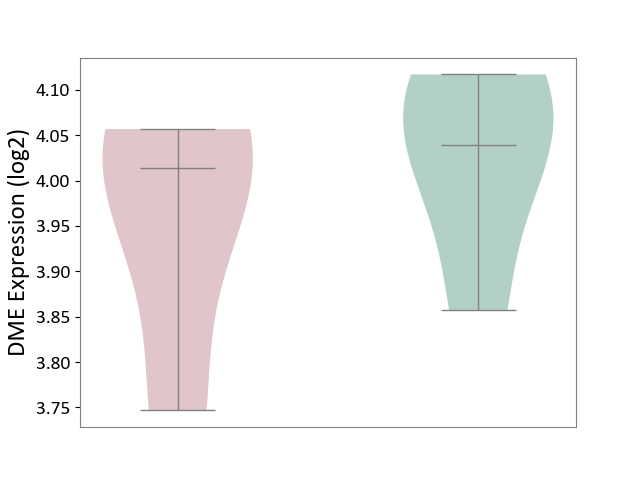
|
Click to View the Clearer Original Diagram | |||
| ICD Disease Classification 16 | Genitourinary system disease | Click to Show/Hide | |||
| ICD-11: GA10 | Endometriosis | Click to Show/Hide | |||
| The Studied Tissue | Endometrium tissue | ||||
| The Specified Disease | Endometriosis [ICD-11:GA10] | ||||
| The Expression Level of Disease Section Compare with the Healthy Individual Tissue | p-value: 9.10E-03; Fold-change: 4.31E-01; Z-score: 9.29E-01 | ||||
|
DME expression in the diseased tissue of patients
DME expression in the normal tissue of healthy individuals
|
|||||
| Violin Diagram of DME Disease-specific Protein Abundances |
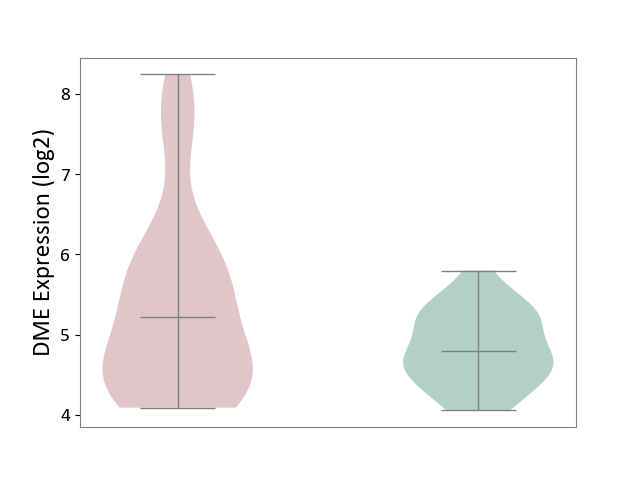
|
Click to View the Clearer Original Diagram | |||
| ICD-11: GC00 | Cystitis | Click to Show/Hide | |||
| The Studied Tissue | Bladder tissue | ||||
| The Specified Disease | Interstitial cystitis [ICD-11:GC00.3] | ||||
| The Expression Level of Disease Section Compare with the Healthy Individual Tissue | p-value: 1.20E-02; Fold-change: 1.20E-01; Z-score: 1.59E+00 | ||||
|
DME expression in the diseased tissue of patients
DME expression in the normal tissue of healthy individuals
|
|||||
| Violin Diagram of DME Disease-specific Protein Abundances |
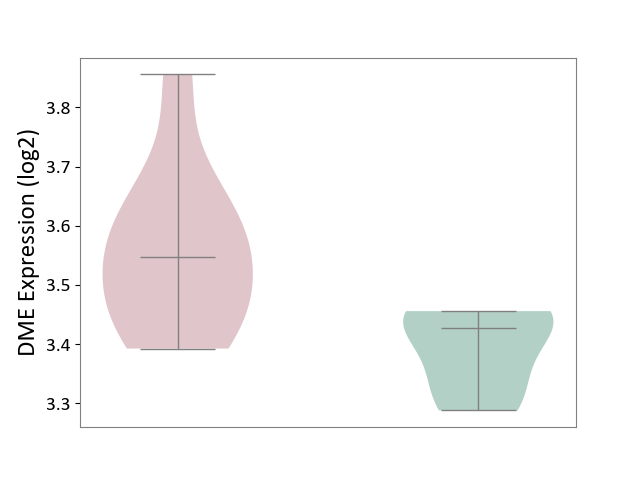
|
Click to View the Clearer Original Diagram | |||
| ICD Disease Classification 19 | Condition originating in perinatal period | Click to Show/Hide | |||
| ICD-11: KA21 | Short gestation disorder | Click to Show/Hide | |||
| The Studied Tissue | Myometrium | ||||
| The Specified Disease | Preterm birth [ICD-11:KA21.4Z] | ||||
| The Expression Level of Disease Section Compare with the Healthy Individual Tissue | p-value: 2.10E-01; Fold-change: -2.96E-03; Z-score: -1.75E-02 | ||||
|
DME expression in the diseased tissue of patients
DME expression in the normal tissue of healthy individuals
|
|||||
| Violin Diagram of DME Disease-specific Protein Abundances |
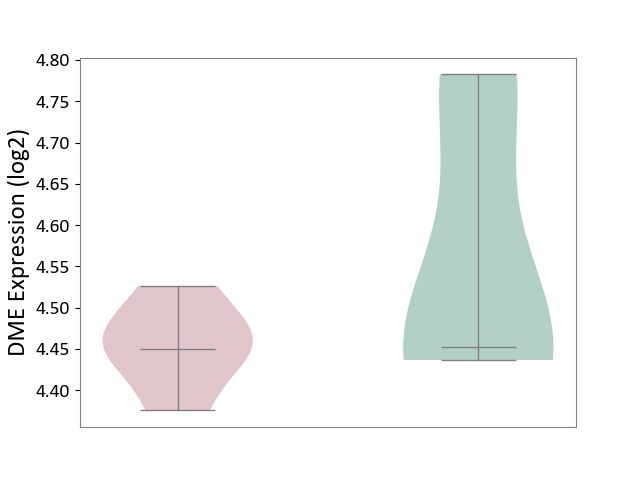
|
Click to View the Clearer Original Diagram | |||
| ICD Disease Classification 20 | Developmental anomaly | Click to Show/Hide | |||
| ICD-11: LD2C | Overgrowth syndrome | Click to Show/Hide | |||
| The Studied Tissue | Adipose tissue | ||||
| The Specified Disease | Simpson golabi behmel syndrome [ICD-11:LD2C] | ||||
| The Expression Level of Disease Section Compare with the Healthy Individual Tissue | p-value: 5.75E-01; Fold-change: 8.65E-02; Z-score: 8.35E-01 | ||||
|
DME expression in the diseased tissue of patients
DME expression in the normal tissue of healthy individuals
|
|||||
| Violin Diagram of DME Disease-specific Protein Abundances |
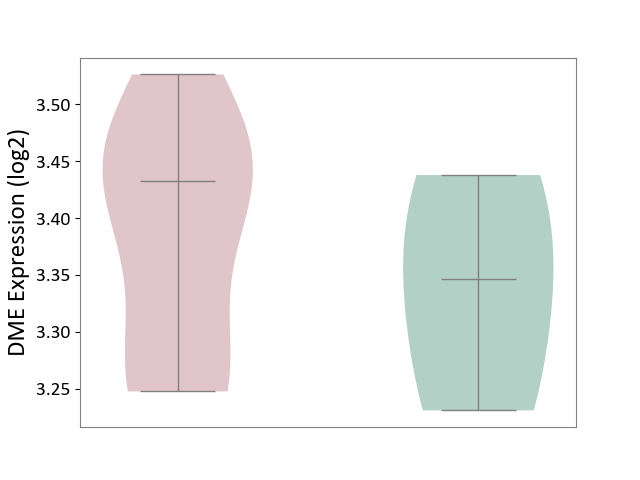
|
Click to View the Clearer Original Diagram | |||
| ICD-11: LD2D | Phakomatoses/hamartoneoplastic syndrome | Click to Show/Hide | |||
| The Studied Tissue | Perituberal tissue | ||||
| The Specified Disease | Tuberous sclerosis complex [ICD-11:LD2D.2] | ||||
| The Expression Level of Disease Section Compare with the Healthy Individual Tissue | p-value: 3.56E-01; Fold-change: 1.51E-01; Z-score: 1.30E+00 | ||||
|
DME expression in the diseased tissue of patients
DME expression in the normal tissue of healthy individuals
|
|||||
| Violin Diagram of DME Disease-specific Protein Abundances |
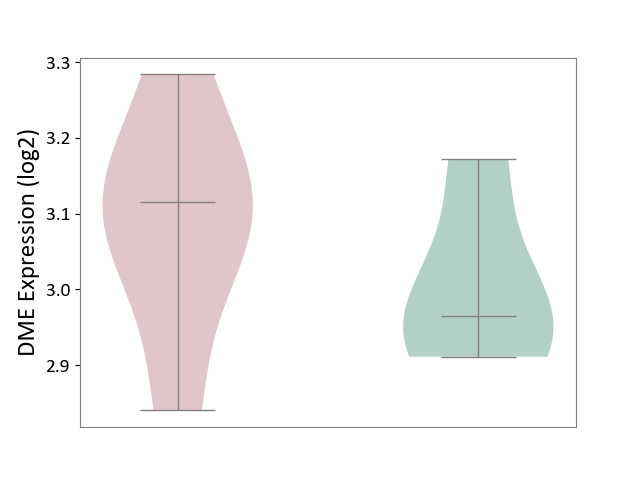
|
Click to View the Clearer Original Diagram | |||
| References | |||||
|---|---|---|---|---|---|
| 1 | Thalidomide metabolism by the CYP2C subfamily. Clin Cancer Res. 2002 Jun;8(6):1964-73. | ||||
| 2 | Product Monograph of Wellbutrin SR(Bupropion Hydrochloride). | ||||
| 3 | Tamoxifen inhibits cytochrome P450 2C9 activity in breast cancer patients. J Chemother. 2006 Aug;18(4):421-4. | ||||
| 4 | Metabolism and pharmacokinetics of novel selective vascular endothelial growth factor receptor-2 inhibitor apatinib in humans | ||||
| 5 | Effect of alosetron on the pharmacokinetics of fluoxetine. J Clin Pharmacol. 2001 Apr;41(4):455-8. | ||||
| 6 | Identification of Novel Pathways in Idelalisib Metabolism and Bioactivation | ||||
| 7 | Pharmacogenomics of CYP2C9: functional and clinical considerations. J Pers Med. 2017 Dec 28;8(1). | ||||
| 8 | A potential role for the estrogen-metabolizing cytochrome P450 enzymes in human breast carcinogenesis. Breast Cancer Res Treat. 2003 Dec;82(3):191-7. | ||||
| 9 | Roles of CYP2A6 and CYP2B6 in nicotine C-oxidation by human liver microsomes. Arch Toxicol. 1999 Mar;73(2):65-70. | ||||
| 10 | Atazanavir for the treatment of human immunodeficiency virus infection. Pharmacotherapy. 2004 Dec;24(12):1732-47. | ||||
| 11 | In vitro characterization of the cytochrome P450 isoforms involved in the metabolism of 6-methoxy-2-napthylacetic acid, an active metabolite of the prodrug nabumetone. Biol Pharm Bull. 2011;34(5):734-9. | ||||
| 12 | CYP2C-catalyzed delta9-tetrahydrocannabinol metabolism: kinetics, pharmacogenetics and interaction with phenytoin. Biochem Pharmacol. 2005 Oct 1;70(7):1096-103. | ||||
| 13 | Investigation of drug-drug interaction potential of bortezomib in vivo in female Sprague-Dawley rats and in vitro in human liver microsomes. Drug Metab Dispos. 2006 Apr;34(4):702-8. | ||||
| 14 | New insights into the structural features and functional relevance of human cytochrome P450 2C9. Part I. Curr Drug Metab. 2009 Dec;10(10):1075-126. | ||||
| 15 | Metabolic Profiles of Propofol and Fospropofol: Clinical and Forensic Interpretative Aspects | ||||
| 16 | In vitro metabolism of montelukast by cytochrome P450s and UDP-glucuronosyltransferases. Drug Metab Dispos. 2015 Dec;43(12):1905-16. | ||||
| 17 | Progesterone and testosterone hydroxylation by cytochromes P450 2C19, 2C9, and 3A4 in human liver microsomes. Arch Biochem Biophys. 1997 Oct 1;346(1):161-9. | ||||
| 18 | Characterization of the cytochrome P450 enzymes involved in the in vitro metabolism of rosiglitazone. Br J Clin Pharmacol. 1999 Sep;48(3):424-32. | ||||
| 19 | Rosiglitazone Metabolism in Human Liver Microsomes Using a Substrate Depletion Method | ||||
| 20 | DrugBank(Pharmacology-Metabolism):Rosiglitazone | ||||
| 21 | Drug-drug interactions with imatinib: an observational study. Medicine (Baltimore). 2016 Oct;95(40):e5076. | ||||
| 22 | Summary of information on human CYP enzymes: human P450 metabolism data. Drug Metab Rev. 2002 Feb-May;34(1-2):83-448. | ||||
| 23 | Genetically based impairment in CYP2C8- and CYP2C9-dependent NSAID metabolism as a risk factor for gastrointestinal bleeding: is a combination of pharmacogenomics and metabolomics required to improve personalized medicine? Expert Opin Drug Metab Toxicol. 2009 Jun;5(6):607-20. | ||||
| 24 | Effect of gemfibrozil on the metabolism of brivaracetam in vitro and in human subjects. Drug Metab Dispos. 2012 Aug;40(8):1466-72. | ||||
| 25 | Cytochrome P450-Catalyzed Metabolism of Cannabidiol to the Active Metabolite 7-Hydroxy-Cannabidiol Drug Metab Dispos. 2021 Oct;49(10):882-891. doi: 10.1124/dmd.120.000350. | ||||
| 26 | Metabolism of capsaicin by cytochrome P450 produces novel dehydrogenated metabolites and decreases cytotoxicity to lung and liver cells. Chem Res Toxicol. 2003 Mar;16(3):336-49. | ||||
| 27 | Product monograph: CARDURA (Doxazosin mesylate). | ||||
| 28 | The involvement of CYP3A4 and CYP2C9 in the metabolism of 17 alpha-ethinylestradiol. Drug Metab Dispos. 2004 Nov;32(11):1209-12. | ||||
| 29 | CYP2C9 polymorphisms in human tumors. Anticancer Res. 2006 Jan-Feb;26(1A):299-305. | ||||
| 30 | Rapid detection of the known SNPs of CYP2C9 using oligonucleotide microarray. World J Gastroenterol. 2003 Jun;9(6):1342-6. | ||||
| 31 | Clinical pharmacokinetics of tyrosine kinase inhibitors. Cancer Treat Rev. 2009 Dec;35(8):692-706. | ||||
| 32 | CYP2C76-mediated species difference in drug metabolism: a comparison of pitavastatin metabolism between monkeys and humans | ||||
| 33 | Metabolic fate of pitavastatin (NK-104), a new inhibitor of 3-hydroxy-3-methyl-glutaryl coenzyme A reductase. Effects on drug-metabolizing systems in rats and humans | ||||
| 34 | Metabolic fate of pitavastatin, a new inhibitor of HMG-CoA reductase: similarities and difference in the metabolism of pitavastatin in monkeys and humans | ||||
| 35 | Metabolism and disposition of siponimod, a novel selective S1P1/S1P5 agonist, in healthy volunteers and in vitro identification of human cytochrome P450 enzymes involved in its oxidative metabolism. Drug Metab Dispos. 2018 Jul;46(7):1001-1013. | ||||
| 36 | Substrates, inducers, inhibitors and structure-activity relationships of human Cytochrome P450 2C9 and implications in drug development. Curr Med Chem. 2009;16(27):3480-675. | ||||
| 37 | A mechanistic approach to antiepileptic drug interactions. Ann Pharmacother. 1998 May;32(5):554-63. | ||||
| 38 | Duloxetine: clinical pharmacokinetics and drug interactions. Clin Pharmacokinet. 2011 May;50(5):281-94. | ||||
| 39 | Enzalutamide: an evidence-based review of its use in the treatment of prostate cancer. Core Evid. 2013;8:27-35. | ||||
| 40 | In vitro drug-drug interaction studies with febuxostat, a novel non-purine selective inhibitor of xanthine oxidase: plasma protein binding, identification of metabolic enzymes and cytochrome P450 inhibition Xenobiotica. 2008 May;38(5):496-510. doi: 10.1080/00498250801956350. | ||||
| 41 | Identification of the human cytochrome P450 enzymes involved in the in vitro biotransformation of lynestrenol and norethindrone. J Steroid Biochem Mol Biol. 2008 May;110(1-2):56-66. | ||||
| 42 | Current clinical evidence on pioglitazone pharmacogenomics. Front Pharmacol. 2013 Nov 26;4:147. | ||||
| 43 | In vitro comparative inhibition profiles of major human drug metabolising cytochrome P450 isozymes (CYP2C9, CYP2D6 and CYP3A4) by HMG-CoA reductase inhibitors. Eur J Clin Pharmacol. 1996;50(3):209-15. | ||||
| 44 | In vitro characterization of the human biotransformation and CYP reaction phenotype of ET-743 (Yondelis, Trabectidin), a novel marine anti-cancer drug. Invest New Drugs. 2006 Jan;24(1):3-14. | ||||
| 45 | Pharmacogenetics of schizophrenia. Am J Med Genet. 2000 Spring;97(1):98-106. | ||||
| 46 | Human reductive halothane metabolism in vitro is catalyzed by cytochrome P450 2A6 and 3A4. Drug Metab Dispos. 1996 Sep;24(9):976-83. | ||||
| 47 | Contribution of CYP3A4, CYP2B6, and CYP2C9 isoforms to N-demethylation of ketamine in human liver microsomes. Drug Metab Dispos. 2002 Jul;30(7):853-8. | ||||
| 48 | Body weight, gender and pregnancy affect enantiomer-specific ketorolac pharmacokinetics. Br J Clin Pharmacol. 2017 Sep;83(9):1966-1975. | ||||
| 49 | Identification of human cytochrome P450 isoforms involved in the 3-hydroxylation of quinine by human live microsomes and nine recombinant human cytochromes P450. J Pharmacol Exp Ther. 1996 Dec;279(3):1327-34. | ||||
| 50 | Mechanism-based inactivation of human recombinant P450 2C9 by the nonsteroidal anti-inflammatory drug suprofen. Drug Metab Dispos. 2003 Nov;31(11):1369-77. | ||||
| 51 | DailyMed : Alitretinoin | ||||
| 52 | Monkey liver cytochrome P450 2C9 is involved in caffeine 7-N-demethylation to form theophylline. Xenobiotica. 2013 Dec;43(12):1037-42. | ||||
| 53 | The role of CYP2C9 genetic polymorphism in carvedilol O-desmethylation in vitro. Eur J Drug Metab Pharmacokinet. 2016 Feb;41(1):79-86. | ||||
| 54 | Identification of the cytochrome P450 enzymes involved in the metabolism of cisapride: in vitro studies of potential co-medication interactions. Br J Pharmacol. 2000 Apr;129(8):1655-67. | ||||
| 55 | Multiple human cytochromes contribute to biotransformation of dextromethorphan in-vitro: role of CYP2C9, CYP2C19, CYP2D6, and CYP3A. J Pharm Pharmacol. 1998 Sep;50(9):997-1004. | ||||
| 56 | Phenytoin-diazepam interaction. Ann Pharmacother. 2003 May;37(5):659-63. | ||||
| 57 | Contributions of CYP2D6, CYP2C9 and CYP2C19 to the biotransformation of E- and Z-doxepin in healthy volunteers. Pharmacogenetics. 2002 Oct;12(7):571-80. | ||||
| 58 | FDA Approved Drug Products: Perforomist? inhalation solution | ||||
| 59 | In vitro characterization of the metabolism of haloperidol using recombinant cytochrome p450 enzymes and human liver microsomes. Drug Metab Dispos. 2001 Dec;29(12):1638-43. | ||||
| 60 | Clinical pharmacokinetics of ketoprofen enantiomers in wild type of Cyp 2c8 and Cyp 2c9 patients with rheumatoid arthritis. Eur J Drug Metab Pharmacokinet. 2011 Sep;36(3):167-73. | ||||
| 61 | In?vitro assessment of the potential for dolutegravir to affect hepatic clearance of levonorgestrel | ||||
| 62 | Clinical pharmacokinetics and pharmacodynamics of the endothelin receptor antagonist macitentan | ||||
| 63 | Drug interactions in dentistry: the importance of knowing your CYPs. J Am Dent Assoc. 2004 Mar;135(3):298-311. | ||||
| 64 | Drug-drug and food-drug pharmacokinetic interactions with new insulinotropic agents repaglinide and nateglinide. Clin Pharmacokinet. 2007;46(2):93-108. | ||||
| 65 | Inhibition of human cytochrome P450 isoforms by nonnucleoside reverse transcriptase inhibitors. J Clin Pharmacol. 2001 Jan;41(1):85-91. | ||||
| 66 | Metabolism of sulfinpyrazone sulfide and sulfinpyrazone by human liver microsomes and cDNA-expressed cytochrome P450s. Drug Metab Dispos. 2001 May;29(5):701-11. | ||||
| 67 | Impact of CYP2C9 genotype on pharmacokinetics: are all cyclooxygenase inhibitors the same? Drug Metab Dispos. 2005 Nov;33(11):1567-75. | ||||
| 68 | Trimethoprim and sulfamethoxazole are selective inhibitors of CYP2C8 and CYP2C9, respectively. Drug Metab Dispos. 2002 Jun;30(6):631-5. | ||||
| 69 | Drug interactions with calcium channel blockers: possible involvement of metabolite-intermediate complexation with CYP3A. Drug Metab Dispos. 2000 Feb;28(2):125-30. | ||||
| 70 | Cytochromes P450 mediating the N-demethylation of amitriptyline. Br J Clin Pharmacol. 1997 Feb;43(2):137-44. | ||||
| 71 | Amprenavir: a new human immunodeficiency virus type 1 protease inhibitor. Clin Ther. 2000 May;22(5):549-72. | ||||
| 72 | Pharmacokinetic interaction between etravirine or darunavir/ritonavir and artemether/lumefantrine in healthy volunteers: a two-panel, two-way, two-period, randomized trial. HIV Med. 2013 Aug;14(7):421-9. | ||||
| 73 | FDA LABEL:Avanafil | ||||
| 74 | Pharmacokinetics, metabolism, and excretion of (14)C-labeled belinostat in patients with recurrent or progressive malignancies | ||||
| 75 | Metabolite profiling and reaction phenotyping for the in vitro assessment of the bioactivation of bromfenac. Chem Res Toxicol. 2020 Jan 21;33(1):249-257. | ||||
| 76 | Stereoselective metabolism of donepezil and steady-state plasma concentrations of S-donepezil based on CYP2D6 polymorphisms in the therapeutic responses of Han Chinese patients with Alzheimer's disease. J Pharmacol Sci. 2015 Nov;129(3):188-95. | ||||
| 77 | FDA label of Erdafitinib. The 2020 official website of the U.S. Food and Drug Administration. | ||||
| 78 | Stereoselective glucuronidation and hydroxylation of etodolac by UGT1A9 and CYP2C9 in man. Xenobiotica. 2004 May;34(5):449-61. | ||||
| 79 | Binding of CYP2C9 with diverse drugs and its implications for metabolic mechanism. Med Chem. 2009 May;5(3):263-70. | ||||
| 80 | Limitations of S-warfarin truncated area under the concentration-time curve to predict cytochrome P450 2c9 activity. Drug Metab Lett. 2012 Jun 1;6(2):94-101. | ||||
| 81 | Human cytochrome P450s involved in the metabolism of 9-cis- and 13-cis-retinoic acids | ||||
| 82 | Effects of rifampin on the pharmacokinetics of a single dose of istradefylline in healthy subjects. J Clin Pharmacol. 2018 Feb;58(2):193-201. | ||||
| 83 | Leflunomide-induced acute hepatitis. Dig Liver Dis. 2004 Jan;36(1):82-4. | ||||
| 84 | Characterization of Stereoselective Metabolism, Inhibitory Effect on Uric Acid Uptake Transporters, and Pharmacokinetics of Lesinurad Atropisomers Drug Metab Dispos. 2019 Feb;47(2):104-113. doi: 10.1124/dmd.118.080549. | ||||
| 85 | Oxaprozin and piroxicam, nonsteroidal antiinflammatory drugs with long half-lives: effect of protein-binding differences on steady-state pharmacokinetics. J Clin Pharmacol. 1997 Apr;37(4):267-78. | ||||
| 86 | Antiepileptic drug interactions - principles and clinical implications. Curr Neuropharmacol. 2010 Sep;8(3):254-67. | ||||
| 87 | Substrates, inducers, inhibitors and structure-activity relationships of human Cytochrome P450 2C9 and implications in drug development Curr Med Chem. 2009;16(27):3480-675. doi: 10.2174/092986709789057635. | ||||
| 88 | Effect of diclofenac, disulfiram, itraconazole, grapefruit juice and erythromycin on the pharmacokinetics of quinidine. Br J Clin Pharmacol. 1999 Dec;48(6):829-38. | ||||
| 89 | DrugBank(Pharmacology-Metabolism):Simvastatin | ||||
| 90 | Investigations into the drug-drug interaction potential of tapentadol in human liver microsomes and fresh human hepatocytes. Drug Metab Lett. 2008 Jan;2(1):67-75. | ||||
| 91 | The dawn of hedgehog inhibitors: Vismodegib. J Pharmacol Pharmacother. 2013 Jan;4(1):4-7. | ||||
| 92 | Identification of the human liver cytochrome P450 enzymes involved in the metabolism of zileuton (ABT-077) and its N-dehydroxylated metabolite, Abbott-66193. Drug Metab Dispos. 1995 Oct;23(10):1163-74. | ||||
| 93 | The influences of CYP2C9*1/*3 genotype on the pharmacokinetics of zolpidem. Arch Pharm Res. 2018 Sep;41(9):931-936. | ||||
| 94 | Effect of common single-nucleotide polymorphisms in acetylsalicylic acid metabolic pathway genes on platelet reactivity in patients with diabetes Med Sci Monit. 2013 May 27;19:394-408. doi: 10.12659/MSM.883922. | ||||
| 95 | Azelastine N-demethylation by cytochrome P-450 (CYP)3A4, CYP2D6, and CYP1A2 in human liver microsomes: evaluation of approach to predict the contribution of multiple CYPs. Drug Metab Dispos. 1999 Dec;27(12):1381-91. | ||||
| 96 | FDA Label of Cabozantinib. The 2020 official website of the U.S. Food and Drug Administration. | ||||
| 97 | Chlorpropamide 2-hydroxylation is catalysed by CYP2C9 and CYP2C19 in vitro: chlorpropamide disposition is influenced by CYP2C9, but not by CYP2C19 genetic polymorphism. Br J Clin Pharmacol. 2005 May;59(5):552-63. | ||||
| 98 | Elucidation of individual cytochrome P450 enzymes involved in the metabolism of clozapine. Naunyn Schmiedebergs Arch Pharmacol. 1998 Nov;358(5):592-9. | ||||
| 99 | Pharmacogenomics in psychiatry: implications for practice. Recent Pat Biotechnol. 2014;8(2):152-9. | ||||
| 100 | Pharmacokinetic interactions between etravirine and non-antiretroviral drugs. Clin Pharmacokinet. 2011 Jan;50(1):25-39. | ||||
| 101 | Clinical consequences of cytochrome P450 2C9 polymorphisms. Clin Pharmacol Ther. 2005 Jan;77(1):1-16. | ||||
| 102 | A dual system platform for drug metabolism: Nalbuphine as a model compound | ||||
| 103 | Comparison of inhibitory effects of the proton pump-inhibiting drugs omeprazole, esomeprazole, lansoprazole, pantoprazole, and rabeprazole on human cytochrome P450 activities. Drug Metab Dispos. 2004 Aug;32(8):821-7. | ||||
| 104 | Ospemifene metabolism in humans in vitro and in vivo: metabolite identification, quantitation, and CYP assignment of major hydroxylations. Drug Metabol Drug Interact. 2013;28(3):153-61. | ||||
| 105 | CYP2C19 polymorphism effect on phenobarbitone. Pharmacokinetics in Japanese patients with epilepsy: analysis by population pharmacokinetics Eur J Clin Pharmacol. 2000 Feb-Mar;55(11-12):821-5. doi: 10.1007/s002280050703. | ||||
| 106 | Identification of the human cytochrome P450 isoforms mediating in vitro N-dealkylation of perphenazine. Br J Clin Pharmacol. 2000 Dec;50(6):563-71. | ||||
| 107 | Genetic polymorphisms of cytochrome P450 2C9 causing reduced phenprocoumon (S)-7-hydroxylation in vitro and in vivo. Xenobiotica. 2004 Sep;34(9):847-59. | ||||
| 108 | Cytochrome P-450 2B6 is responsible for interindividual variability of propofol hydroxylation by human liver microsomes. Anesthesiology. 2001 Jan;94(1):110-9. | ||||
| 109 | Sulfamethoxazole and its metabolite nitroso sulfamethoxazole stimulate dendritic cell costimulatory signaling. J Immunol. 2007 May 1;178(9):5533-42. | ||||
| 110 | Clinical assessment of drug-drug interactions of tasimelteon, a novel dual melatonin receptor agonist J Clin Pharmacol. 2015 Sep;55(9):1004-11. doi: 10.1002/jcph.507. | ||||
| 111 | Human cytochrome p450 induction and inhibition potential of clevidipine and its primary metabolite h152/81. Drug Metab Dispos. 2006 May;34(5):734-7. | ||||
| 112 | Clinically and pharmacologically relevant interactions of antidiabetic drugs. Ther Adv Endocrinol Metab. 2016 Apr;7(2):69-83. | ||||
| 113 | Lack of a pharmacokinetic interaction between oral treprostinil and bosentan in healthy adult volunteers. J Clin Pharmacol. 2010 Jul;50(7):829-34. | ||||
| 114 | O- and N-demethylation of venlafaxine in vitro by human liver microsomes and by microsomes from cDNA-transfected cells: effect of metabolic inhibitors and SSRI antidepressants. Neuropsychopharmacology. 1999 May;20(5):480-90. | ||||
| 115 | Identification of the cytochrome P450 and other enzymes involved in the in vitro oxidative metabolism of a novel antidepressant, Lu AA21004. Drug Metab Dispos. 2012 Jul;40(7):1357-65. | ||||
| 116 | Potential of pranlukast and zafirlukast in the inhibition of human liver cytochrome P450 enzymes. Xenobiotica. 2004 May;34(5):429-38. | ||||
| 117 | Apixaban. Hosp Pharm. 2013 Jun;48(6):494-509. | ||||
| 118 | FDA label:Avapritinib | ||||
| 119 | Avapritinib: First Approval | ||||
| 120 | Binimetinib Is a Potent Reversible and Time-Dependent Inhibitor of Cytochrome P450 1A2 Chem Res Toxicol. 2021 Apr 19;34(4):1169-1174. doi: 10.1021/acs.chemrestox.1c00036. | ||||
| 121 | Product Monograph of Atacand. | ||||
| 122 | Clinical pharmacokinetics and pharmacodynamics of dapagliflozin, a selective inhibitor of sodium-glucose co-transporter type 2. Clin Pharmacokinet. 2014 Jan;53(1):17-27. | ||||
| 123 | Pharmacogenetics aspects of oral anticoagulants therapy. J Med Life. 2015 Apr-Jun;8(2):171-5. | ||||
| 124 | N-demethylation of levo-alpha-acetylmethadol by human placental aromatase. Biochem Pharmacol. 2004 Mar 1;67(5):885-92. | ||||
| 125 | Pharmacogenomics of statins: understanding susceptibility to adverse effects. Pharmgenomics Pers Med. 2016 Oct 3;9:97-106. | ||||
| 126 | Methadone metabolism and drug-drug interactions: in vitro and in vivo literature review. J Pharm Sci. 2018 Dec;107(12):2983-2991. | ||||
| 127 | Induction of human CYP2C9 by rifampicin, hyperforin, and phenobarbital is mediated by the pregnane X receptor. J Pharmacol Exp Ther. 2004 Feb;308(2):495-501. | ||||
| 128 | Functional characterization of human CYP2C9 allelic variants in COS-7 cells. Front Pharmacol. 2016 Apr 25;7:98. | ||||
| 129 | Pitavastatin: a review in hypercholesterolemia. Am J Cardiovasc Drugs. 2017 Apr;17(2):157-168. | ||||
| 130 | DrugBank(Pharmacology-Metabolism):Ruxolitinib | ||||
| 131 | Pharmacokinetics and Pharmacodynamics of Ruxolitinib: A Review | ||||
| 132 | Prediction of in vivo drug-drug interactions between tolbutamide and various sulfonamides in humans based on in vitro experiments. Drug Metab Dispos. 2000 Apr;28(4):475-81. | ||||
| 133 | PubChem:Tapinarof | ||||
| 134 | Timolol metabolism in human liver microsomes is mediated principally by CYP2D6. Drug Metab Dispos. 2007 Jul;35(7):1135-41. | ||||
| 135 | Effects of organic solvents on the activities of cytochrome P450 isoforms, UDP-dependent glucuronyl transferase, and phenol sulfotransferase in human hepatocytes. Drug Metab Dispos. 2001 Feb;29(2):141-4. | ||||
| 136 | Tolterodine, a new muscarinic receptor antagonist, is metabolized by cytochromes P450 2D6 and 3A in human liver microsomes. Drug Metab Dispos. 1998 Apr;26(4):289-93. | ||||
| 137 | In vitro inhibitory effects of troglitazone and its metabolites on drug oxidation activities of human cytochrome P450 enzymes: comparison with pioglitazone and rosiglitazone. Xenobiotica. 2000 Jan;30(1):61-70. | ||||
| 138 | Effect of voriconazole on the pharmacokinetics of diclofenac. Fundam Clin Pharmacol. 2007 Dec;21(6):651-6. | ||||
| 139 | Development, validation and application of the liquid chromatography tandem mass spectrometry method for simultaneous quantification of azilsartan medoxomil (TAK-491), azilsartan (TAK-536), and its 2 metabolites in human plasma | ||||
| 140 | Drug Interactions with Angiotensin Receptor Blockers: Role of Human Cytochromes P450 | ||||
| 141 | Lithium Intoxication in the Elderly: A Possible Interaction between Azilsartan, Fluvoxamine, and Lithium | ||||
| 142 | Critical evaluation of the efficacy and tolerability of azilsartan | ||||
| 143 | Investigation of the mutual pharmacokinetic interactions between bosentan, a dual endothelin receptor antagonist, and simvastatin. Clin Pharmacokinet. 2003;42(3):293-301. | ||||
| 144 | Oxidative metabolism of flunarizine and cinnarizine by microsomes from B-lymphoblastoid cell lines expressing human cytochrome P450 enzymes. Biol Pharm Bull. 1996 Nov;19(11):1511-4. | ||||
| 145 | Cytochrome P450 3A inhibition by ketoconazole affects prasugrel and clopidogrel pharmacokinetics and pharmacodynamics differently. Clin Pharmacol Ther. 2007 May;81(5):735-41. | ||||
| 146 | Differential activation of CYP2C9 variants by dapsone. Biochem Pharmacol. 2004 May 15;67(10):1831-41. | ||||
| 147 | Eletriptan in the management of acute migraine: an update on the evidence for efficacy, safety, and consistent response. Ther Adv Neurol Disord. 2016 Sep;9(5):414-23. | ||||
| 148 | Cytochrome P4502C9-derived epoxyeicosatrienoic acids induce the expression of cyclooxygenase-2 in endothelial cells. Arterioscler Thromb Vasc Biol. 2005 Feb;25(2):321-6. | ||||
| 149 | Inhibition of tolbutamide 4-methylhydroxylation by a series of non-steroidal anti-inflammatory drugs in V79-NH cells expressing human cytochrome P4502C10 | ||||
| 150 | Dataset of the first report of pharmacogenomics profiling in an outpatient spine setting | ||||
| 151 | LABEL:DDYI- flibanserin tablet, film coated | ||||
| 152 | Effect of fluconazole on plasma fluvastatin and pravastatin concentrations. Eur J Clin Pharmacol. 2000 Jun;56(3):225-9. | ||||
| 153 | Effect of CYP2C9 genetic polymorphism on the metabolism of flurbiprofen in vitro. Drug Dev Ind Pharm. 2015;41(8):1363-7. | ||||
| 154 | Role of individual human cytochrome P450 enzymes in the in vitro metabolism of hydromorphone. Xenobiotica. 2004 Apr;34(4):335-44.; | ||||
| 155 | An updated review of iclaprim: a potent and rapidly bactericidal antibiotic for the treatment of skin and skin structure infections and nosocomial pneumonia caused by gram-positive including multidrug-resistant bacteria. Open Forum Infect Dis. 2018 Jan 6;5(2):ofy003. | ||||
| 156 | Lacosamide: what can be expected from the next new antiepileptic drug? Epilepsy Curr. 2009 Sep-Oct;9(5):133-4. | ||||
| 157 | In vitro inhibition of human liver drug metabolizing enzymes by second generation antihistamines. Chem Biol Interact. 1999 Nov 15;123(1):63-79. | ||||
| 158 | Cytochrome P450-mediated bioactivation of mefenamic acid to quinoneimine intermediates and inactivation by human glutathione S-transferases. Chem Res Toxicol. 2014 Dec 15;27(12):2071-81. | ||||
| 159 | Cytochrome P450 metabolic dealkylation of nine N-nitrosodialkylamines by human liver microsomes. Carcinogenesis. 1996 Sep;17(9):2029-34. | ||||
| 160 | Generation and evaluation of a CYP2C9 heteroactivation pharmacophore. J Pharmacol Exp Ther. 2003 Dec;307(3):878-87. | ||||
| 161 | The evolution of antiplatelet therapy in the treatment of acute coronary syndromes: from aspirin to the present day. Drugs. 2012 Nov 12;72(16):2087-116. | ||||
| 162 | Clinically significant pharmacokinetic drug interactions between antiepileptic drugs. J Clin Pharm Ther. 1999 Apr;24(2):87-92. | ||||
| 163 | Interaction between grapefruit juice and hypnotic drugs: comparison of triazolam and quazepam. Eur J Clin Pharmacol. 2006 Mar;62(3):209-15. | ||||
| 164 | Effects of acid and lactone forms of eight HMG-CoA reductase inhibitors on CYP-mediated metabolism and MDR1-mediated transport. Pharm Res. 2006 Mar;23(3):506-12. | ||||
| 165 | Sertraline is metabolized by multiple cytochrome P450 enzymes, monoamine oxidases, and glucuronyl transferases in human: an in vitro study. Drug Metab Dispos. 2005 Feb;33(2):262-70. | ||||
| 166 | Role of cDNA-expressed human cytochromes P450 in the metabolism of diazepam. Biochem Pharmacol. 1998 Mar 15;55(6):889-96. | ||||
| 167 | In vitro drug-drug interaction potential of sulfoxide and/or sulfone metabolites of albendazole, triclabendazole, aldicarb, methiocarb, montelukast and ziprasidone. Drug Metab Lett. 2018;12(2):101-116. | ||||
| 168 | Effects of polymorphisms in CYP2D6, CYP2C9, and CYP2C19 on trimipramine pharmacokinetics. J Clin Psychopharmacol. 2003 Oct;23(5):459-66. | ||||
| 169 | FDA label of Fedratinib. The 2020 official website of the U.S. Food and Drug Administration. | ||||
| 170 | Pharmacokinetic drug interactions between ampiroxicam and sulfaphenazole in rats | ||||
| 171 | Phase 1 study to investigate the pharmacokinetic properties of dacomitinib in healthy adult Chinese subjects genotyped for CYP2D6. Xenobiotica. 2018 May;48(5):459-466. | ||||
| 172 | FDA Label of Enasidenib. The 2020 official website of the U.S. Food and Drug Administration. | ||||
| 173 | Effect of CYP2C9 genetic polymorphisms on the efficacy and pharmacokinetics of glimepiride in subjects with type 2 diabetes. Diabetes Res Clin Pract. 2006 May;72(2):148-54. | ||||
| 174 | In vitro evaluation of cytochrome P450-mediated drug interactions between cytarabine, idarubicin, itraconazole and caspofungin. Hematology. 2004 Jun;9(3):217-21. | ||||
| 175 | FDA Label of Olodaterol. The 2020 official website of the U.S. Food and Drug Administration. | ||||
| 176 | PubChem:Paramethadione | ||||
| 177 | PubChem:Rimegepant | ||||
| 178 | Effects of rimegepant 75?mg daily on the pharmacokinetics of a combined oral contraceptive containing ethinyl estradiol and norgestimate in healthy female participants | ||||
| 179 | SULT 1A3 single-nucleotide polymorphism and the single dose pharmacokinetics of inhaled salbutamol enantiomers: are some athletes at risk of higher urine levels? Drug Test Anal. 2015 Feb;7(2):109-13. doi: 10.1002/dta.1645. | ||||
| 180 | Involvement of cytochrome P450 2C9, 2E1 and 3A4 in trimethadione N-demethylation in human microsomes. J Clin Pharm Ther. 2003 Dec;28(6):493-6. | ||||
| 181 | In vitro inhibition screening of human hepatic P450 enzymes by five angiotensin-II receptor antagonists. Eur J Clin Pharmacol. 2000 May;56(2):135-40. | ||||
| 182 | Protease inhibitors in patients with HIV disease. Clinically important pharmacokinetic considerations. Clin Pharmacokinet. 1997 Mar;32(3):194-209. | ||||
| 183 | Population pharmacokinetic/pharmacodynamic analyses of avatrombopag in patients with chronic liver disease and optimal dose adjustment guide with concomitantly administered CYP3A and CYP2C9 inhibitors. J Clin Pharmacol. 2018 Dec;58(12):1629-1638. | ||||
| 184 | Identification of cytochrome P450 2E1 as the predominant enzyme catalyzing human liver microsomal defluorination of sevoflurane, isoflurane, and methoxyflurane. Anesthesiology. 1993 Oct;79(4):795-807. | ||||
| 185 | Delta-9-Tetrahydrocannabinol and Cannabidiol Drug-Drug Interactions | ||||
| 186 | Characterization of testosterone 11 beta-hydroxylation catalyzed by human liver microsomal cytochromes P450 | ||||
| 187 | FDA label of Trifarotene. The 2020 official website of the U.S. Food and Drug Administration. | ||||
| 188 | Umbralisib: First Approval | ||||
| 189 | Clinical pharmacology of lumiracoxib: a selective cyclo-oxygenase-2 inhibitor. Clin Pharmacokinet. 2005;44(12):1247-66. | ||||
| 190 | Genetic variation in the first-pass metabolism of ethinylestradiol, sex hormone binding globulin levels and venous thrombosis risk Eur J Intern Med. 2017 Jul;42:54-60. doi: 10.1016/j.ejim.2017.05.019. | ||||
| 191 | Metabolism of 17 alpha-ethinylestradiol by human liver microsomes in vitro: aromatic hydroxylation and irreversible protein binding of metabolites J Clin Endocrinol Metab. 1974 Dec;39(6):1072-80. doi: 10.1210/jcem-39-6-1072. | ||||
| 192 | The role of CYP2C in the in vitro bioactivation of the contraceptive steroid desogestrel. J Pharmacol Exp Ther. 1998 Dec;287(3):975-82. | ||||
| 193 | Effects of Dexmedetomidine on the Pharmacokinetics of Parecoxib and Its Metabolite Valdecoxib in Beagles by UPLC-MS/MS. Biomed Res Int. 2020 Aug 6;2020:1563874. doi: 10.1155/2020/1563874. | ||||
| 194 | Quantitative binding models for CYP2C9 based on benzbromarone analogues. Biochemistry. 2004 Jun 8;43(22):6948-58. | ||||
| 195 | Contributions of human cytochrome P450 enzymes to glyburide metabolism. Biopharm Drug Dispos. 2010 May;31(4):228-42. | ||||
| 196 | Ketobemidone is a substrate for cytochrome P4502C9 and 3A4, but not for P-glycoprotein. Xenobiotica. 2005 Aug;35(8):785-96. | ||||
| 197 | Metabolism of MK-0524, a prostaglandin D2 receptor 1 antagonist, in microsomes and hepatocytes from preclinical species and humans | ||||
| 198 | Identification of human cytochrome P450 isozymes involved in the metabolism of naftopidil enantiomers in vitro. J Pharm Pharmacol. 2014 Nov;66(11):1534-51. | ||||
| 199 | No influence of the CYP2C19-selective inhibitor omeprazole on the pharmacokinetics of the dopamine receptor agonist rotigotine | ||||
| 200 | Eurartesim - European Medicines Agency | ||||
| 201 | In vitro metabolism of TAK-438, vonoprazan fumarate, a novel potassium-competitive acid blocker. Xenobiotica. 2017 Dec;47(12):1027-1034. | ||||
| 202 | Metabolism of aceclofenac in humans. Drug Metab Dispos. 1996 Aug;24(8):834-41. | ||||
| 203 | Role of human liver cytochrome P4503A in the metabolism of etoricoxib, a novel cyclooxygenase-2 selective inhibitor. Drug Metab Dispos. 2001 Jun;29(6):813-20. | ||||
| 204 | Pharmacokinetic evaluation of idebenone. Expert Opin Drug Metab Toxicol. 2010 Nov;6(11):1437-44. | ||||
| 205 | Lack of effect of Imrecoxib, an innovative and moderate COX-2 inhibitor, on pharmacokinetics and pharmacodynamics of warfarin in healthy volunteers. Sci Rep. 2019 Oct 31;9(1):15774. | ||||
| 206 | Activation of phenacetin O-deethylase activity by alpha-naphthoflavone in human liver microsomes. Xenobiotica. 1999 Sep;29(9):885-98. | ||||
| 207 | Effects of serum albumin and liver cytosol on CYP2C9- and CYP3A4-mediated drug metabolism. Drug Metab Pharmacokinet. 2002;17(6):522-31. | ||||
| 208 | Cytochrome P450 enzymes and UDP-glucuronosyltransferases as hepatocellular autoantigens. Mol Biol Rep. 1996;23(3-4):235-42. | ||||
| 209 | Glucuronidation of antiallergic drug, Tranilast: identification of human UDP-glucuronosyltransferase isoforms and effect of its phase I metabolite. Drug Metab Dispos. 2007 Apr;35(4):583-9. | ||||
| 210 | CYP3A4 is the major CYP isoform mediating the in vitro hydroxylation and demethylation of flunitrazepam. Drug Metab Dispos. 2001 Feb;29(2):133-40. | ||||
| 211 | Cytochrome P-450 enzymes and FMO3 contribute to the disposition of the antipsychotic drug perazine in vitro. Psychopharmacology (Berl). 2000 Sep;151(4):312-20. | ||||
| 212 | Cytochrome P-450 3A4 and 2C8 are involved in zopiclone metabolism. Drug Metab Dispos. 1999 Sep;27(9):1068-73. | ||||
| 213 | Characterization of kinetics of human cytochrome P450s involved in bioactivation of flucloxacillin: inhibition of CYP3A-catalysed hydroxylation by sulfaphenazole. Br J Pharmacol. 2019 Feb;176(3):466-477. | ||||
| 214 | Product Monograph of Xtandi Rupatadine (as rupatadine fumarate). | ||||
| 215 | CYP2C9 genotypes and the pharmacokinetics of tenoxicam in Brazilians. Clin Pharmacol Ther. 2004 Jul;76(1):18-26. | ||||
| 216 | Comparative pharmacokinetics of vitamin K antagonists: warfarin, phenprocoumon and acenocoumarol. Clin Pharmacokinet. 2005;44(12):1227-46. | ||||
| 217 | Prediction of pharmacokinetic drug/drug interactions from In vitro data: interactions of the nonsteroidal anti-inflammatory drug lornoxicam with oral anticoagulants. Drug Metab Dispos. 2000 Feb;28(2):161-8. | ||||
| 218 | Interaction of acenocoumarol and sitaxentan in pulmonary arterial hypertension. Eur J Clin Invest. 2009 Jun;39 Suppl 2:14-8. | ||||
| 219 | Protein binding and the metabolism of thiamylal enantiomers in vitro. Anesth Analg. 2000 Sep;91(3):736-40. | ||||
| 220 | Effects of Hepatic Impairment on the Pharmacokinetics of Abrocitinib and Its Metabolites | ||||
| 221 | Characterization of the oxidative metabolites of 17beta-estradiol and estrone formed by 15 selectively expressed human cytochrome p450 isoforms. Endocrinology. 2003 Aug;144(8):3382-98. | ||||
| 222 | Physiologically Based Pharmacokinetic Modeling for Selumetinib to Evaluate Drug-Drug Interactions and Pediatric Dose Regimens | ||||
| 223 | Metabolism, Excretion, and Pharmacokinetics of Selumetinib, an MEK1/2 inhibitor, in Healthy Adult Male Subjects | ||||
| 224 | Involvement of multiple cytochrome P450 and UDP-glucuronosyltransferase enzymes in the in vitro metabolism of muraglitazar. Drug Metab Dispos. 2007 Jan;35(1):139-49. | ||||
| 225 | Australian Public Assessment Report for asunaprevir. | ||||
| 226 | DrugBank(Pharmacology-Metabolism):Mavacamten | ||||
| 227 | Studies on the metabolic fate of M17055, a novel diuretic (4): species difference in metabolic pathway and identification of human CYP isoform responsible for the metabolism of M17055 | ||||
| 228 | Molecular targets of cannabidiol in neurological disorders. Neurotherapeutics. 2015 Oct;12(4):699-730. | ||||
| 229 | Clinical pharmacokinetics of losartan. Clin Pharmacokinet. 2005;44(8):797-814. | ||||
| 230 | Disposition and metabolism of semagacestat, a {gamma}-secretase inhibitor, in humans. Drug Metab Dispos. 2010 Apr;38(4):554-65. | ||||
| 231 | Effect of netupitant, a highly selective NK?receptor antagonist, on the pharmacokinetics of palonosetron and impact of the fixed dose combination of netupitant and palonosetron when coadministered with ketoconazole, rifampicin, and oral contraceptives. Support Care Cancer. 2013 Oct;21(10):2879-87. | ||||
| 232 | CYP-eicosanoids--a new link between omega-3 fatty acids and cardiac disease? Prostaglandins Other Lipid Mediat. 2011 Nov;96(1-4):99-108. | ||||
| 233 | Pharmacokinetic profile of dexloxiglumide. Clin Pharmacokinet. 2006;45(12):1177-88. | ||||
| 234 | S-oxidation of S-methyl-esonarimod by flavin-containing monooxygenases in human liver microsomes | ||||
| 235 | In vitro evaluation of fenfluramine and norfenfluramine as victims of drug interactions | ||||
| 236 | Plasma pharmacokinetics and CYP3A12-dependent metabolism of c-kit inhibitor imatinib in dogs | ||||
| 237 | DrugBank(Pharmacology-Metabolism):TAK-491 | ||||
| 238 | DrugBank(Pharmacology-Metabolism):MRTX849 | ||||
| 239 | Functional Measurement of CYP2C9 and CYP3A4 Allelic Polymorphism on Sildenafil Metabolism | ||||
| 240 | DrugBank(Pharmacology-Metabolism):Ag-221 | ||||
| 241 | Clinical Pharmacology of Clazosentan, a Selective Endothelin A Receptor Antagonist for the Prevention and Treatment of aSAH-Related Cerebral Vasospasm | ||||
| 242 | Pharmacokinetics and disposition of momelotinib revealed a disproportionate human metabolite-resolution for clinical development. Drug Metab Dispos. 2018 Mar;46(3):237-247. | ||||
| 243 | Lactobacillus rhamnosus induces CYP3A and changes the pharmacokinetics of verapamil in rats | ||||
| 244 | In vitro characterization of sarizotan metabolism: hepatic clearance, identification and characterization of metabolites, drug-metabolizing enzyme identification, and evaluation of cytochrome p450 inhibition. Drug Metab Dispos. 2010 Jun;38(6):905-16. | ||||
| 245 | Aromatic hydroxylation of salicylic acid and aspirin by human cytochromes P450. Eur J Pharm Sci. 2015 Jun 20;73:49-56. | ||||
| 246 | Pharmacokinetics of arundic acid, an astrocyte modulating agent, in acute ischemic stroke | ||||
| 247 | Pharmacokinetics, metabolism, and excretion of licogliflozin, a dual inhibitor of SGLT1/2, in rats, dogs, and humans | ||||
| 248 | Evaluation of the Absorption, Metabolism, and Excretion of a Single Oral 1-mg Dose of Tropifexor in Healthy Male Subjects and the Concentration Dependence of Tropifexor Metabolism | ||||
| 249 | Metabolic Profiling of the Novel Hypoxia-Inducible Factor 2 Inhibitor PT2385 In Vivo and In Vitro | ||||
| 250 | Machine learning-driven identification of drugs inhibiting cytochrome P450 2C9 | ||||
| 251 | Assessment of the drug interaction risk for remogliflozin etabonate, a sodium-dependent glucose cotransporter-2 inhibitor: evidence from in vitro, human mass balance, and ketoconazole interaction studies | ||||
| 252 | In vitro inhibition and enhancement of liver microsomal S-777469 metabolism by long-chain fatty acids and serum albumin: insight into in vitro and in vivo discrepancy of metabolite formation in humans | ||||
| 253 | In vitro metabolism of ferroquine (SSR97193) in animal and human hepatic models and antimalarial activity of major metabolites on Plasmodium falciparum. Drug Metab Dispos. 2006 Apr;34(4):667-82. | ||||
| 254 | Effect of deuteration on metabolism and clearance of Nerispirdine (HP184) and AVE5638 | ||||
| 255 | Metabolism and transport of oxazaphosphorines and the clinical implications Drug Metab Rev. 2005;37(4):611-703. doi: 10.1080/03602530500364023. | ||||
| 256 | In vitro assessment of metabolic drugCdrug interaction potential of AZD2624, neurokinin-3 receptor antagonist, through cytochrome P(450) enzyme identification, inhibition, and induction studies | ||||
| 257 | In vitro prediction and in vivo verification of enantioselective human tofisopam metabolite profiles | ||||
| 258 | Role of CYP2C9, CYP2C19 and EPHX Polymorphism in the Pharmacokinetic of Phenytoin: A Study on Uruguayan Caucasian Subjects | ||||
| 259 | PK/PD model of indisulam and capecitabine: interaction causes excessive myelosuppression. Clin Pharmacol Ther. 2008 Jun;83(6):829-39. | ||||
| 260 | Evaluation of the drug-drug interaction potential for trazpiroben (TAK-906), a D(2)/D(3) receptor antagonist for gastroparesis, towards cytochrome P450s and transporters | ||||
| 261 | Metabolic map and bioactivation of the anti-tumour drug noscapine | ||||
| 262 | Assessment of drug-drug interaction potential and PBPK modeling of CC-223, a potent inhibitor of the mammalian target of rapamycin kinase. Xenobiotica. 2019 Jan;49(1):54-70. | ||||
| 263 | The Utilization of Mu-Opioid Receptor Biased Agonists: Oliceridine, an Opioid Analgesic with Reduced Adverse Effects | ||||
| 264 | Identification of enzymes responsible for primary and sequential oxygenation reactions of capravirine in human liver microsomes. Drug Metab Dispos. 2006 Nov;34(11):1798-802. | ||||
| 265 | In vitro metabolism of irosustat, a novel steroid sulfatase inhibitor: interspecies comparison, metabolite identification, and metabolic enzyme identification | ||||
| 266 | Pharmacokinetics and Metabolism of Naringin and Active Metabolite Naringenin in Rats, Dogs, Humans, and the Differences Between Species | ||||
| 267 | Nonclinical pharmacokinetics and in vitro metabolism of H3B-6545, a novel selective ERalpha covalent antagonist (SERCA). Cancer Chemother Pharmacol. 2019 Jan;83(1):151-160. | ||||
| 268 | Elucidating the Mechanisms of Formation for Two Unusual Cytochrome P450-Mediated Fused Ring Metabolites of GDC-0623, a MAPK/ERK Kinase Inhibitor | ||||
| 269 | N-oxidation of irsogladine by the CYP2C subfamily in the rat, dog, monkey and man | ||||
| 270 | A first-in-human phase I, dose-escalation, multicentre study of HSP990 administered orally in adult patients with advanced solid malignancies. Br J Cancer. 2015 Feb 17;112(4):650-9. | ||||
| 271 | An assessment of human liver-derived in vitro systems to predict the in vivo metabolism and clearance of almokalant | ||||
| 272 | Absorption, metabolism, and excretion of [14C]MK-0767 (2-methoxy-5-(2,4-dioxo-5-thiazolidinyl)-N-[[4-(trifluoromethyl)phenyl] methyl]benzamide) in humans | ||||
| 273 | [Investigation of metabolic kinetics and reaction phenotyping of ligustrazin by using liver microsomes and recombinant human enzymes] | ||||
| 274 | Behavior of thymidylate kinase toward monophosphate metabolites and its role in the metabolism of 1-(2'-deoxy-2'-fluoro-beta-L-arabinofuranosyl)-5-methyluracil (Clevudine) and 2',3'-didehydro-2',3'-dideoxythymidine in cells. Antimicrob Agents Chemother. 2005 May;49(5):2044-9. doi: 10.1128/AAC.49.5.2044-2049.2005. | ||||
| 275 | Combined in vitro-in vivo approach to assess the hepatobiliary disposition of a novel oral thrombin inhibitor | ||||
| 276 | Pharmacokinetics and metabolism of TR-14035, a novel antagonist of a4ss1/a4ss7 integrin mediated cell adhesion, in rat and dog | ||||
| 277 | Absorption and disposition including enterohepatic circulation of (14C) roquinimex after oral administration to healthy volunteers | ||||
| 278 | Identification of cytochrome P4503A as the major subfamily responsible for the metabolism of roquinimex in man. Xenobiotica. 2000 Sep;30(9):905-14. | ||||
| 279 | Using chimeric mice with humanized livers to predict human drug metabolism and a drug-drug interaction. J Pharmacol Exp Ther. 2013 Feb;344(2):388-96. | ||||
| 280 | Cytochrome P450 4A11 inhibition assays based on characterization of lauric acid metabolites | ||||
| 281 | Characterization of human cytochrome P450 enzymes involved in the metabolism of cyamemazine. Eur J Pharm Sci. 2007 Dec;32(4-5):357-66. | ||||
| 282 | Metabolism of JQ1, an inhibitor of bromodomain and extra terminal bromodomain proteins, in human and mouse liver microsomes? | ||||
| 283 | Identification of cytochromes P450 involved in the human liver microsomal metabolism of the thromboxane A2 inhibitor seratrodast (ABT-001). Drug Metab Dispos. 1997 Jan;25(1):110-5. | ||||
| 284 | High-performance liquid chromatographic determination of seratrodast and its metabolites in human serum and urine | ||||
| 285 | DrugBank(Pharmacology-Metabolism)Aceclofenac | ||||
| 286 | Oxidative metabolism of amprenavir in the human liver. Effect of the CYP3A maturation. Drug Metab Dispos. 2003 Mar;31(3):275-81. | ||||
| 287 | Apixaban. After hip or knee replacement: LMWH remains the standard treatment. Prescrire Int. 2012 Sep;21(130):201-2, 204. | ||||
| 288 | Role of cytochrome P450 enzymes in the bioactivation of polyunsaturated fatty acids. Biochim Biophys Acta. 2011 Jan;1814(1):210-22. | ||||
| 289 | Use of a physiologically-based pharmacokinetic model to simulate artemether dose adjustment for overcoming the drug-drug interaction with efavirenz In Silico Pharmacol. 2013 Mar 1;1:4. doi: 10.1186/2193-9616-1-4. | ||||
| 290 | LC-MS/MS determination of avanafil and its metabolites in rat plasma and brain: pharmacokinetic study after oral administration and transdermal film application | ||||
| 291 | FDA:Avanafil | ||||
| 292 | Identification of Epoxide-Derived Metabolite(s) of Benzbromarone | ||||
| 293 | In vitro and in vivo clinical pharmacology of dimethyl benzoylphenylurea, a novel oral tubulin-interactive agent | ||||
| 294 | Phase I study of continuous weekly dosing of dimethylamino benzoylphenylurea (BPU) in patients with solid tumours | ||||
| 295 | Glucuronidation as a major metabolic clearance pathway of 14c-labeled muraglitazar in humans: metabolic profiles in subjects with or without bile collection Drug Metab Dispos. 2006 Mar;34(3):427-39. doi: 10.1124/dmd.105.007617. | ||||
| 296 | Gut flora metabolism of phosphatidylcholine promotes cardiovascular disease Nature. 2011 Apr 7;472(7341):57-63. doi: 10.1038/nature09922. | ||||
| 297 | NORMAN Suspect List Exchange:Choline | ||||
| 298 | Metabolic disposition of 14C-bromfenac in healthy male volunteers J Clin Pharmacol. 1998 Aug;38(8):744-52. doi: 10.1002/j.1552-4604.1998.tb04815.x. | ||||
| 299 | In vitro metabolism study of buprenorphine: evidence for new metabolic pathways. Drug Metab Dispos. 2005 May;33(5):689-95. | ||||
| 300 | Clinical Pharmacokinetics and Pharmacodynamics of Cabozantinib Clin Pharmacokinet. 2017 May;56(5):477-491. doi: 10.1007/s40262-016-0461-9. | ||||
| 301 | PharmGKB summary: caffeine pathway. Pharmacogenet Genomics. 2012 May;22(5):389-95. | ||||
| 302 | Urine caffeine metabolites are positively associated with cognitive performance in older adults: An analysis of US National Health and Nutrition Examination Survey (NHANES) 2011 to 2014. Nutr Res. 2023 Jan;109:12-25. doi: 10.1016/j.nutres.2022.11.002. | ||||
| 303 | Metabolism of carvedilol in dogs, rats, and mice Drug Metab Dispos. 1998 Oct;26(10):958-69. | ||||
| 304 | Celecoxib pathways: pharmacokinetics and pharmacodynamics. Pharmacogenet Genomics. 2012 Apr;22(4):310-8. | ||||
| 305 | Identification of human hepatic cytochrome p450 enzymes involved in the biotransformation of cholic and chenodeoxycholic acid. Drug Metab Dispos. 2008 Oct;36(10):1983-91. | ||||
| 306 | DrugBank : Cinnarizine | ||||
| 307 | Effect of azole antifungals ketoconazole and fluconazole on the pharmacokinetics of dexloxiglumide. Br J Clin Pharmacol. 2005 Nov;60(5):498-507. | ||||
| 308 | Active cyamemazine metabolites in patients treated with cyamemazine (Tercian?): influence on cerebral dopamine D2 and serotonin 5-HT (2A) receptor occupancy as measured by positron emission tomography (PET) | ||||
| 309 | The KEGG resource for deciphering the genome | ||||
| 310 | Aprepitant inhibits cyclophosphamide bioactivation and thiotepa metabolism | ||||
| 311 | Dacomitinib: an investigational drug for the treatment of glioblastoma Expert Opin Investig Drugs. 2018 Oct;27(10):823-829. doi: 10.1080/13543784.2018.1528225. | ||||
| 312 | LC-MS/MS analysis of dextromethorphan metabolism in human saliva and urine to determine CYP2D6 phenotype and individual variability in N-demethylation and glucuronidation J Chromatogr B Analyt Technol Biomed Life Sci. 2004 Dec 25;813(1-2):217-25. doi: 10.1016/j.jchromb.2004.09.040. | ||||
| 313 | Classics in Chemical Neuroscience: Dextromethorphan (DXM). ACS Chem Neurosci. 2023 Jun 21;14(12):2256-2270. doi: 10.1021/acschemneuro.3c00088. | ||||
| 314 | Study on the Pharmacokinetics of Diazepam and Its Metabolites in Blood of Chinese People Eur J Drug Metab Pharmacokinet. 2020 Aug;45(4):477-485. doi: 10.1007/s13318-020-00614-8. | ||||
| 315 | Pharmacokinetics of Diazepam and Its Metabolites in Urine of Chinese Participants. Drugs R D. 2022 Mar;22(1):43-50. doi: 10.1007/s40268-021-00375-y. | ||||
| 316 | Kinetic disposition of diazepam and its metabolites after intravenous administration of diazepam in the horse: Relevance for doping control. J Vet Pharmacol Ther. 2021 Sep;44(5):733-744. doi: 10.1111/jvp.12991. | ||||
| 317 | DrugBank(Pharmacology-Metabolism)Diazepam | ||||
| 318 | DrugBank(Pharmacology-Metabolism)Diclofenac sodium | ||||
| 319 | Plasma and synovial fluid concentrations of diclofenac sodium and its major hydroxylated metabolites during long-term treatment of rheumatoid arthritis Eur J Clin Pharmacol. 1983;25(3):389-94. doi: 10.1007/BF01037953. | ||||
| 320 | Simultaneous determination of diclofenac sodium and its hydroxy metabolites by capillary column gas chromatography with electron-capture detection J Chromatogr. 1981 Nov 6;217:263-71. doi: 10.1016/s0021-9673(00)88081-4. | ||||
| 321 | Clinical pharmacokinetics of diclofenac. Therapeutic insights and pitfalls Clin Pharmacokinet. 1997 Sep;33(3):184-213. doi: 10.2165/00003088-199733030-00003. | ||||
| 322 | Identification of human cytochrome p450 isozymes involved in diphenhydramine N-demethylation. Drug Metab Dispos. 2007 Jan;35(1):72-8. | ||||
| 323 | Bioconcentration, metabolism and effects of diphenhydramine on behavioral and biochemical markers in crucian carp (Carassius auratus) Sci Total Environ. 2016 Feb 15;544:400-9. doi: 10.1016/j.scitotenv.2015.11.132. | ||||
| 324 | Non-invasive skin sampling detects systemically administered drugs in humans. PLoS One. 2022 Jul 26;17(7):e0271794. doi: 10.1371/journal.pone.0271794. | ||||
| 325 | Pharmacogenomics knowledge for personalized medicine Clin Pharmacol Ther. 2012 Oct;92(4):414-7. doi: 10.1038/clpt.2012.96. | ||||
| 326 | Characterization of human hepatic and extrahepatic UDP-glucuronosyltransferase enzymes involved in the metabolism of classic cannabinoids | ||||
| 327 | Cannabinoid Metabolites as Inhibitors of Major Hepatic CYP450 Enzymes, with Implications for Cannabis-Drug Interactions | ||||
| 328 | Cytochromes P450: a structure-based summary of biotransformations using representative substrates Drug Metab Rev. 2008;40(1):1-100. doi: 10.1080/03602530802309742. | ||||
| 329 | Eletriptan metabolism by human hepatic CYP450 enzymes and transport by human P-glycoprotein. Drug Metab Dispos. 2003 Jul;31(7):861-9. | ||||
| 330 | FDA:Enasidenib | ||||
| 331 | Synthetic and natural compounds that interact with human cytochrome P450 1A2 and implications in drug development. Curr Med Chem. 2009;16(31):4066-218. | ||||
| 332 | Sulfotransferase 1E1 is a low km isoform mediating the 3-O-sulfation of ethinyl estradiol Drug Metab Dispos. 2004 Nov;32(11):1299-303. doi: 10.1124/dmd.32.11.. | ||||
| 333 | Etodolac clinical pharmacokinetics | ||||
| 334 | Absorption, metabolism, and excretion of etoricoxib, a potent and selective cyclooxygenase-2 inhibitor, in healthy male volunteers | ||||
| 335 | Clinical pharmacokinetics and pharmacodynamics of etravirine. Clin Pharmacokinet. 2009;48(9):561-74. | ||||
| 336 | In vitro drug-drug interaction studies with febuxostat, a novel non-purine selective inhibitor of xanthine oxidase: plasma protein binding, identification of metabolic enzymes and cytochrome P450 inhibition. Xenobiotica. 2008 May;38(5):496-510. | ||||
| 337 | U. S. FDA Label -Fenfluramine | ||||
| 338 | (R)-, (S)-, and racemic fluoxetine N-demethylation by human cytochrome P450 enzymes. Drug Metab Dispos. 2000 Oct;28(10):1187-91. | ||||
| 339 | Simultaneous identification and quantitation of fluoxetine and its metabolite, norfluoxetine, in biological samples by GC-MS | ||||
| 340 | Comparative studies on the catalytic roles of cytochrome P450 2C9 and its Cys- and Leu-variants in the oxidation of warfarin, flurbiprofen, and diclofenac by human liver microsomes | ||||
| 341 | Roles of different CYP enzymes in the formation of specific fluvastatin metabolites by human liver microsomes. Basic Clin Pharmacol Toxicol. 2009 Nov;105(5):327-32. | ||||
| 342 | Assessment of ifosfamide pharmacokinetics, toxicity, and relation to CYP3A4 activity as measured by the erythromycin breath test in patients with sarcoma Cancer. 2007 Jun 1;109(11):2315-22. doi: 10.1002/cncr.22669. | ||||
| 343 | Diagnosis and subclassification of follicle center and mantle cell lymphomas on fine-needle aspirates: A cytologic and immunocytochemical approach based on the Revised European-American Lymphoma (REAL) classification Cancer. 1999 Aug 25;87(4):216-23. | ||||
| 344 | Mass balance and metabolism of [(3)H]Formoterol in healthy men after combined i.v. and oral administration-mimicking inhalation Drug Metab Dispos. 1999 Oct;27(10):1104-16. | ||||
| 345 | Kinetics of glyburide metabolism by hepatic and placental microsomes of human and baboon | ||||
| 346 | Identification of CYP3A7 for glyburide metabolism in human fetal livers. Biochem Pharmacol. 2014 Dec 15;92(4):690-700. | ||||
| 347 | Identification of glyburide metabolites formed by hepatic and placental microsomes of humans and baboons | ||||
| 348 | The metabolism of gliclazide in man | ||||
| 349 | Simultaneous determination of glimepiride and its metabolites in human plasma by liquid chromatography coupled to a tandem mass spectrometry Arch Pharm Res. 2011 Dec;34(12):2073-8. doi: 10.1007/s12272-011-1210-0. | ||||
| 350 | Simultaneous determination of glipizide and its four hydroxylated metabolites in human urine using LC-MS/MS and its application in urinary phenotype study J Pharm Biomed Anal. 2017 May 30;139:179-186. doi: 10.1016/j.jpba.2017.03.005. | ||||
| 351 | U. S. FDA Label -Glipizide | ||||
| 352 | Contribution of cytochrome P450 isoforms to gliquidone metabolism in rats and human | ||||
| 353 | DrugBank(Pharmacology-Metabolism): GV-150526 Tretazicar | ||||
| 354 | Role of cytochrome P450 activity in the fate of anticancer agents and in drug resistance: focus on tamoxifen, paclitaxel and imatinib metabolism | ||||
| 355 | Participation of CYP2C8 and CYP3A4 in the N-demethylation of imatinib in human hepatic microsomes | ||||
| 356 | In vitro biotransformation of imatinib by the tumor expressed CYP1A1 and CYP1B1 | ||||
| 357 | Comparative in vitro metabolism of phospho-tyrosol-indomethacin by mice, rats and humans Biochem Pharmacol. 2013 Apr 15;85(8):1195-202. doi: 10.1016/j.bcp.2013.01.031. | ||||
| 358 | Biotransformation of irbesartan in man Drug Metab Dispos. 1998 May;26(5):408-17. | ||||
| 359 | PubChem : JNJ-54135419 | ||||
| 360 | The clinical toxicology of ketamine. Clin Toxicol (Phila). 2023 Jun;61(6):415-428. doi: 10.1080/15563650.2023.2212125. | ||||
| 361 | Pharmacokinetics of Ketamine Transfer Into Human Milk. J Clin Psychopharmacol. 2023 May 23. doi: 10.1097/JCP.0000000000001711. | ||||
| 362 | Chronic exposure to (2?R,6?R)-hydroxynorketamine induces developmental neurotoxicity in hESC-derived cerebral organoids. J Hazard Mater. 2023 Jul 5;453:131379. doi: 10.1016/j.jhazmat.2023.131379. | ||||
| 363 | Characterization and quantification of metabolites of racemic ketoprofen excreted in urine following oral administration to man by 1H-NMR spectroscopy, directly coupled HPLC-MS and HPLC-NMR, and circular dichroism Xenobiotica. 2004 Nov-Dec;34(11-12):1075-89. doi: 10.1080/00498250412331281098. | ||||
| 364 | Identification and structural characterization of in vivo metabolites of ketorolac using liquid chromatography electrospray ionization tandem mass spectrometry (LC/ESI-MS/MS) J Mass Spectrom. 2012 Jul;47(7):919-31. doi: 10.1002/jms.3043. | ||||
| 365 | Label:KLH-2109 | ||||
| 366 | Absorption, disposition, metabolic fate and elimination of the anti-epileptic drug lacosamide in humans: mass balance following intravenous and oral administration Eur J Drug Metab Pharmacokinet. 2012 Dec;37(4):241-8. doi: 10.1007/s13318-012-0093-x. | ||||
| 367 | Effect of the CYP2C9*3 allele on lornoxicam metabolism | ||||
| 368 | In vitro and in vivo pharmacokinetic characterization of mavacamten, a first-in-class small molecule allosteric modulator of beta cardiac myosin | ||||
| 369 | A prospective longitudinal study of growth in twin gestations compared with growth in singleton pregnancies. I. The fetal head J Ultrasound Med. 1991 Aug;10(8):439-43. doi: 10.7863/jum.1991.10.8.439. | ||||
| 370 | Metabolism of Meloxicam in human liver involves cytochromes P4502C9 and 3A4. Xenobiotica. 1998 Jan;28(1):1-13. | ||||
| 371 | Quantification of mephenytoin and its metabolites 4'-hydroxymephenytoin and nirvanol in human urine using a simple sample processing method | ||||
| 372 | Relation of in vivo drug metabolism to stereoselective fetal hydantoin toxicology in mouse: evaluation of mephenytoin and its metabolite, nirvanol | ||||
| 373 | Biotransformation of mestranol to ethinyl estradiol in vitro: the role of cytochrome P-450 2C9 and metabolic inhibitors. J Clin Pharmacol. 1997 Mar;37(3):193-200. | ||||
| 374 | Metamizole (Dipyrone) and the Liver: A Review of the Literature J Clin Pharmacol. 2019 Nov;59(11):1433-1442. doi: 10.1002/jcph.1512. | ||||
| 375 | Clinical pharmacokinetics of dipyrone and its metabolites Clin Pharmacokinet. 1995 Mar;28(3):216-34. doi: 10.2165/00003088-199528030-00004. | ||||
| 376 | Effects of cytochrome P450 single nucleotide polymorphisms on methadone metabolism and pharmacodynamics | ||||
| 377 | Identification of novel metoclopramide metabolites in humans: in vitro and in vivo studies | ||||
| 378 | DrugBank(Pharmacology-Metabolism):Adagrasib | ||||
| 379 | Characterization of Ca(2+)-antagonistic effects of three metabolites of the new antihypertensive agent naftopidil, (naphthyl)hydroxy-naftopidil, (phenyl)hydroxy-naftopidil, and O-desmethyl-naftopidil J Cardiovasc Pharmacol. 1991 Dec;18(6):918-25. doi: 10.1097/00005344-199112000-00020. | ||||
| 380 | Involvement of multiple cytochrome P450 isoforms in naproxen O-demethylation. Eur J Clin Pharmacol. 1997;52(4):293-8. | ||||
| 381 | S-Naproxen and desmethylnaproxen glucuronidation by human liver microsomes and recombinant human UDP-glucuronosyltransferases (UGT): role of UGT2B7 in the elimination of naproxen. Br J Clin Pharmacol. 2005 Oct;60(4):423-33. | ||||
| 382 | [Pharmacokinetics of phenazone after bilateral ovariectomy in female rabbits] | ||||
| 383 | Pharmacokinetics of nateglinide enantiomers and their metabolites in Goto-Kakizaki rats, a model for type 2 diabetes mellitus | ||||
| 384 | Absorption, disposition, metabolic fate, and elimination of the dopamine agonist rotigotine in man: administration by intravenous infusion or transdermal delivery | ||||
| 385 | Disposition and biotransformation of the antiretroviral drug nevirapine in humans Drug Metab Dispos. 1999 Aug;27(8):895-901. | ||||
| 386 | Differences in nevirapine biotransformation as a factor for its sex-dependent dimorphic profile of adverse drug reactions J Antimicrob Chemother. 2014 Feb;69(2):476-82. doi: 10.1093/jac/dkt359. | ||||
| 387 | Sulfation of 12-hydroxy-nevirapine by human SULTs and the effects of genetic polymorphisms of SULT1A1 and SULT2A1. Biochem Pharmacol. 2022 Oct;204:115243. doi: 10.1016/j.bcp.2022.115243. | ||||
| 388 | DrugBank(Pharmacology-Metabolism)Olodaterol hydrochloride | ||||
| 389 | Paramethadione and metabolite serum levels in humans after a single oral paramethadione dose J Pharm Sci. 1975 Oct;64(10):1702-3. doi: 10.1002/jps.2600641027. | ||||
| 390 | Disposition of a specific cyclooxygenase-2 inhibitor, valdecoxib, in human Drug Metab Dispos. 2002 Sep;30(9):1013-21. doi: 10.1124/dmd.30.9.1013. | ||||
| 391 | CYP2C19 polymorphism effect on phenobarbitone. Pharmacokinetics in Japanese patients with epilepsy: analysis by population pharmacokinetics. Eur J Clin Pharmacol. 2000 Feb-Mar;55(11-12):821-5. | ||||
| 392 | The metabolism of the piperazine-type phenothiazine neuroleptic perazine by the human cytochrome P-450 isoenzymes. Eur Neuropsychopharmacol. 2004 May;14(3):199-208. | ||||
| 393 | Anti-Parkinson's disease drugs and pharmacogenetic considerations Expert Opin Drug Metab Toxicol. 2013 Jul;9(7):859-74. doi: 10.1517/17425255.2013.789018. | ||||
| 394 | Simulation of human plasma concentration-time profiles of the partial glucokinase activator PF-04937319 and its disproportionate N-demethylated metabolite using humanized chimeric mice and semi-physiological pharmacokinetic modeling | ||||
| 395 | Validation of enantioseparation and quantitation of an active metabolite of abrocitinib in human plasma | ||||
| 396 | The Pharmacokinetics, Metabolism, and Clearance Mechanisms of Abrocitinib, a Selective Janus Kinase Inhibitor, in Humans | ||||
| 397 | Safety, pharmacokinetics and pharmacodynamics of four-hour intravenous infusions of eritoran in healthy Japanese and Caucasian men | ||||
| 398 | The Analysis of Phenylbutazone and Its Active Metabolite, Oxyphenbutazone, in Equine Tissues (Muscle, Kidney, and Liver), Urine, and Serum by LC-MS/MS | ||||
| 399 | McEvoy, G.K. (ed.). American Hospital Formulary Service - Drug Information 1999. Bethesda, MD:American Society of Health-System Pharmacists, Inc. 1999 (Plus Supplements)., p. 1760 | ||||
| 400 | In vivo Piroxicam Metabolites: Possible Source for Synthesis of Central Nervous System (CNS) Acting Depressants Cent Nerv Syst Agents Med Chem. 2017;17(3):172-177. doi: 10.2174/1871524917666161111093759. | ||||
| 401 | Metabolism of piroxicam by laboratory animals Drug Metab Dispos. 1981 Mar-Apr;9(2):114-8. | ||||
| 402 | Metabolic fate of pitavastatin, a new inhibitor of HMG-CoA reductase: human UDP-glucuronosyltransferase enzymes involved in lactonization. Xenobiotica. 2003 Jan;33(1):27-41. | ||||
| 403 | Determination of the active and inactive metabolites of prasugrel in human plasma by liquid chromatography/tandem mass spectrometry Rapid Commun Mass Spectrom. 2007;21(2):169-79. doi: 10.1002/rcm.2813. | ||||
| 404 | Interactions of fentanyl with blood platelets and plasma proteins: platelet sensitivity to prasugrel metabolite is not affected by fentanyl under in vitro conditions. Pharmacol Rep. 2023 Apr;75(2):423-441. doi: 10.1007/s43440-023-00447-7. | ||||
| 405 | Pharmacokinetic and Pharmacodynamic Modeling and Simulation Analysis of Prasugrel in Healthy Male Volunteers. Clin Pharmacol Drug Dev. 2023 Jan;12(1):21-29. doi: 10.1002/cpdd.1172. | ||||
| 406 | Physiologically based pharmacokinetics model of primidone and its metabolites phenobarbital and phenylethylmalonamide in humans, rats, and mice Drug Metab Dispos. 1998 Jun;26(6):585-94. | ||||
| 407 | Blood and cerebrospinal fluid pharmacokinetics of primidone and its primary pharmacologically active metabolites, phenobarbital and phenylethylmalonamide in the rat Eur J Drug Metab Pharmacokinet. 1999 Jul-Sep;24(3):255-64. doi: 10.1007/BF03190029. | ||||
| 408 | Managing the Drug-Drug Interaction With Apixaban and Primidone: A Case Report. Hosp Pharm. 2023 Aug;58(4):345-349. doi: 10.1177/00185787221150928. | ||||
| 409 | Ticagrelor and primidone interaction masquerading as dual antiplatelet therapy noncompliance. Future Cardiol. 2023 Jun 14. doi: 10.2217/fca-2023-0011. | ||||
| 410 | In vitro metabolism of quazepam in human liver and intestine and assessment of drug interactions. Xenobiotica. 2004 Nov-Dec;34(11-12):1001-11. | ||||
| 411 | CYP450 phenotyping and metabolite identification of quinine by accurate mass UPLC-MS analysis: a possible metabolic link to blackwater fever | ||||
| 412 | Netupitant PET imaging and ADME studies in humans | ||||
| 413 | Biotransformation of moclobemide in humans | ||||
| 414 | Simultaneous quantification of rosiglitazone and its two major metabolites, N-desmethyl and p-hydroxy rosiglitazone in human plasma by liquid chromatography/tandem mass spectrometry: application to a pharmacokinetic study | ||||
| 415 | Metabolism, excretion, and pharmacokinetics of [14C]INCB018424, a selective Janus tyrosine kinase 1/2 inhibitor, in humans Drug Metab Dispos. 2010 Nov;38(11):2023-31. doi: 10.1124/dmd.110.033787. | ||||
| 416 | The effect of CYP3A4 inhibition or induction on the pharmacokinetics and pharmacodynamics of orally administered ruxolitinib (INCB018424 phosphate) in healthy volunteers | ||||
| 417 | Pharmacogenetic Testing and Therapeutic Drug Monitoring Of Sertraline at a Residential Treatment Center for Children and Adolescents: A Pilot Study. Innov Pharm. 2022 Dec 26;13(4):10.24926/iip.v13i4.5035. doi: 10.24926/iip.v13i4.5035. | ||||
| 418 | Sertraline. 2022 May 15. Drugs and Lactation Database (LactMed?) [Internet]. Bethesda (MD): National Institute of Child Health and Human Development; 2006C. | ||||
| 419 | Neonicotinoids and pharmaceuticals in hair of the Red fox (Vulpes vulpes) from the Cavallino-Treporti peninsula, Italy. Environ Res. 2023 Jul 1;228:115837. doi: 10.1016/j.envres.2023.115837. | ||||
| 420 | In vitro biotransformation of sildenafil (Viagra): identification of human cytochromes and potential drug interactions. Drug Metab Dispos. 2000 Apr;28(4):392-7. | ||||
| 421 | Contribution of CYP3A isoforms to dealkylation of PDE5 inhibitors: a comparison between sildenafil N-demethylation and tadalafil demethylenation. Biol Pharm Bull. 2015;38(1):58-65. | ||||
| 422 | The contributions of cytochromes P450 3A4 and 3A5 to the metabolism of the phosphodiesterase type 5 inhibitors sildenafil, udenafil, and vardenafil. Drug Metab Dispos. 2008 Jun;36(6):986-90. | ||||
| 423 | Pharmacokinetics of sildenafil after single oral doses in healthy male subjects: absolute bioavailability, food effects and dose proportionality. Br J Clin Pharmacol. 2002;53 Suppl 1(Suppl 1):5S-12S. doi: 10.1046/j.0306-5251.2001.00027.x. | ||||
| 424 | Erectile dysfunction drugs changed the protein expressions and activities of drug-metabolising enzymes in the liver of male rats. Oxid Med Cell Longev. 2016;2016:4970906. | ||||
| 425 | Identification of cytochrome P450 and arylamine N-acetyltransferase isoforms involved in sulfadiazine metabolism. Drug Metab Dispos. 2005 Jul;33(7):969-76. | ||||
| 426 | The effect of cimetidine on the formation of sulfamethoxazole hydroxylamine in patients with human immunodeficiency virus. J Clin Pharmacol. 1998 May;38(5):463-6. | ||||
| 427 | Metabolism of tamoxifen by recombinant human cytochrome P450 enzymes: formation of the 4-hydroxy, 4'-hydroxy and N-desmethyl metabolites and isomerization of trans-4-hydroxytamoxifen. Drug Metab Dispos. 2002 Aug;30(8):869-74. | ||||
| 428 | Endoxifen and other metabolites of tamoxifen inhibit human hydroxysteroid sulfotransferase 2A1 (hSULT2A1). Drug Metab Dispos. 2014 Nov;42(11):1843-50. | ||||
| 429 | Metabolism and transport of tamoxifen in relation to its effectiveness: new perspectives on an ongoing controversy. Future Oncol. 2014 Jan;10(1):107-22. | ||||
| 430 | Identification and biological activity of tamoxifen metabolites in human serum Biochem Pharmacol. 1983 Jul 1;32(13):2045-52. doi: 10.1016/0006-2952(83)90425-2. | ||||
| 431 | PharmGKB summary: tamoxifen pathway, pharmacokinetics Pharmacogenet Genomics. 2013 Nov;23(11):643-7. doi: 10.1097/FPC.0b013e3283656bc1. | ||||
| 432 | LABEL:UCYNTA- tapentadol hydrochloride tablet, film coated | ||||
| 433 | Clinical assessment of drug-drug interactions of tasimelteon, a novel dual melatonin receptor agonist. J Clin Pharmacol. 2015 Sep;55(9):1004-11. | ||||
| 434 | Pharmacokinetics and metabolism of temazepam in man and several animal species Br J Clin Pharmacol. 1979;8(1):23S-29S. doi: 10.1111/j.1365-2125.1979.tb00451.x. | ||||
| 435 | Sigmoidal kinetic model for two co-operative substrate-binding sites in a cytochrome P450 3A4 active site: an example of the metabolism of diazepam and its derivatives. Biochem J. 1999 Jun 15;340 ( Pt 3):845-53. | ||||
| 436 | Human liver microsomal diazepam metabolism using cDNA-expressed cytochrome P450s: role of CYP2B6, 2C19 and the 3A subfamily. Xenobiotica. 1996 Nov;26(11):1155-66. | ||||
| 437 | The detection of piroxicam, tenoxicam and their metabolites in equine urine by electrospray ionisation ion trap mass spectrometry | ||||
| 438 | Clinical pharmacokinetics of tenoxicam | ||||
| 439 | Metabolism of tenoxicam in rats | ||||
| 440 | Multiple cytochrome P-450s involved in the metabolism of terbinafine suggest a limited potential for drug-drug interactions. Drug Metab Dispos. 1999 Sep;27(9):1029-38. | ||||
| 441 | A multi-residue chiral liquid chromatography coupled with tandem mass spectrometry method for analysis of antifungal agents and their metabolites in aqueous environmental matrices. Anal Methods. 2021 Jun 14;13(22):2466-2477. doi: 10.1039/d1ay00556a. | ||||
| 442 | Don't stay home without it | ||||
| 443 | Hydroxylation and formation of electrophilic metabolites of tienilic acid and its isomer by human liver microsomes. Catalysis by a cytochrome P450 IIC different from that responsible for mephenytoin hydroxylation | ||||
| 444 | Human-liver cytochromes P-450 expressed in yeast as tools for reactive-metabolite formation studies. Oxidative activation of tienilic acid by cytochromes P-450 2C9 and 2C10 | ||||
| 445 | Metabolism of ophthalmic timolol: new aspects of an old drug. Basic Clin Pharmacol Toxicol. 2011 May;108(5):297-303. | ||||
| 446 | Simultaneous determination of torasemide and its major metabolite M5 in human urine by high-performance liquid chromatography-electrochemical detection | ||||
| 447 | Simultaneous determination of tranilast and metabolites in plasma and urine using high-performance liquid chromatography | ||||
| 448 | Identification of human cytochrome P450s involved in the formation of all-trans-retinoic acid principal metabolites. Mol Pharmacol. 2000 Dec;58(6):1341-8. | ||||
| 449 | Retinoic acid metabolism and mechanism of action: a review | ||||
| 450 | LABEL:KLIEF- trifarotene cream | ||||
| 451 | Trimethadione metabolism by human liver cytochrome P450: evidence for the involvement of CYP2E1. Xenobiotica. 1998 Nov;28(11):1041-7. | ||||
| 452 | Optimization via experimental design of an SPE-HPLC-UV-fluorescence method for the determination of valsartan and its metabolite in human plasma samples J Sep Sci. 2006 Oct;29(15):2265-83. doi: 10.1002/jssc.200600093. | ||||
| 453 | Effects of valsartan and valeryl 4-hydroxy valsartan on human platelets: a possible additional mechanism for clinical benefits J Cardiovasc Pharmacol. 2004 May;43(5):677-84. doi: 10.1097/00005344-200405000-00010. | ||||
| 454 | Identification of cytochrome P450 forms involved in the 4-hydroxylation of valsartan, a potent and specific angiotensin II receptor antagonist, in human liver microsomes Xenobiotica. 2005 Jun;35(6):589-602. doi: 10.1080/00498250500158175. | ||||
| 455 | Venlafaxine oxidation in vitro is catalysed by CYP2D6. Br J Clin Pharmacol. 1996 Feb;41(2):149-56. | ||||
| 456 | Comparison of the pharmacokinetics of venlafaxine extended release and desvenlafaxine in extensive and poor cytochrome P450 2D6 metabolizers | ||||
| 457 | A single dose mass balance study of the Hedgehog pathway inhibitor vismodegib (GDC-0449) in humans using accelerator mass spectrometry | ||||
| 458 | Absorption, distribution, metabolism, and excretion of [1?C]GDC-0449 (vismodegib), an orally active hedgehog pathway inhibitor, in rats and dogs: a unique metabolic pathway via pyridine ring opening | ||||
| 459 | Preclinical assessment of the absorption, distribution, metabolism and excretion of GDC-0449 (2-chloro-N-(4-chloro-3-(pyridin-2-yl)phenyl)-4-(methylsulfonyl)benzamide), an orally bioavailable systemic Hedgehog signalling pathway inhibitor | ||||
| 460 | Vonoprazan fumarate, a novel potassium-competitive acid blocker, in the management of gastroesophageal reflux disease: safety and clinical evidence to date | ||||
| 461 | The disposition of voriconazole in mouse, rat, rabbit, guinea pig, dog, and human | ||||
| 462 | Roles of CYP3A4 and CYP2C19 in methyl hydroxylated and N-oxidized metabolite formation from voriconazole, a new anti-fungal agent, in human liver microsomes. Biochem Pharmacol. 2007 Jun 15;73(12):2020-6. | ||||
| 463 | Vortioxetine: clinical pharmacokinetics and drug interactions. Clin Pharmacokinet. 2018 Jun;57(6):673-686. | ||||
| 464 | FDA Approved Drug Products:Oxbryta (voxelotor) tablets | ||||
| 465 | Metabolism and excretion of zafirlukast in dogs, rats, and mice | ||||
| 466 | Metabolism and pharmacokinetics of the combination Zidovudine plus Lamivudine in the adult Erythrocebus patas monkey determined by liquid chromatography-tandem mass spectrometric analysis | ||||
| 467 | Zolpidem urine excretion profiles and cross-reactivity with ELISA(?) kits in subjects using Zolpidem or Ambien(?) CR as a prescription sleep aid | ||||
| 468 | Distribution of zopiclone and main metabolites in hair following a single dose | ||||
If you find any error in data or bug in web service, please kindly report it to Dr. Yin and Dr. Li.

